


Abstract
Electronic nose platforms based on metal-oxide (MOX) sensors offer potential for low-power gas classification under dynamic operating conditions. This study evaluates a BME688-based digital nose configured with a temperature-modulated heater profile (HP-354) and reduced duty cycle (RDC-5-10) for binary ethylene presence classification in fruit headspace. Seven climacteric fruit types were sealed in bags to allow natural ethylene accumulation and were sampled across multiple sessions over a two-week period. A structured alternating protocol between fruit headspace (Class A) and neutral air (Class B) generated 21 ethylene sessions and 23 neutral-air sessions, comprising 38,882 individual thermal scan cycles (~10 s per cycle). Each full heater cycle was treated as a training instance within BME AI-Studio. A supervised neural-network classifier trained on 70% of cycle-level data achieved 92.9% overall accuracy with a macro F1 score of 91.9% on validation data. Results demonstrate that temperature-modulated MOX signatures enable robust discrimination of biologically generated ethylene from baseline air under realistic headspace variability. This study demonstrated classification feasibility under naturally accumulated fruit emissions while highlighting the need for future concentration-resolved calibration studies.
1. Introduction
Gas classification is fundamental to environmental sensing, precision agriculture, and soil–plant monitoring. Reliable differentiation between target gases and background air is a foundational requirement before deploying sensors in more complex conditions, as gas detection in different environmental contexts remains challenging due to low concentrations, mixed backgrounds, and sensor limitations [1]. Continuous in situ sensing of nutrient-related fluxes requires platforms capable of capturing subtle variations in gas composition, often under changing temperature, humidity, and chemical conditions [2]. Establishing these capabilities under controlled conditions is the first step toward validating sensors for field use.
The alkene ethylene was selected as the validation gas for this proof-of-concept study due to its ubiquity, stable emission behaviour, and well-established physiological role in plant systems. Ethylene is a gaseous phytohormone that regulates multiple aspects of plant growth, development, and environmental response, including fruit ripening and root elongation, with its production and emission dynamics extensively characterised in plant studies [3,4]. It is also one of the most studied climacteric fruit gases, with predictable release curves during ripening [5].
Digital nose sensing platforms, particularly those built around MOX sensor arrays, offer substantial potential for gas classification. The BOSCH BME688 employs a MOX active layer whose resistance changes according to gas–surface interactions that when coupled with multi-temperature heating cycles produce rich and time-dependent chemical signatures [6]. When analysed using machine-learning models, these electronic fingerprints enable accurate discrimination between chemically similar gases [7]. This study therefore focused on validating whether such a platform can reliably distinguish ethylene presence from neutral air using cycle-resolved thermal signatures.
While the BME688 platform is commercially available, a systematic evaluation of the sensor under biologically generated emissions, such as ethylene, has not been extensively documented. Most published MOX studies either employ static resistance measurements or calibrated gas mixtures under controlled laboratory conditions [8,9,10,11,12,13,14].
The objective of this study was to evaluate a BME688-based digital nose platform configured with a temperature-modulated heater profile for cycle-level ethylene presence classification. The study assessed (i) sensor performance during controlled monitoring cycles, (ii) dataset quality and labelling integrity, and (iii) predictive performance of a supervised neural-network classifier for ethylene trained on full thermal scan cycles against neutral air. The work focused on establishing feasibility for binary ethylene discrimination under biologically generated headspace variability rather than concentration-resolved quantification.
2. Materials and Methods
2.1. Fruit Samples
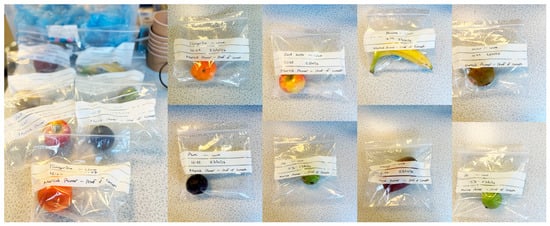
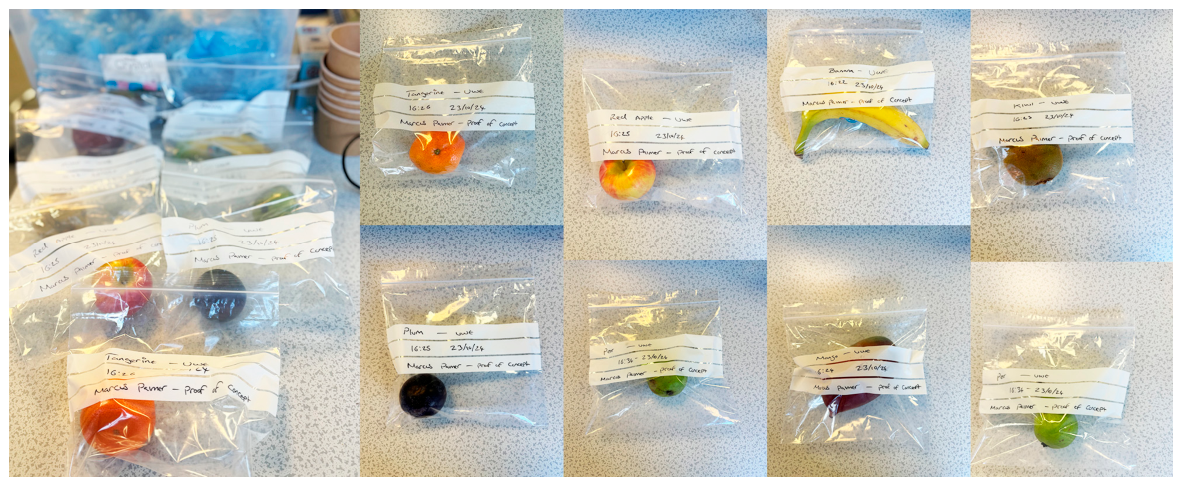
Seven climacteric fruits (kiwi, banana, red gala apple, mango, pear, clementine tangerine, and plum) were used as biological ethylene sources. Individual fruits were sealed in labelled polyethylene bags (headspace volume 1–1.5 L) for 24 h prior to measurement to enrich ethylene concentration, as shown in Figure 1. During all measurement sessions, fruit specimens were maintained at ambient laboratory conditions (21–23 °C) to minimise variability in ethylene emission rates unrelated to ripening state.
Figure 1.
Fruit specimens sealed in labelled polyethylene headspace bags prior to structured monitoring sessions. Individual fruit specimens (kiwi, banana, red gala apple, mango, pear, clementine tangerine, and plum) were enclosed in sealed polyethylene bags (1–1.5 L headspace volume) for 24 h under ambient laboratory conditions to allow natural ethylene accumulation.
Specimen Structure and Temporal Sampling
One physical specimen per fruit type/cultivar was used in order to limit experimental variables and focus on sensor response behaviour. Measurements were conducted between 11 October and 28 October 2024. Due to time constraints, not all fruit types were measured on every day; instead, subsets were sampled according to availability and session duration. The same fruit specimens were re-measured across multiple sessions during the natural ripening period. The study did not attempt to quantify ripening stage or temporal emission dynamics, but rather to evaluate classification feasibility under biologically generated headspace variability. Thus, replication in this study is primarily temporal rather than population-based. Each AI-Studio session entry corresponds to the specific fruit measured at the recorded timestamp.
2.2. Gas Sensor
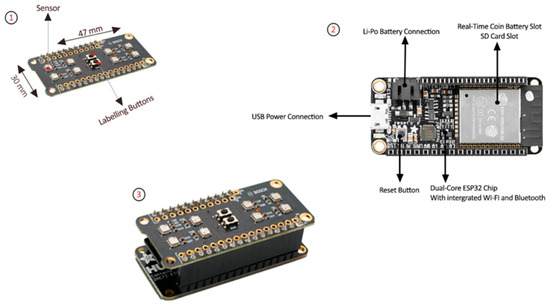
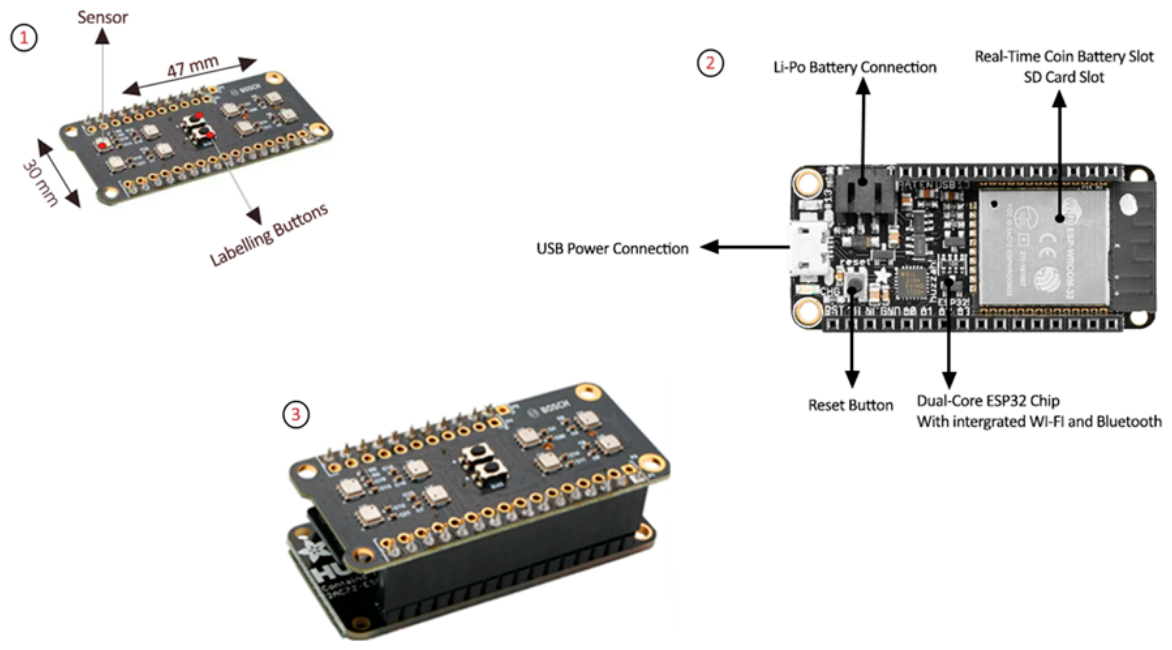
A Bosch BME688 Evaluation Kit (BBME-EDK; Bosch Ltd., Gerlingen, Germany) comprising eight metal-oxide (MOX) gas sensors was used for all experiments (Figure 2). The BME688 sensor was configured using a temperature-modulated heater profile (HP-354) within Bosch BME AI-Studio (version 3.0.2, Bosch Sensortec GmbH, Germany)
Figure 2.
The BOSCH BME688 sensor board and HUZZAH32 feather board. Components of sensor platform with ① BOSCH BME688 sensor board containing eight metal-oxide (MOX) gas-sensing elements and an onboard labelling button; ② Adafruit HUZZAH32 (ESP32) microcontroller (Adafruit Industries LLC, New York, NY, USA) with integrated Wi-Fi and Bluetooth, Li-Po battery interface, SD-card slot and real-time clock support; ③ BME688 Evaluation and Development Kit (BBME-EDK) baseboard used to mount and interface the sensor module during monitoring sessions.
This heater profile performs a multistep temperature sequence spanning approximately 100 °C to 320 °C over ~10 s per complete cycle. Each full heater profile execution constitutes a single thermal scan cycle. Under the selected reduced duty cycle (RDC-5-10) configuration, five active scan cycles were followed by ten sleep cycles to reduce power consumption while preserving dynamic response resolution.
Each complete thermal scan cycle (~10 s duration) was treated as an independent training instance within the machine-learning workflow (as depicted in Figure 3). To balance power consumption and temporal resolution, a reduced duty cycle (RDC) was implemented, consisting of five active scanning cycles followed by ten sleep cycles (Figure 3). This configuration was selected based on pilot testing and was maintained across all experiments to ensure consistency.
Figure 3.
Reduced duty cycle. Illustration of reduced duty cycle used by sensor platform comprising five active scanning cycles followed by ten sleep cycles.
A 24 h neutral-air baseline was conducted prior to structured data collection to establish sensor equilibrium, examine potential diurnal variation in baseline resistance, and evaluate sensor behaviour during prolonged continuous operation.
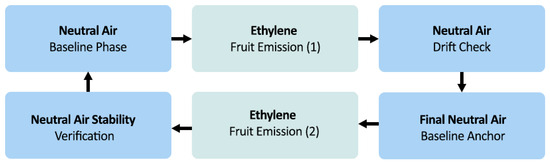
Data were collected using a cyclic exposure protocol alternating between fruit-derived ethylene (Class A) and neutral air (Class B) (Figure 4), following established electronic nose validation practices for MOX sensors that employ repeated baseline returns to control hysteresis and sensor drift [8,9,10]. Each Class A session was followed by a Class B phase to enable baseline anchoring, hysteresis control, and drift detection. Sensor–specimen distance was maintained between 3 and 5 cm inside the sealed headspace. Monitoring sessions ranged from 25 to 1529 min. Supplementary neutral-air data were collected outdoors to increase baseline diversity.
Figure 4.
Illustration of cyclic monitoring sequence used during headspace experiments. The monitoring protocol alternated between neutral air (Class B) and ethylene (Class A) exposures across repeated cycles. Ethylene exposure steps (1) and (2) represent sequential fruit emission sampling phases within a single monitoring cycle. Neutral-air phases served as baseline anchors, drift-detection windows, and hysteresis-control points, while Class A phases provided controlled fruit-emission environments for classifier training. This cyclic structure ensured balanced dataset representation and stable sensor calibration throughout the experimental monitoring period.
Across 44 sessions (21 Class A, 23 Class B), a total of approximately 38,882 thermal scan cycles were recorded. Each cycle corresponded to a complete ~10 s heater profile execution and was treated as an independent labelled training instance. Individual sessions contained between 380 and 13,202 cycles depending on session duration. At ~10 s per cycle, this corresponds to tens of thousands of thermal response profiles used for training and validation.
2.3. Data Analysis
To enable comparison of sensor responses across exposure cycles and specimen types, measured resistance signals were normalised using the relative change in resistance with respect to a neutral-air baseline. For each measurement cycle, the normalised resistance change was calculated as:
where R is the instantaneous sensor resistance and R0 is the baseline resistance measured under neutral-air conditions at the start of the cycle at the corresponding heater temperature step. This form of normalisation is widely adopted in metal-oxide gas sensing to reduce baseline variability and enable direct comparison of sensor responses across measurement cycles and specimens, particularly under dynamic or temperature-modulated operation [11,12].
To characterise temporal response behaviour across the temperature-modulated duty cycle, the median normalised response at each cycle step k was computed as:
where is the median across all measurements within the relevant group (e.g., Class A/Class B or fruit category) at cycle step k. Median aggregation was selected as a robust summary statistic to reduce sensitivity to transient outliers and session-to-session variability commonly observed in dynamic gas-exposure experiments and long-term MOX sensor operation [9,13].
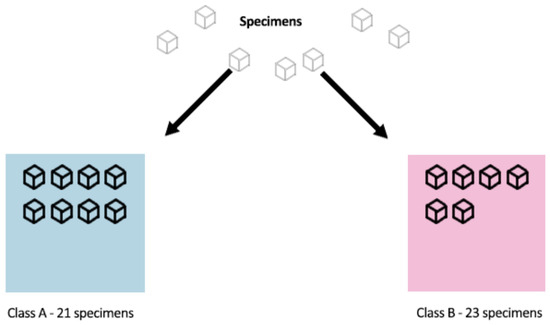
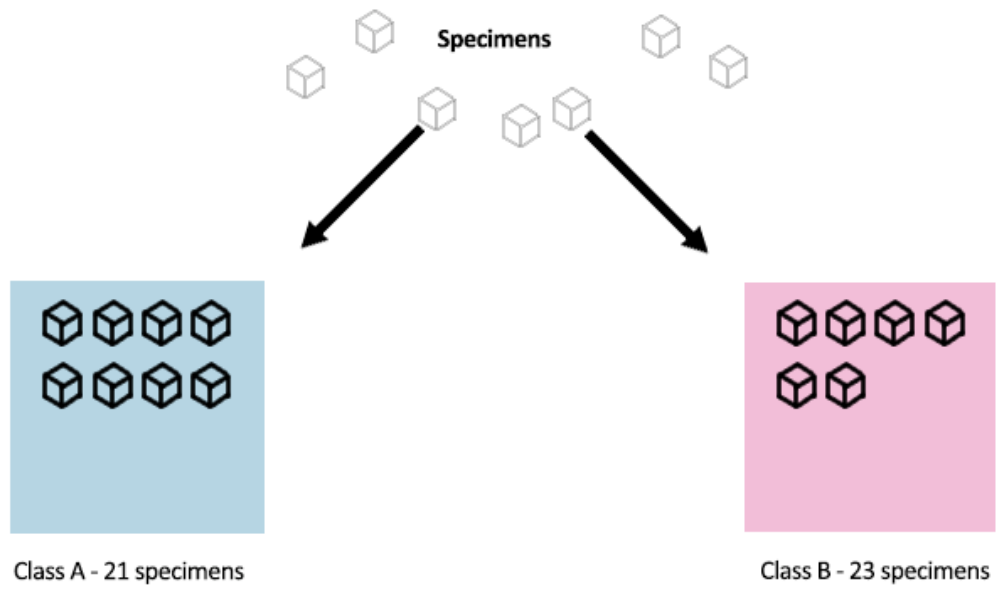
Sensor resistance data were subsequently labelled according to exposure class and structured into a supervised learning dataset, comprising 21 ethylene (Class A) and 23 neutral-air (Class B) sessions (Figure 5).
Figure 5.
Composition of the supervised classification dataset. The dataset comprised 44 structured monitoring sessions, including 21 ethylene exposure sessions (Class A) and 23 neutral-air sessions (Class B). Each session contained multiple full heater-profile cycles (~10 s per cycle), with each cycle treated as an independent labelled training instance within the supervised learning framework. The balanced alternation between exposure classes ensured robust model training and validation across biologically variable headspace conditions.
Following physical normalisation using ΔR/R0, resistance curves were further normalised using min–max scaling within each session to standardise feature ranges for neural-network training. No interpolation or smoothing was applied. A supervised neural-network classifier implemented in BME AI-Studio was trained using 70% of the dataset, with 30% reserved for validation. The 70/30 split was performed at the cycle level while preserving class balance between Class A and Class B samples. This training strategy and evaluation framework are consistent with established electronic nose classification studies employing supervised learning for gas discrimination [6,14,15]. Feature extraction included multi-phase temperature signatures and time-domain descriptors derived from resistance dynamics. Model training was conducted over 240 epochs, selected empirically to ensure convergence of training and validation loss without overfitting, as confirmed by loss-stabilisation behaviour. Model performance was evaluated using overall classification accuracy, macro F1 score, macro false-positive rate, and confusion-matrix analysis, which are standard metrics for binary gas-classification tasks in electronic nose systems [6,14].
3. Results
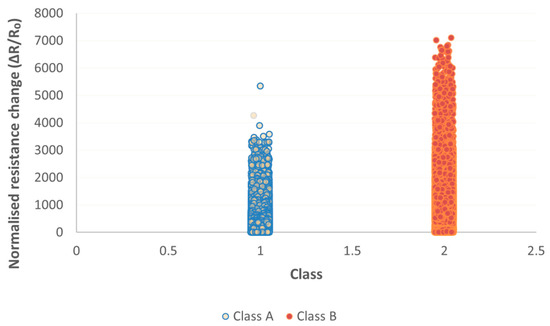
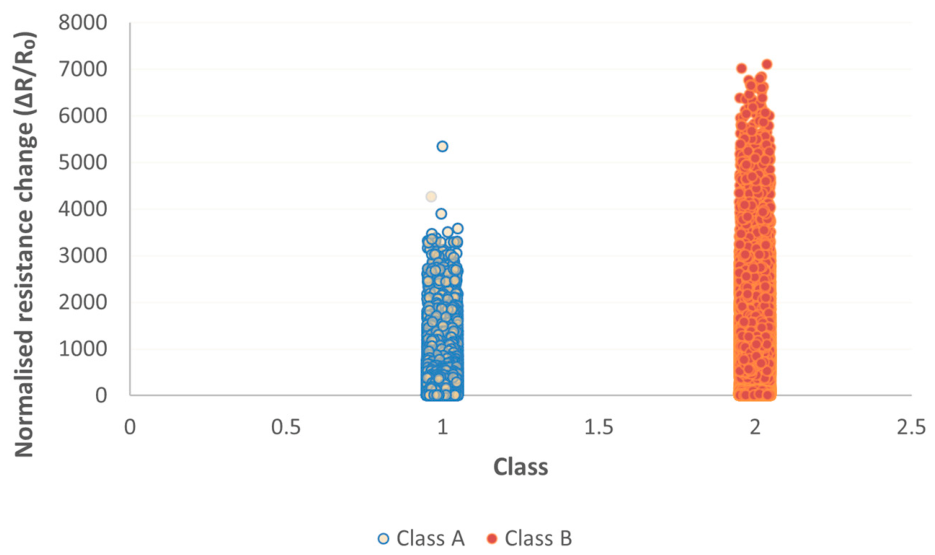
Across the studied fruits, raw gas sensor profiles showed distinct waveform signatures for Class A compared with Class B cycles (Figure 6). Class A sessions demonstrated sharper resistance fluctuations during mid- and high-temperature phases, consistent with altered gas–surface interaction behaviour at elevated heater temperatures. In contrast, Class B profiles exhibited flatter, more uniform resistance behaviour with minimal phase differentiation. These differences in waveform geometry are reflected in the distribution of normalised resistance responses, where Class A and Class B measurements exhibit distinct clustering and variance characteristics (Figure 6). This separation in response magnitude and dispersion underpins the classifier’s ability to distinguish between Classes A and B.
Figure 6.
Distribution of normalised resistance change (ΔR/R0) measurements for ethylene exposure (Class A) and neutral air (Class B). Each point represents an individual heater-profile cycle following normalisation relative to the neutral-air baseline. The distributions illustrate separation in response magnitude and dispersion between Class A and Class B measurements across all monitored sessions. Differences in clustering reflect underlying variation in temperature-modulated resistance dynamics between exposure conditions.
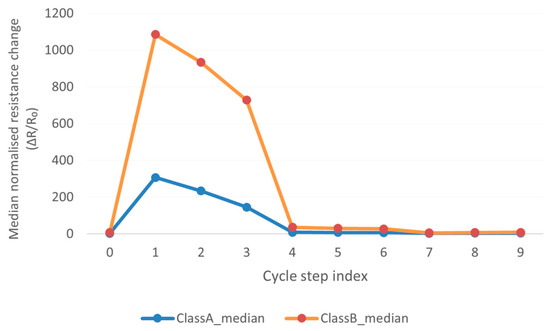
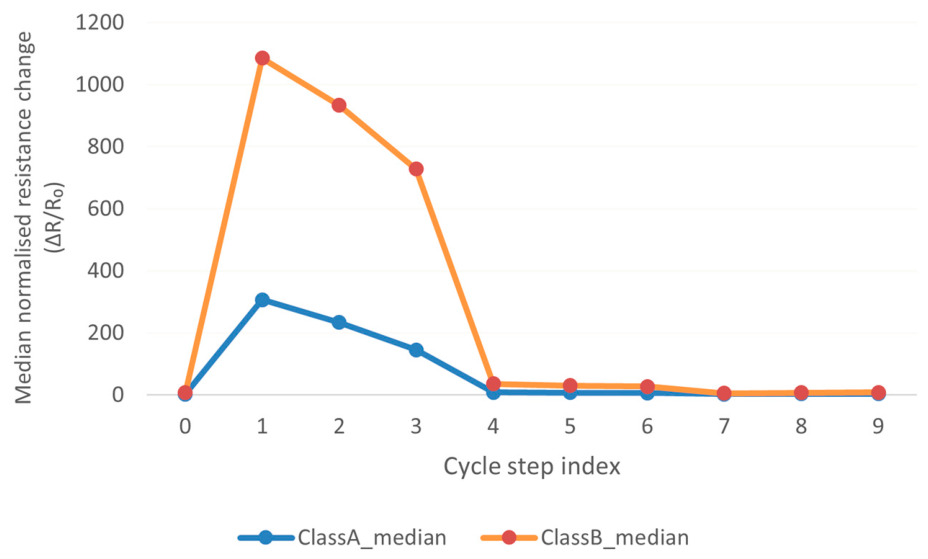
Extended monitoring sessions (e.g., red gala apple, kiwi) provided longer-duration Class A datasets, while supplementary Class B sampling under outdoor conditions broadened baseline variability, strengthening algorithm robustness. To examine temporal response behaviour across the reduced duty cycle, the median normalised resistance change (ΔR/R0) was calculated at each cycle step for ethylene (Class A) and neutral air (Class B) (Figure 7).
Figure 7.
Median normalised resistance change (ΔR/R0) across heater-profile cycle steps for ethylene (Class A) and neutral air (Class B). Median ΔR/R0 values are shown as a function of cycle step index, representing aggregated temperature-modulated response behaviour across sessions. Divergence between classes during early cycle steps indicates differential gas–sensor interaction dynamics, with partial convergence observed during later recovery phases.
As shown in Figure 7, Class A exhibited a stronger negative ΔR/R0 response during early exposure steps compared with Class B, with responses converging during later recovery stages.
Model Classification Performance
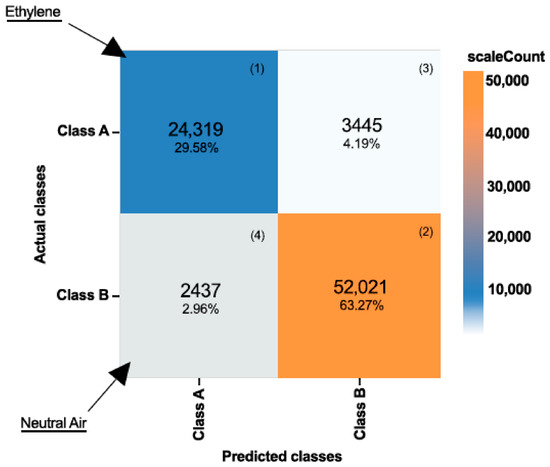
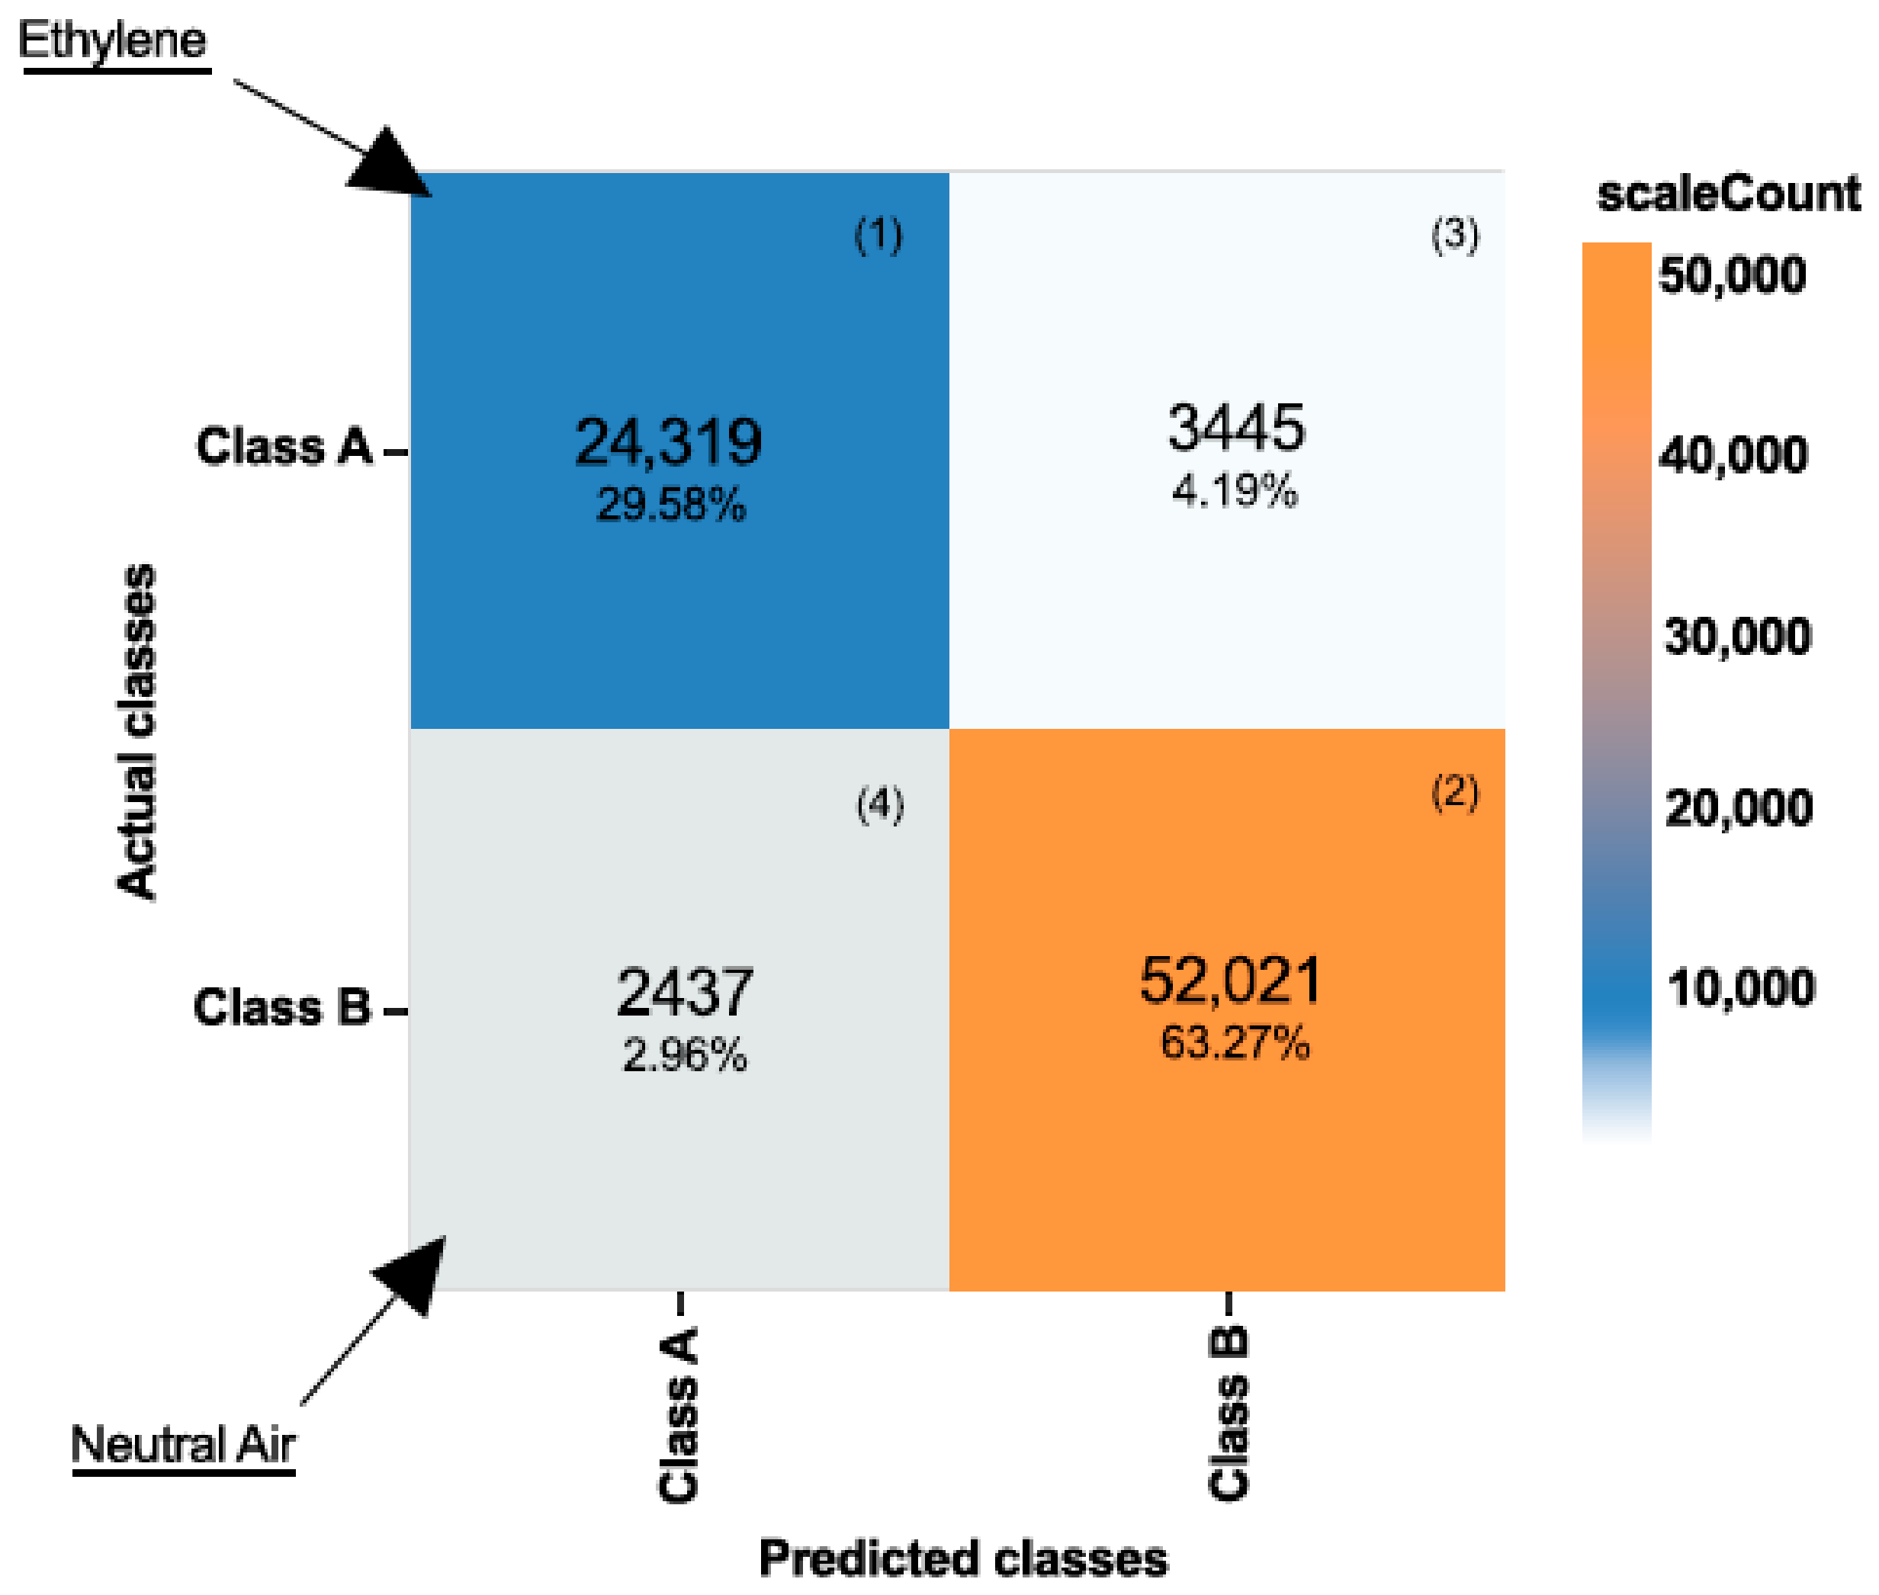
The overall classification accuracy across the fruits studied was 92.9%. The macro-averaged F1 score was 91.9%, with a macro-false positive rate of 7.7%. The confusion matrix (Figure 8) showed balanced classifier behaviour, with strong true-positive and true-negative rates across all fruits. Correct Class A predictions accounted for 29.6% of observations, while correct Class B predictions accounted for 63.3%, reflecting the class composition of the dataset.
Figure 8.
Confusion matrix for binary classification of ethylene (Class A) and neutral air (Class B). Values represent classification counts and percentages for each outcome. Cells (1)–(4) correspond to true positive (Class A correctly identified), true negative (Class B correctly identified), false positive (Class B misclassified as Class A), and false negative (Class A misclassified as Class B), respectively.
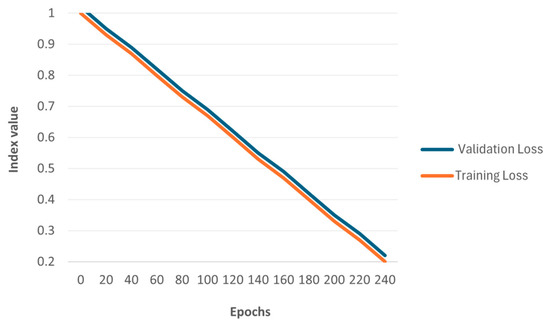
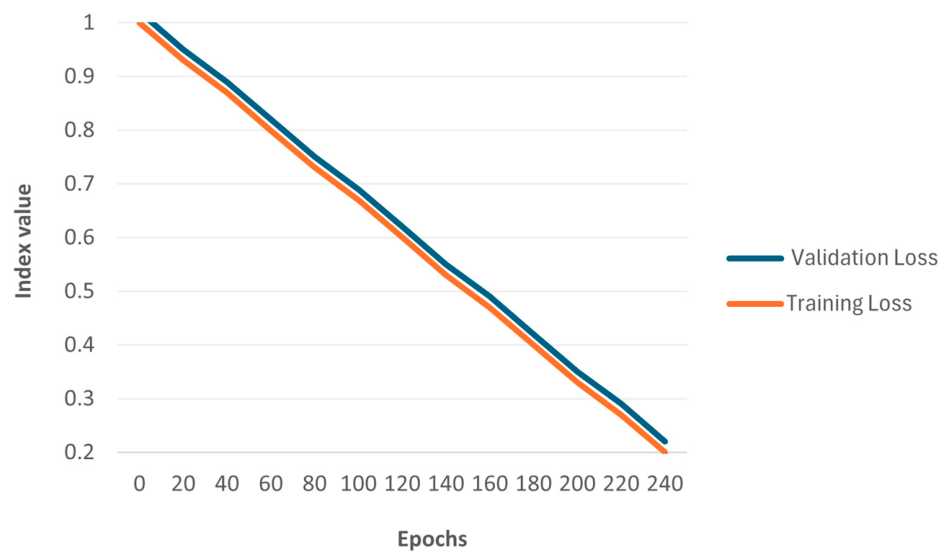
Training and validation losses decreased steadily throughout training and remained closely aligned, with no divergence observed, indicating stable learning behaviour and good generalisation. While losses do not plateau by 100 epochs, the continued downward trend suggests ongoing convergence of the learning process (Figure 9).
Figure 9.
Training and validation loss curves across 240 training epochs. Loss values for both the training and validation datasets decreased steadily and remained closely aligned throughout optimisation, indicating stable learning behaviour and absence of pronounced overfitting. The continued downward trend across epochs suggests effective convergence of the neural-network model under the selected training configuration.
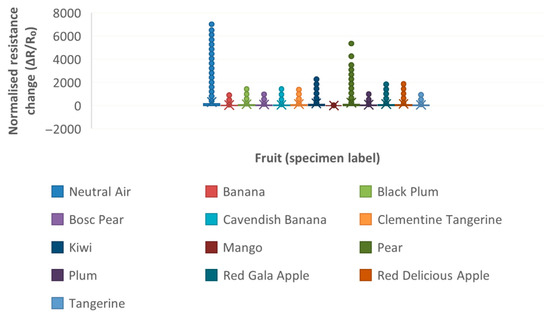
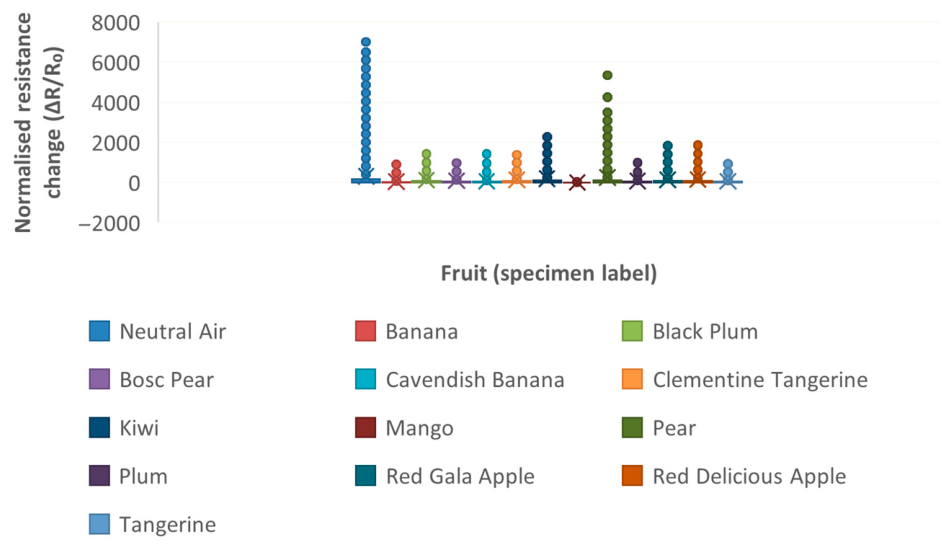
To characterise fruit-specific response distributions, ΔR/R0 values were grouped by specimen label and visualised as distributions (Figure 10). For example, climacteric fruits such as pear and red gala apple exhibited a wider spread of ΔR/R0 values, indicating greater temporal variability in sensor response under ethylene exposure, whereas fruits such as mango showed a comparatively narrower response range under the same exposure protocol. This heterogeneity motivated the use of robust summary statistics in subsequent analyses.
Figure 10.
Distribution of normalised resistance change (ΔR/R0) by fruit specimen. The distributions capture both within-fruit variability and between-fruit differences in response magnitude under ethylene exposure. Coloured crosses indicate the mean response value for each fruit class. Neutral-air measurements are included as a reference condition.
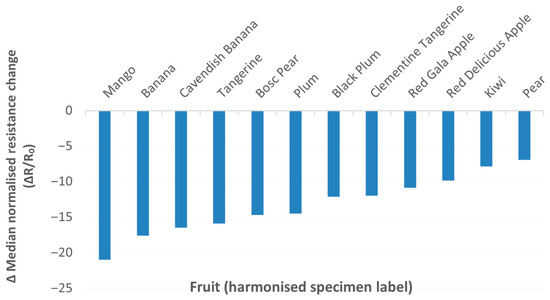
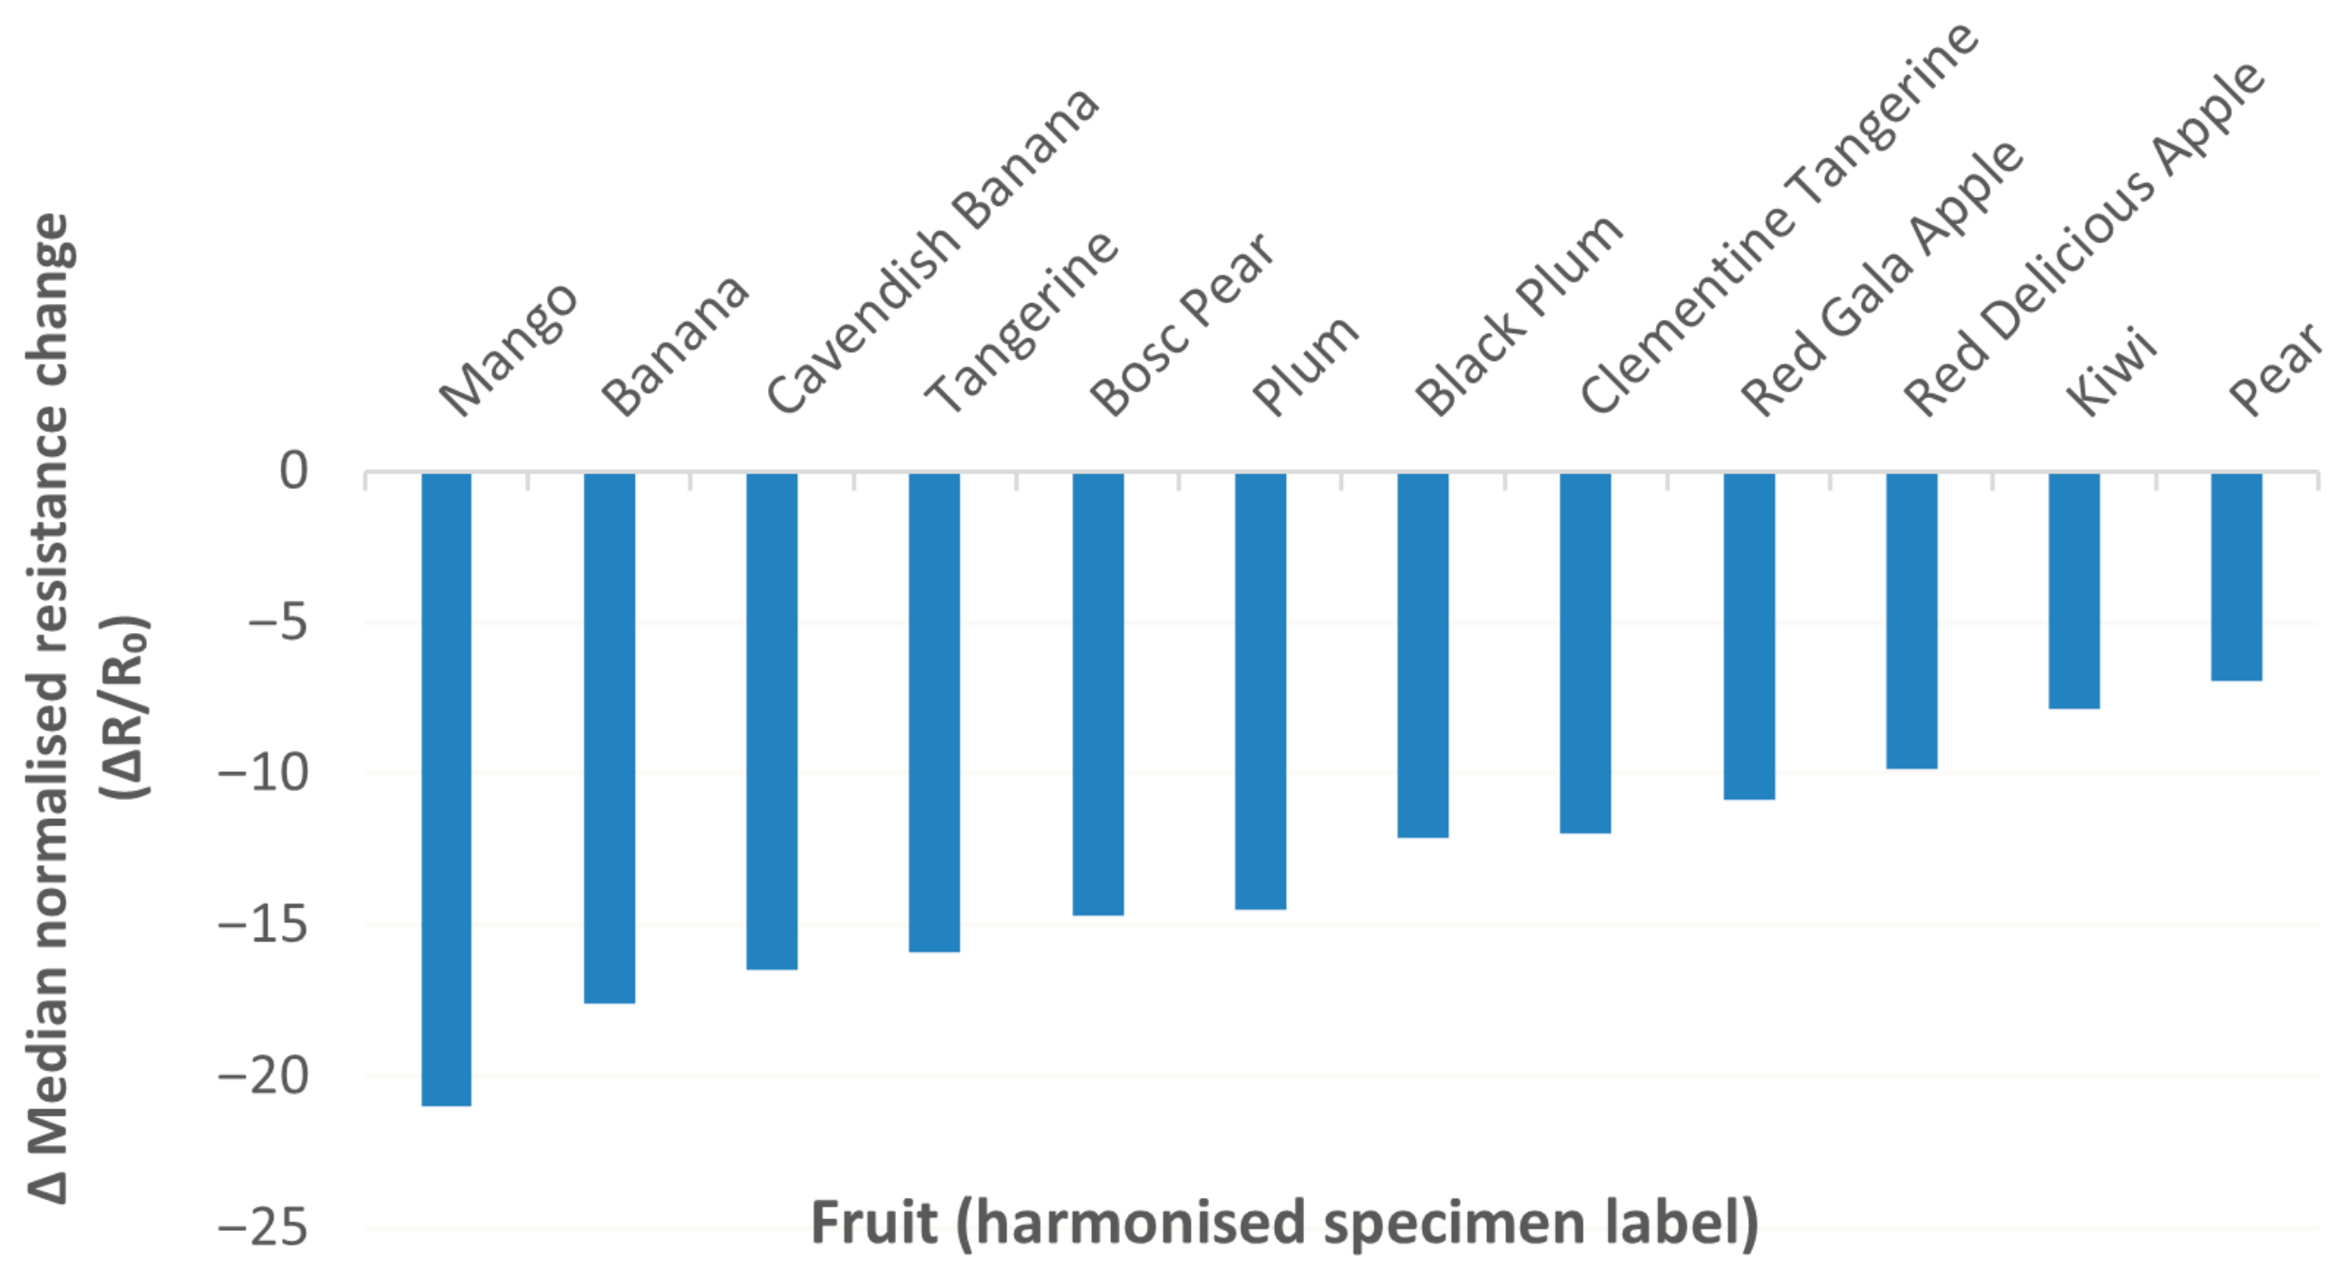
As illustrated in Figure 10, fruit specimens differed not only in median response magnitude but also in response dispersion. For example, pear and red gala apple exhibited both larger median ΔR/R0 shifts and broader distributions, indicating larger relative deviations from the neutral-air baseline, whereas mango showed smaller median shifts and a comparatively narrow response range, reflecting reduced signal deviation from the neutral-air baseline under the same exposure protocol (Figure 11).
Figure 11.
Ranked median ΔR/R0 shift relative to the neutral-air baseline for each fruit specimen. More negative values indicate larger relative deviation from the neutral-air baseline under the same exposure protocol.
Figure 11 highlights a clear ordering of fruit responses, with specimens exhibiting varying magnitudes of deviation from the neutral-air baseline under the same protocol. Red gala apple showed one of the larger median shifts, whereas mango exhibited smaller median deviations. Intermediate responses were observed for pear, banana, and other apple cultivars, reflecting gradations in sensor response magnitude across specimens.
4. Discussion
This study demonstrated that a BME688-based digital nose platform can reliably discriminate ethylene (Class A) from a neutral-air baseline (Class B) under controlled headspace conditions, achieving high classification performance across the studied fruits (macro F1 score = 91.9%). This level of accuracy is comparable to, and in some cases exceeds, that reported in prior metal-oxide (MOX) electronic nose studies targeting volatile organic compounds and plant-related gases under laboratory conditions, where classification accuracies typically range between 80% and 95%, depending on sensor configuration, gas complexity, and modelling approach [8,9,10].
While fruit-associated variability in response magnitude and dispersion was observed, this study does not quantify ethylene concentration nor directly assess ripening stage. These findings demonstrate that temperature-modulated MOX signatures enable reliable discrimination of ethylene from background air under controlled headspace conditions. Future studies incorporating calibrated gas mixtures and multiple biological replicates are required to establish quantitative monitoring performance.
The achieved classification accuracy (92.9%, macro F1 = 91.95%) aligns with performance reported for MOX-based electronic nose systems targeting single-gas discrimination under controlled conditions. Previous studies have shown that temperature-modulated MOX sensors generate highly discriminative response patterns when combined with supervised machine-learning approaches, as gas–sensor interactions are probed across multiple thermal regimes [8,14]. More recent work has further demonstrated that thermal cycling enhances feature richness and improves robustness to sensor drift, particularly in long-duration monitoring scenarios [16].
In contrast to studies employing calibrated gas mixtures or reference analysers, the present study used biologically generated ethylene without concentration standardisation. Despite this limitation, classification performance remained consistently high across fruit specimens, even in the presence of observable differences in response magnitude and dispersion. For example, pear and red gala apple exhibited larger median ΔR/R0 shifts and broader interquartile ranges, indicating stronger signal divergence from baseline under identical exposure conditions, whereas mango showed consistently lower median responses with reduced dispersion, indicating smaller relative deviations from the neutral-air baseline under the same protocol (Figure 9, Figure 10 and Figure 11). This indicates that the trained model captured a generalisable ethylene response signature rather than concentration-specific artefacts. Similar robustness has been reported in electronic nose applications for agricultural monitoring, where relative pattern recognition is prioritised over absolute gas quantification [14].
The alternating exposure protocol adopted in this study followed established practice in gas-sensor validation, where repeated returns to a clean baseline are used to stabilise sensor response, detect drift, and mitigate hysteresis effects [8,12]. Such structured sequencing is particularly important for MOX sensors, whose sensitivity and baseline resistance are known to depend on prior exposure history and environmental conditions [9,17]. This analytical framework enabled direct comparison of fruit-specific sensor responses relative to the neutral-air baseline, revealing relative differences in response magnitude across specimens, with pear and red gala apple exhibiting larger deviations and mango exhibiting smaller deviations under the same protocol.
Ethylene detection plays an important role in plant physiology and agricultural monitoring. The results presented here demonstrate that temperature-modulated MOX sensing can discriminate ethylene presence under biologically accumulated headspace conditions. However, translation to quantitative storage monitoring applications would require concentration calibration, multi-fruit replication, and extended stability testing [18]. The strong performance of the BME688-based system supports the use of multi-sensor MOX arrays operated under temperature modulation for gas-classification tasks. Redundancy across the eight sensing elements provided robustness to sensor-to-sensor variability, while minor sensitivity differences enriched the feature space available to the machine-learning model. This observation is consistent with prior findings that sensor diversity and controlled cross-sensitivity improve discrimination performance in MOX-based electronic noses [9].
Several limitations should be noted. First, single physical specimens were used for each fruit type, resulting in temporal rather than population-level biological replication. Second, ethylene concentrations were not independently quantified and no calibrated gas mixtures were employed. Third, long-duration drift under continuous ethylene exposure was not directly characterised beyond structured baseline returns. While these constraints do not affect binary classification feasibility, future studies incorporating controlled concentration calibration, multiple biological replicates, and extended stability testing would strengthen quantitative interpretation and deployment readiness. While the present findings establish binary ethylene classification feasibility, applications such as ripening-stage monitoring or storage optimisation would require concentration-resolved calibration and extended longitudinal validation.
5. Conclusions
This study demonstrated that a BME688-based digital nose platform configured with a temperature-modulated heater profile can robustly discriminate biologically generated ethylene from neutral air under structured headspace conditions. Cycle-level analysis of full thermal scan profiles enabled accurate classification despite natural variability in fruit emissions across multiple sessions. The achieved classification accuracy (92.9%, macro F1 = 91.9%) confirms that dynamic MOX signatures contain sufficient information for reliable binary ethylene presence detection. While the present study assessed feasibility under biologically accumulated emissions, future research should incorporate calibrated concentration studies and broader biological replication to evaluate quantitative performance and long-term deployment readiness.
Author Contributions
Conceptualization, M.D.P., A.P.C. and M.J.B.; methodology, M.D.P., A.P.C. and M.J.B.; software, M.D.P.; formal analysis, M.D.P.; resources, M.D.P., A.P.C. and M.J.B.; data curation, M.D.P.; writing—original draft preparation, M.D.P.; writing—review and editing, M.D.P., A.P.C. and M.J.B.; visualization, M.D.P.; supervision, M.D.P., A.P.C. and M.J.B.; project administration, M.D.P. and M.J.B.; funding acquisition, M.J.B. All authors have read and agreed to the published version of the manuscript.
Funding
This research was funded by the John Oldacre Trust at Hartpury University.
Data Availability Statement
The original contributions presented in the study are included in the article. Further information on the data will be made available from the corresponding author upon reasonable request.
Conflicts of Interest
The authors declare no conflicts of interest.
Abbreviations
The following abbreviations are used in this manuscript:
| AI-Studio | Bosch BME AI-Studio |
| BBME-EDK | Bosch BME688 Evaluation and Development Kit |
| BME688 | BME688—Bosch metal-oxide gas sensor |
| Class A | Ethylene condition/class (as defined in this study) |
| Class B | Neutral-air condition/class (as defined in this study) |
| ESP32 | Espressif ESP32 microcontroller (as used on HUZZAH32) |
| F1 score | F1 score (classification performance metric) |
| HUZZAH32 | Adafruit HUZZAH32 Feather (ESP32-based microcontroller board) |
| MOX | Metal-oxide (gas sensor/sensing layer) |
| RDC | Reduced duty cycle |
| VOC(s) | Volatile organic compound(s) |
References
- Zhang, Z.; Yi, C.; Chen, T.; Zhao, Y.; Zhang, Y.; Jin, H. Solid-State Gas Sensors with Ni-Based Sensing Materials for Highly Selective Detecting NOx. Sensors 2024, 24, 7378. [Google Scholar] [CrossRef] [Scilit] [PubMed]
- Lesecq, S.; Gougis, M.; Gouze, E.; di Matteo, A.; Alessi, E.; Di Palma, V.; di Salvo, S.; O’Riordan, A.; Shao, H.; Mouzakitis, G.; et al. SARMENTI: In-Situ Real-Time Soil Nutrients and Gaseous Emission Measurement. In 2020 7th International Conference on Energy Efficiency and Agricultural Engineering (EE&AE), Ruse, Bulgaria, 12–14 November 2020; IEEE: Piscataway, NJ, USA, 2020; pp. 1–4. [Google Scholar]
- Pandey, B.K.; Huang, G.; Bhosale, R.; Hartman, S.; Sturrock, C.J.; Jose, L.; Martin, O.C.; Karady, M.; Voesenek, L.A.C.J.; Ljung, K.; et al. Plant Roots Sense Soil Compaction through Restricted Ethylene Diffusion. Science 2021, 371, 276–280. [Google Scholar] [CrossRef] [Scilit] [PubMed]
- Wang, Y.-W.; Nambeesan, S.U. Ethylene Promotes Fruit Ripening Initiation by Downregulating Photosynthesis, Enhancing Abscisic Acid and Suppressing Jasmonic Acid in Blueberry (Vaccinium ashei). BMC Plant Biol. 2024, 24, 418. [Google Scholar] [CrossRef] [Scilit] [PubMed]
- Huang, W.; Tan, C.; Guo, H. Ethylene in Fruits: Beyond Ripening Control. Hortic. Res. 2024, 11, uhae229. [Google Scholar] [CrossRef] [Scilit] [PubMed]
- Jiang, M.; Li, N.; Li, M.; Wang, Z.; Tian, Y.; Peng, K.; Sheng, H.; Li, H.; Li, Q. E-Nose: Time–Frequency Attention Convolutional Neural Network for Gas Classification and Concentration Prediction. Sensors 2024, 24, 4126. [Google Scholar] [CrossRef] [Scilit] [PubMed]
- Kausar, R.; Zayer, F.; Viegas, J.; Dias, J. Efficient Hybrid Neuromorphic-Bayesian Model for Olfaction Sensing: Detection and Classification. In 2024 IEEE International Conference on Robotics and Automation (ICRA); IEEE: Piscataway, NJ, USA, 2024. [Google Scholar] [CrossRef] [Scilit]
- Wilson, A.D.; Baietto, M. Advances in Electronic-Nose Technologies Developed for Biomedical Applications. Sensors 2011, 11, 1105–1176. [Google Scholar] [CrossRef] [Scilit] [PubMed]
- Wörner, J.; Eimler, J.; Pein-Hackelbusch, M. Long-Term Drift Behavior in Metal Oxide Gas Sensor Arrays: A One-Year Dataset from an Electronic Nose. Sci. Data 2025, 12, 1628. [Google Scholar] [CrossRef] [Scilit] [PubMed]
- Zhou, G.; Du, B.; Zhong, J.; Chen, L.; Sun, Y.; Yue, J.; Zhang, M.; Long, Z.; Song, T.; Peng, B.; et al. Advances in Gas Detection of Pattern Recognition Algorithms for Chemiresistive Gas Sensor. Materials 2024, 17, 5190. [Google Scholar] [CrossRef] [Scilit] [PubMed]
- Barsan, N.; Koziej, D.; Weimar, U. Metal Oxide-Based Gas Sensor Research: How To? Sens. Actuators B Chem. 2007, 121, 18–35. [Google Scholar] [CrossRef] [Scilit]
- Röck, F.; Barsan, N.; Weimar, U. Electronic Nose: Current Status and Future Trends. Chem. Rev. 2008, 108, 705–725. [Google Scholar] [CrossRef] [Scilit] [PubMed]
- Vergara, A.; Vembu, S.; Ayhan, T.; Ryan, M.A.; Homer, M.L.; Huerta, R. Chemical Gas Sensor Drift Compensation Using Classifier Ensembles. Sens. Actuators B Chem. 2012, 166–167, 320–329. [Google Scholar] [CrossRef] [Scilit]
- Di Natale, C.; Davide, F.; D’Amico, A. Pattern Recognition in Gas Sensing: Well-Stated Techniques and Advances. Sens. Actuators B Chem. 1995, 23, 111–118. [Google Scholar] [CrossRef] [Scilit]
- Ijaz, U.; Ali, M.; Ahmad, I.; Hamza, S.A.; Kim, H.D. A Comprehensive Review of Electronic Nose Systems: Design, Sensors, and Future Directions. Chem. Eng. J. 2025, 524, 169482. [Google Scholar] [CrossRef] [Scilit]
- Zhang, S.; Yuan, Z.; Kong, L.; Wu, Z.; Meng, F. Drift-Like Effect Compensation for the Cyclic Temperature Operation of Semiconductor Gas Sensor. IEEE Trans. Ind. Electron. 2025, 72, 2140–2149. [Google Scholar] [CrossRef] [Scilit]
- Llobet, E.; Hines, E.L.; Gardner, J.W.; Bartlett, P.N.; Mottram, T.T. Fuzzy ARTMAP Based Electronic Nose Data Analysis. Sens. Actuators B Chem. 1999, 61, 183–190. [Google Scholar] [CrossRef] [Scilit]
- Aroutiounian, V.M. Gas and Biosensors Made from Metal Oxides Doped with Carbon Nanotubes. Phys. Sci. Biophys. J. 2021, 5, 176. [Google Scholar] [CrossRef] [Scilit]


Disclaimer/Publisher’s Note: The statements, opinions and data contained in all publications are solely those of the individual author(s) and contributor(s) and not of MDPI and/or the editor(s). MDPI and/or the editor(s) disclaim responsibility for any injury to people or property resulting from any ideas, methods, instructions or products referred to in the content. |
© 2026 by the authors. Licensee MDPI, Basel, Switzerland. This article is an open access article distributed under the terms and conditions of the Creative Commons Attribution (CC BY) license.