


Abstract
This study numerically investigates the conversion of a Heavy-Duty (HD) Spark-Ignition (SI) Compressed Natural Gas (CNG) engine to operate with hydrogen-rich syngas produced from waste plastic pyrolysis. The engine was modeled with a one-dimensional simulation tool. Fuel-specific properties were included through a tabulated Laminar Flame Speed (LFS) approach, and knock occurrence was predicted with a Tabulated Kinetic of Ignition (TKI) model. Full-load simulations revealed that direct substitution of CNG with syngas leads to abnormal combustion. With adjusted values of Spark Advance (SA) to avoid knock, syngas operation resulted in average reductions of approximately 15% in brake torque and 6% in total efficiency compared to the CNG baseline. Parametric analyses showed that Late Intake Valve Closing (LIVC) provides no benefits, whereas increasing the Compression Ratio (CR) partially recovers performance and efficiency, with knock being a limiting factor. Lastly, a complete engine map of the converted configuration was generated, reporting Brake-Specific Fuel Consumption (BSFC) and emissions. Overall, the study demonstrates that HD SI engines can be operated on hydrogen-rich syngas at the cost of moderate performance penalties. Moreover, it provides a robust modeling framework to support system-level and well-to-wheel assessments of syngas-based powertrains.
1. Introduction
The global production of plastics has increased steadily in recent decades and is expected to continue growing in the coming years [1], owing to their properties such as being lightweight, durable, and low cost. These characteristics make plastic the go-to choice in a wide range of industrial applications, particularly in the packaging sector. However, the extensive use of plastic, especially for packaging and single-use products, has placed significant pressure on existing waste management systems, resulting in a persistent and growing environmental burden.
Plastic waste can be recycled, which is the most favorable and environmentally friendly route. Nevertheless, it is estimated that only 9% of the global plastic waste is currently recycled, while approximately 22% is mismanaged or remains uncollected, leading to widespread contamination of terrestrial and aquatic environments [2]. The remaining fraction is disposed primarily through landfilling (about 50%) or energy recovery. The latter includes both the direct production of heat and electricity via incineration and the conversion of plastics into fuels through thermo-chemical processes. However, incineration poses major environmental concerns due to the production and emission of harmful substances, such as dioxins, sulfur oxides, and nitrogen oxides (NOx) [3]. Furthermore, microplastics and heavy metals can still be found in the incinerator bottom ashes, leading to environmental pollution when reused or dumped [4,5].
In this context, the conversion of plastic waste into fuels through pyrolysis has gained increasing attention in recent years as a promising strategy to enhance waste management while also creating a circular economy through the production of valuable end products [6,7]. As an example, pyrolysis was successfully applied to produce liquid hydrocarbons in the range of liquid oils [8], jet fuel, and gasoline [9]. On the other end of the spectrum, a growing number of studies explored the production of syngas from waste plastic, introducing a catalyst reactor after the pyrolysis one [10,11,12].
Syngas is a gaseous mixture primarily composed of hydrogen (H2), carbon monoxide (CO), with the additional presence of carbon dioxide (CO2), and methane (CH4) [13]. Syngas can be produced from various feedstocks and processes such as anaerobic digestion and gasification of biomass [14], via carbon capture and utilization [15], pyrolysis of waste or bio-waste [16], but mostly from fossil fuels [17]. Syngas is used in a wide variety of applications, such as the production of synthetic fuels like methanol [18,19], or gasoline and diesel through the Fischer–Tropsch process [20,21]. Additionally, syngas can be treated to obtain a stream of pure hydrogen, which is becoming one of the most promising options to replace fossil fuels as a clean energy carrier [22]. In alternative, syngas can be used directly as fuel substitute in gas turbines and Internal Combustion Engines (ICE) for power generation [23,24]. As an example, ICEs can be integrated in syngas-production plants in a typical Combined Heat and Power (CHP) application [25], mainly characterized by steady-state operating conditions. Nonetheless, syngas is expected to be gradually used also in the transportation sector, after addressing specific fueling challenges as reported by Payakani et al. in [26].
Several experimental and numerical studies have investigated the partial or total substitution of conventional fuels with syngas in existing ICEs, as reported in the review by Fiore et al. [27]. Compression Ignition (CI) engines can be modified to operate in the so-called “dual-fuel” mode by introducing syngas in the intake runner to achieve diesel fuel savings, with limited power losses. In contrast, Spark Ignition (SI) fueled entirely with syngas experience significant power derating due to the reduced Volumetric Efficiency (VE), resulting from the lower density of syngas compared to conventional fuels such as gasoline and natural gas [28]. This reduction limits the quantity of air and fuel trapped in the cylinder, directly affecting torque and power output. Moreover, syngas composition strongly influences key combustion characteristics, including Laminar Flame Speed (LFS), knock tendency, and combustion stability, which are critical parameters for SI engine operation [29].
As syngas production from plastic pyrolysis gains more relevance as a sustainable method for managing plastic waste [30], it is also expected to gradually replace fossil fuels in a wide variety of applications. In this regard, SI ICEs appear to be one viable alternative, as existing engines designed for gasoline or gaseous fuels can be converted with relatively minor hardware modifications, primarily involving the fuel supply system. However, the influence of fuel substitution on engine performance should be properly addressed to provide insights regarding the possible applications of such engines.
In this context, numerical modeling provides an effective tool for evaluating such fuel conversions. Recent works by Pessina et al. [31] investigated the use of two different pure syngas blends in a research single-cylinder engine, specifically addressing the need to accurately evaluating the LFS value over a wide range of thermodynamic conditions and fuel compositions. Similar conclusions were drawn by Caputo et al. in [32], who pointed out the absolute necessity of correctly describing the thermo-chemical aspect of the syngas blend being used to obtain meaningful results from the ICE simulations.
Building on these considerations, the present study aims to numerically assess the impact of converting a Heavy-Duty (HD) SI Compressed Natural Gas (CNG) ICE to operate with a hydrogen-rich syngas produced from plastic pyrolysis. A detailed One-Dimensional (1D) model of the engine is employed to accurately capture the effects of fuel substitution on VE and, consequently, torque and power output. Particular attention is placed on the characterization of chemical and physical fuel properties, especially regarding LFS evaluation and knock tendency, which are addressed with specific approaches to enhance the predictive capabilities of the simulations. Higher-order Computational Fluid Dynamic (CFD) could provide further details regarding particular phenomena (i.e., combustion or mixture formation), requiring more computational resources. However, a complete reduced-order modeling approach is more suitable to assess the behavior of the whole engine system, balancing computational costs and results accuracy.
Initially, the engine configuration is kept unchanged in terms of Spark Advance (SA) values and target equivalence ratio to isolate the influence of the novel fuel on engine performance. In addition, the presence of abnormal combustion is properly evaluated to understand the feasibility of such conversion. Following this, two parametric analyses are conducted to improve the engine performance at full load conditions. In particular, one explores the adoption of a Late Intake Valve Closing (LIVC) strategy, while the other investigates a variation in the Compression Ratio (CR). Finally, complete engine maps regarding Brake-Specific Fuel Consumption (BSFC) and emissions are obtained by performing partial-load simulations of the converted engine in its original configuration (i.e., without changes in valve phasing and CR). These results provide valuable insights into the practical application of syngas-fueled SI engines derived from plastic waste.
The paper is organized as follows. Section two provides the necessary context regarding the modeling of an HD SI CNG engine in a 1D simulation tool, briefly detailing the modeling approaches and the validation of the original engine. The third Section presents the selected syngas composition and discusses its physical and chemical properties, along with the resulting effects on engine performance and emissions. Section four analyzes the possibility of applying LIVC and variations in the CR to reduce the negative effect of switching to syngas. At last, the fifth Section presents the results of part and full load operations of the converted engine.
2. CNG Engine Model
The engine analyzed in this study was presented by the authors in a previous publication [33]. For completeness and to provide context, a summary of the physical engine and its corresponding numerical model is reported here.
The engine is a 13 L, 6-cylinder HD engine available in multiple fueling configurations, including diesel and CNG. The engine specification for the CNG configuration are provided in Table 1.
Table 1.
HD SI CNG-fueled engine specification.
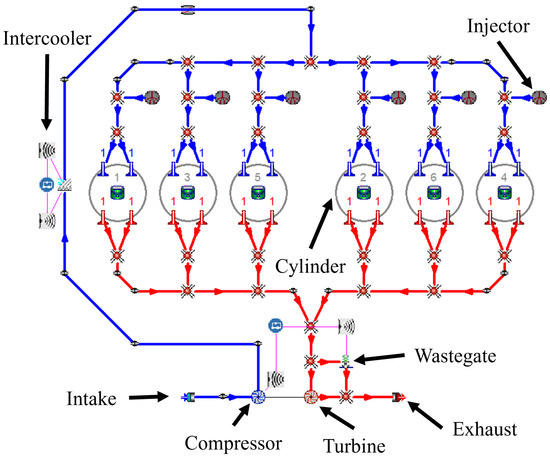
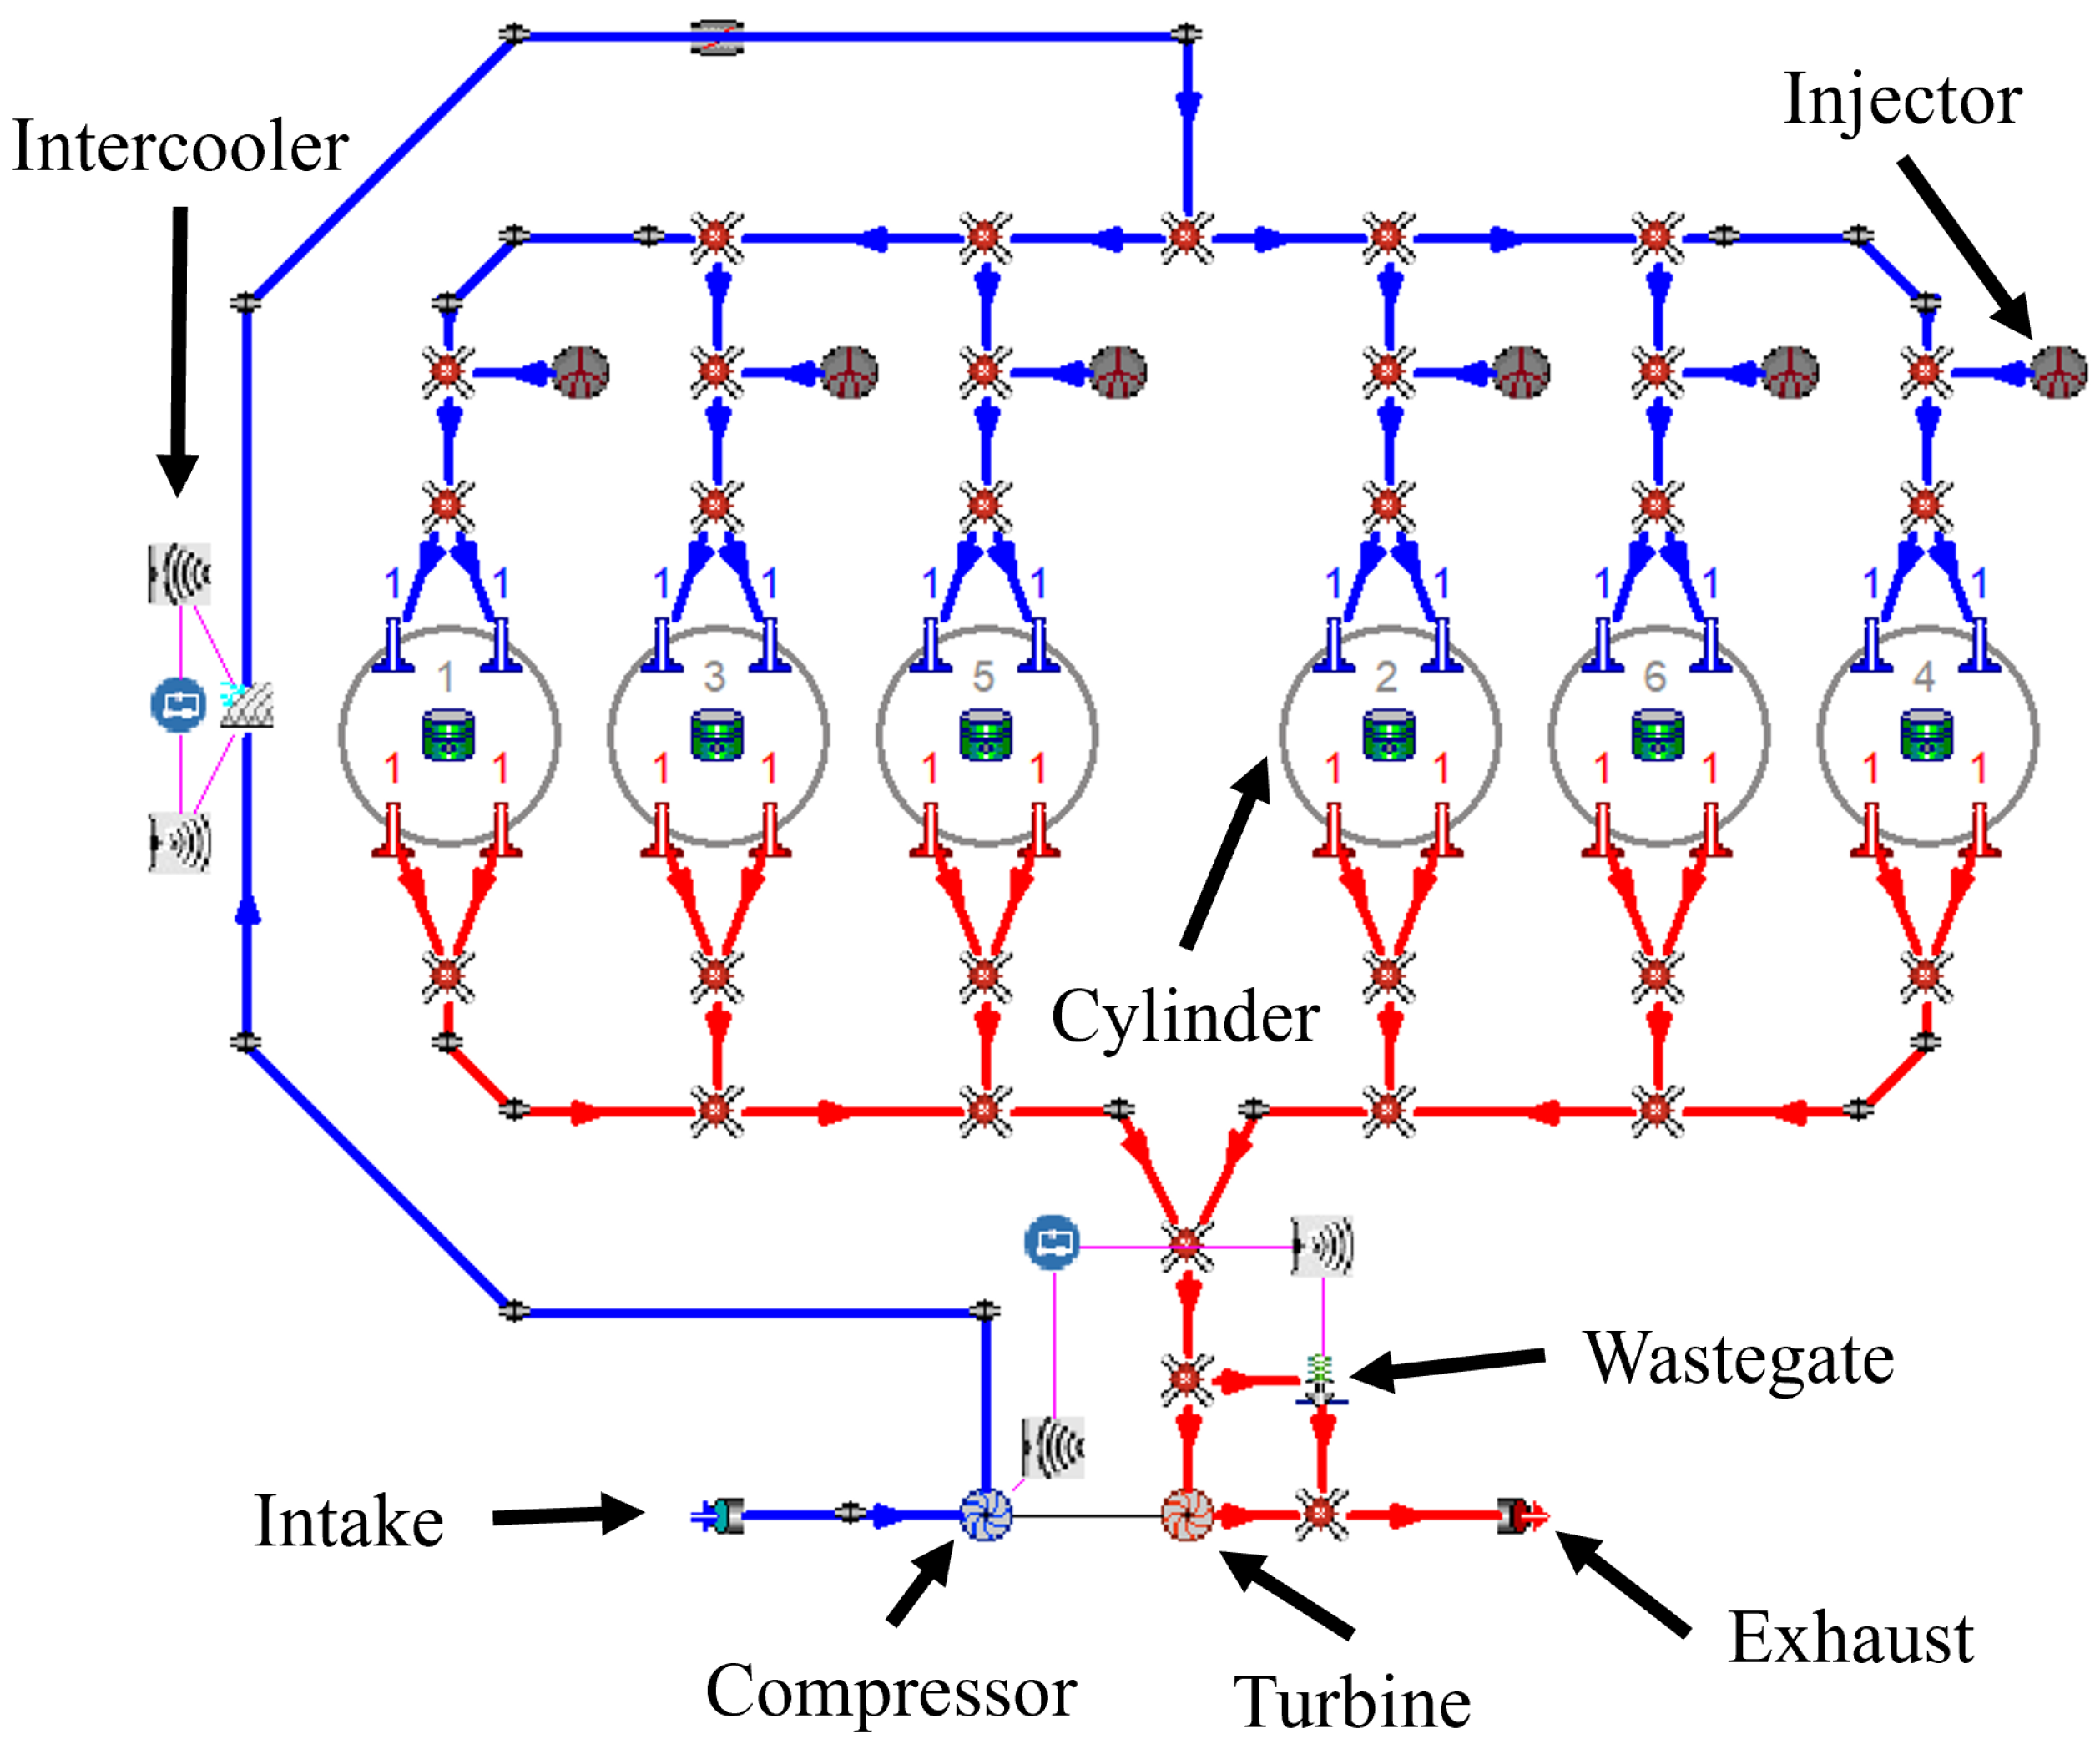
The engine was modeled using the Gasdyn software (Ver 1.01.1) developed by the ICE Group at Politecnico di Milano. A 1D modeling approach was adopted to enable fast simulations over a wide range of operating conditions while maintaining adequate accuracy. Both the intake and exhaust systems were included to faithfully reproduce the real engine configuration. The Turbo-Charging (TC) system was included, with the addition of a Wastegate (WG) valve on the exhaust side to regulate boost pressure. On the intake side, an Intercooler (IC) was positioned downstream the compressor to control intake temperature. The multi-point injection system was represented through six injectors, each located in the intake runner of a cylinder. A schematic of the virtual engine is shown in Figure 1.
Figure 1.
Scheme of the HD SI CNG-fueled engine visualized in Gasdyn pre-processor. Blue lines represent the intake system, red ones represent the exhaust ducts. Specific components in the engine schematic are highlighted with black arrows.
Fluid dynamic in intake and exhaust systems were simulated using a second-order upwind numerical scheme as described in [34]. Conservation equations for mass, momentum, energy, and chemical species were solved at each computational node to accurately capture the thermodynamic conditions throughout the engine. This approach enables accurate prediction of the effects of gaseous Port Fuel Injection (PFI) on VE. This aspect is of critical importance in diesel-derived engine configurations due to its strong influence on engine performance.
The volumetric composition and physical properties of the CNG used in this study are reported in Table 2.
Table 2.
Composition and properties of the CNG used in [33] and of the H2-rich syngas used in this study.
The thermodynamic quantities were calculated assuming ideal gas mixtures using the NASA polynomial method [35].
TC was modeled with a Zero-Dimensional (0D) approach based on corrected mass flow rate-pressure ratio maps provided by the manufacturer. Boost pressure was regulated with a PID controller acting on the WG valve to reach the desired target pressure.
The evolution of the thermodynamic quantities during the closed-valve portion of the engine cycle was simulated using a two-zone combustion model based on the framework of Verhelst et al. [36]. The burn rate was computed using a modified version of the original “eddy burn-up” model [37]. The value of the LFS was obtained from the correlation proposed by D’Errico in [38] in the CNG configuration. In-cylinder turbulence quantities were estimated using the approach described in [39].
Chemical species evolution in the burnt zone was determined using a chemical equilibrium approach, while the unburnt mixture composition was assumed constant. Nitrogen oxide emissions were estimated using a super-extended Zel’dovich mechanism [40], while carbon monoxide emissions were evaluated with the model developed by Baruah in [41].
The model was used to simulate full-load operation of the CNG engine across engine speeds ranging from 600 to 1900 rpm. Part-load operation was not considered in the study. SA were set to match the corresponding experimental settings for each operating point. A single set of tuning parameters for combustion and turbulence models was identified and applied across the entire engine speed range. The computed in-cylinder pressure traces and Apparent Heat Release Rate (AHRR) showed very good agreement with experimental data, both qualitatively and quantitatively, as reported in the authors’ previous publication [33]. Furthermore, the predicted air and fuel mass flow rates closely matched the measured values at all operating conditions.
3. Syngas-Fueled Engine
This section presents the modifications introduced to simulate the baseline CNG engine using syngas instead. The effect on engine performance and emission in full-load operating conditions of this conversion is then presented and discussed.
3.1. Syngas Characteristics
Syngas consists primarily of H2, CO, CO2, and CH4, although the latter two species are typically present only in smaller quantities. In this study, a H2-rich syngas was chosen to fuel the engine, as part of the “Catalysts for hydrogen rich syngas production from pyrolysis of non-recyclable plastic waste materials” (PYH2) project [42]. The project aimed at developing a nano-structured, environmentally friendly catalyst for the production of hydrogen-rich syngas from the pyrolysis of non-recyclable plastic waste materials. The final application of this syngas was its utilization in an off-road HD ICE. The syngas composition is reported in Table 2.
By comparing the characteristics of CNG and syngas, a reduction in both the stoichiometric air-to-fuel ratio and the Lower Heating Value (LHV) can be observed for syngas (16.21 for syngas vs. 47.01 MJ/kgfuel for CNG). Interestingly, for a stoichiometric mixture, the specific energy content is about 11% higher for syngas (3.11 for syngas vs. 2.75 MJ/kgmixture for CNG). Nonetheless, the lower and the reduced gas density are expected to negatively affect on the engine’s VE, leading to a power loss [43].
On the other hand, replacing CNG with syngas offers a notable advantage related to the generally higher LFS of syngas. This is due to the presence of H2, which is characterized by very high values of LFS. Numerous experimental studies reports LFS values of approximately 200 cm/s for H2 at Normal Temperature and Pressure (NPT) (293 K and 1 atm) as summarized in [44]. In the same work, LFS values of about 90 cm/s are reported for H2/CO/air mixtures with a molar H2/CO ratio equal to 1. In contrast, CNG exhibits an LFS of roughly 37 cm/s under similar conditions (300 K and 1 bar) [45,46].
Fuels with higher LFS values promote faster combustion, which is generally advantageous for engine performance. Faster burn rates enable more optimal combustion phasing, leading to improved thermal efficiency [47]. In addition, a faster flame can help suppress knock by shortening the time available for the unburned end-gases to auto-ignite. However, the increased Heat Release Rate (HRR) may also produce steeper rises in end-gas temperature and pressure, potentially increasing knock tendency [48].
It is clear that an accurate estimation of syngas LFS is essential for properly characterizing its impact on engine performance. Although numerous experimental studies on syngas LFS under various thermodynamic conditions and compositions are available [44,49], there is a lack of generalizable correlations suitable for combustion simulation codes. Notably, the only existing correlation for syngas is the one by De Castro [50]. However, this was developed and tested for three specific syngas compositions and cannot be generalized to any particular mixture.
To address this, a tabulated approach, similar to the one proposed by the authors for H2 only mixtures in [34], was chosen. The open-source Python (Ver 3.11.4) module Cantera [51] was used to compute syngas LFS via steady-state simulations of 1D freely propagating premixed laminar flames. The chemical reaction scheme for syngas was the one proposed in [52], composed of 21 species and 62 reactions, specifically developed for reactions of H2/CO mixtures. The thermodynamic ranges for pressure, temperature, equivalence ratio, and Exhaust Gas Recirculation (EGR) considered in the table generation are reported in Table 3, while the syngas composition is listed in Table 2.
Table 3.
Range of pressure, temperature, equivalence ratio and EGR for the LFS table generation.
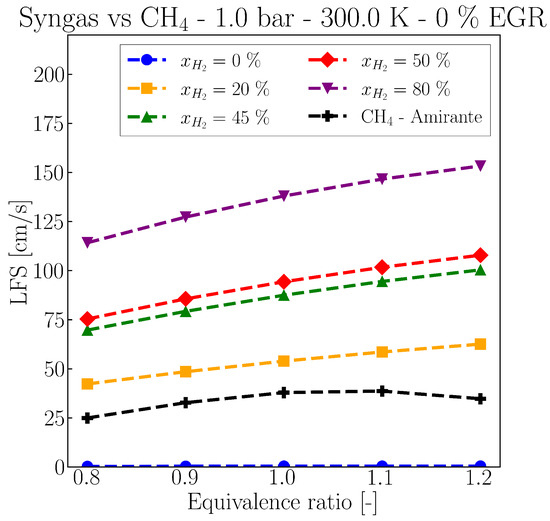
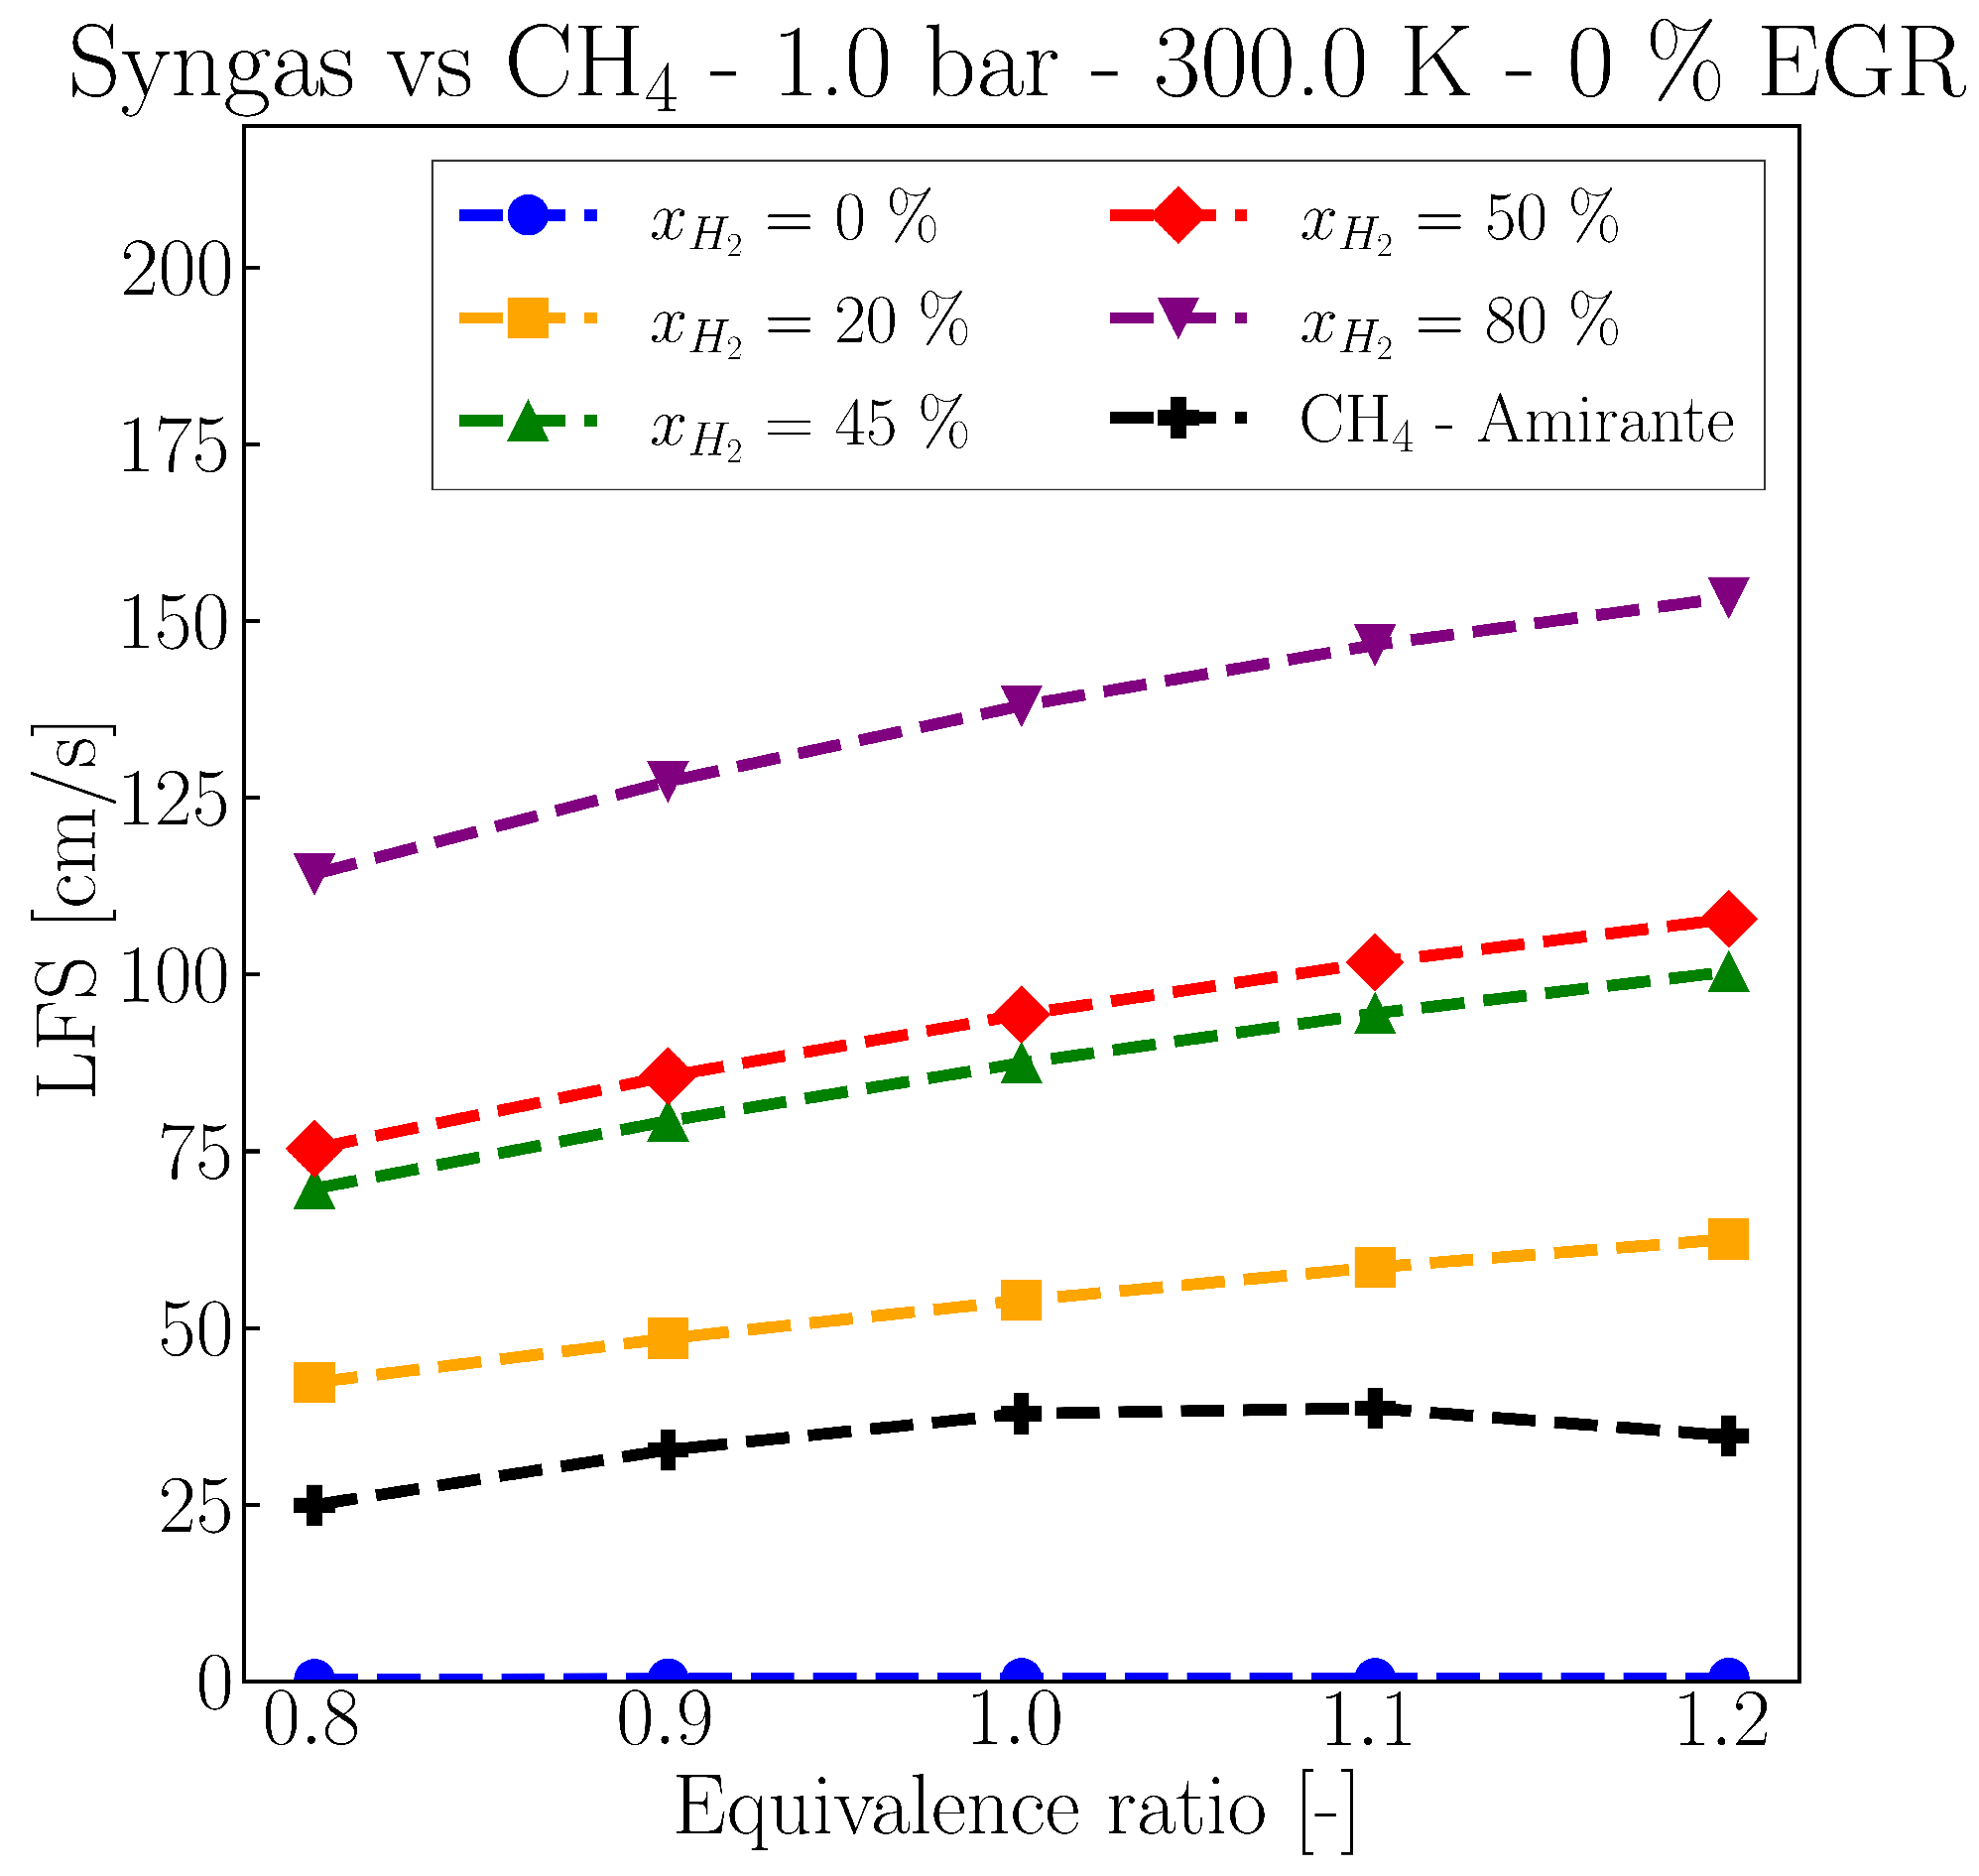
This approach allows specification of both the desired syngas composition and the thermodynamic ranges for LFS evaluation, providing greater simulation flexibility and accuracy. As an example, Figure 2 compares the tabulated LFS values of H2/CO syngas at 1 bar, 300 K, no EGR, and different equivalence ratios and H2 molar concentrations. For comparison, LFS values for methane (CH4) obtained using the correlation by Amirante [53] are also shown.
Figure 2.
Comparison of LFS values of CNG and syngas at various H2 molar concentrations. Sweep of equivalence ratio at 1 bar, 300 K, and no EGR.
Syngas LFS is strongly dependent on its composition, with higher H2 molar concentrations leading to faster flame speeds and the associated benefits on combustion. Notably, even small amounts of H2 significantly increase the LFS, as illustrated by the % curve (in yellow). Even under this condition, combustion is expected to be faster than that of CH4, across the entire range of equivalence ratios.
3.2. Baseline Syngas Engine
Initially, the original CNG engine model and operating conditions were maintained when switching to syngas. In particular, the same boost pressure and SA values were used to isolate the effect of fuel change on engine performance. A stoichiometric equivalence ratio () was selected for the PFI system, based on the assumption that the converted engine would require a Three-Way Catalyst (TWC) to meet emission regulations and to maximize the engine power output.
The virtual syngas engine was simulated under the same full-load conditions as the CNG engine, with engine speeds ranging from 600 to 1900 rpm. Each operating point was simulated for 150 cycles, enough to ensure convergence, and the target boost pressures and equivalence ratios were achieved in all cases.
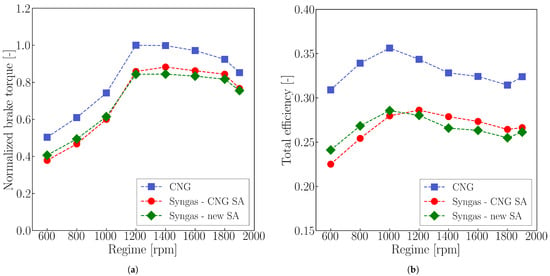
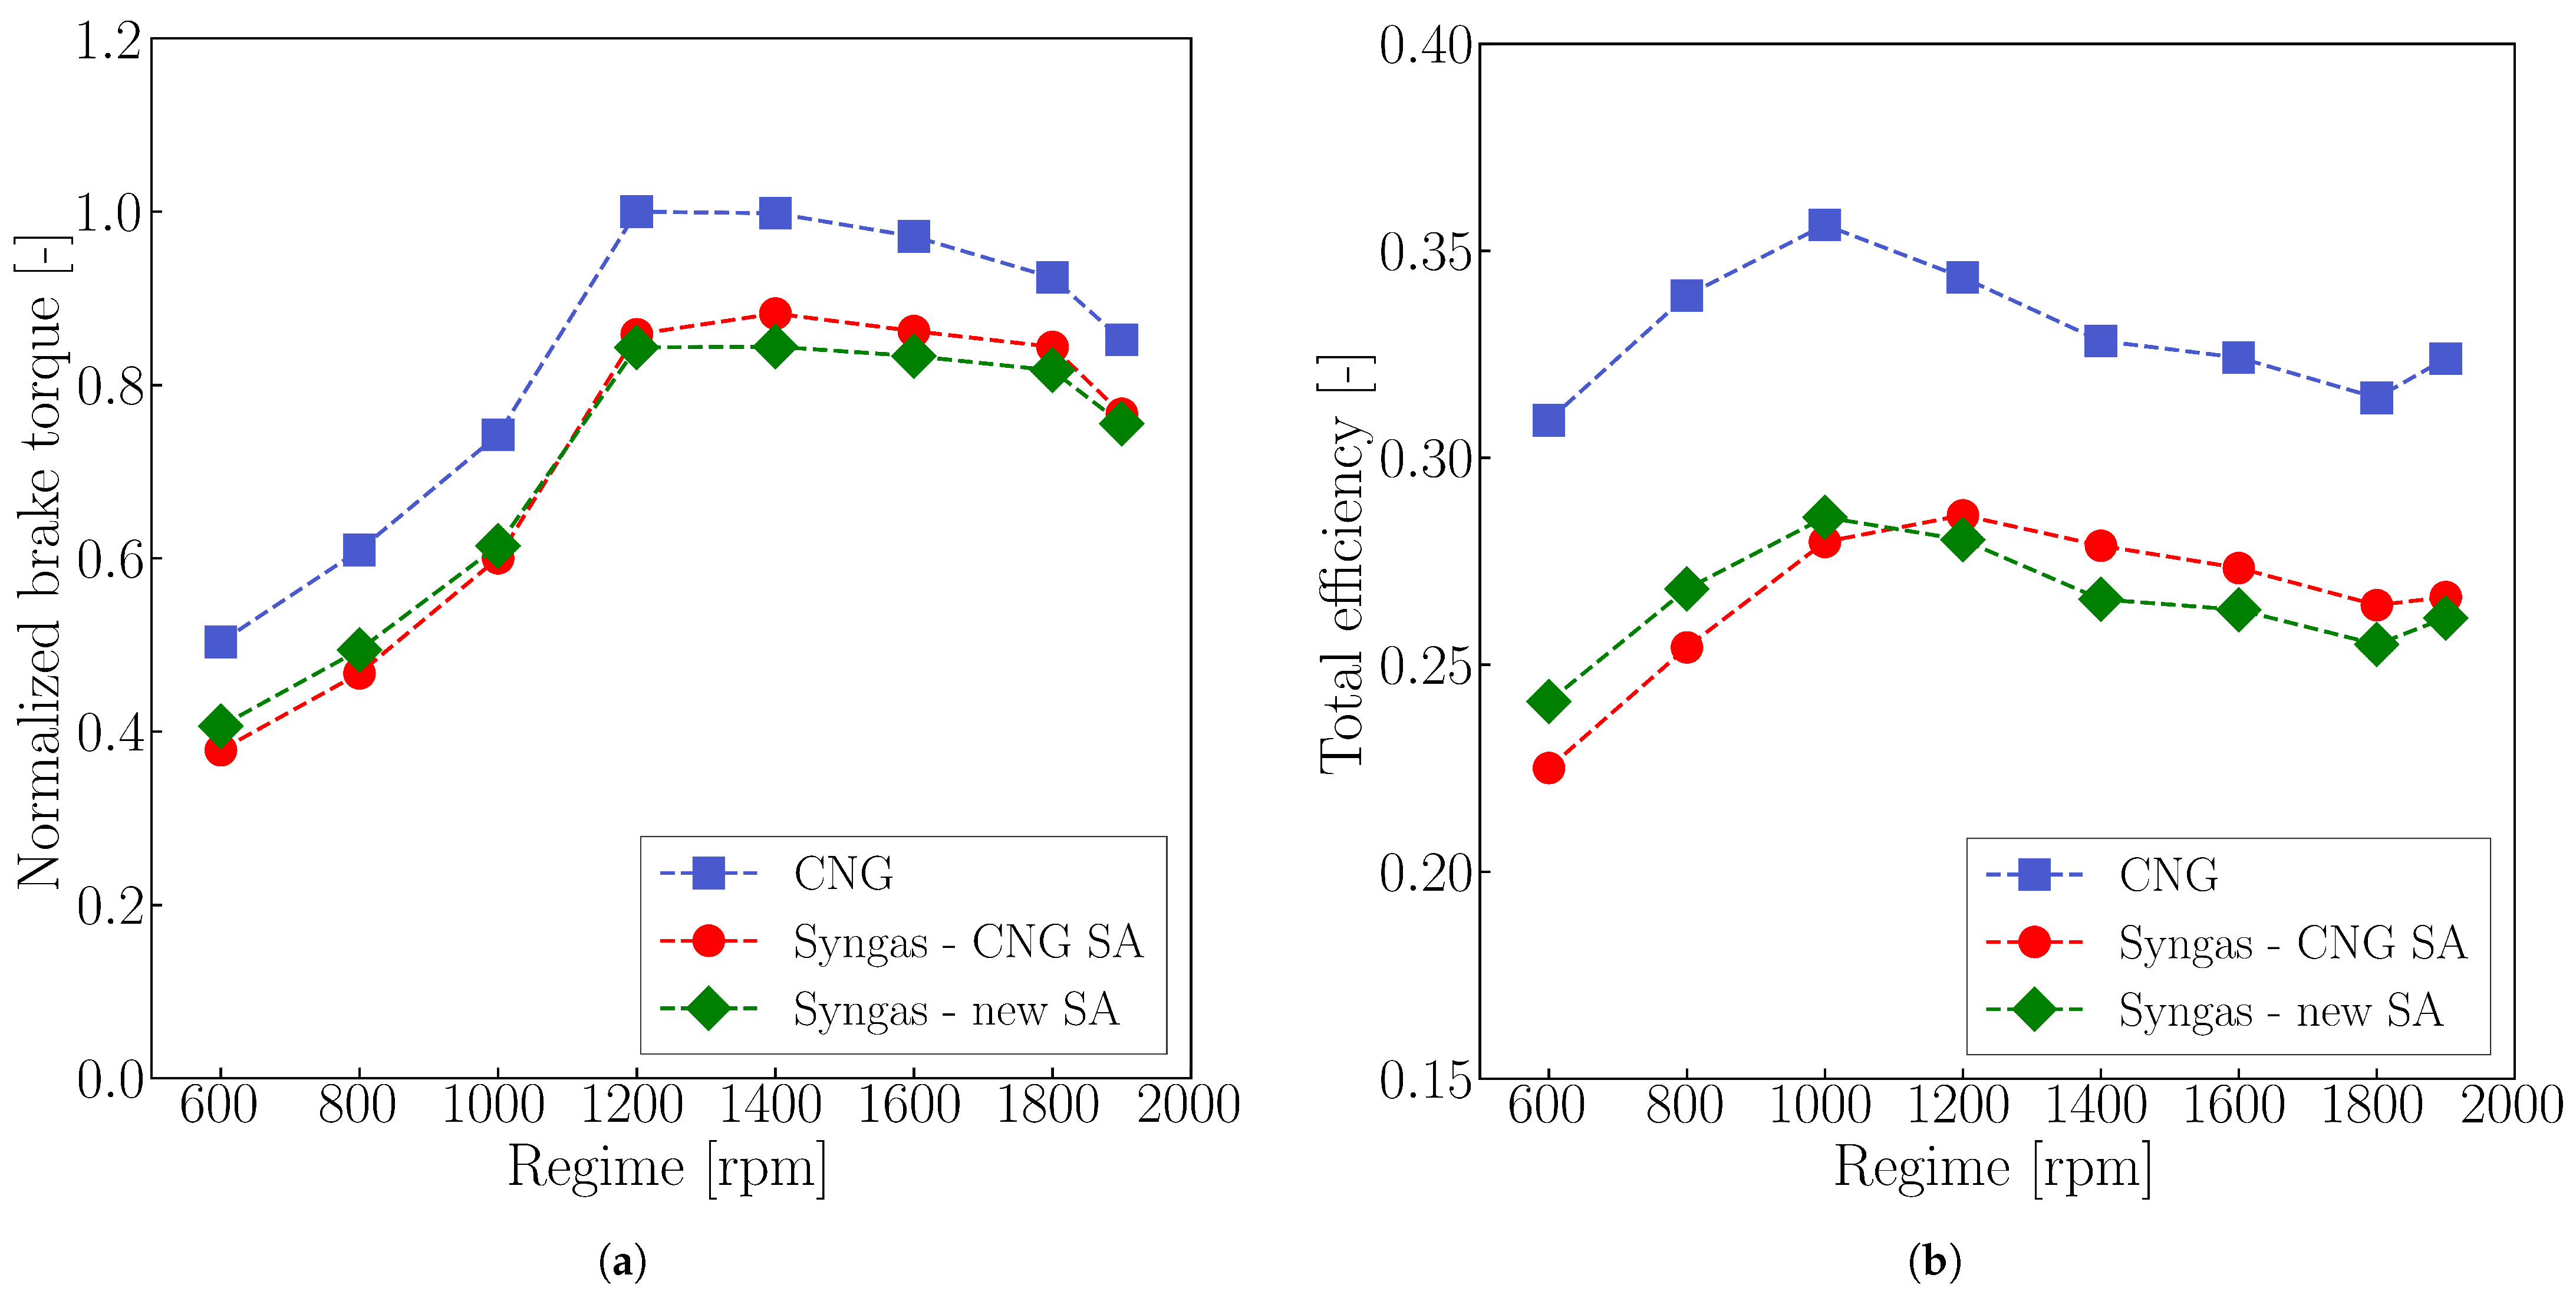
Figure 3 compares the brake torque of the CNG and syngas engines with and without adjusted SA. Blue squares represent the CNG configuration, while red circles and green diamonds denote the syngas cases. Values are normalized to the maximum experimental torque, as requested by the engine manufacturer.
Figure 3.
Comparison between computed values of normalized brake torque (a) and total efficiency (b) in full load conditions. Blue squares refer to the CNG configuration, red circles to the syngas with CNG SA, and green diamonds to the syngas one with new values of SA.
A clear reduction in engine performance is observed when switching to syngas across the full-load range. On average, brake torque decreases by 14%, with a maximum reduction of 22% at 600 rpm only by changing the fuel.
Figure 3b presents the computed total efficiency under full-load conditions for both the original and modified engine configurations showing a similar trend. In particular, the use of syngas reduces engine efficiency by approximately 5% on average.
This performance loss is primarily due to two factors. First, syngas PFI significantly reduces the engine’s VE because of its lower density compared to CNG (Table 2), directly affecting torque and power.
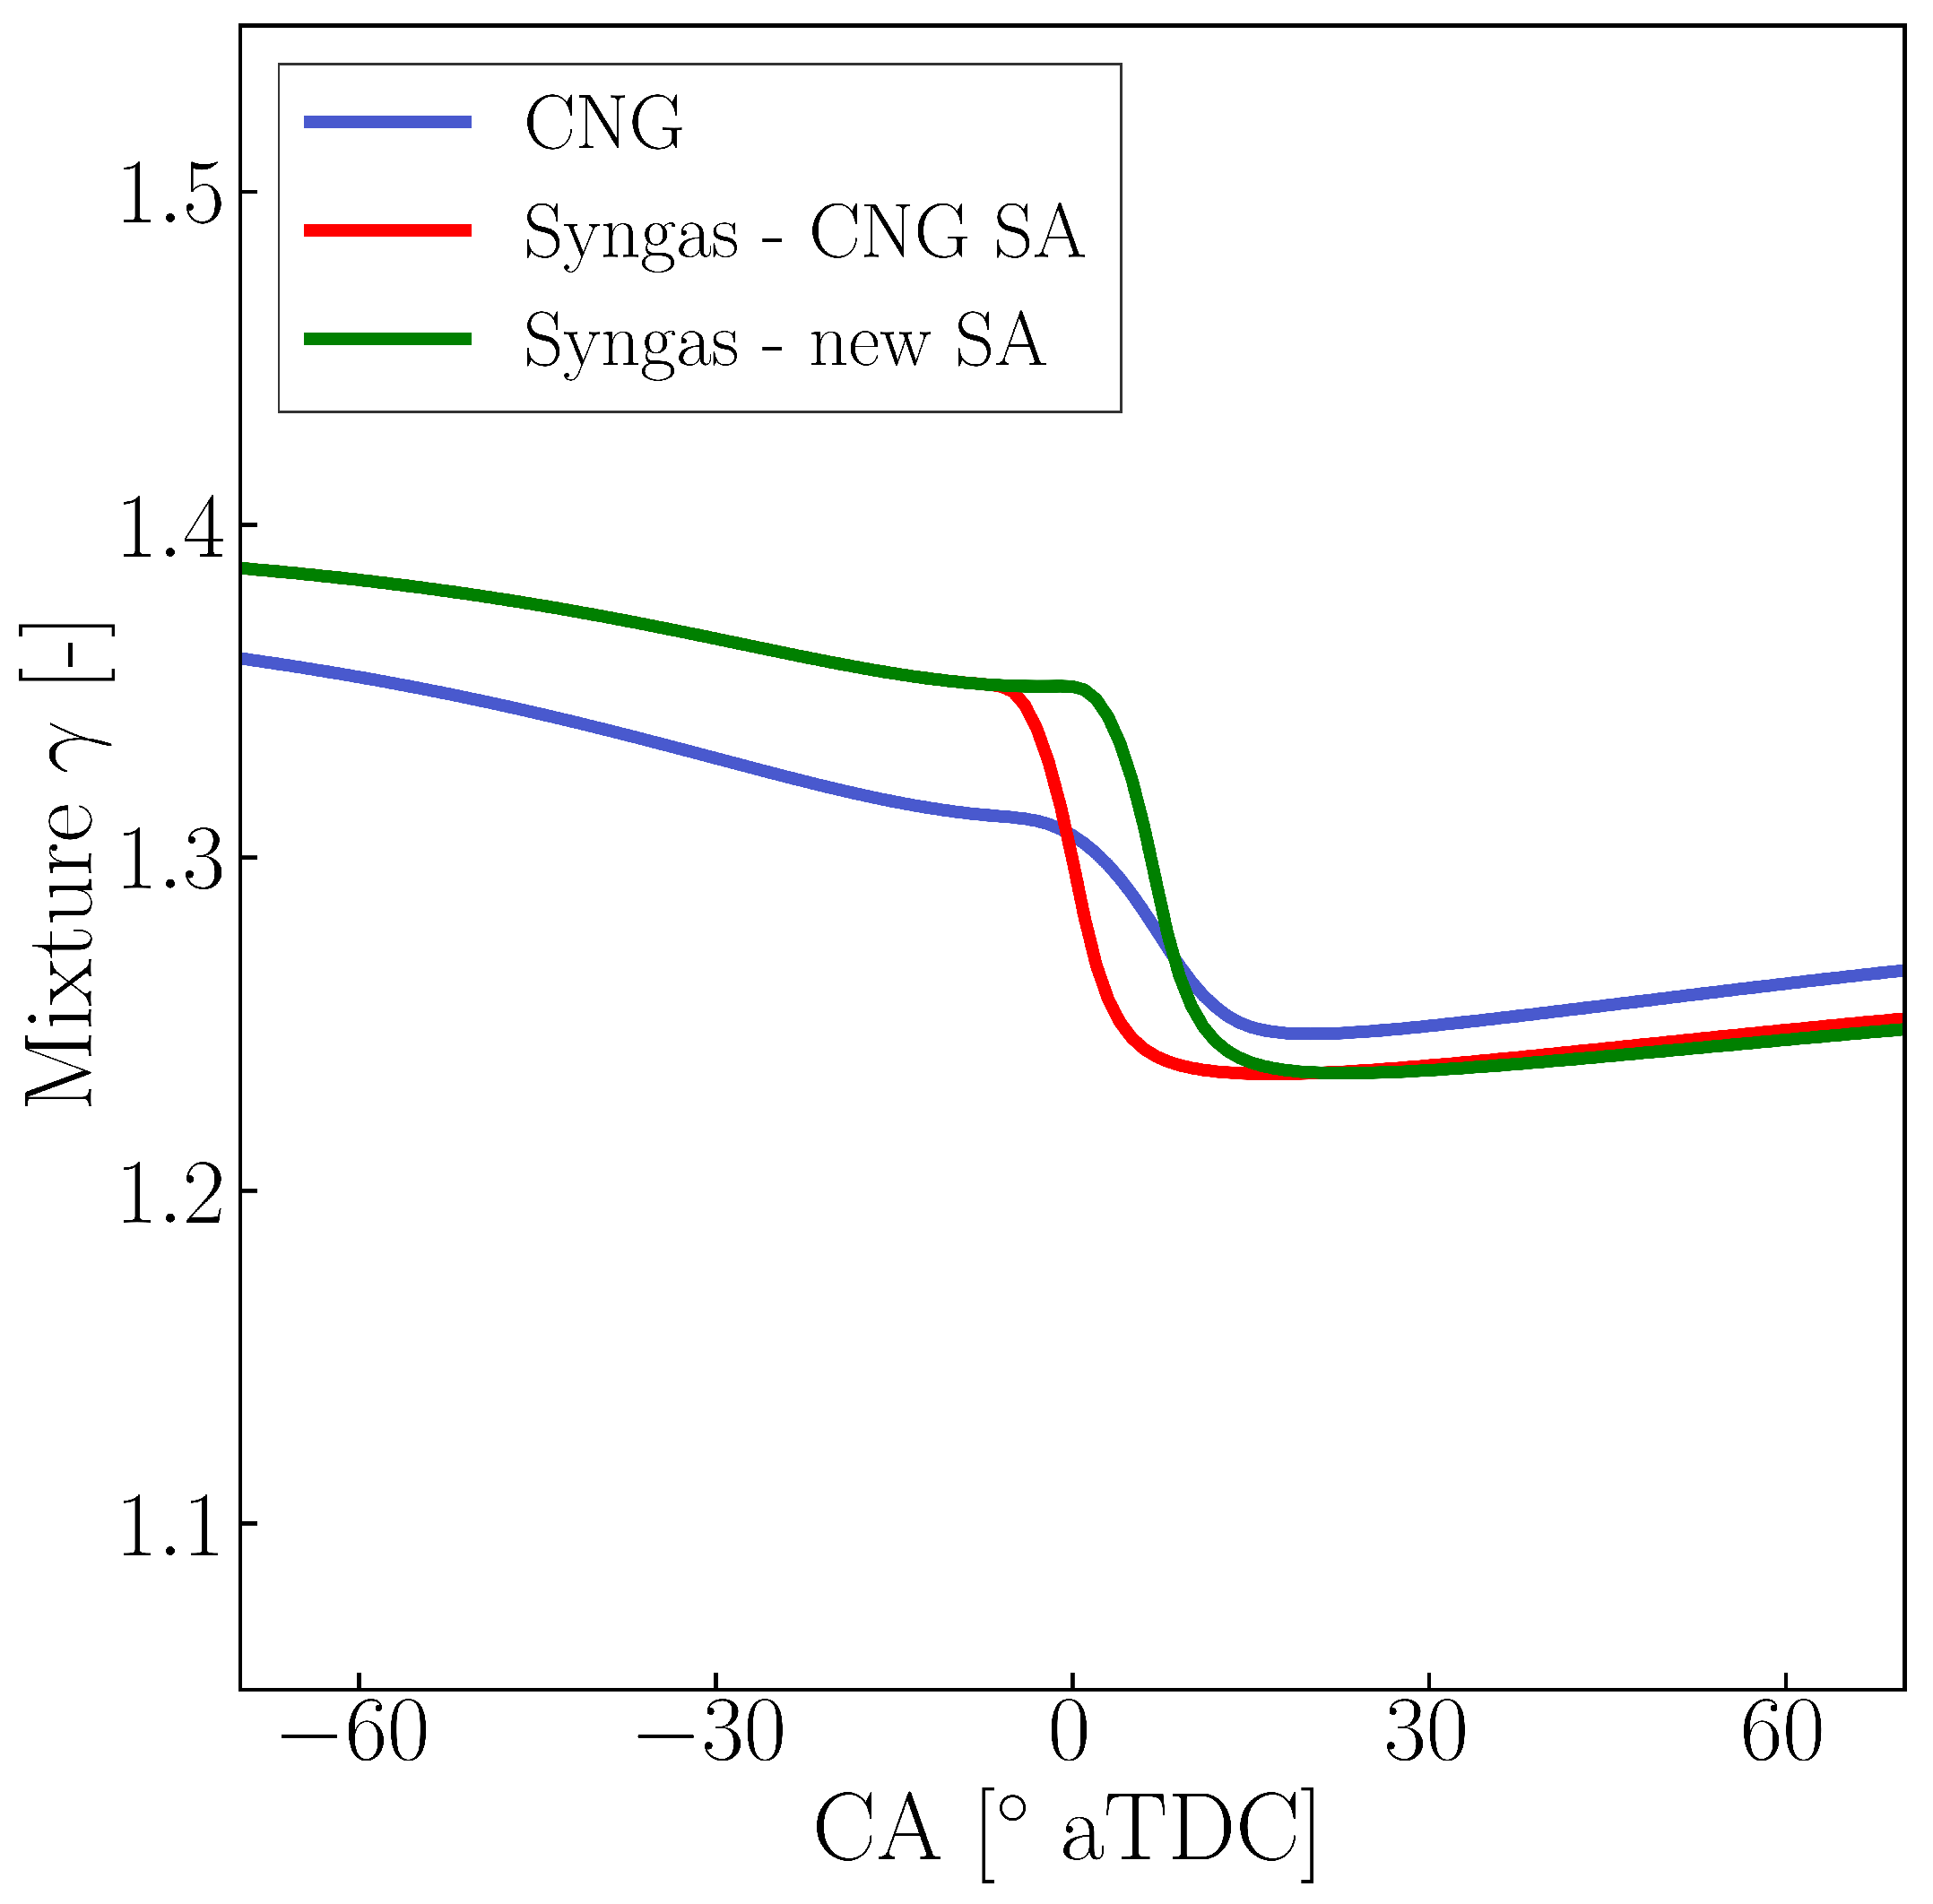
Second, differences in the heat capacity ratio () of the fresh charges contribute to lower efficiency. In particular, syngas exhibits a higher , largely due to the presence of H2 and CO, both diatomic gases. Additionally, the lower of the syngas–air mixture increases the amount of air required to reach the stoichiometry, and since air itself has of around 1.4 (considering a air molar composition of 79% N2 and 21% O2), this further raises the overall of the mixture.
Since the IVC conditions-pressure and temperature-are similar for both fueling strategies due to the presence of the TC and IC, and the CR is unchanged, an increase in compression work proportional to is expected. This follows from the derivation of the adiabatic work of a perfect gaseous mixture ( = const) in a closed system, which results in the following equation:
where W is the work, while the subscripts 1 and 2 identify the initial and final conditions of the adiabatic process.
From this simplified formulation, it is evident that for the same initial pressure and volume () and effective compression ratio (), a higher results in higher values of W in absolute terms. Similar considerations apply when accounting for heat transfer with the cylinder walls and the temperature dependence of , as in ideal gas mixtures.
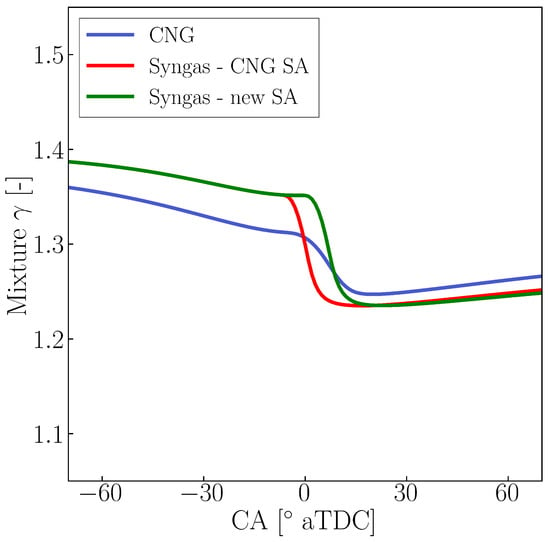
Specifically, the value of reduces during the compression stroke as the temperature of the air–fuel increases. However, this remains always higher in the syngas engine throughout the compression stroke, as reported in Figure 4, leading to increased compression work for the syngas configuration. During the expansion stroke, the difference in the values becomes narrower. The steeper decrease in for the syngas cases is attributed to the higher molar fraction of CO2 (17% vs. 9%) produced by syngas combustion, whereas the other major species (N2 and H2O) remain comparable with CNG cases. In fact, CO2 is characterized by a low value, which drops sharply from 1.28 at 300 K to 1.18 at 1000 K, leveling off at 1.16 at higher temperatures. Indeed, the greater quantity of CO2 in the syngas exhaust mixture drives its to lower values than in the CNG cases. Overall, this results in a net reduction of specific work, which can explain the lower total efficiency observed for the syngas engine.
Figure 4.
Comparison between computed values of for the 600 rpm full load regime. The blue line refers to the CNG configuration, while the red one to the syngas with CNG SA, and the green one to the syngas with new values of SA.
Additionally, heat losses are slightly higher in the syngas configuration, even though the IC target temperature and cylinder wall temperatures were kept the same as in the CNG engine. This is primarily due to the higher combustion temperatures of the burned charge, which are due to the presence of H2 in the fuel. These aspects increase heat transfer and negatively affect overall engine efficiency.
It is worth noting that higher values of total efficiencies are expected for the syngas engine under lean air–fuel mixture conditions, as reported in [27]. However, this would be accompanied by an even more pronounced power derating with respect to the CNG configuration. Indeed, a fuel lean strategy () was simulated for the syngas engine across the full load operating conditions. Results show a power reduction of 24% to the CNG configuration, with a smaller penalty on total efficiency (−3%). For this reason, the choice of the stoichiometric mixture was maintained.
3.3. Knock Analysis and SA Variation
Following this preliminary analysis, specific evaluations were conducted to determine whether the engine could operate on syngas without adjusting the SA values, with particular focus on knock onset.
A Tabulated Kinetic of Ignition (TKI) approach was used to model knock. This methodology was applied in previous works to determine the Ignition Delay (ID) in CI engines fueled by diesel or Dimethyl-Ether (DME), as presented in [54,55]. In this method, a normalized Progress Variable (PV, c) is defined to represent the extent of chemical reaction, with corresponding to the fresh mixture and indicating complete auto-ignition (i.e., completely burnt charge). Detailed chemical kinetics simulations are performed offline in a homogeneous constant-pressure reactor across relevant ranges of temperature, pressure, equivalence ratio, and EGR. The normalized reaction rate () obtained from these simulations is stored in a lookup table. During engine simulation, the current thermodynamic state of the unburned charge and the corresponding PV are used to access the table and determine , which is then integrated over time. Knock is assumed to occur when c reaches unity. Table generation followed the methodology proposed by Lucchini in [56] and was implemented in an in-house code based on Cantera. The thermodynamic ranges and chemical mechanism used for the table generation were the same as those employed for the LFS tabulation (see [52] and Table 3).
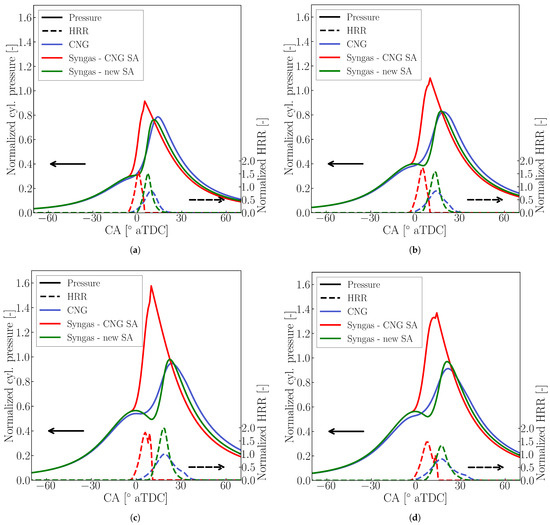
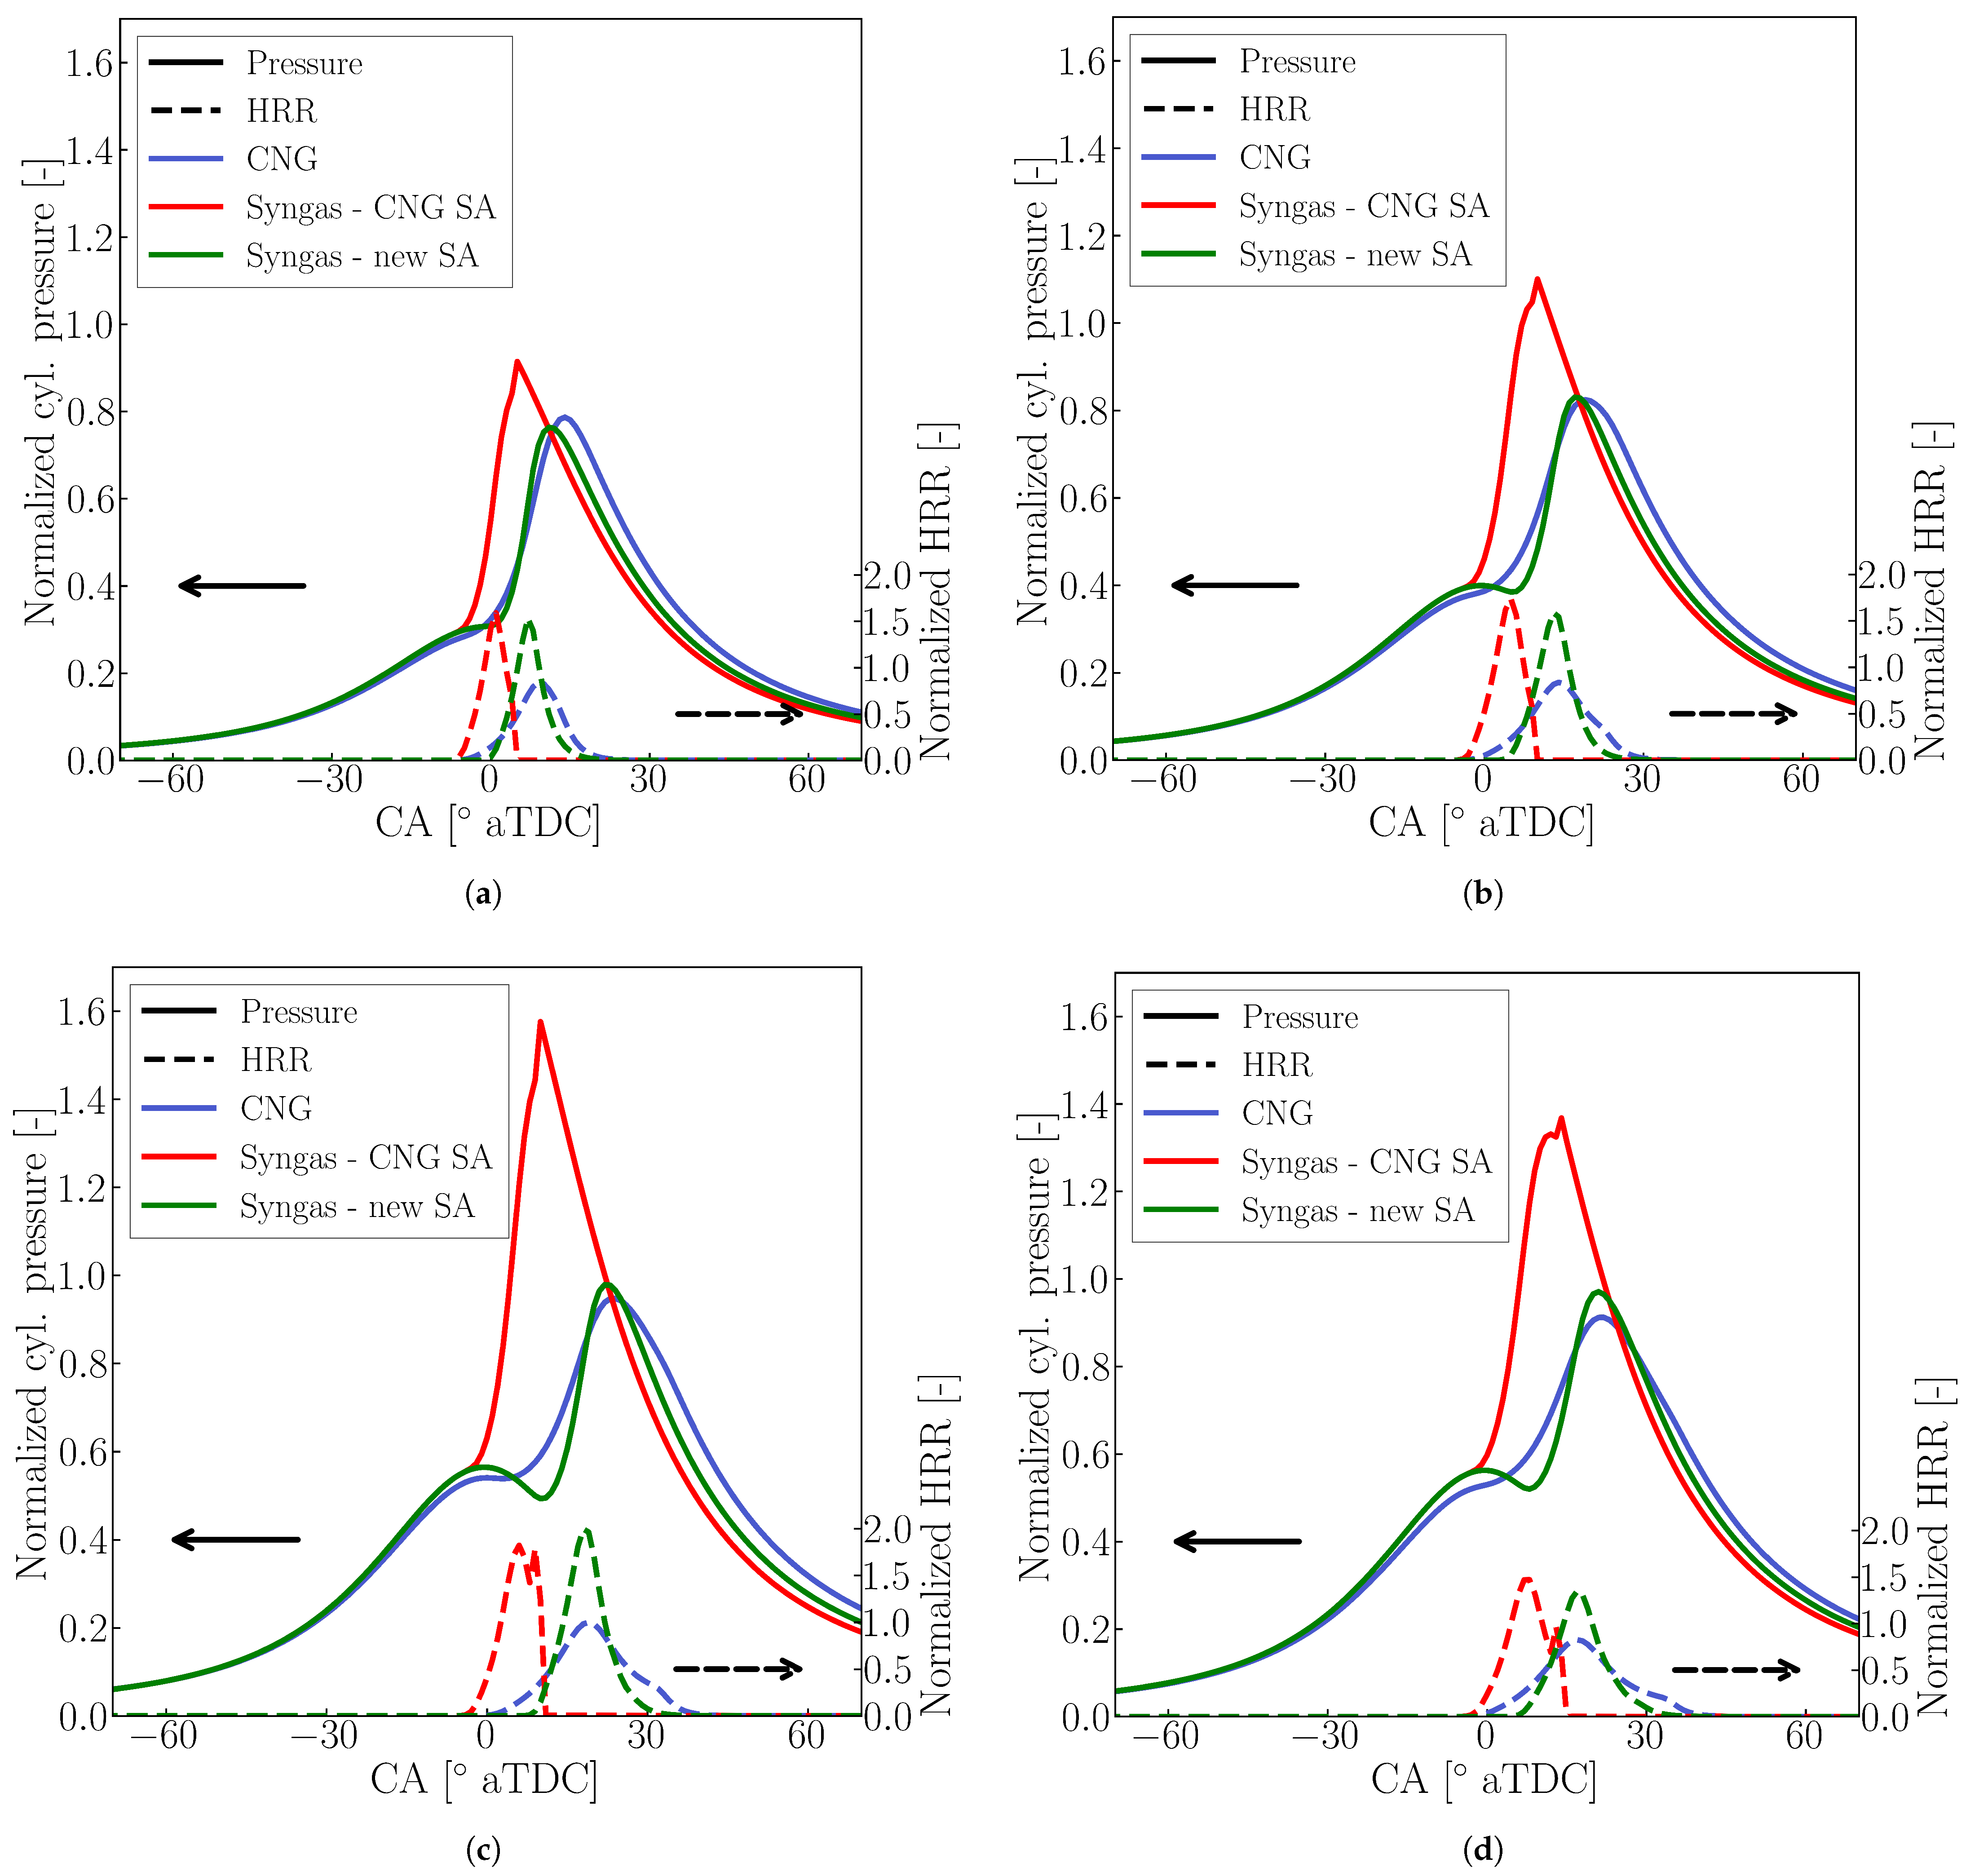
Knock was predicted under most full-load operating conditions, with computed peak pressures significantly exceeding those of the CNG configuration. Consequently, the SA values were adjusted to prevent knock. Figure 5 compares the normalized in-cylinder pressure traces and HRR for the CNG engine and two syngas configurations. Computed results for the CNG engine are shown in blue, while syngas results using the same SA are shown in red, and those with adjusted SA are shown in green. It is important to note that thermodynamic conditions at IVC were identical across the syngas cases, with the only difference being the SA values.
Figure 5.
Comparison of the normalized cylinder pressure traces and HRR for the HD SI engine. Computed results for the CNG engine (black) are compared to the ones obtained in the syngas configuration without changes in SA (red) and with SA variations (light blue) in full load conditions at different engine speeds: (a) 600 rpm, full load; (b) 1000 rpm, full load; (c) 1200 rpm, full load; (d) 1900 rpm, full load. Knock occurrence is visible in the sharp increase in pressure for the Syngas − CNG SA computed results near the peak values.
Analysis of the HRR under various conditions shows that syngas combustion is faster than that of CNG, regardless of the SA setting. Both syngas configurations exhibit sharper and narrower HRR profiles, reflecting the higher laminar flame speed associated with the presence of H2, as previously discussed.
In the syngas cases with unchanged SA (in red), knock is indicated by sudden spikes in cylinder pressure and HRR, followed by an almost instantaneous drop of the HRR to zero. Light knock occurs at 1900 rpm (case (d) on Figure 5), while more severe knock is observed at the other operating points.
In contrast, knock is not observed in the syngas simulations when the SA (measured in CA aTDC) is increased. Retarding the SA shifts the rise of cylinder pressure and temperature, reducing the likelihood of knock and lowering peak pressures to levels comparable with the original CNG engine.
The effects of SA adjustment on brake torque and total efficiency are shown in Figure 3a and Figure 3b, respectively. Interestingly, increasing the SA improves performance at low-engine speed regimes (i.e., 600–800 rpm) by optimizing combustion phasing. Indeed, for these cases, the value of Burnt Mass Fraction 50 (BMF50, i.e., the angle at which 50% of the trapped mass is burned) is estimated to be around 8 CA aTDC, which is the optimal combustion phasing location [57,58]. At higher speeds, engine performance decreases, with BMF50 reaching 17–21 CA aTDC. On average, the SA values had to be increased by 8 CA with respect to the original values relative to the original values to prevent knock.
With the adjusted SA, the syngas engine exhibits a 15% reduction in brake torque and a 6% decrease in total efficiency. These values were adopted as the baseline for all subsequent syngas engine simulations.
3.4. Engine Emission Analysis
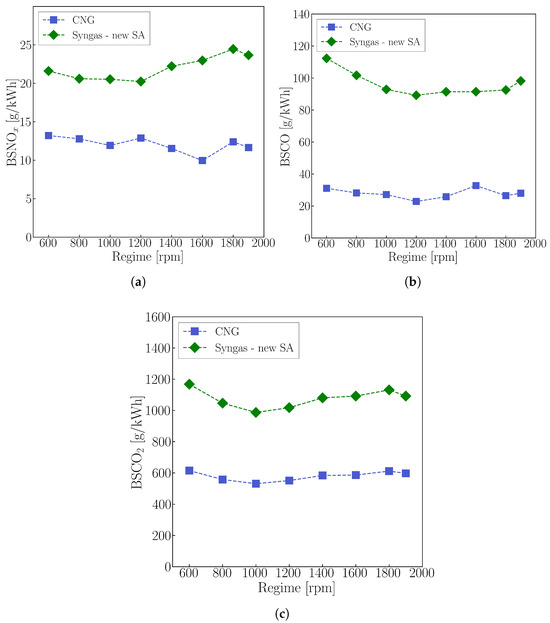
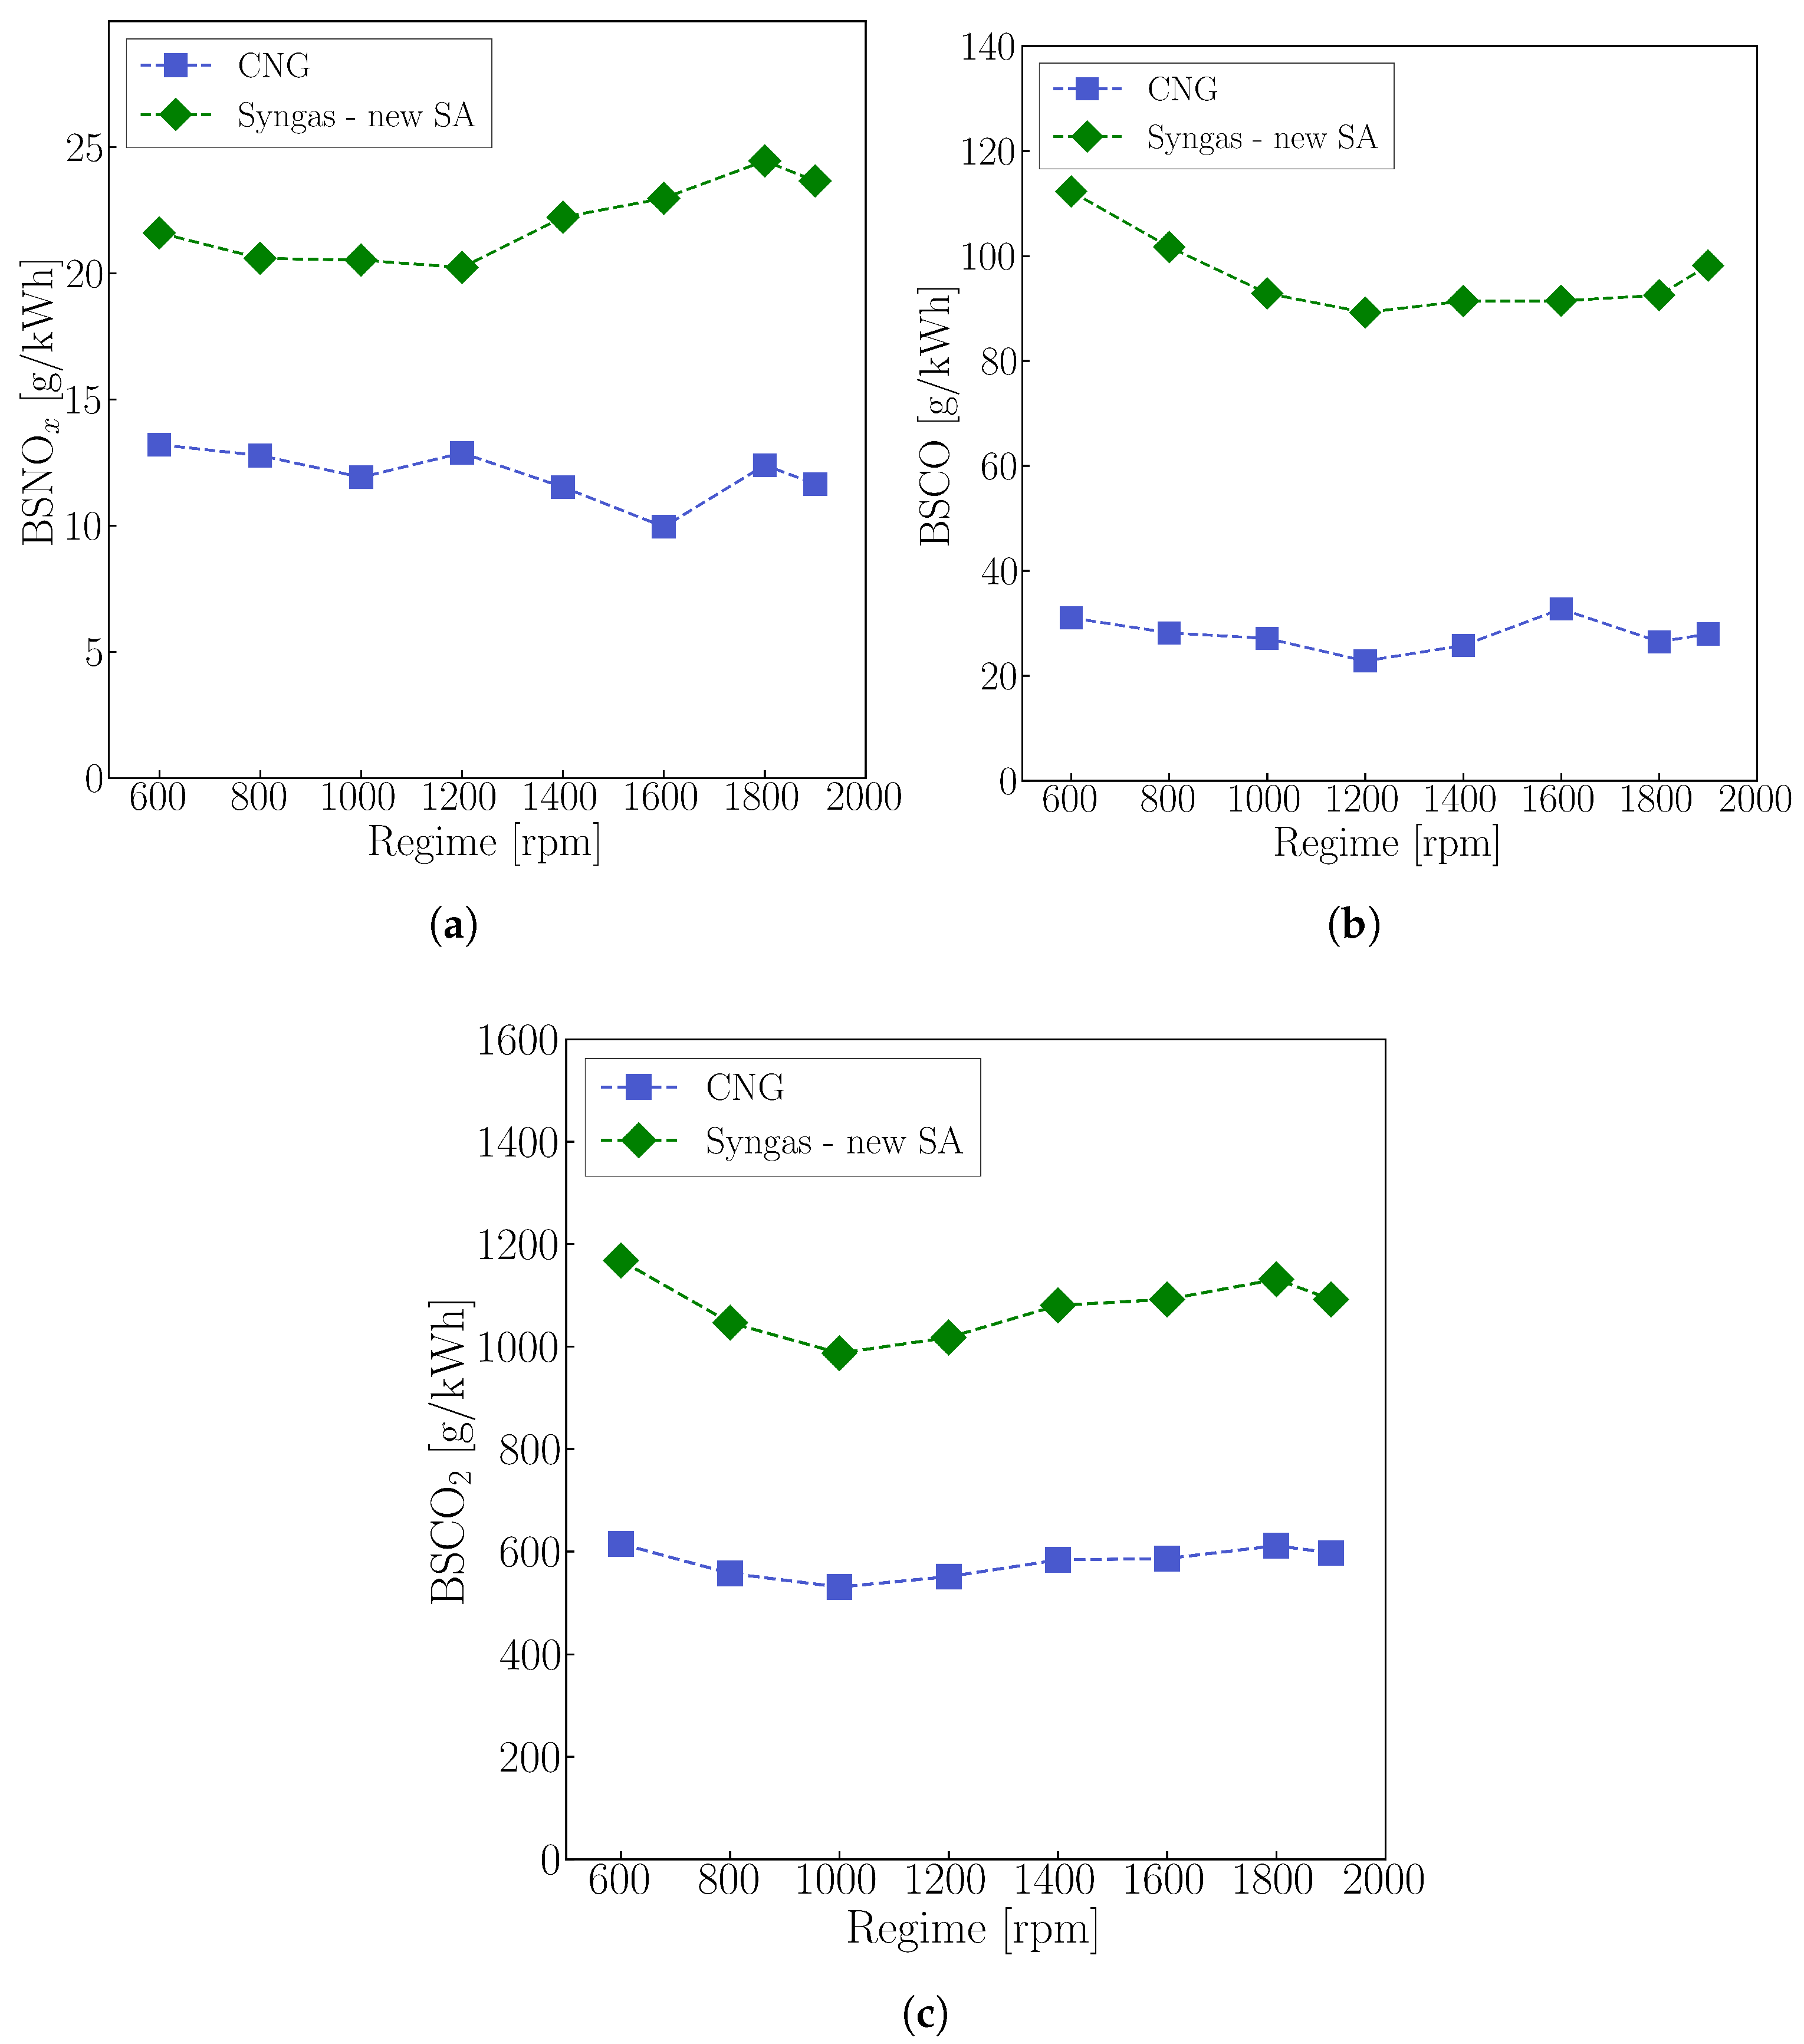
With appropriate SA values established, pollutant emissions were analyzed. Figure 6a compares the computed Brake Specific Nitrogen Oxide (BSNOx) emissions for the CNG and syngas engines.
Figure 6.
Comparison between computed values of Brake Specific Nitrogen Oxides (BSNOx) (a), Brake Specific Carbon Monoxide (BSCO) (b) and Brake Specific Carbon Dioxide (BSCO2) (c) in full load conditions. Blue squares refer to the CNG configuration, and green diamonds to the syngas one with new values of SA.
Higher values of BSNOx are observed for the syngas configuration. The reason behind this can be found in the higher temperatures reached during combustion from the presence of H2, which enhances the NOx formation. The average peak cylinder temperature across full-load regimes was estimated at 2440 K for CNG and 2720 K for syngas.
Shifting the focus to Brake Specific Carbon Monoxide (BSCO) emission, the syngas configuration again exhibits higher levels, as shown in Figure 6b. This outcome is expected given the syngas composition (55% CO on a molar basis) and the stoichiometric operating condition () adopted for the converted engine. As reported in the literature, CO emissions typically peak near stoichiometric mixtures [59]. Furthermore, the high CO content in the fuel increases the likelihood of unburned CO—for instance, due to crevice effects and flame quenching—thereby contributing to the elevated BSCO values.
Finally, Figure 6c hows the comparison of Brake Specific CO2 (BSCO2) emissions. The high CO fraction in the fuel directly increases the amount of CO2 produced during combustion, which explains the higher BSCO2 levels for the syngas case. In addition, the lower and LHV of syngas requires higher fuel mass flow rates relative to CNG to achieve similar values of heat released in the combustion chamber. This results in large quantities of CO mass and, consequently, increased CO2 production at the exhaust.
4. Variation of Engine Characteristics
In Section 3, the impact of fuel substitution on engine performance and pollutant emissions was examined. Overall, the use of syngas resulted in reduced brake torque and total efficiency compared with CNG operation. Building on these findings, the objective of this Section is to investigate potential strategies to mitigate the observed performance losses. Each of the two subsections introduces a specific modification to the original engine configuration and assesses its influence on brake torque and total efficiency. Throughout this analysis, the term Syngas − base refers to the setup employing the adjusted SA values necessary to avoid knock, previously indicated as Syngas − new SA.
4.1. Late Intake Valve Closing
The first configuration considered involved delaying the IVC to shorten the effective compression stroke relative to the expansion stroke, to obtain the so called Miller or Atkinson cycle. Two Late Intake Valve Closing (LIVC) strategies were evaluated, with IVC delayed by 10 CA and 20 CA, respectively. No additional modifications were applied relative to the base syngas configuration; in particular, the same boost pressure was maintained.
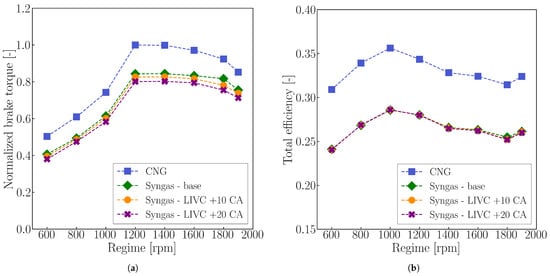
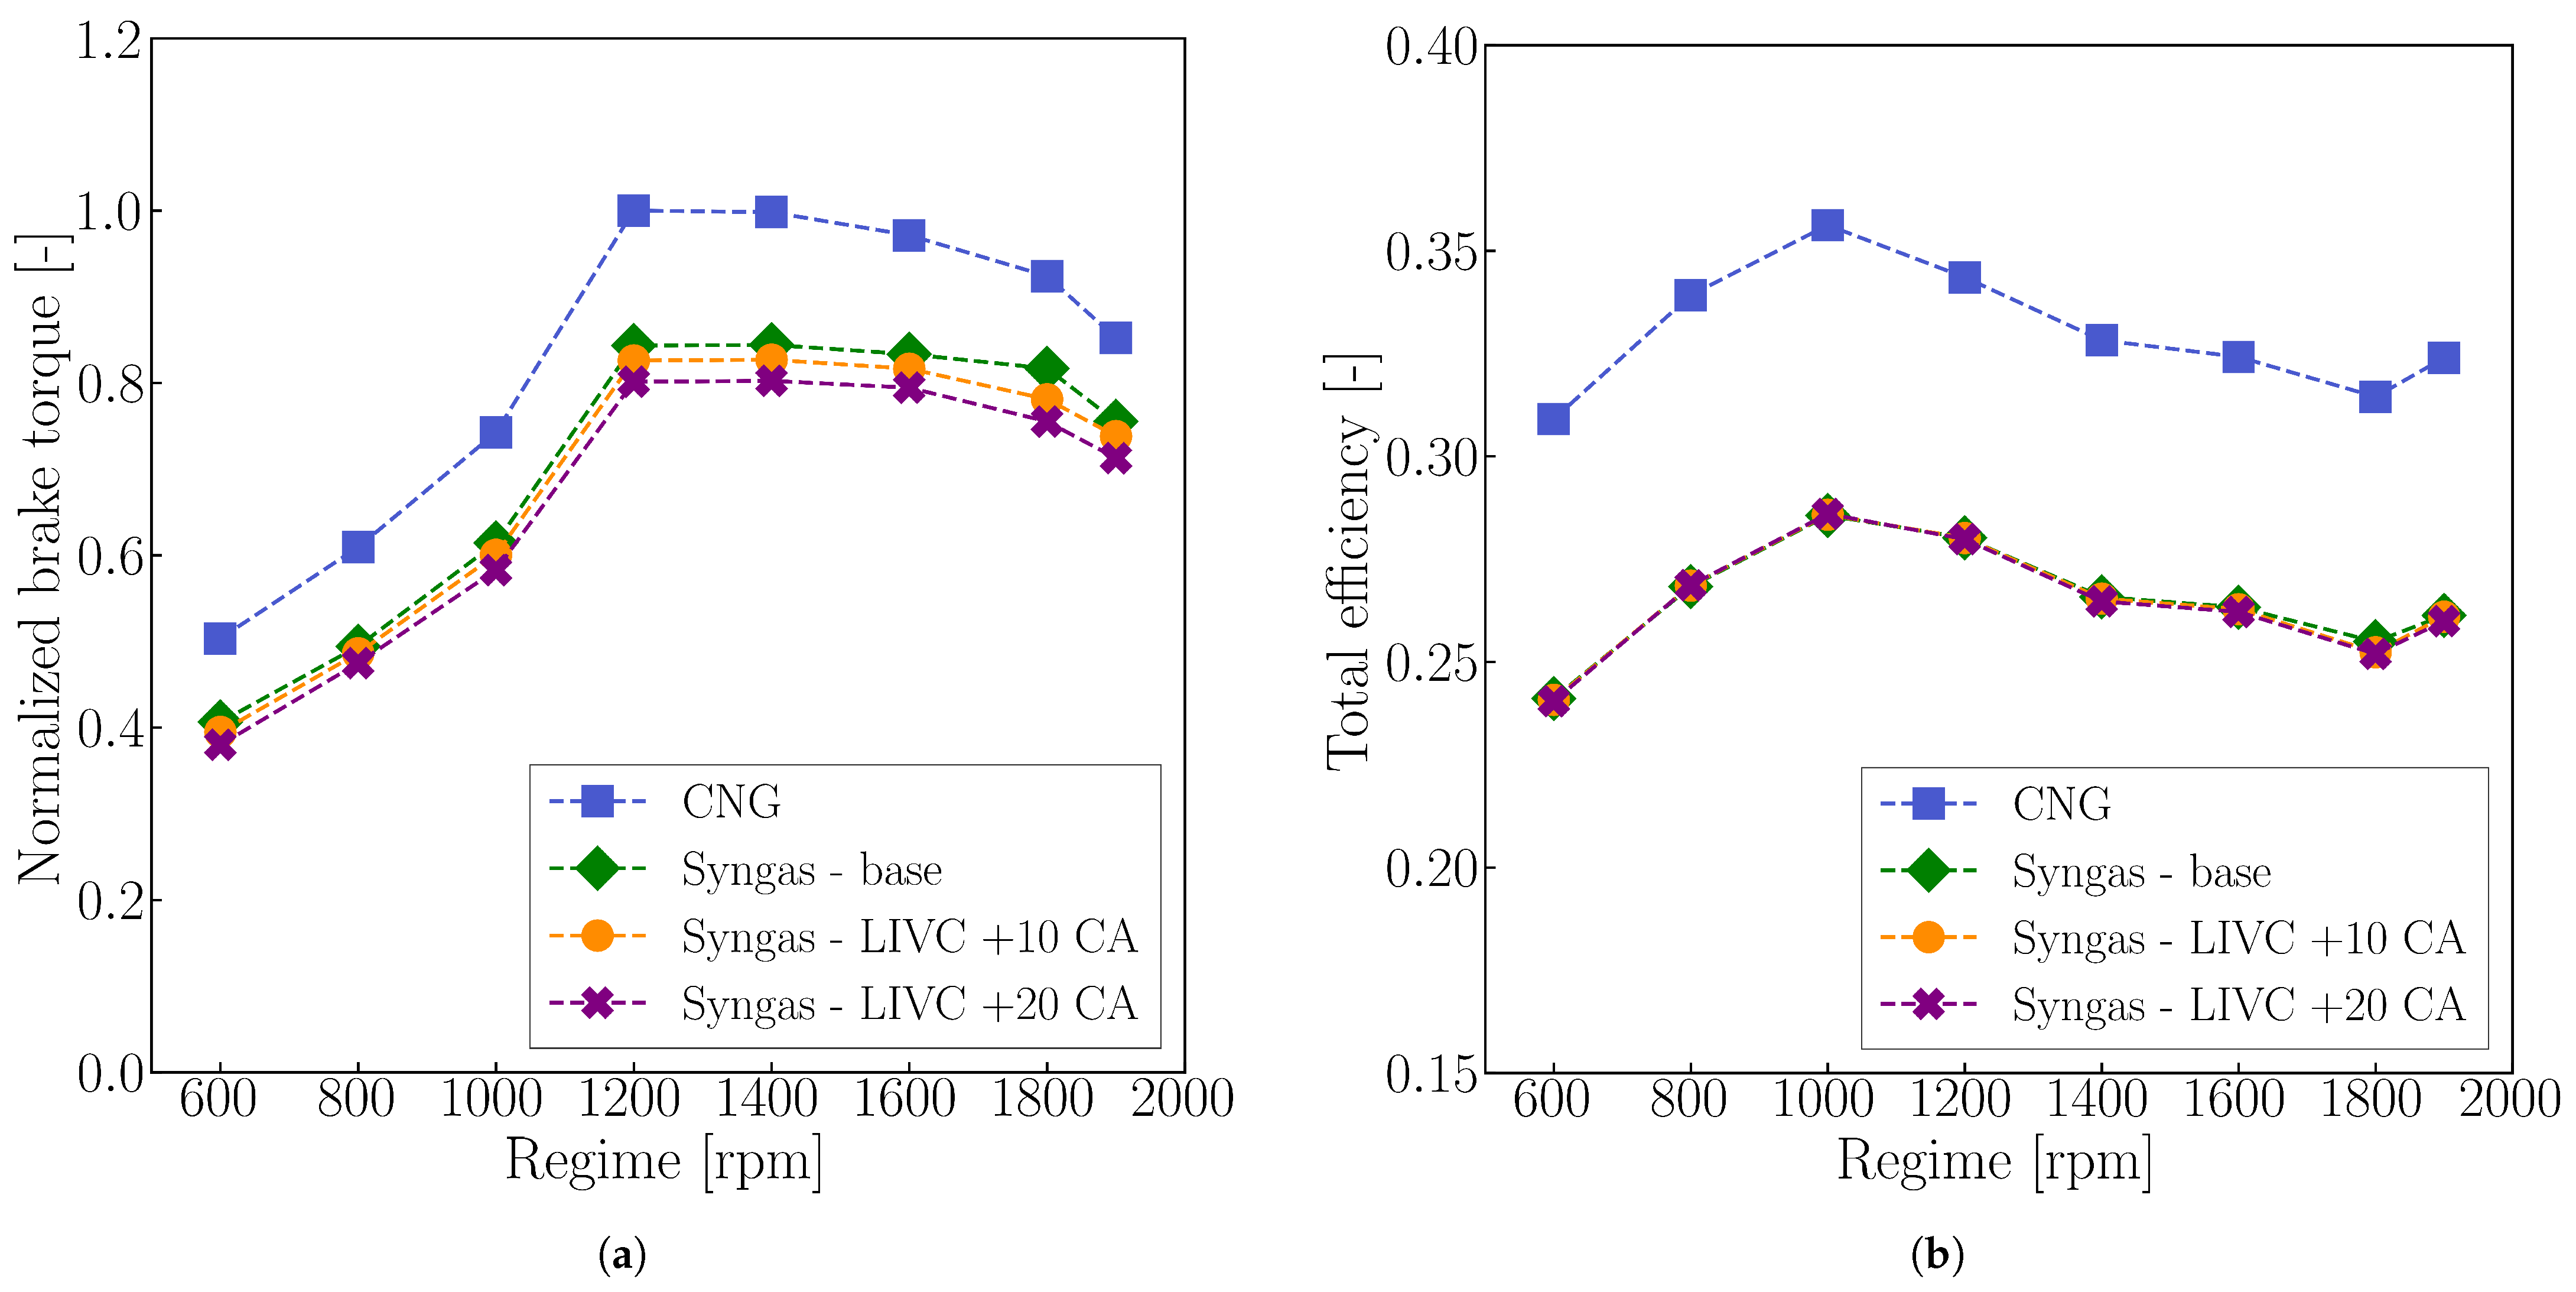
Figure 7a,b present the normalized brake torque and total efficiency obtained under full-load conditions for both LIVC cases, compared against the base syngas and CNG configurations.
Figure 7.
Comparison between computed values of normalized brake torque (a) and total efficiency (b) in full load conditions. Blue squares refer to the CNG configuration, and green diamonds to the base syngas engine. Orange circles identify the LIVC configuration delayed by 10 CA, while purple “x” marks the 20 CA one.
Figure 7b shows that delaying the IVC does not result in a significant improvement in total efficiency. Indeed, a slight efficiency reduction is observed at the highest engine speed for the Syngas − LIVC + 20 CA configuration.
On the other hand, the brake torque trends in Figure 7a exhibit the expected reduction associated with delayed IVC, due to the lower mass of fresh charge trapped inside the cylinder. Overall, pure LIVC strategies (i.e., changing only the valve phasing) were found not to be beneficial for engine performance, as they lead to a reduction in terms of brake torque, without an increase in total efficiency. It is expected that a coupled variation in boost pressure would result in overall better performance [60], which was not evaluated in this work.
4.2. Increase of Compression Ratio
Another strategy investigated in this study was the modification of the CR. Increasing the CR is generally associated with higher power output and improved thermal efficiency in SI PFI engines [61,62]. However, higher CRs also raise the peak in-cylinder pressures and temperatures, thereby increasing the propensity for knock.
Two configurations with elevated CR were examined—one with an increase of 2.5 units (CR = 14.5) and another with an increase of 5 units (CR = 17)—relative to the base value reported in Table 1. Considering the knock sensitivity discussed in Section 3.3, the SA values were slightly adjusted to prevent abnormal combustion at the higher CRs.
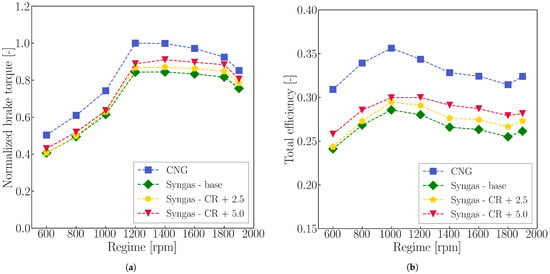
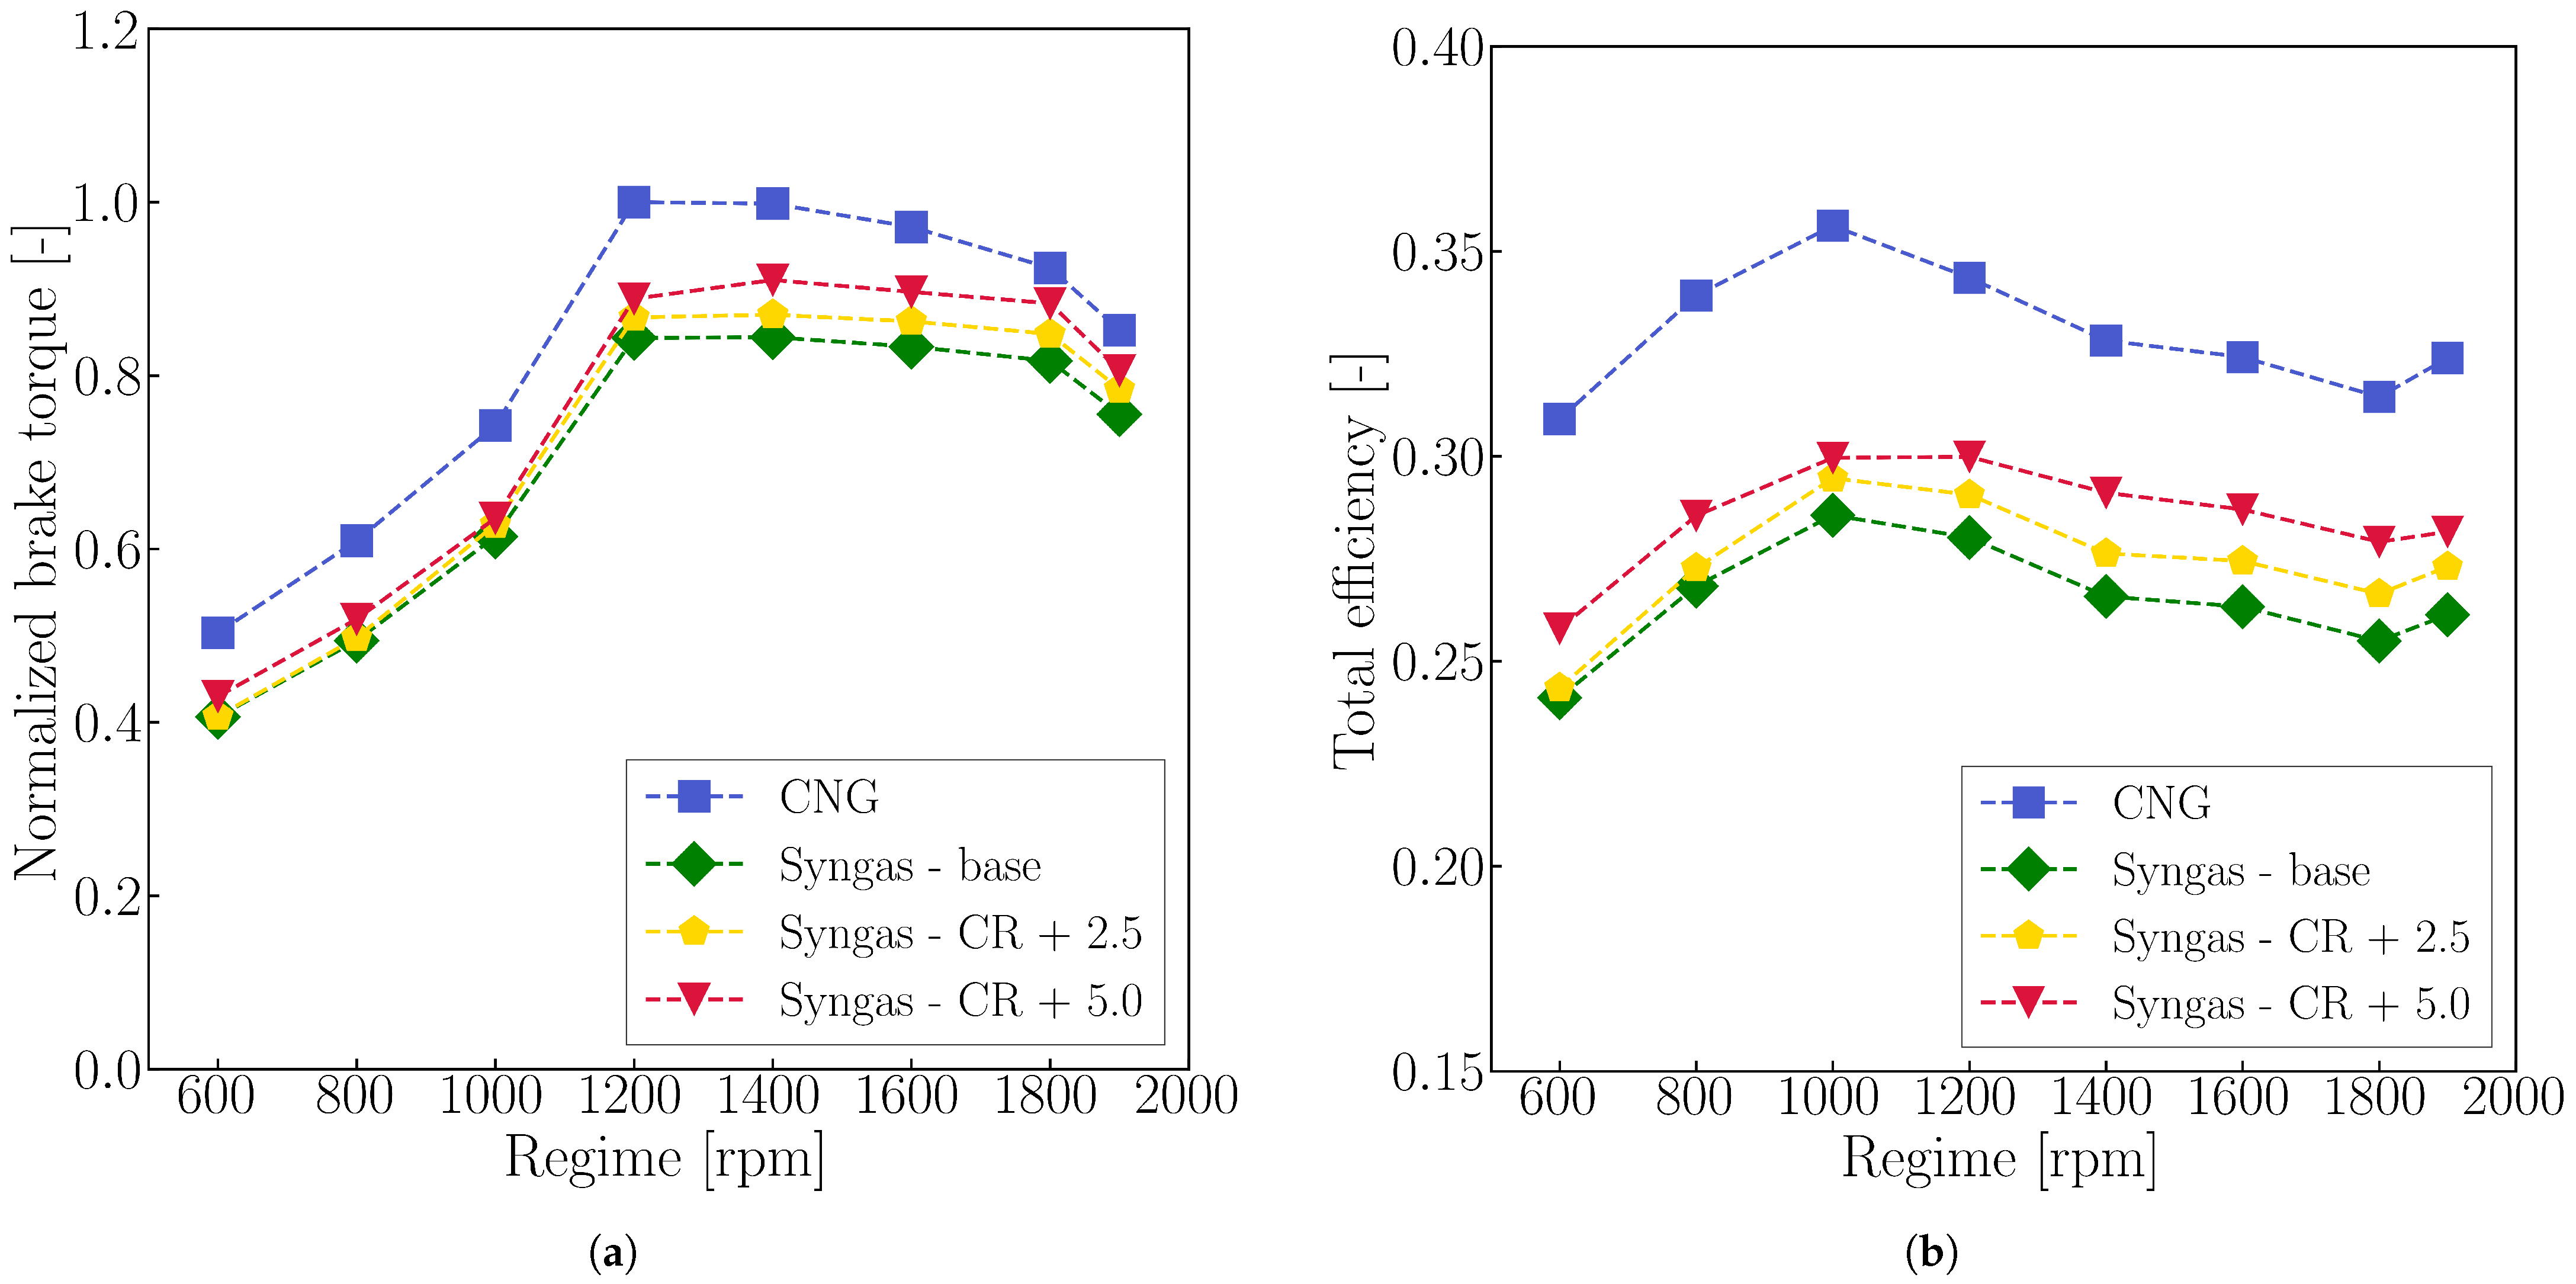
Figure 8a,b present the computed normalized brake torque and total efficiency for these higher-CR configurations, compared to both the base syngas engine and the original CNG reference.
Figure 8.
Comparison between computed values of normalized brake torque (a) and total efficiency (b) in full load conditions. Blue squares refer to the CNG configuration, and green diamonds to the Syngas − base engine. Yellow pentagons identify the Syngas − CR + 2.5 configuration, while red triangles the Syngas − CR + 5.0 one.
The impact of increasing the CR is evident across all operating conditions. Relative to the base syngas engine, the Syngas − CR + 2.5 (in yellow) configuration yields average increases of 3.3% in total efficiency and 2.5% in brake torque. Even greater improvements are observed for the Syngas − CR + 5.0 (in red) configuration, with average gains of 7.6% in total efficiency and 6.2% in brake torque.
It should be noted that higher CRs lead to elevated peak in-cylinder pressures, which may pose a risk of mechanical damage if not kept within acceptable limits. However, these were considerably lower than the one reported for the first syngas configuration considered (curves Syngas − CNG SA in Figure 5). Moreover, because the original engine derives from a HD diesel platform, which is designed to tolerate high thermal and mechanical loads, these peak pressure levels were deemed acceptable for the present study.
5. Syngas Engine Map
In this Section, a complete virtual engine map for the syngas engine is developed. The objective is to provide insights into engine performance and pollutant emissions suitable for use in well-to-wheel analyses of HD vehicles in real-life applications.
The base syngas configuration presented earlier was adopted as the starting point. This choice minimizes the complexity of the conversion from the original CNG engine by avoiding modifications to valve phasing or CR, as discussed in Section 4. For each engine speed, four load conditions (25/50/75/100%) were simulated. Load regulation was performed as follows:
- The WG valve was modulated via a PID controller to adjust boost pressure and meet the target load, until it reached the fully open position (i.e., the TC provided no boost);
- Once the WG valve was fully opened, a throttle valve controlled by a second PID loop was actuated to limit the air intake flow rate and achieve the desired power.
This strategy prioritizes the use of the TC for load control, thereby avoiding the pumping losses associated with throttling and preserving engine efficiency.
All simulated operating points were run at stoichiometric conditions () to ensure proper operation of the assumed TWC across the full engine map. Finally, the SA values used at full load were retained for all partial load conditions at each engine speed.
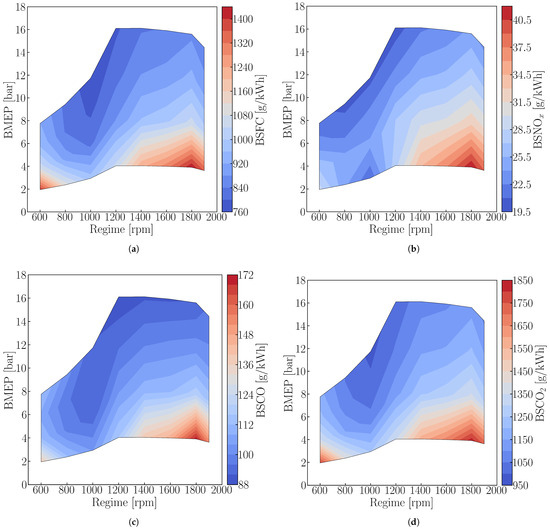
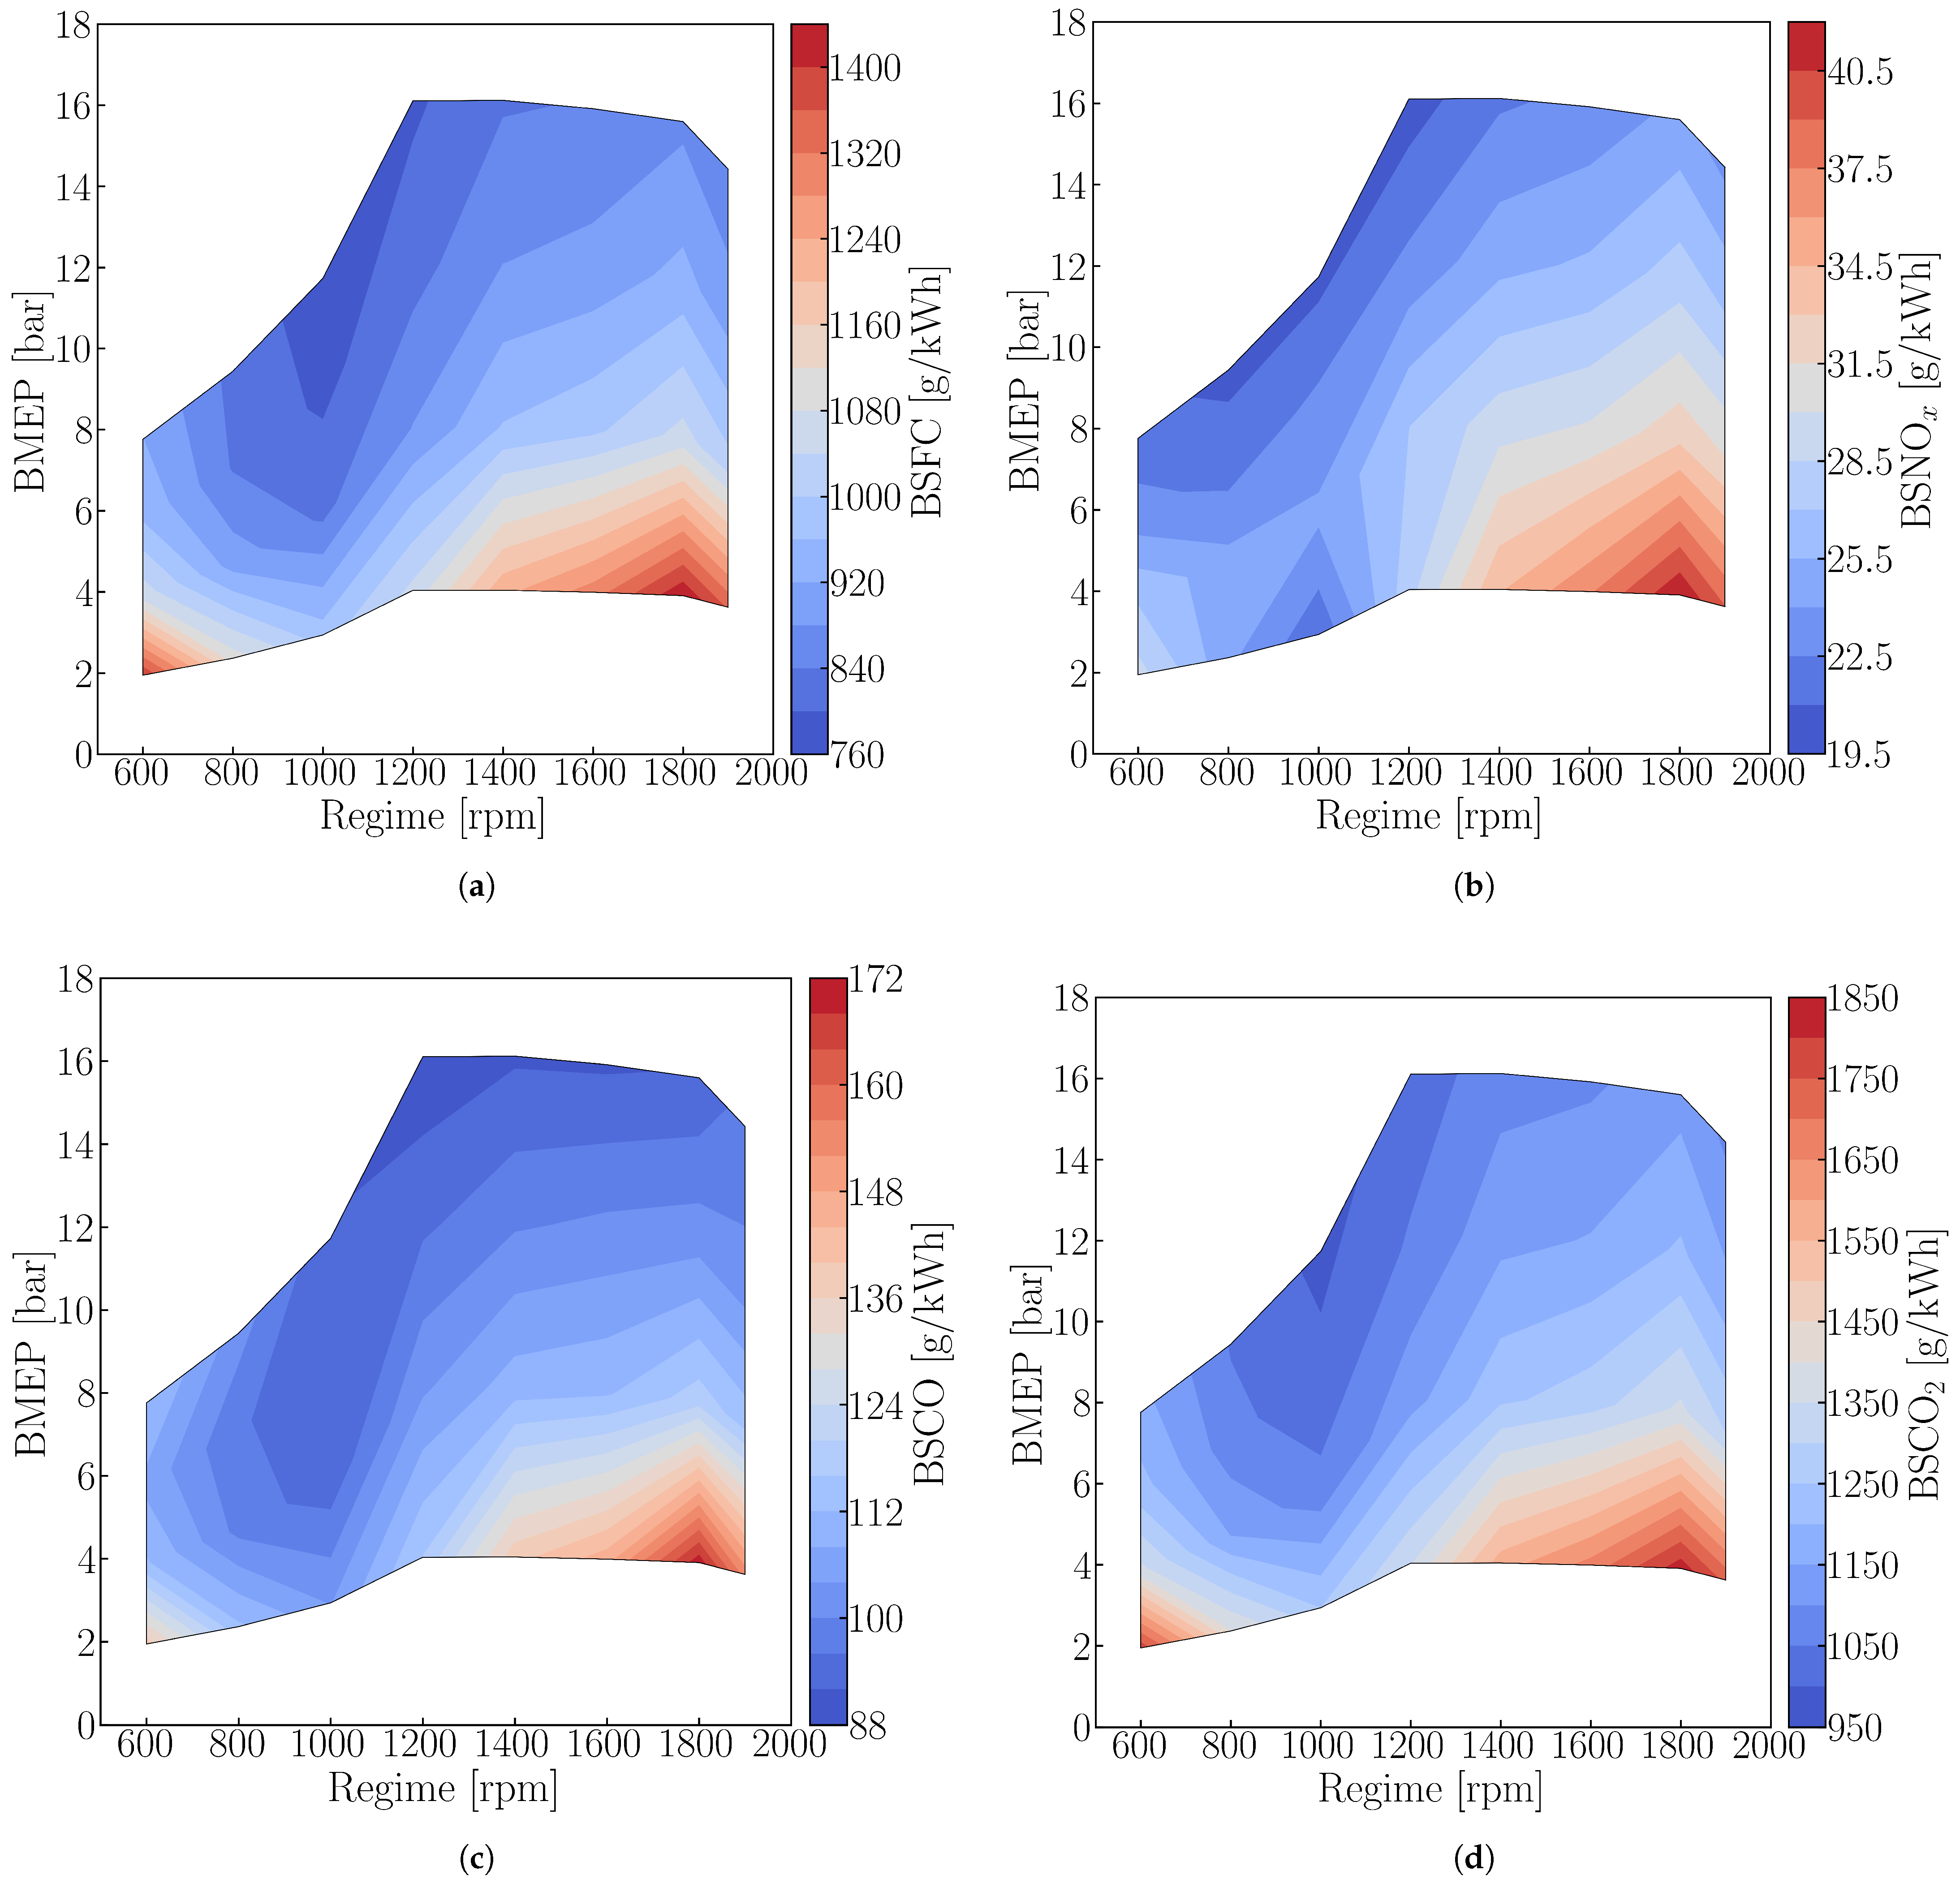
Results in terms of BSFC, BSNOx, BSCO and BSCO2 are reported in Figure 9a–d.
Figure 9.
Computed results of BSFC (a), BSNOx (b), BSCO (c), and BSCO2 (d) for the “base” syngas engine across the full engine map.
Starting from the BSFC graph (Figure 9a), it is clear that the highest values are at low Break Mean Effective Pressure (BMEP) (i.e., low loads), indicative of reduced engine efficiency. This behavior is directly linked to the use of the throttle valve in these operating conditions, which introduces pressure losses upstream of the compressor. Throttling was also required for the 600–1200 rpm and 600–800 rpm ranges at 50% and 75% load, respectively. In these cases, BSFC decreases with increasing engine speed due to the progressive opening of the throttle valve, which reduces pressure losses and consequently improves efficiency.
In the remaining operating conditions, load was regulated through WG valve modulation, which adjusts the boost pressure without introducing throttling losses. This strategy maintains BSFC within a relatively narrow range even at higher engine speeds. It is worth noting that efficiency reduces with engine speed, after the 1000–1200 rpm operating conditions. Notably, the 1800 rpm operating point consistently exhibits the highest BSFC among the high-speed regimes across all loads (i.e., least efficient operating condition).
Turning to Figure 9b, an increase in BSNOx is observed with rising engine speed in regions where the TC supplies boost (rightmost part of the map). The effect of the higher pressure at IVC leads to slightly elevated peak temperatures and, more importantly, higher reactant concentrations. Both factors enhance NOx formation pathways, thus leading to increased pollutant emissions.
Regarding BSCO, similar trends to the other pollutants are observed. Increasing values are visible with higher engine speed, with a more pronounced increase at low load. This can be linked to the corresponding rise in BSFC presented in Figure 9a. The molar concentration of CO at Exhaust Valve Opening (EVO) remains approximately 2% across nearly all operating points; thus, as engine efficiency deteriorates at higher speeds and lower loads, the relative emissions increase. This reasoning also applies to the BSCO2 trends presented in Figure 9d. Moreover, in this case, the molar concentration of CO2 at the exhaust was constant across the whole map since a stoichiometric air–fuel mixture was set as target. It is worth noting that the BSFC and BSCO2 maps are proportional to each other since the amount of CO2 produced in combustion relative to the fuel mass (mCO2, comb/mfuel depends solely on the fuel composition.
6. Conclusions
Syngas production from waste plastic pyrolysis is becoming an increasingly promising strategy to enhance waste management while promoting a circular economy. One potential application of syngas is its use as substitute of conventional fossil fuels in ICEs. However, the wide variability in syngas composition, chemical, and thermo-physical properties complicates experimental assessments of the feasibility and implications of such a conversion on key engine characteristics. For this reason, this work develops a numerical modeling framework to assess performance and emission changes associated with converting an existing ICE to syngas operation.
A validated 1D model of a HD SI engine originally fueled with CNG was adapted to operate on H2-rich syngas produced from plastic pyrolysis (55% CO and 45% H2, molar basis). Port fuel injection targeted stoichiometric conditions () to maximize the power output and ensure compatibility with a TWC, which was not explicitly modeled. To capture syngas-specific combustion characteristics, a tabulated LFS approach was implemented, while retaining the remaining combustion sub-models of the CNG engine.
Full-load simulations with the original SA revealed abnormal combustion, predicted through a TKI method, requiring an average SA increase of 8 CA to avoid knock. With the adjusted SA, the syngas-fueled engine exhibited average reductions of 15% in brake torque and 6% in total efficiency. Two parametric strategies were then explored to improve performance. Late Intake Valve Closing, with delays of 10 CA and 20 CA, led to further torque reductions with negligible efficiency effects, whereas increasing the CR by 2.5 and 5 points improved both torque and efficiency, albeit with additional SA adjustments where required.
Finally, a full virtual engine map of the base syngas configuration was generated, providing Brake Specific Fuel Consumption and emissions in terms of NOx, CO, and CO2 under realistic operating conditions. Results show the feasibility of converting the original HD CNG engine to hydrogen-rich syngas across its original range of operating conditions, although presenting performance penalties for the full load cases. This aspect may limit the applicability of such conversion, depending on the specific application and operating strategy. Nonetheless, this non-conventional fuel can be used in existing engines, providing a potentially more sustainable and environmentally friendly alternative to fossil fuels, which could be verified via a life-cycle assessment. In addition, the proposed modeling framework enables systematic evaluation of the impact of syngas composition on engine performance, accounting for fuel-specific properties such as LFS and knock tendency, which is of specific relevance when assessing the feasibility of converting existing ICEs.
Author Contributions
A.B.: conceptualization, methodology, formal analysis, visualization, software, validation, writing—original draft preparation, and review and editing. T.L.: conceptualization, funding acquisition, resources, supervision, and writing—review and editing. All authors have read and agreed to the published version of the manuscript.
Funding
This research was funded by the “Ecosystem for Sustainable Transition in Emilia-Romagna” project funded by the European Union under the National Recovery and Resilience Plan (NRRP), Mission 04 Component 2 Investment 1.5 NextGenerationEU. Call for tender n. 3277, Award Number: 0001052.
Data Availability Statement
The original contributions presented in this study are included in the article. Further inquiries can be directed to the corresponding authors.
Conflicts of Interest
The authors declare no conflicts of interest.
Definitions and Acronyms
| Definitions | |
| Stoichiometric air-to-fuel ratio | |
| Equivalence ratio | |
| Specific heat ratio | |
| c | Normalized progress variable |
| Normalized reaction rate | |
| Constant-volume specific heat | |
| Constant-pressure specific heat | |
| p | Pressure |
| V | Volume |
| Acronyms | |
| 0D | Zero-Dimensional |
| 1D | One-Dimensional |
| AHRR | Apparent Heat Release Rate |
| aTDC | after Top Dead left |
| BMEP | Brake Mean Effective Pressure |
| BSFC | Brake Specific Fuel Consumption |
| BSCO2 | Brake Specific Carbon Dioxide |
| BSCO | Brake Specific Carbon Monoxide |
| BSNOx | Brake-Specific Nitrogen Oxides |
| BMF50 | Burnt Mass Fraction 50 |
| CA | Crank Angle |
| CI | Compression Ignition |
| CFD | Computational Fluid Dynamic |
| CHP | Combined Heat and Power |
| CNG | Compressed Natural Gas |
| CR | Compression Ratio |
| DME | Dimethyl-Ether |
| EGR | Exhaust Gas Recirculation |
| EVO | Exhaust Valve Opening |
| HD | Heavy-Duty |
| HRR | Heat Release Rate |
| IC | Intercooler |
| ICE | Internal Combustion Engine |
| ID | Ignition Delay |
| IVC | Intake Valve Closing |
| LFS | Laminar Flame Speed |
| LHV | Lower Heating Value |
| NPT | Normal Pressure and Temperature |
| PFI | Port Fuel Injection |
| PV | Progress Variable |
| RON | Research Octane Number |
| SA | Spark Advance |
| SI | Spark Ignition |
| TC | Turbo-Charger |
| TKI | Tabulated Kinetic of Ignition |
| TWC | Three-Way Catalyst |
| VE | Volumetric Efficiency |
| WG | Wastegate |
References
- Dokl, M.; Copot, A.; Krajnc, D.; Fan, Y.V.; Vujanović, A.; Aviso, K.B.; Tan, R.R.; Kravanja, Z.; Čuček, L. Global projections of plastic use, end-of-life fate and potential changes in consumption, reduction, recycling and replacement with bioplastics to 2050. Sustain. Prod. Consum. 2024, 51, 498–518. [Google Scholar] [CrossRef] [Scilit]
- OECD. Global Plastics Outlook: Economic Drivers, Environmental Impacts and Policy Options; OECD Publishing: Paris, France, 2022. [Google Scholar] [CrossRef] [Scilit]
- Li, Z.; Fan, T.W.; Lun, M.S.; Li, Q. Optimization of municipal solid waste incineration for low-NOx emissions through numerical simulation. Sci. Rep. 2024, 14, 19309. [Google Scholar] [CrossRef] [Scilit] [PubMed]
- Yang, Z.; Lü, F.; Zhang, H.; Wang, W.; Shao, L.; Ye, J.; He, P. Is incineration the terminator of plastics and microplastics? J. Hazard. Mater. 2021, 401, 123429. [Google Scholar] [CrossRef] [Scilit]
- Shen, M.; Hu, T.; Huang, W.; Song, B.; Qin, M.; Yi, H.; Zeng, G.; Zhang, Y. Can incineration completely eliminate plastic wastes? An investigation of microplastics and heavy metals in the bottom ash and fly ash from an incineration plant. Sci. Total Environ. 2021, 779, 146528. [Google Scholar] [CrossRef] [Scilit]
- Andooz, A.; Eqbalpour, M.; Kowsari, E.; Ramakrishna, S.; Ansari Cheshmeh, Z. A comprehensive review on pyrolysis from the circular economy point of view and its environmental and social effects. J. Clean. Prod. 2023, 388, 136021. [Google Scholar] [CrossRef] [Scilit]
- Kumar, M.; Bhujbal, S.K.; Kohli, K.; Prajapati, R.; Sharma, B.K.; Sawarkar, A.D.; Abhishek, K.; Bolan, S.; Ghosh, P.; Kirkham, M.; et al. A review on value-addition to plastic waste towards achieving a circular economy. Sci. Total Environ. 2024, 921, 171106. [Google Scholar] [CrossRef] [Scilit]
- Miandad, R.; Barakat, M.A.; Aburiazaiza, A.S.; Rehan, M.; Ismail, I.M.I.; Nizami, A.S. Effect of plastic waste types on pyrolysis liquid oil. Int. Biodeterior. Biodegrad. 2017, 119, 239–252. [Google Scholar] [CrossRef] [Scilit]
- Wan, K.; Chen, H.; Li, P.; Duan, D.; Niu, B.; Zhang, Y.; Long, D. Thermo-catalytic conversion of waste plastics into surrogate fuels over spherical activated carbon of long-life durability. Waste Manag. 2022, 148, 1–11. [Google Scholar] [CrossRef] [Scilit]
- Li, Y.; Nahil, M.A.; Williams, P.T. Hydrogen/Syngas Production from Different Types of Waste Plastics Using a Sacrificial Tire Char Catalyst via Pyrolysis–Catalytic Steam Reforming. Energy Fuels 2023, 37, 6661–6673. [Google Scholar] [CrossRef] [Scilit]
- Zou, J.; Zhao, L.; Hu, Q.; Yao, D.; Yang, H. Pyrolysis and catalytic reforming of disposable plastic waste for syngas production with adjustable H2/CO ratio. Appl. Energy 2024, 362, 122844. [Google Scholar] [CrossRef] [Scilit]
- Wang, S.; Sun, Y.; Shan, R.; Gu, J.; Huhe, T.; Ling, X.; Yuan, H.; Chen, Y. Polypropylene pyrolysis and steam reforming over Fe-based catalyst supported on activated carbon for the production of hydrogen-rich syngas. Carbon Resour. Convers. 2023, 6, 173–182. [Google Scholar] [CrossRef] [Scilit]
- Farzad, S.; Mandegari, M.A.; Görgens, J.F. A critical review on biomass gasification, co-gasification, and their environmental assessments. Biofuel Res. J. 2016, 3, 483–495. [Google Scholar] [CrossRef] [Scilit]
- Jothiprakash, G.; Balasubramaniam, P.; Sundaram, S.; Ramesh, D. Catalytic Biomass Gasification for Syngas Production: Recent Progress in Tar Reduction and Future Perspectives. Biomass 2025, 5, 37. [Google Scholar] [CrossRef] [Scilit]
- Bachmann, M.; Völker, S.; Kleinekorte, J.; Bardow, A. Syngas from What? Comparative Life-Cycle Assessment for Syngas Production from Biomass, CO2, and Steel Mill Off-Gases. ACS Sustain. Chem. Eng. 2023, 11, 5356–5366. [Google Scholar] [CrossRef] [Scilit]
- Singh, D.; Raizada, A.; Yadav, S. Syngas production from fast pyrolysis and steam gasification of mixed food waste. Waste Manag. Res. 2022, 40, 1669–1675. [Google Scholar] [CrossRef] [Scilit]
- Detz, R.; Beerse, M.; Meulendijks, N.; Buskens, P.; van der Zwaan, B. Towards the Use of Renewable Syngas for the Decarbonization of Industry. ChemSusChem 2024, 17, e202400059. [Google Scholar] [CrossRef] [Scilit]
- Acquarola, C.; Bhatelia, T.; Pareek, V.; Ao, M.; Shah, M.T. Optimized Process for Methanol Production via Bi-reforming Syngas. Ind. Eng. Chem. Res. 2022, 61, 5557–5567. [Google Scholar] [CrossRef] [Scilit]
- Giuliano, A.; Freda, C.; Catizzone, E. Techno-Economic Assessment of Bio-Syngas Production for Methanol Synthesis: A Focus on the Water–Gas Shift and Carbon Capture Sections. Bioengineering 2020, 7, 70. [Google Scholar] [CrossRef] [Scilit]
- Sudiro, M.; Bertucco, A. Production of synthetic gasoline and diesel fuel by alternative processes using natural gas and coal: Process simulation and optimization. Energy 2009, 34, 2206–2214. [Google Scholar] [CrossRef] [Scilit]
- Mahboob, S.; Tahir, K.; Ali, S.; Liaqat, I.; Aftab, N.; Mahboob, S.; Tahir, K.; Ali, S.; Liaqat, I.; Aftab, N. Development of Syngas Using Feedstock for the Replacement of Expensive Energy Resources. In Research Advances in Syngas; IntechOpen: London, UK, 2023. [Google Scholar] [CrossRef] [Scilit]
- Uddin, M.B.; Rasul, M.G.; Chowdhury, A.A.; Hassan, N.M.S. Hydrogen production from plastic waste pyrolysis syngas: A review on progresses and challenges. Int. J. Hydrogen Energy 2025, 158, 150512. [Google Scholar] [CrossRef] [Scilit]
- Baratieri, M.; Baggio, P.; Bosio, B.; Grigiante, M.; Longo, G. The use of biomass syngas in IC engines and CCGT plants: A comparative analysis. Appl. Therm. Eng. 2009, 29, 3309–3318. [Google Scholar] [CrossRef] [Scilit]
- Lee, T.; Cha, H.; Lee, S.; Lee, J.; Kwon, E.E. Production of CO-rich syngas through CO2-Mediated pyrolysis of plastic waste and its practical use for power generation. Energy 2025, 319, 135053. [Google Scholar] [CrossRef] [Scilit]
- Salem, A.M.; Dhami, H.S.; Paul, M.C. Syngas Production and Combined Heat and Power from Scottish Agricultural Waste Gasification—A Computational Study. Sustainability 2022, 14, 3745. [Google Scholar] [CrossRef] [Scilit]
- Paykani, A.; Chehrmonavari, H.; Tsolakis, A.; Alger, T.; Northrop, W.F.; Reitz, R.D. Synthesis gas as a fuel for internal combustion engines in transportation. Prog. Energy Combust. Sci. 2022, 90, 100995. [Google Scholar] [CrossRef] [Scilit]
- Fiore, M.; Magi, V.; Viggiano, A. Internal combustion engines powered by syngas: A review. Appl. Energy 2020, 276, 115415. [Google Scholar] [CrossRef] [Scilit]
- Mustafi, N.; Miraglia, Y.; Raine, R.; Bansal, P.; Elder, S. Spark-ignition engine performance with ‘Powergas’ fuel (mixture of CO/H2): A comparison with gasoline and natural gas. Fuel 2006, 85, 1605–1612. [Google Scholar] [CrossRef] [Scilit]
- Martinez-Boggio, S.; Lacava, P.T.; de Carvalho, F.S.; Curto-Risso, P. Combustion Diagnosis in a Spark-Ignition Engine Fueled with Syngas at Different CO/H2 and Diluent Ratios. Gases 2024, 4, 97–116. [Google Scholar] [CrossRef] [Scilit]
- Ayuso-Díaz, I.; Perez-Gil, S.; Lopez, G.; Santamaria, L.; Antoñanzas-González, F.J. Progress on waste plastics gasification process: A review of operating conditions, reactors and catalysts for clean syngas production and tar abatement. Int. J. Hydrogen Energy 2025, 148, 150000. [Google Scholar] [CrossRef] [Scilit]
- Pessina, V.; D’Adamo, A.; Iacovano, C.; Fontanesi, S.; Martinez, S.; Lacava, P. Numerical Simulation of Syngas Blends Combustion in a Research Single-Cylinder Engine. In Proceedings of the 14th International Conference on Engines & Vehicles; Technical Report; SAE International: Warrendale, PA, USA, 2019. [Google Scholar] [CrossRef] [Scilit]
- Caputo, C.; Cirillo, D.; Costa, M.; Blasio, G.D.; Palma, M.D.; Piazzullo, D.; Vujanović, M. Multi-Level Modeling of Real Syngas Combustion in a Spark Ignition Engine and Experimental Validation. In Proceedings of the 14th International Conference on Engines & Vehicles; Technical Report; SAE International: Warrendale, PA, USA, 2019. [Google Scholar] [CrossRef] [Scilit]
- Ballerini, A.; Lucchini, T.; Onorati, A. Numerical Assessment of a Heavy-Duty (HD) Spark Ignition (SI) Biogas Engine. Energies 2025, 18, 51. [Google Scholar] [CrossRef] [Scilit]
- Ballerini, A.; Cerri, T.; Marinoni, A.M.; Onorati, A. Advances in 1D thermo-fluid dynamic simulation of SI hydrogen-fueled engine. J. Phys. Conf. Ser. 2022, 2385, 012055. [Google Scholar] [CrossRef] [Scilit]
- McBride, J. Coefficients for Calculating Thermodynamic and Transport Properties of Individual Species; National Aeronautics and Space Administration: Cleveland, OH, USA, 1993.
- Verhelst, S.; Sheppard, C. Multi-zone thermodynamic modelling of spark-ignition engine combustion—An overview. Energy Convers. Manag. 2009, 50, 1326–1335. [Google Scholar] [CrossRef] [Scilit]
- Tabaczynski, R.J.; Ferguson, C.R.; Radhakrishnan, K.B. A Turbulent Entrainment Model for Spark-Ignition Engine Combustion; SAE Technical Paper 770647; SAE International: Warrendale, PA, USA, 1977. [Google Scholar]
- D’Errico, G. Prediction of the combustion process and emission formation of a bi-fuel s.i. engine. Energy Convers. Manag. 2008, 49, 3116–3128. [Google Scholar] [CrossRef] [Scilit]
- Fogla, N.; Bybee, M.; Mirzaeian, M.; Millo, F.; Wahiduzzaman, S. Development of a K-k-ϵ Phenomenological Model to Predict In-Cylinder Turbulence. SAE Int. J. Engines 2017, 10, 562–575. [Google Scholar] [CrossRef] [Scilit]
- Miller, R.; Davis, G.; Lavoie, G.; Newman, C.; Gardner, T. A Super-Extended Zel’dovich Mechanism for No x Modeling and Engine Calibration. SAE Trans. 1998, 107, 1090–1100. [Google Scholar]
- Horlock, J.H.; Winterbone, D.E. The Thermodynamics and Gas Dynamics of Internal-Combustion Engines; Oxford University Press: New York, NY, USA, 1985; Volume II. [Google Scholar]
- Catalysts for Hydrogen Rich Syngas Production from Pyrolysis of Non-Recyclable Plastic Waste Materials. Available online: https://ecosister.it/progetti/catalysts-for-hydrogen-rich-syngas-production-from-pyrolysis-of-non-recyclable-plastic-waste-materials/ (accessed on 12 January 2026).
- Pradhan, A.; Baredar, P.; Kumar, A. Syngas as An Alternative Fuel Used in Internal Combustion Engines: A Review. J. Pure Appl. Sci. Technol. 2011, 5, 51–66. [Google Scholar]
- Han, W.; Dai, P.; Gou, X.; Chen, Z. A review of laminar flame speeds of hydrogen and syngas measured from propagating spherical flames. Appl. Energy Combust. Sci. 2020, 1–4, 100008. [Google Scholar] [CrossRef] [Scilit]
- Bradley, D.; Gaskell, P.H.; Gu, X.J. Burning Velocities, Markstein Lengths, and Flame Quenching for Spherical Methane-Air Flames: A Computational Study. Combust. Flame 1996, 104, 176–198. [Google Scholar] [CrossRef] [Scilit]
- Peters, N.; Rogg, B. Reduced Kinetic Mechanisms for Applications in Combustion Systems; Springer Science & Business Media: Berlin/Heidelberg, Germany, 2008. [Google Scholar]
- Cracknell, R.; Prakash, A.; Head, R. Influence of Laminar Burning Velocity on Performance of Gasoline Engines. In Proceedings of the SAE 2012 International Powertrains, Fuels & Lubricants Meeting; Technical Report; SAE International: Warrendale, PA, USA, 2012. [Google Scholar] [CrossRef] [Scilit]
- Zhou, L.; Zhang, X.; Zhong, L.; Yu, J. Effects of Flame Propagation Velocity and Turbulence Intensity on End-Gas Auto-Ignition in a Spark Ignition Gasoline Engine. Energies 2020, 13, 5039. [Google Scholar] [CrossRef] [Scilit]
- Lee, H.C.; Jiang, L.Y.; Mohamad, A.A. A review on the laminar flame speed and ignition delay time of Syngas mixtures. Int. J. Hydrogen Energy 2014, 39, 1105–1121. [Google Scholar] [CrossRef] [Scilit]
- Rabello de Castro, R.; Brequigny, P.; Dufitumukiza, J.P.; Mounaïm-Rousselle, C. Laminar flame speed of different syngas compositions for varying thermodynamic conditions. Fuel 2021, 301, 121025. [Google Scholar] [CrossRef] [Scilit]
- Goodwin, D.G.; Moffat, H.K.; Schoegl, I.; Speth, R.L.; Weber, B.W. Cantera: An Object-Oriented Software Toolkit for Chemical Kinetics, Thermodynamics, and Transport Processes, Version 3.2.0. Zenodo. 17 November 2025. Available online: https://www.cantera.org (accessed on 12 January 2026). [CrossRef]
- Bagheri, G.; Ranzi, E.; Pelucchi, M.; Parente, A.; Frassoldati, A.; Faravelli, T. Comprehensive kinetic study of combustion technologies for low environmental impact: MILD and OXY-fuel combustion of methane. Combust. Flame 2020, 212, 142–155. [Google Scholar] [CrossRef] [Scilit]
- Amirante, R.; Distaso, E.; Tamburrano, P.; Reitz, R.D. Laminar flame speed correlations for methane, ethane, propane and their mixtures, and natural gas and gasoline for spark-ignition engine simulations. Int. J. Engine Res. 2017, 18, 951–970. [Google Scholar] [CrossRef] [Scilit]
- Tamborski, M.; D’Errico, G.; Lucchini, T.; Cerri, T.; Onorati, A. A Constant Equivalence Ratio Multi-Zone Approach for a Detailed and Fast Prediction of Performances and Emission in CI Engines. SAE Int. J. Adv. Curr. Pract. Mobil. 2022, 4, 1815–1827. [Google Scholar] [CrossRef] [Scilit]
- Ballerini, A.; D’Errico, G.; Onorati, A.; Tamborski, M. Extension and Validation of a Constant Equivalence Ratio Multi-Zone Approach to DME Combustion in Vessels and CI Engines; SAE Technical Paper 2023-01-0193; SAE International: Warrendale, PA, USA, 2023. [Google Scholar] [CrossRef] [Scilit]
- Lucchini, T.; D’Errico, G.; Onorati, A.; Frassoldati, A.; Stagni, A.; Hardy, G. Modeling Non-Premixed Combustion Using Tabulated Kinetics and Different Fame Structure Assumptions. SAE Int. J. Engines 2017, 10, 593–607. [Google Scholar] [CrossRef] [Scilit]
- Ma, F.; Wang, Y.; Wang, J.; Ding, S.; Wang, Y.; Zhao, S. Effects of Combustion Phasing, Combustion Duration, and Their Cyclic Variations on Spark-Ignition (SI) Engine Efficiency. Energy Fuels 2008, 22, 3022–3028. [Google Scholar] [CrossRef] [Scilit]
- Zhu, G.G.; Daniels, C.F.; Winkelman, J. MBT Timing Detection and Its Closed-Loop Control Using In-Cylinder Pressure Signal; Technical Report 2003-01-3266; SAE Technical Paper; SAE International: Warrendale, PA, USA, 2003. [Google Scholar] [CrossRef] [Scilit]
- Heywood, J. Internal Combustion Engine Fundamentals; McGraw-Hill Education: Columbus, OH, USA, 2018. [Google Scholar]
- Li, T.; Gao, Y.; Wang, J.; Chen, Z. The Miller cycle effects on improvement of fuel economy in a highly boosted, high compression ratio, direct-injection gasoline engine: EIVC vs. LIVC. Energy Convers. Manag. 2014, 79, 59–65. [Google Scholar] [CrossRef] [Scilit]
- Pandey, J.K.; Kumar, G.N. Effect of variable compression ratio and equivalence ratio on performance, combustion and emission of hydrogen port injection SI engine. Energy 2022, 239, 122468. [Google Scholar] [CrossRef] [Scilit]
- Attard, W.P.; Konidaris, S.; Hamori, F.; Toulson, E.; Watson, H.C. Compression Ratio Effects on Performance, Efficiency, Emissions and Combustion in a Carbureted and PFI Small Engine. In Asia Pacific Automotive Engineering Conference; Technical Report; SAE International: Warrendale, PA, USA, 2007. [Google Scholar] [CrossRef] [Scilit]

Disclaimer/Publisher’s Note: The statements, opinions and data contained in all publications are solely those of the individual author(s) and contributor(s) and not of MDPI and/or the editor(s). MDPI and/or the editor(s) disclaim responsibility for any injury to people or property resulting from any ideas, methods, instructions or products referred to in the content. |
© 2026 by the authors. Licensee MDPI, Basel, Switzerland. This article is an open access article distributed under the terms and conditions of the Creative Commons Attribution (CC BY) license.