Article

Effectiveness of Electrokinetic EOR on Gas Condensate Banking Treatment—Proxy Modelling and Optimization


1
Centre for Energy Efficient and Sustainable Technologies, Brunel University, Uxbridge UB8 3PH, UK
2
Protium Energy Solutions Ltd., Mildenhall IP28 7DE, UK
3
Department of Petroleum Engineering, Federal University of Technology Owerri, Owerri PMB 1526, Imo State, Nigeria
4
School of Computing Engineering and Design Technologies, Teesside University, Tees Valley, Middlesbrough TS1 3BX, UK
*
Author to whom correspondence should be addressed.
Gases 2026, 6(1), 16; https://doi.org/10.3390/gases6010016
Submission received: 14 November 2025 / Revised: 12 January 2026 / Accepted: 4 February 2026 / Published: 18 March 2026
(This article belongs to the Topic Petroleum and Gas Engineering, 2nd edition)

Abstract

Gas condensate banking can significantly reduce near-well gas productivity by as much as ~60% in tight gas reservoirs. Existing treatment techniques are resource demanding and could alter the reservoir structure permanently. This study investigates the effectiveness of enhanced electrokinetic oil recovery (EK-EOR) as a low-impact alternative for treating condensate banks. Using compositional reservoir simulation (CMG GEM), the influence of key reservoir and operational parameters—porosity, permeability, producer well location (i, j), injection rate, and injection pressure—on cumulative gas production (CGP) was examined. A Box–Behnken design of experiments was employed to generate 62 simulation runs, and a proxy model was developed to approximate full-field responses. Statistical validation showed strong model fidelity (R2 = 0.99, AAPE = 2.2%). The proxy was then optimized using a genetic algorithm (GA) to identify conditions that maximize gas recovery. Results indicate that lower injection rates and lower injection pressures maximize CGP through enhanced electro-osmotic flow and reduced water blocking, achieving a peak cumulative gas of 4.06 × 108 ft3. A secondary optimum at high injection pressure could be attributed to re-pressurization and partial re-vaporization of condensate near the wellbore. Reservoir quality also exerted a strong control: higher permeability and moderate porosity favoured gas yield, while optimal producer placement near the reservoir boundary increased drainage efficiency. This study demonstrates a systematic optimization framework combining design of experiments, proxy modelling, and evolutionary algorithms to evaluate EK-EOR performance.

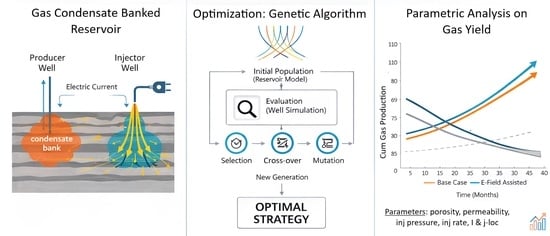
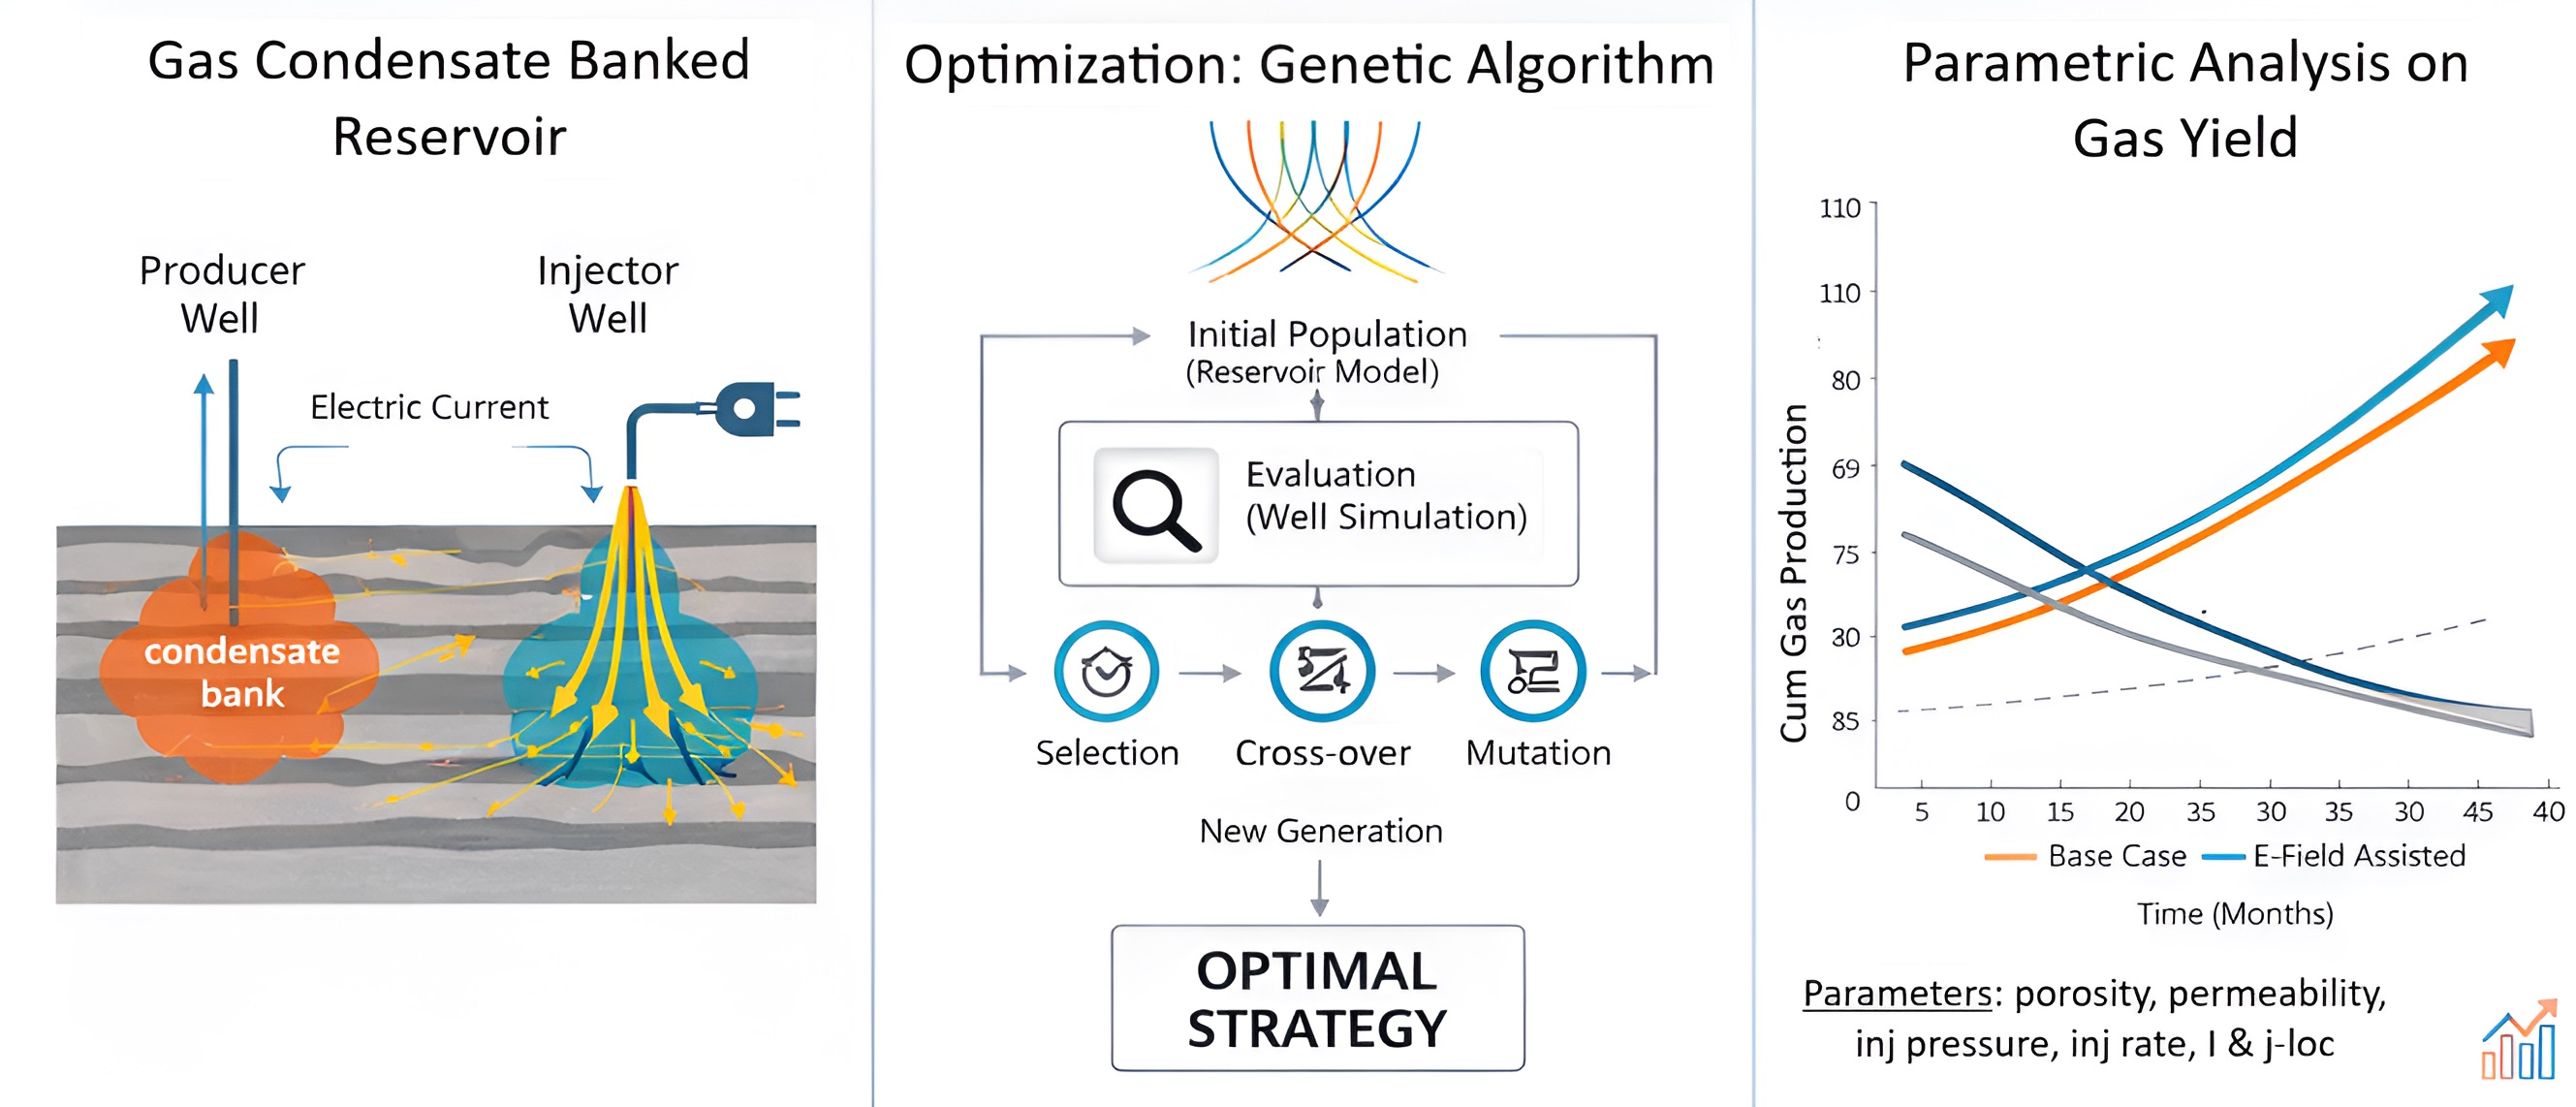
Graphical Abstract

1. Introduction

Below dewpoint pressure, liquid condensate drops out of the gas phase and forms a bank around the producing well [1,2]. In the literature, several methods have been studied to improve the productivity of condensate banked reservoirs [3]. The majority of existing intervention methods involve injecting solvents such as alcohols in gas condensate reservoirs, or using mechanical solutions (i.e., hydraulic fracturing) to improve the reservoir permeability [4,5,6,7,8]. These methods have severe cost and environmental impact implications. However, amid the growing concerns about the environmental impact of these production processes, some researchers are exploring novel approaches to treating condensate banked reservoirs using electrokinetic enhanced oil recovery EK-EOR [9,10,11,12].
EK-EOR is deployed by installing electrode assemblies—typically graphite, stainless steel, or other inert conductive materials—either within existing production and injection wells or in purpose-drilled electrode wells [13,14,15]. These electrodes are connected to a surface DC power supply equipped with voltage and current regulation units to deliver controlled electrochemical gradients across the reservoir. Additional surface and downhole instrumentation, including power distribution panels, high-resolution pressure/temperature gauges, and conductivity or ionic-flux sensors, are used to monitor system performance and ensure stable electrical coupling with the formation [16]. During EK-EOR treatment, electric current is introduced into the reservoir pore space and this initiates mechanisms such as electroosmosis, electromigration, and electrophoresis near the interface between the rock and hydrocarbon fluid [17,18]. This improves fluid flow through the porous media, reduces water production, and decreases associated hydrogen sulphide production, without formation damage [11,19,20,21]. However, based on a systematic literature review (SLR) conducted using laboratory studies and field applications, standalone application of EK-EOR was shown to improve recovery in about 45% of the reservoirs investigated [22]. In addition, insights from published EK-EOR experiments indicate that interstitial clay and the amount of electric potential are major contributors to the electro-osmotic permeability of the reservoir rocks, which governs the effectiveness of the EK-EOR mechanism [17,23,24]. Although understanding the effect of changes in salinity, electric current, and clay content is vital for the EK-EOR technique, however, due to limitations on the computing resources associated with this study, these electrokinetic parameters (electric current, salinity) were kept constant. The aim of the present study is to investigate the effect of reservoir, and well properties on the effectiveness of EK-EOR as a treatment for a condensate banked reservoirs.
The previous work [10] investigated the use of combined low-salinity waterflooding (LSW) and electrokinetic enhanced oil recovery (EK-EOR) techniques as a treatment method for condensate-banking in a sandstone reservoir. The study employed numerical simulation of full-field reservoir model to understand the effect of EK-EOR on condensate recovery. While implementing the numerical models, the Well locations, the perforation layers, production and injection pressures and rates, and reservoir permeability and porosity were kept constant. In practice, some of these parameters are dynamically adjusted to optimize production. Building on the previous study [10], this study therefore extends the analysis by systematically evaluating the influence of reservoir and well parameters on condensate recovery. The objective is to understand directionally (high-level screening) the reservoir types best suited for the EK-EOR process. To do this, six factors grouped into three categories were identified and selected as optimization variables; (i) Well injection/production control problems (injection rate, injector pressure); (ii) Well-placement optimization problems (producer location {i,j}); (iii) reservoir parameters (porosity and permeability).
There are two main approaches to optimizing the first two categories. In the first approach, an optimal solution is found by keeping one parameter constant while the other parameters are optimized. For example, while well placements are being optimized, the factors under well control are kept constant, and vice versa [25]. However, one reported drawback of this approach is that optimizing both categories separately may lead to a suboptimal solution. In the second approach, an optimal solution could be achieved by optimizing both well placement and well control problems simultaneously. However, optimizing both categories simultaneously require many full-field reservoir simulation runs. Given the constraints on time and computation cost of running these numerical simulations, it becomes impractical to run all trials using a typical optimization set-up. To solve the mentioned simulation problem, proxy models are applied to approximate solutions from a full-field modelling.

2. Proxy Modelling Framing

Proxy modelling also known as surrogate or meta modelling is a useful tool for reservoir engineers because it provides a computationally low-cost substitute to full numerical simulation [26,27]. Proxy models reproduce approximate solutions to a full-field reservoir simulation when given a set of input parameters. Typical applications of proxy modelling include sensitivity and risk analysis [28], probabilistic forecasting [29], history matching [30], production optimization [31] and field development planning [32]. Proxy models provide interesting advantages and some of these advantages given in Forrester et al. [29] include (i) delivering faster results from expensive high-fidelity models from software, (ii) calibrating predictive models that have limited accuracy, (iii) understanding what data is noisy or missing, and (iv) providing insights into the relationships between input parameters and output (response) parameter. However, whatever advantages the proxy models provide are based on the opportunity cost of accuracy, i.e., the simpler a proxy model, the less accurate it is. If accuracy is more important, high fidelity numerical simulations are needed as the initial and main step in the proxy modelling development process. In this study, design of experiment (DoE) was used to develop the proxy models for the integrated optimization of the field. A description of the parameters and methods implemented in the DoE is given in the next subsection.

Design of Experiment (DoE)

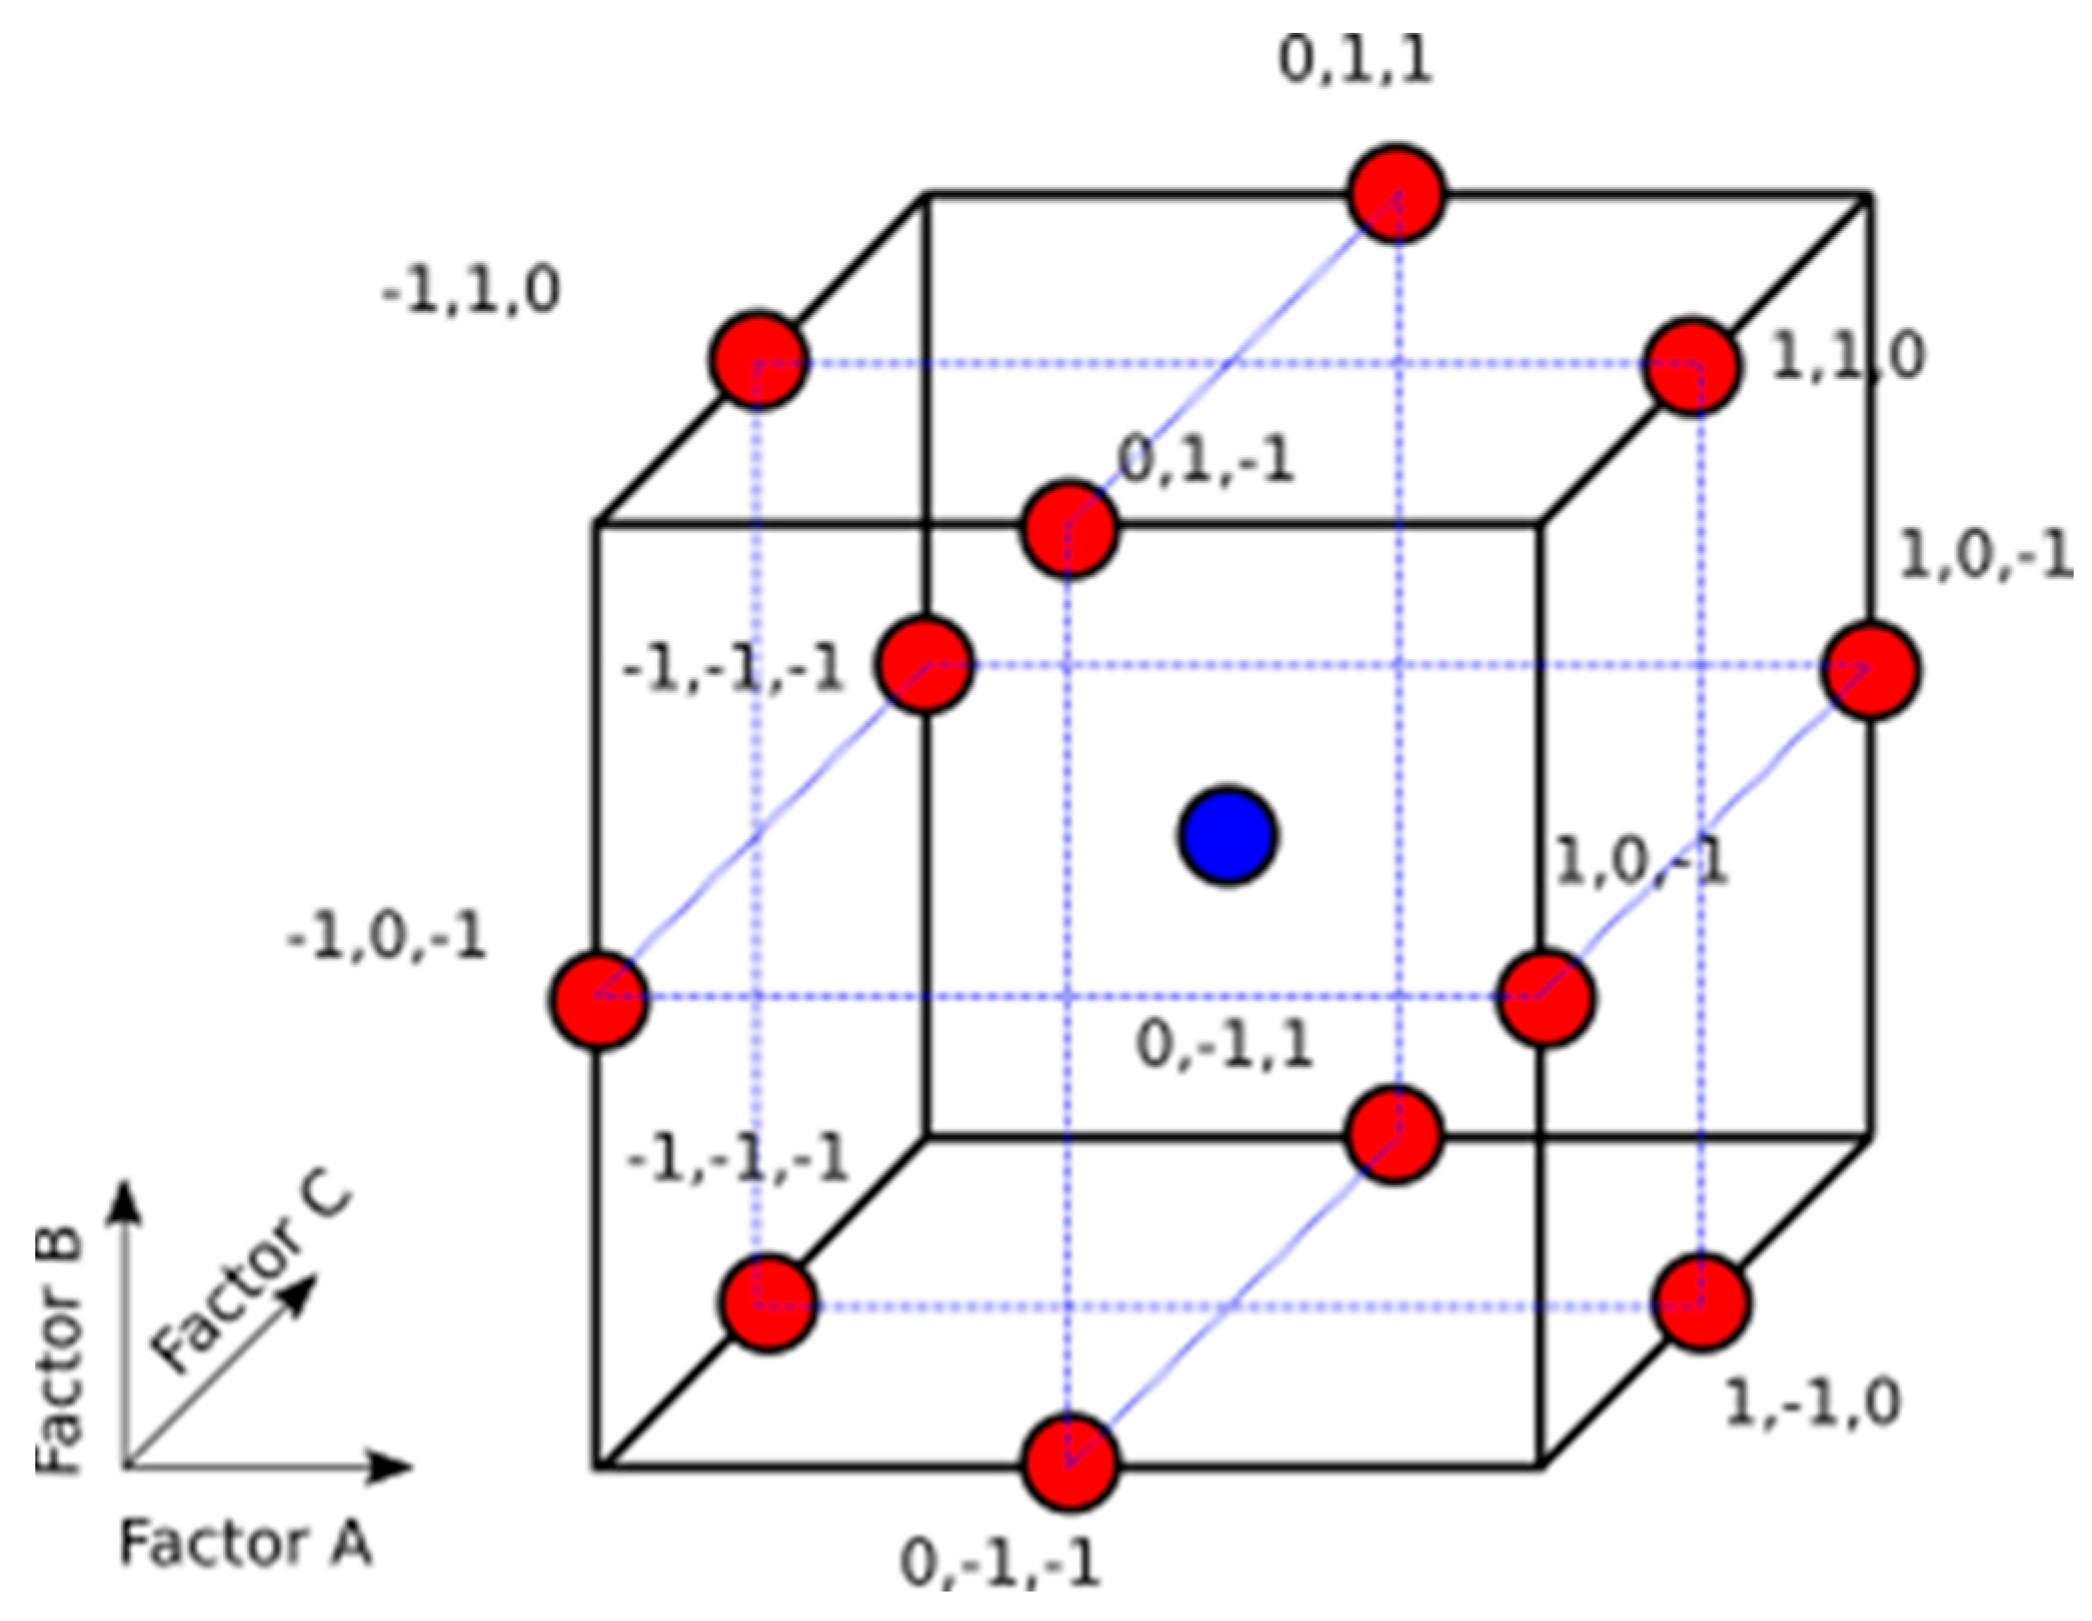
Design of experiment refers to the process of scheduling and supervising experiments (simulation runs) and analyzing the responses obtained by statistical methods so that valid and objective conclusions can be obtained with minimum resources. The key word is minimum resource. In this study, a DoE obtained via Box–Behnken styled response surface methodology was developed to approximate the results obtained from full-field simulation trials. The resulting proxy model considers the six factors identified in the previous section as input parameters. The proposed proxy model considers the well location, well control parameters as well as the effect of reservoir grid data on the cumulative gas produced. In the Box–Behnken design the levels of each factor are given at the midpoints of the edges (red dots) and in the centre (blue dot) as shown in Figure 1.
Each of the six factors was investigated at three levels—low, midpoint, and high—within realistic ranges to avoid impractical combinations, as seen in Table 1. The factors were coded using dimensionless values of −1, 0, and +1, corresponding respectively to the low, midpoint, and high cases. These coded variables were used to generate the response surface model; actual physical quantities were substituted back when running the simulation and the result of each scenario is captured in Appendix A. To mitigate potential bias, the sequence of simulation runs was randomized.
The response (output) parameter differs for the EK-EOR technique, which is the cumulative gas produced as shown in Equation (1).
C G P = f 1 ( X 1 , X 2 , X 3 , X 4 , X 5 , X 6 )
where CGP—cumulative gas produced, X1–6—input parameter being investigated.

3. Methods and Materials

In this study, the following tools were used: CMG GEM 2021.10 (for full field reservoir simulation), Develve 4.17 (for design of experiment) and MATLAB R2024a (for optimizing model using genetic algorithm). CMG GEM provided the environment used to build the reservoir model, run the simulations, and compute the cumulative gas produced at each simulation run. The reservoir properties (size, initial pressure and fluid composition at the dewpoint, rock fluid properties) and how electrokinetic parameters (voltage, salinity, electrode potential) including assumptions are discussed in detail in our previous work [10]. The reservoir model used for the analysis is based on Kenyon’s model [33], while the changes in interfacial tension used in modelling the effect of EKEOR were obtained from [9].
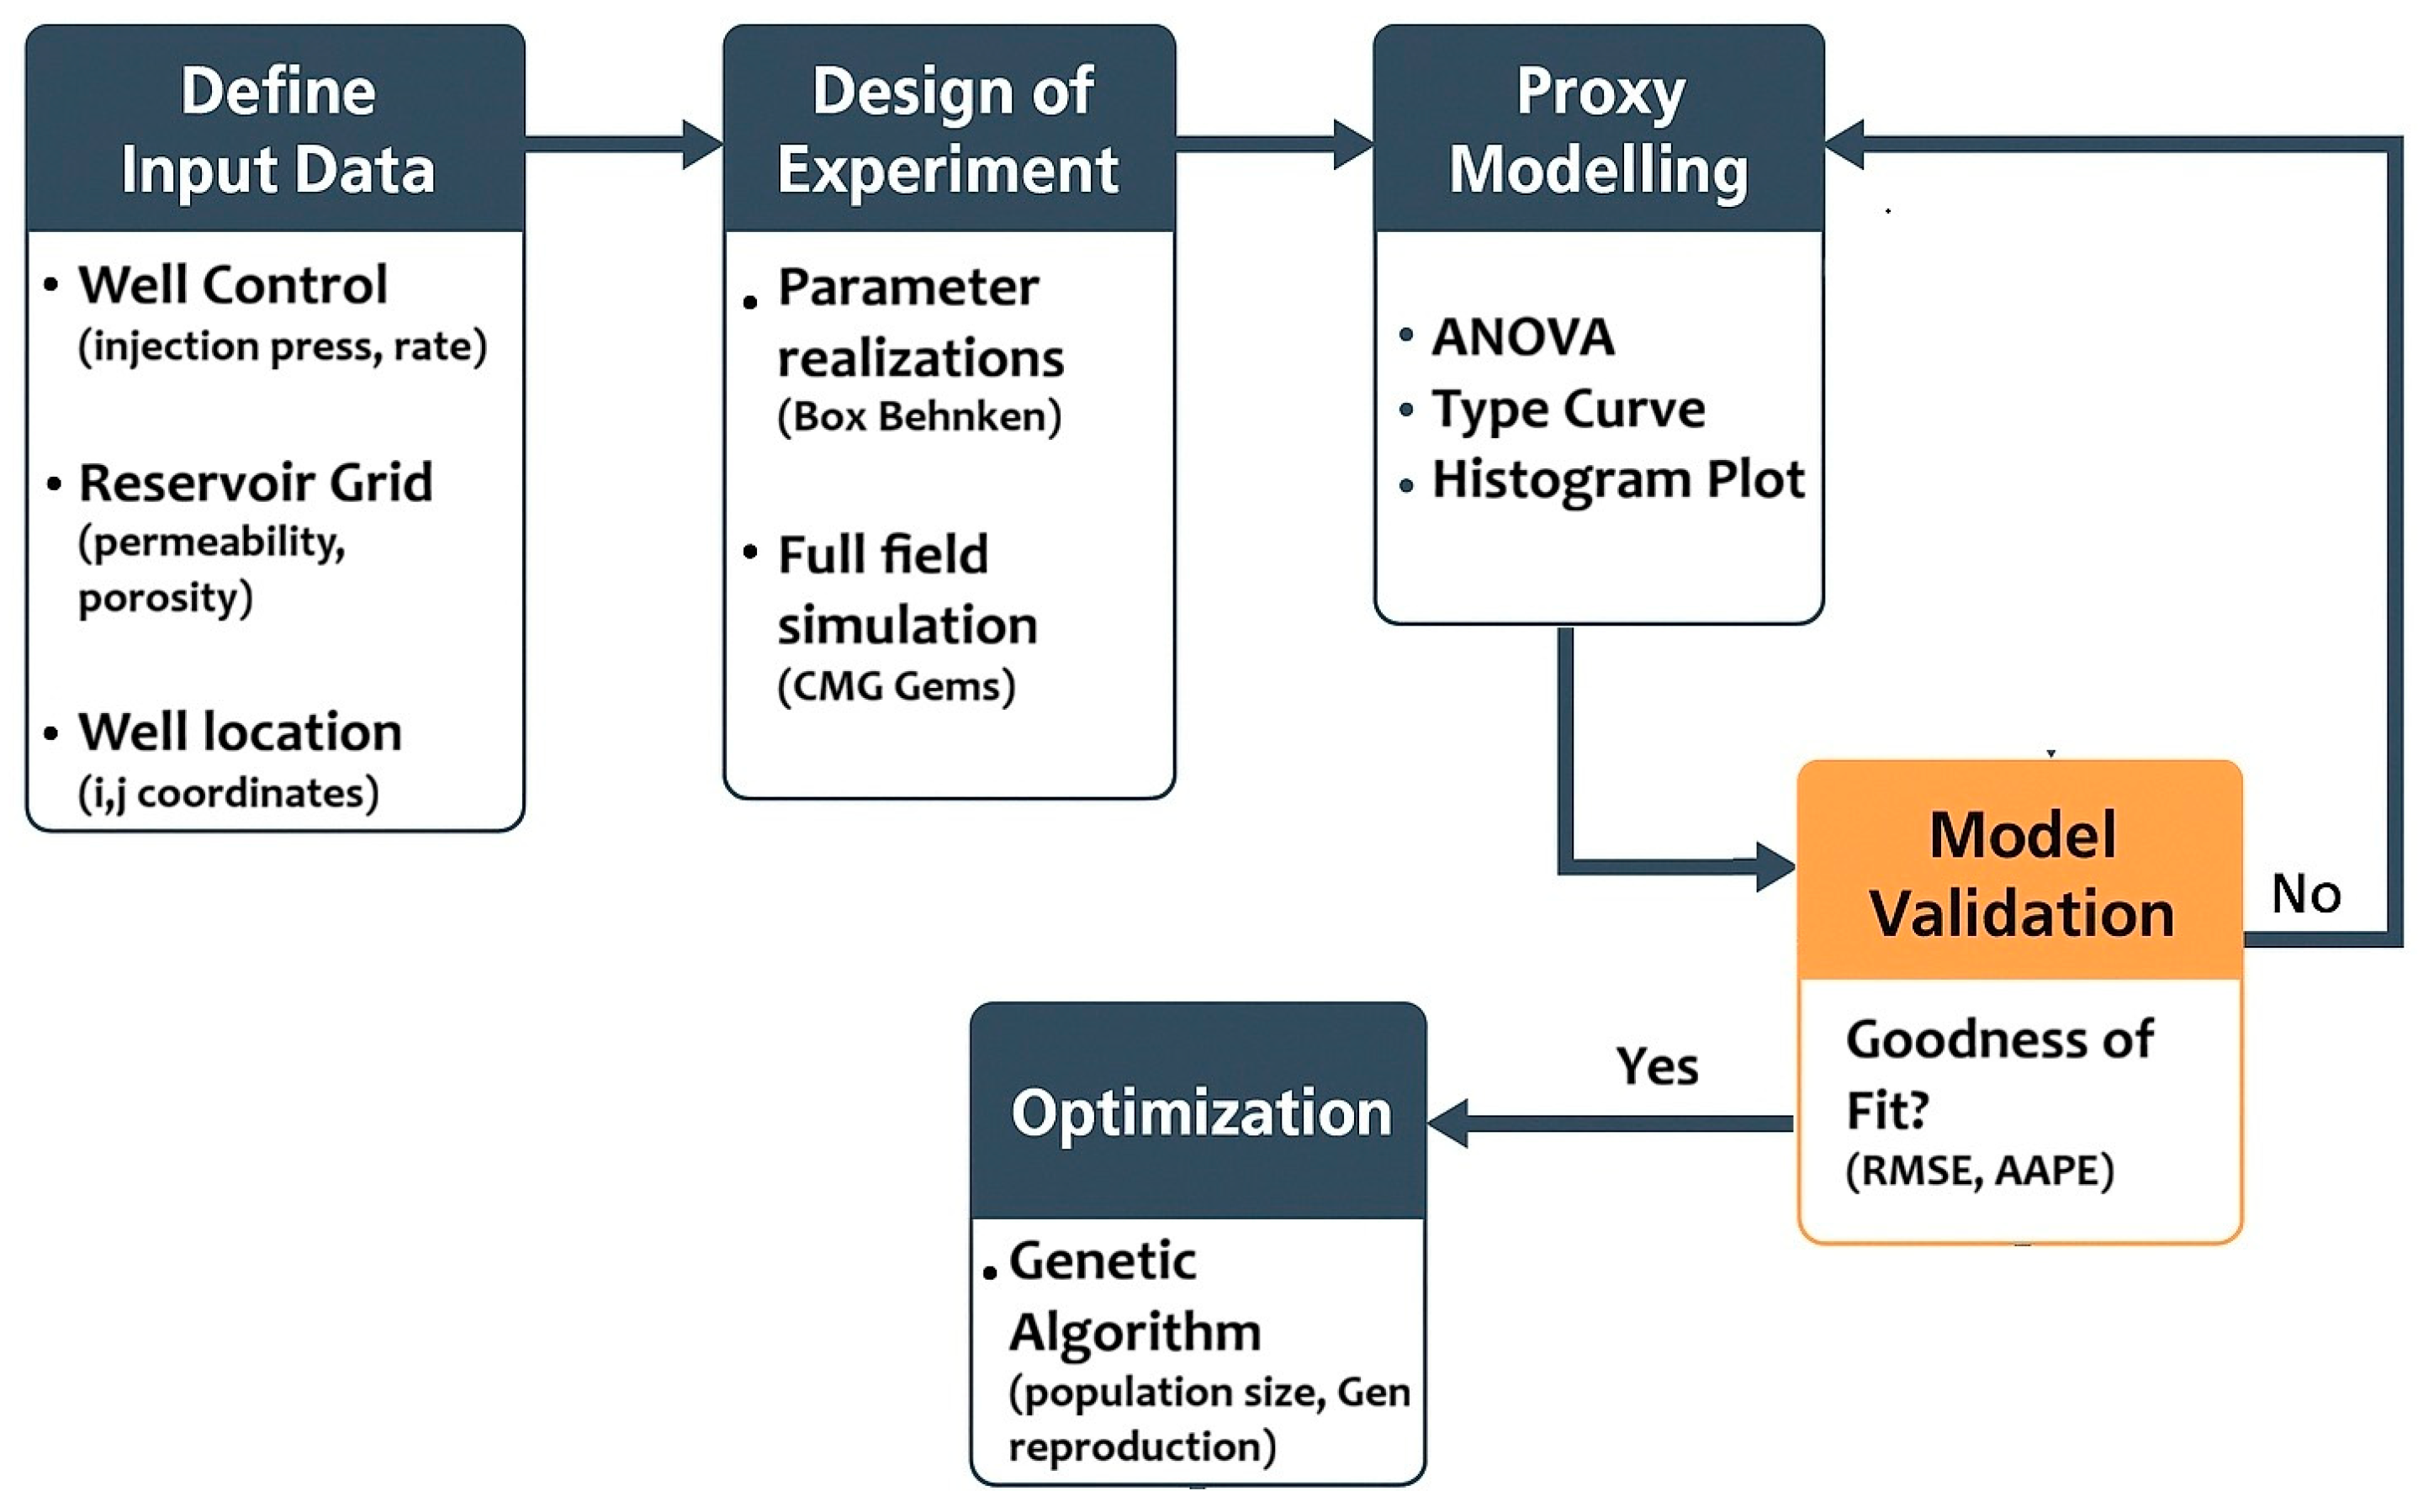
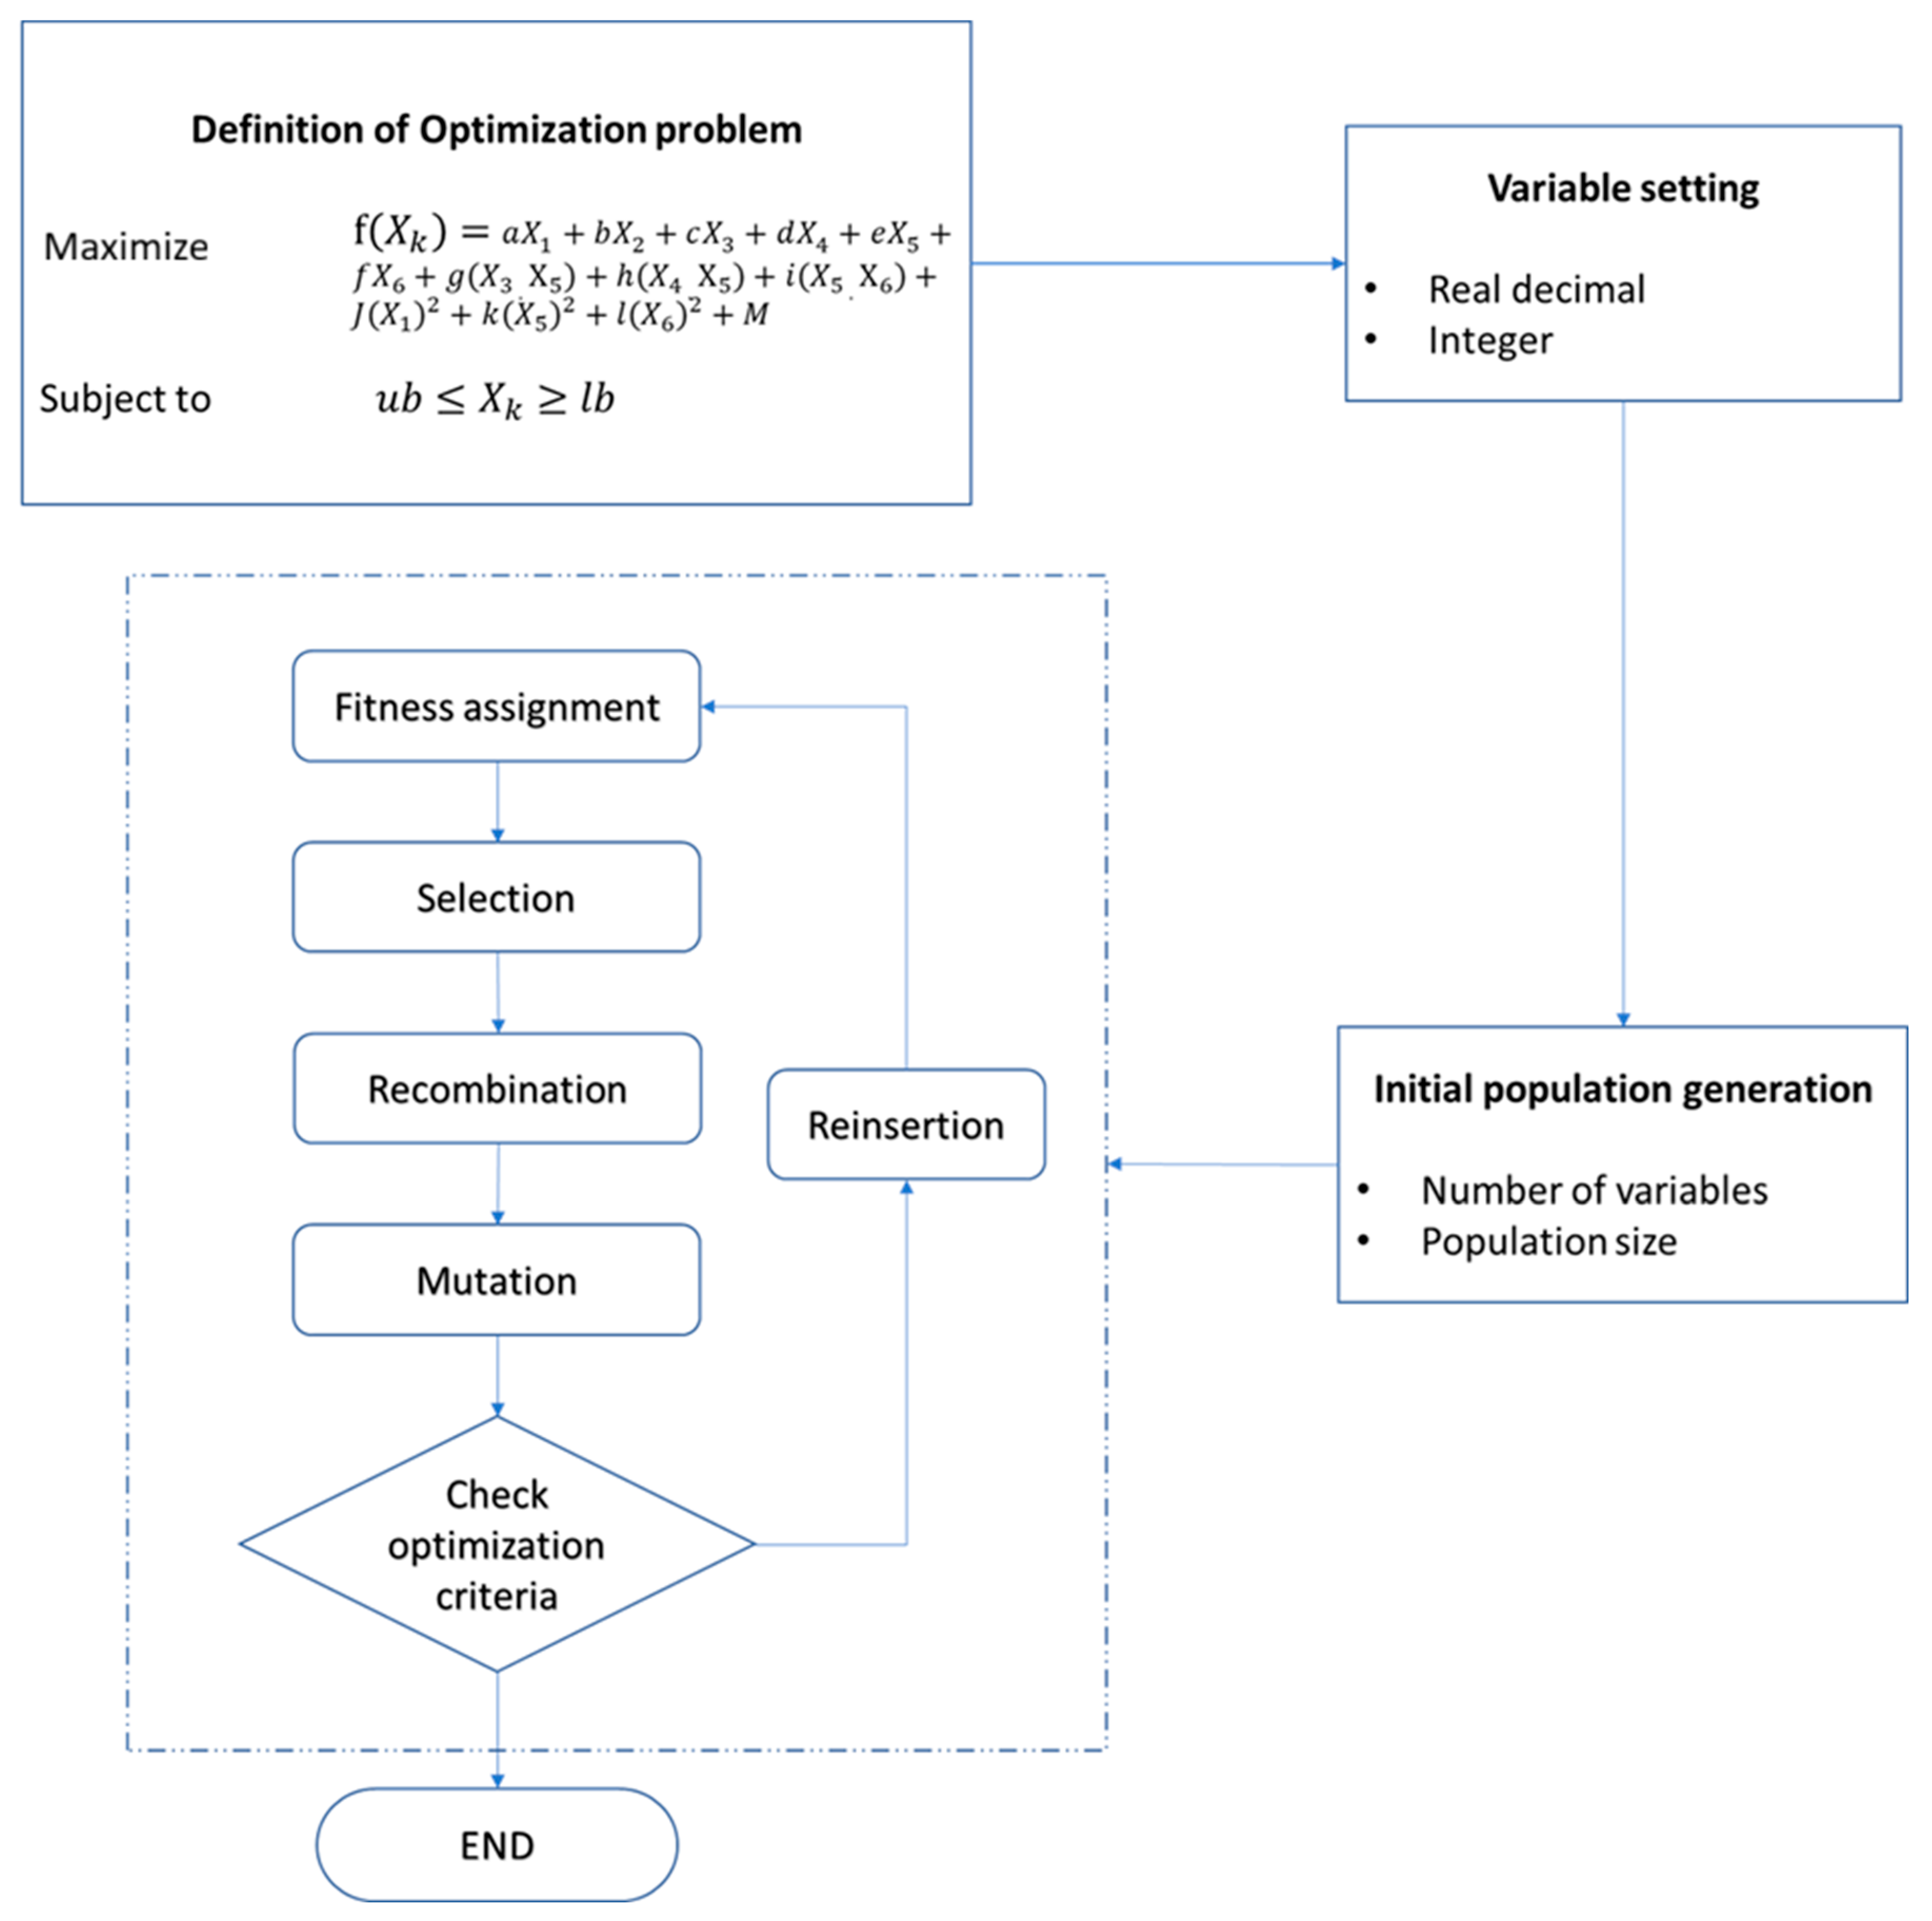
Develve software was used to generate parameter realizations using Box–Behnken design of experiment. Several combinations of input datasets were generated to conduct simulation runs with the reservoir simulator. The results obtained from the simulation runs were then used to develop the proxy models. Analysis of variance (ANOVA) performed on the model to ascertain the accuracy of the proxy models compared to the numerical simulations. Finally, genetic algorithm (from MATLAB) was used to optimize the proposed proxy models, aimed at determining the optimum set of parameters that will maximize gas yield for EK-EOR. The flowchart given in Figure 2 presents the methodology described above.

3.1. Parameter Realizations for EK-EOR Study

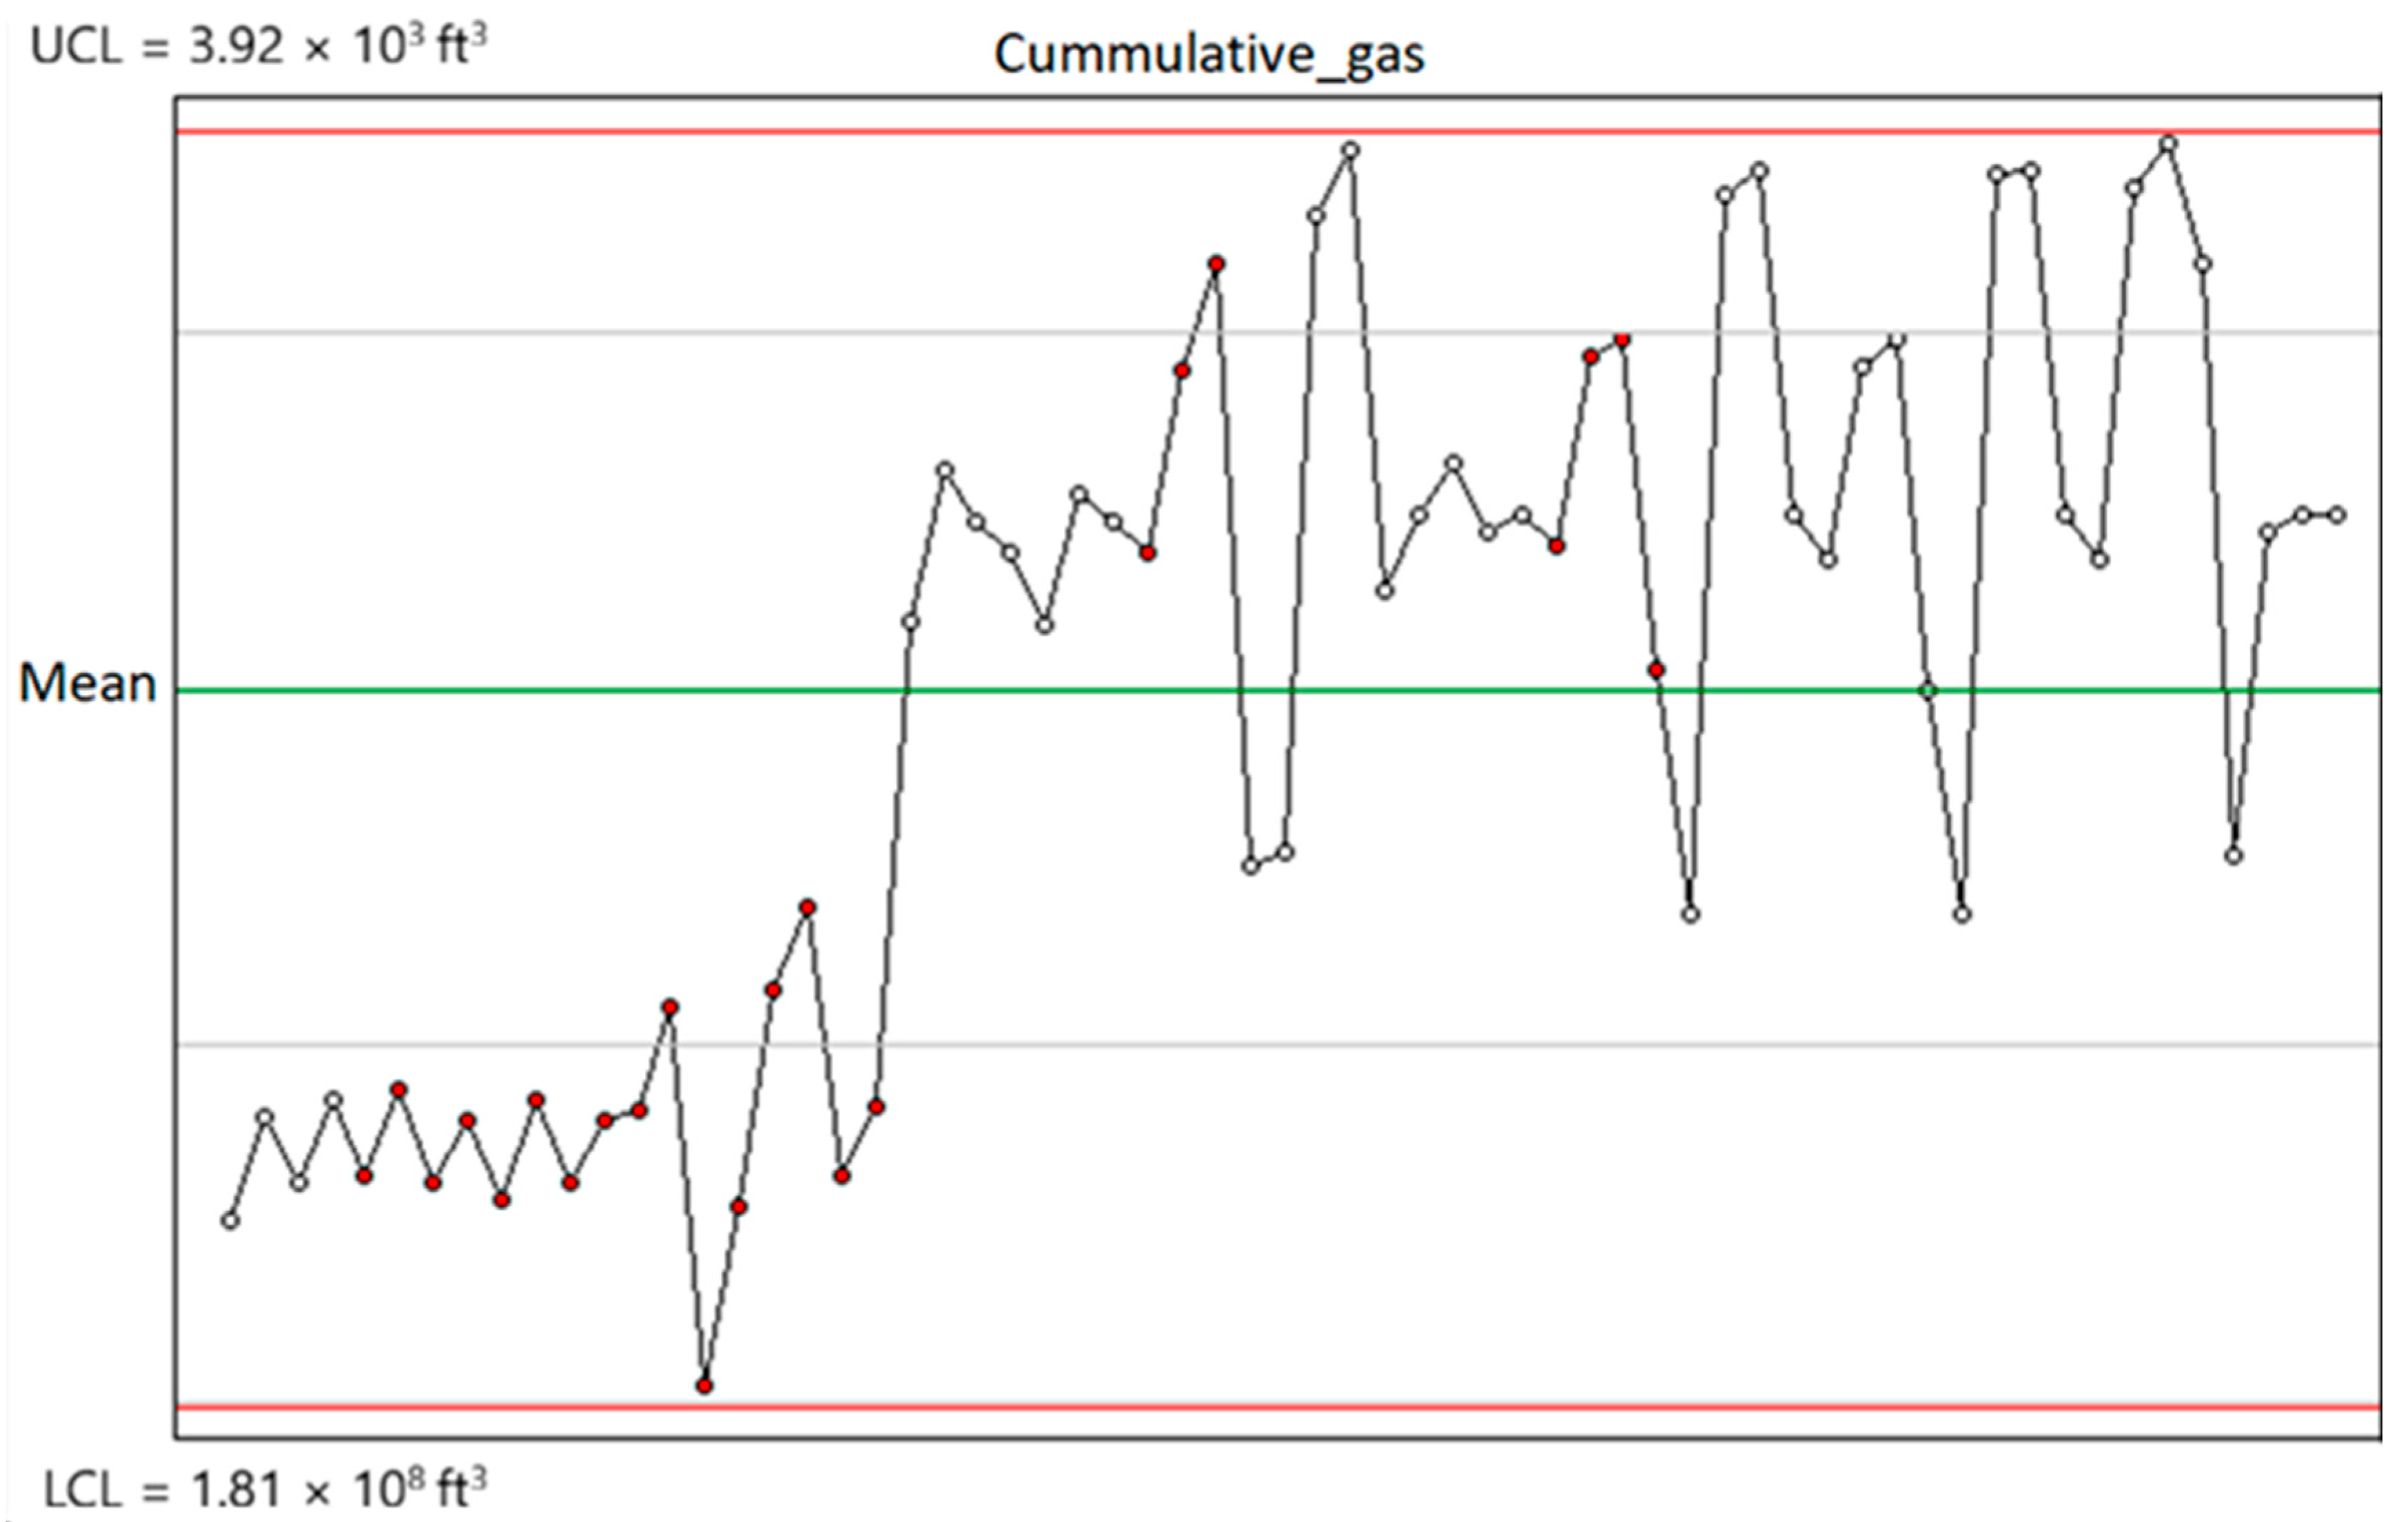
Based on the data ranges for each scenario given in Table 1, Box–Behnken design method was used to generate parameter realizations for the reservoir simulations. It is important to note that specific EK-EOR parameters (i.e., applied electric potential, electrode spacing, salinity level, or clay content in the rock) were kept constant, with the respective values given in [9]. These parameters were fixed because it was difficult to model their corresponding changes in the IFT and relative permeability curve using the CMG GEM simulator. A total of 62 simulation runs were conducted for the six variables, to determine cumulative gas produced during each run. The maximum duration for each simulation was 5478 days, and the cumulative gas produced for each run is presented in Appendix A. Analyzing the cumulative gas produced from each of the 62 scenarios shows that the highest and lowest cumulative gas produced (CGP) for 5478 days of production include 3.92 × 108 ft3 and 1.81 × 108 ft3 respectively. The time series plot of each CGPs is given in Figure 3.
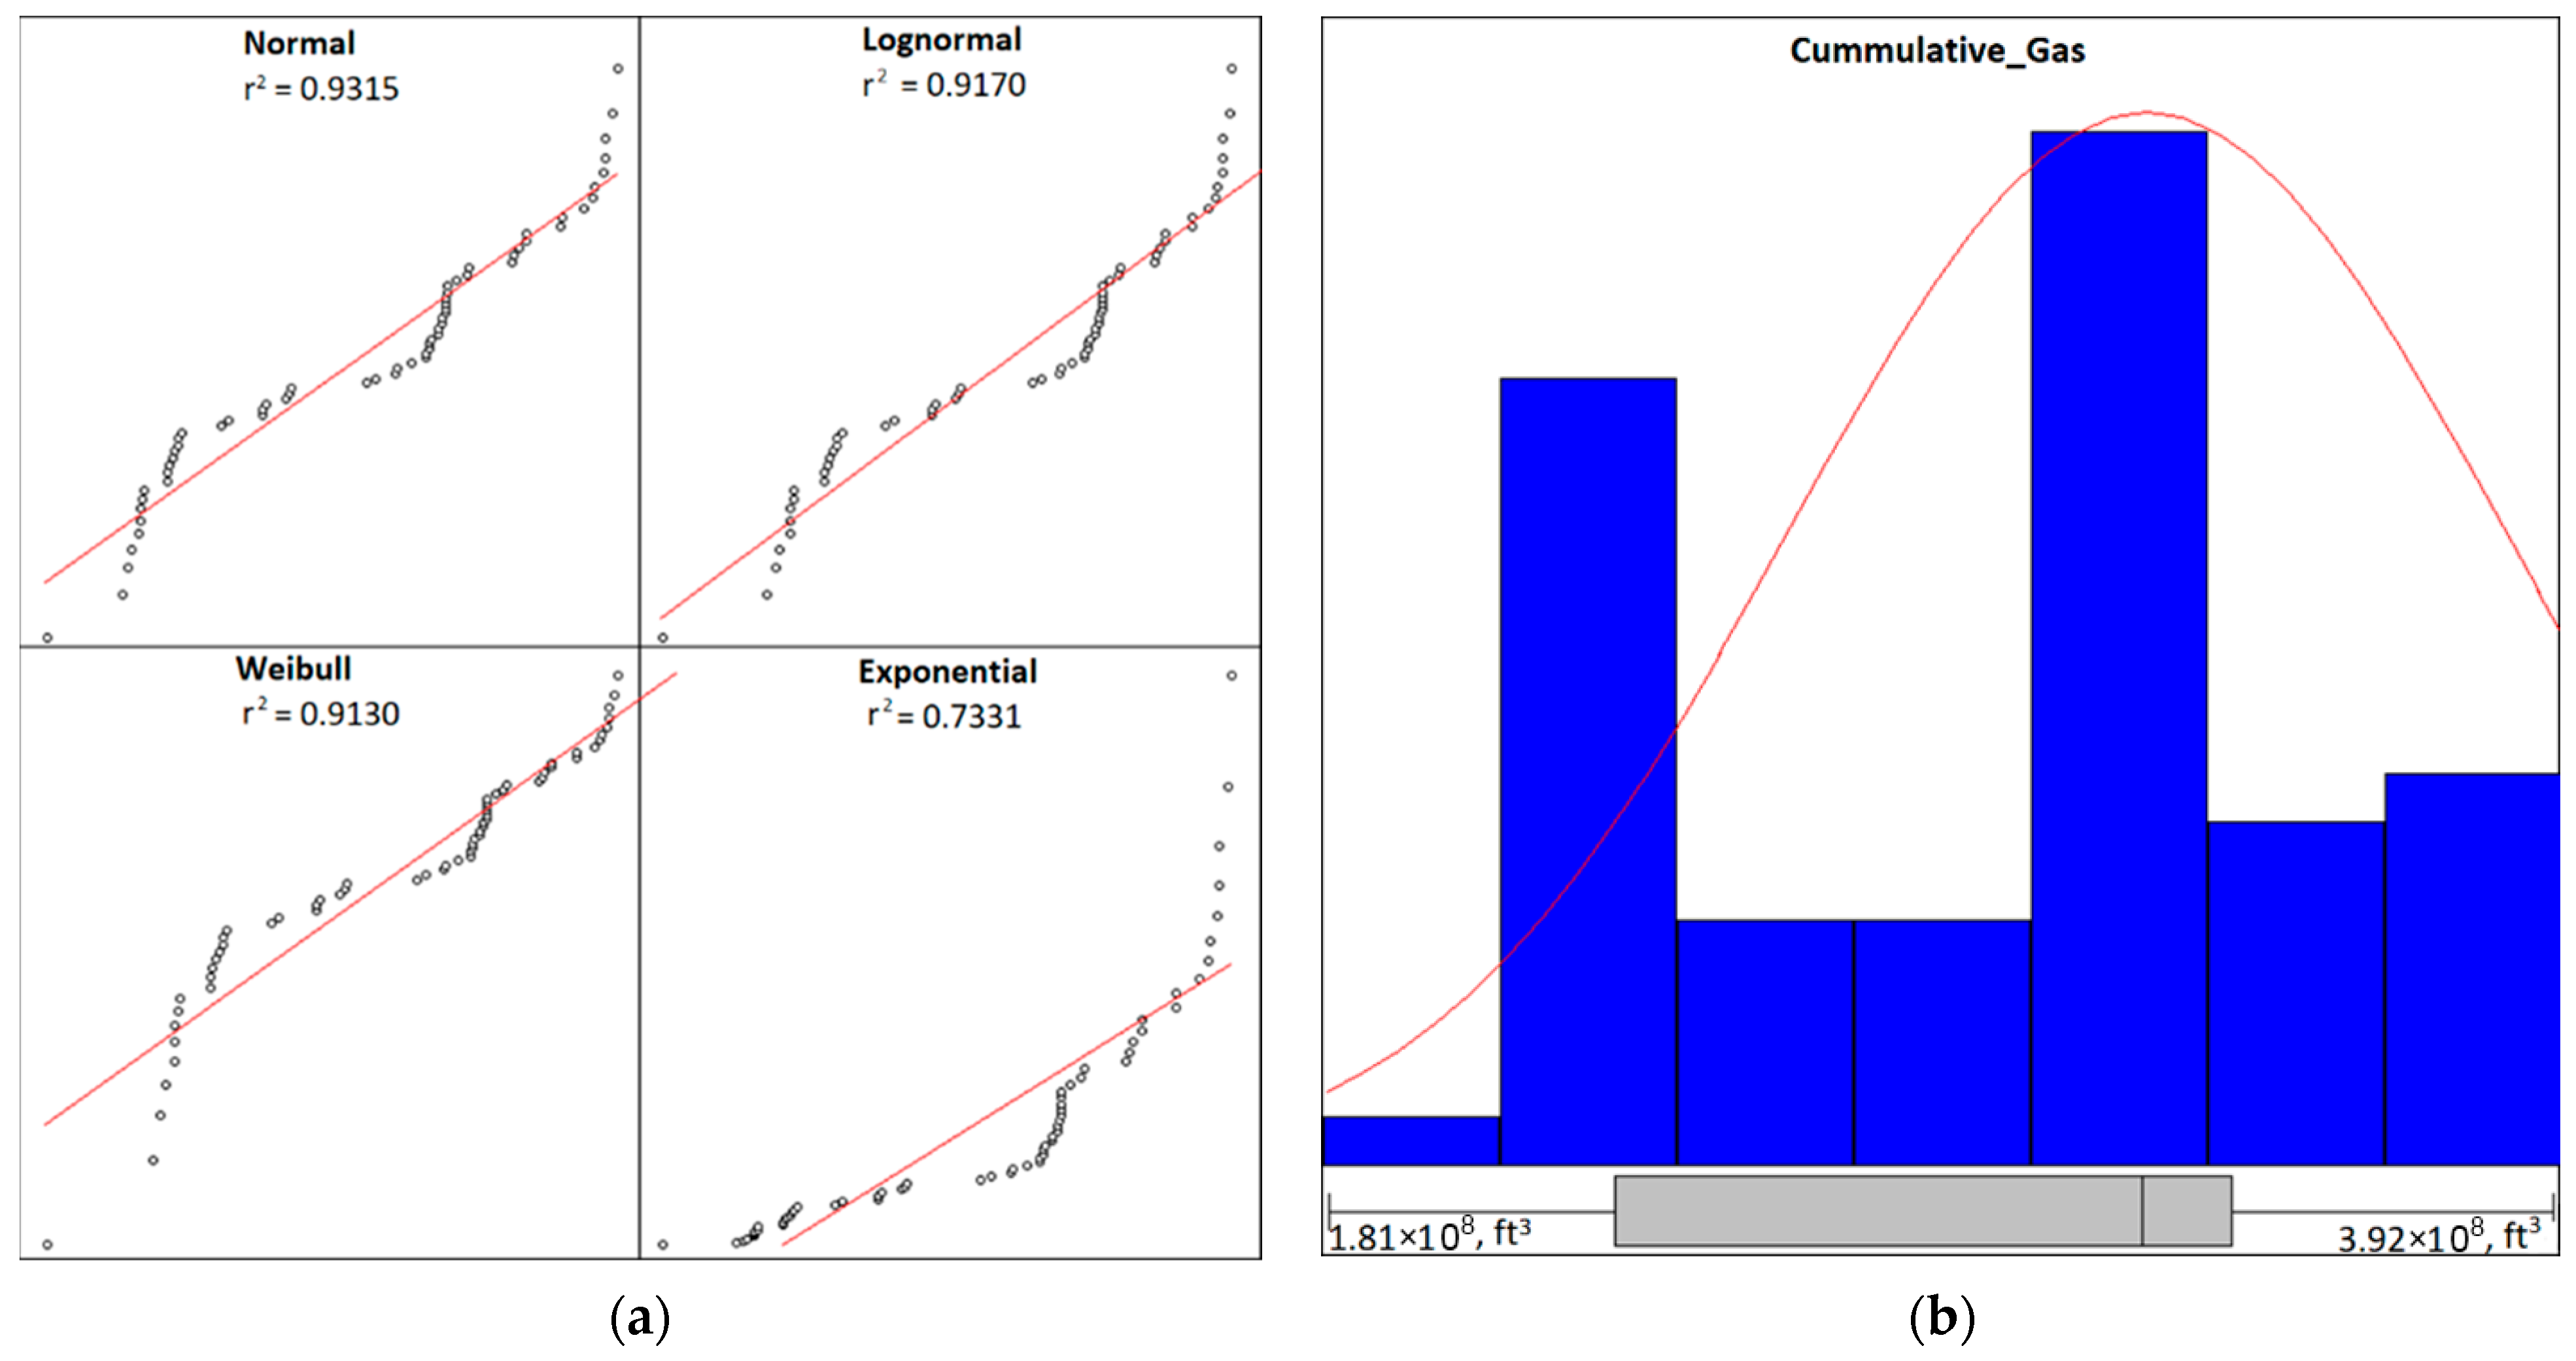
After fitting the proxy model to the response data, diagnostic checks were performed on the normal probability plot of the residuals confirmed approximate normality. The simulation results can be further characterized by fitting the cumulative gas produced into a distribution type curve. The type of distribution curve that fits the data if consistent with the distribution of natural phenomena further validates the result obtained from the reservoir simulation. Four continuous distribution curves were analyzed for fit with data and the normal distribution had the highest closeness of fit with R2 = 0.9315 as shown in Figure 4a. The results show a standard deviation range between 5.15 × 10⁷ and 7.36 × 10⁷ with a 95% confidence. Figure 4b shows the normal fit curve overlain on the entire CGP data.

3.2. Development of EK-EOR Proxy Model

The cumulative gas produced in each simulation run and its respective input parameter were fed into the design of experiment software to generate a proxy model, which had three components-linear, interaction and quadratic components. Results from the analysis of variance indicate which variables had significant impact on the outcome (cumulative gas produced), i.e., p-value less than 0.05, as shown in Table 2.
To reduce the model complexity, terms with p-value greater than 0.05 (i.e., statistically insignificant variables) were removed from the model. However, additional variables were retained in the proxy model to support hierarchy. The proxy model generated is presented by Equation (2):
C G P   = a X 1 + b X 2 + c X 3 + d X 4 + e X 5 + f X 6 + g X 3   .   X 5 + h X 4   .   X 5 + i X 5   .   X 6 + j X 1 2 + k X 5 2 + l X 6 2 + M
where X1–6—input parameters (from Table 1), M = − 1.304 × 10 8   , and the lower-case alphabets are coefficients having the following values:
a 4.352 × 10 7 e 3.957 × 10 4 i−7.23
b 4.881 × 10 4 f 1.772 × 10 4 j 1.068 × 10 6
c 5.742 × 10 6 g 1.867 × 10 3 k−2.29
d 6.861 × 10 6 h 2.140 × 10 3 l4.52

3.3. Validation of EK-EOR Proxy Model

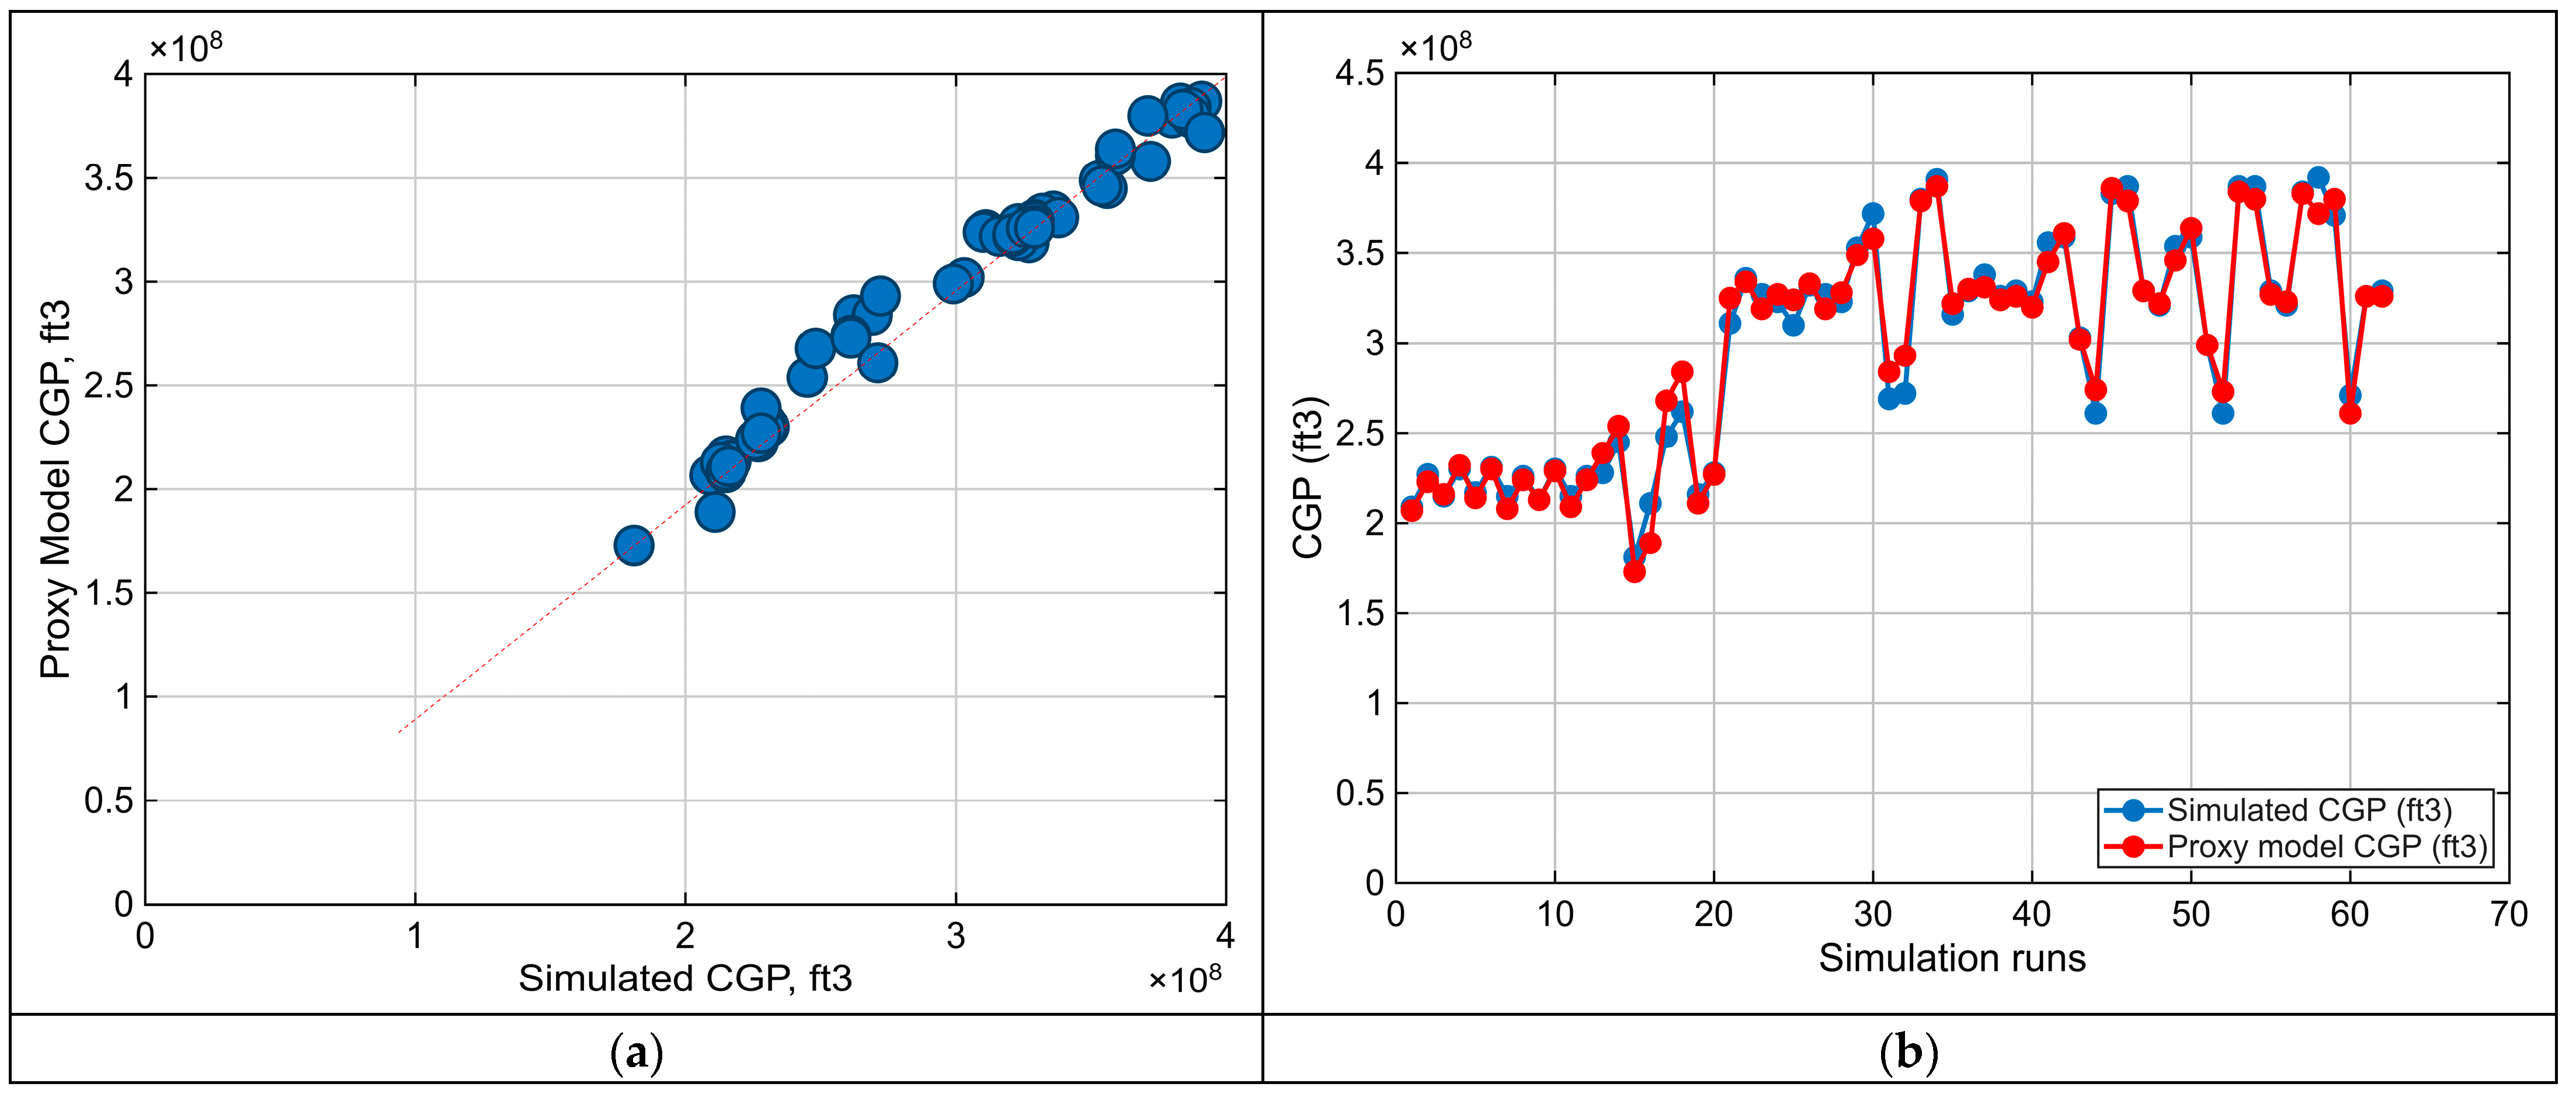
The proxy model was validated using the coefficient of determination, R2 (0.965) obtained from a plot of actual versus predicted cumulative gas produced. Root mean square error (RMSE) and Average Absolute Percentage Error (AAPE) were calculated using Equations (3) and (4) and were found to be 8.60   × 10 6 and 2.22% respectively.
R M S E = i = 1 n P r e d i c t e d   C G P i S i m u l a t e d   C G P i 2 n
A A P E = 1 n i = 1 n S i m u l a t e d   C G P i P r e d i c t e d   C G P i S i m u l a t e d   C G P i
A plot of the actual CGP against the predicted CGP is shown in Figure 5a, while correlation between the actual and predicted CGP against each simulation run is shown in Figure 5b.
In addition to the R2, RMSE and AAPE metrics, a 5-fold cross validation procedure was conducted to assess the robustness of the proxy model within the limits of the parameters being investigated. The 62 simulation runs and model predictions were randomly partitioned into five subsets, with four folds used for training and one fold for testing in each iteration, as shown in Table 3.
The 5-fold cross-validation results show consistently high R2 values across all folds, with an average R2 of 0.965 and a very small standard deviation (0.005). This shows that the model explains about 96.5% of the variability in the actual CGP, is stable and performs consistently well across different data splits. Standard residual plots (given in Appendix B) indicate the absence of influential outliers.

3.4. Optimization

The proxy model obtained in the previous section, could be described as a non-linear objective function, subject to lower and upper constraints. To maximize the objective function (in this case CGP), several optimization techniques could be applied; however, genetic algorithm was selected because of it uses a stochastic non-derivative approach to obtain the global maximum [34]. This means that genetic algorithm uses random, but targeted search to obtain the maximum solution. The genetic algorithm was implemented in MATLAB using its inbuilt global optimization toolbox. The objective was set to maximize the response variable of the proxy model. The outline of the genetic algorithm employed in this study is shown in Figure 6.
The accuracy of the solution obtained is dependent on the population size, number of generations, crossover rate, and mutation rate between parents and offspring’s solution space. The value of the parameters are given in Table 4 to ensure repeatability of the solution, while the results of the optimization are presented in Table 5.

4. Results and Discussion

4.1. Effect of Well Injection Parameters on EK-EOR

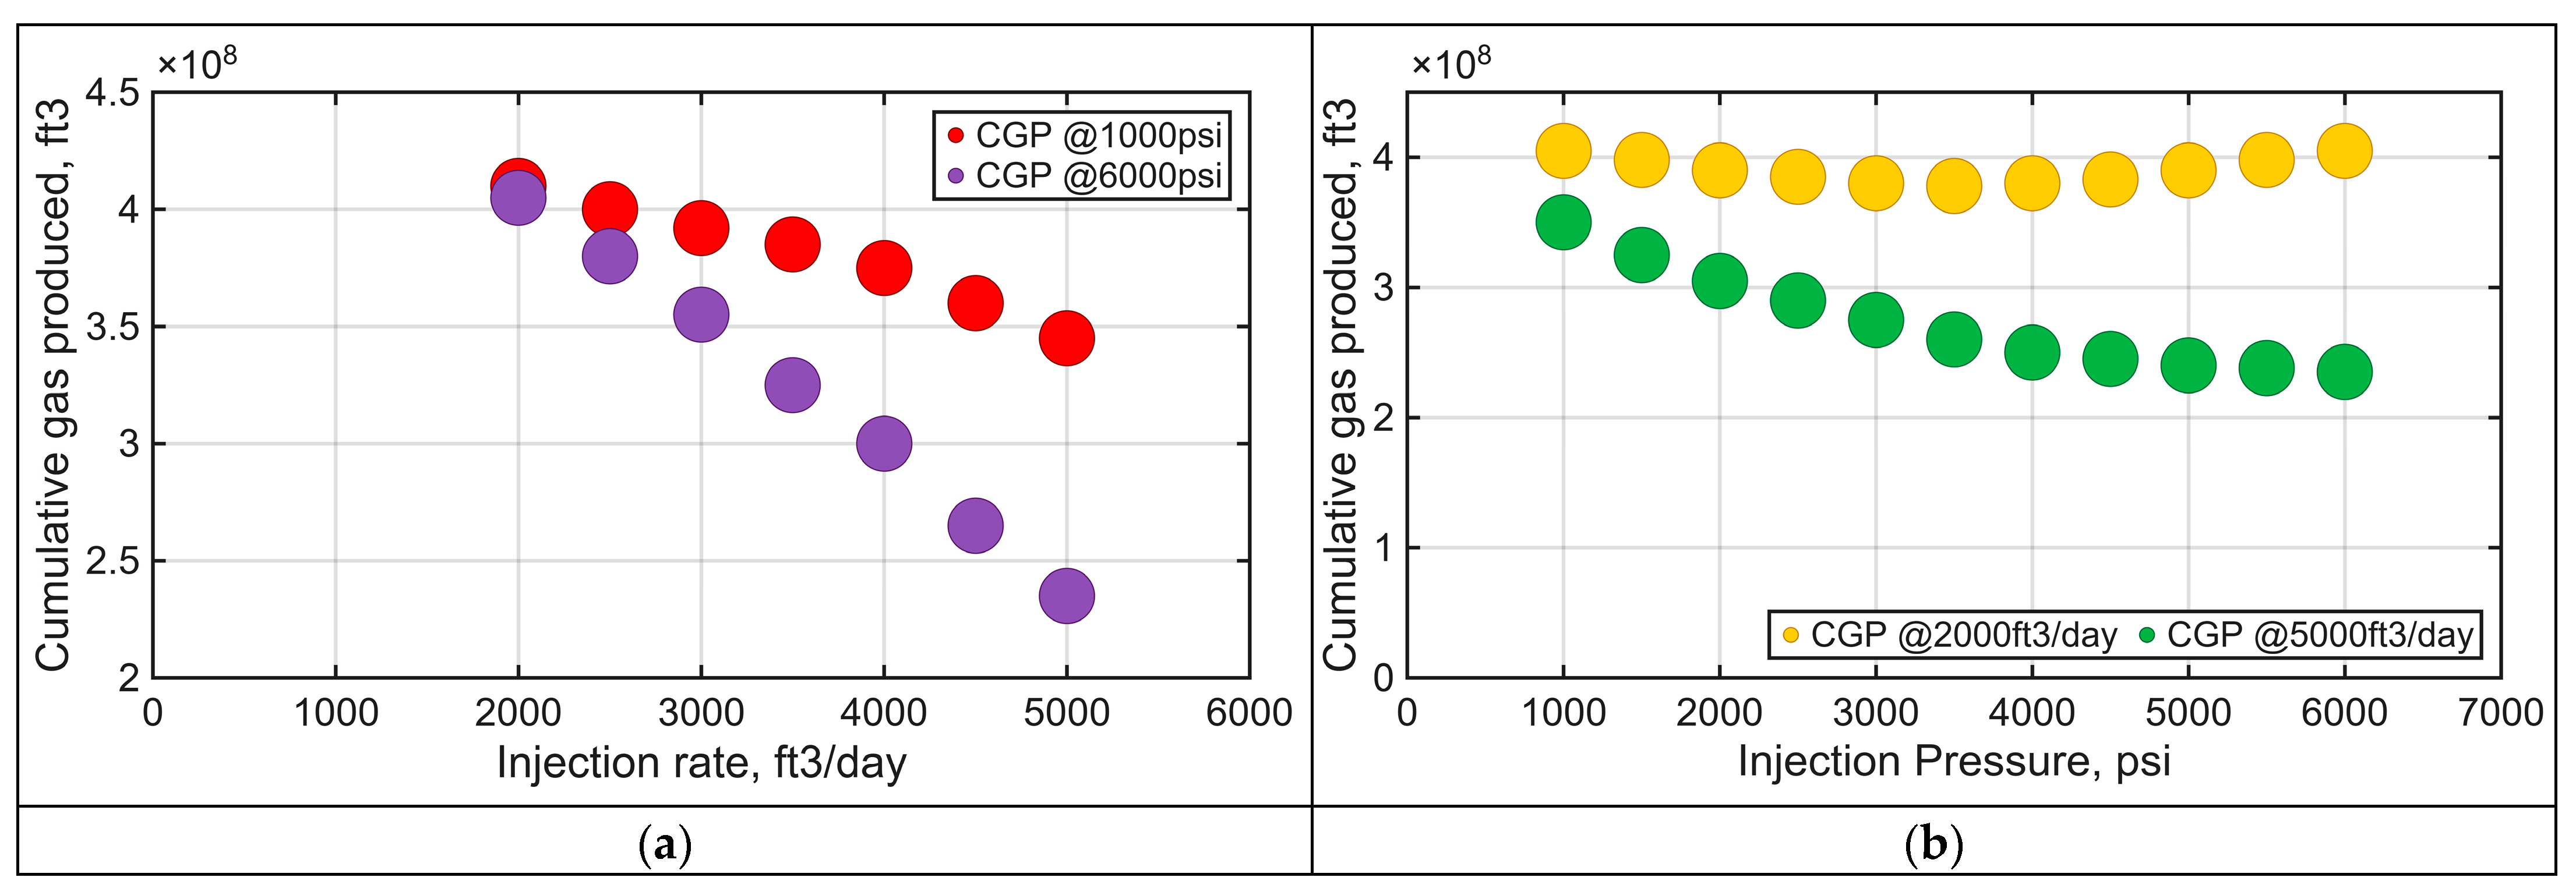
Well injection parameters have both economic and environmental implications on the field asset. The injection pressure and rates affect the performance of EK-EOR technique. The decision on what type or capacity of surface pumps to use depends on whether the emphasis is on either higher pressure or higher rate. Analyzing the effect of injection pressure and rate on the cumulative gas produced (CGP) for the EK-EOR study, a non-linear relationship was observed for both cases as shown in Figure 7b.
From Figure 7a, higher injection rates led to a lower cumulative gas production, which is evidenced by the negative gradient between CGP and injection rate. Although counter-intuitive, a possible reason could be that at higher injection rate, low-salinity brine increases water saturation around the well (or near the condensate zone), reducing gas relative permeability (i.e., a water blocking effect), whereas a slower injection allows the electrokinetic effects to mobilize condensate without drowning the near-well region in water.
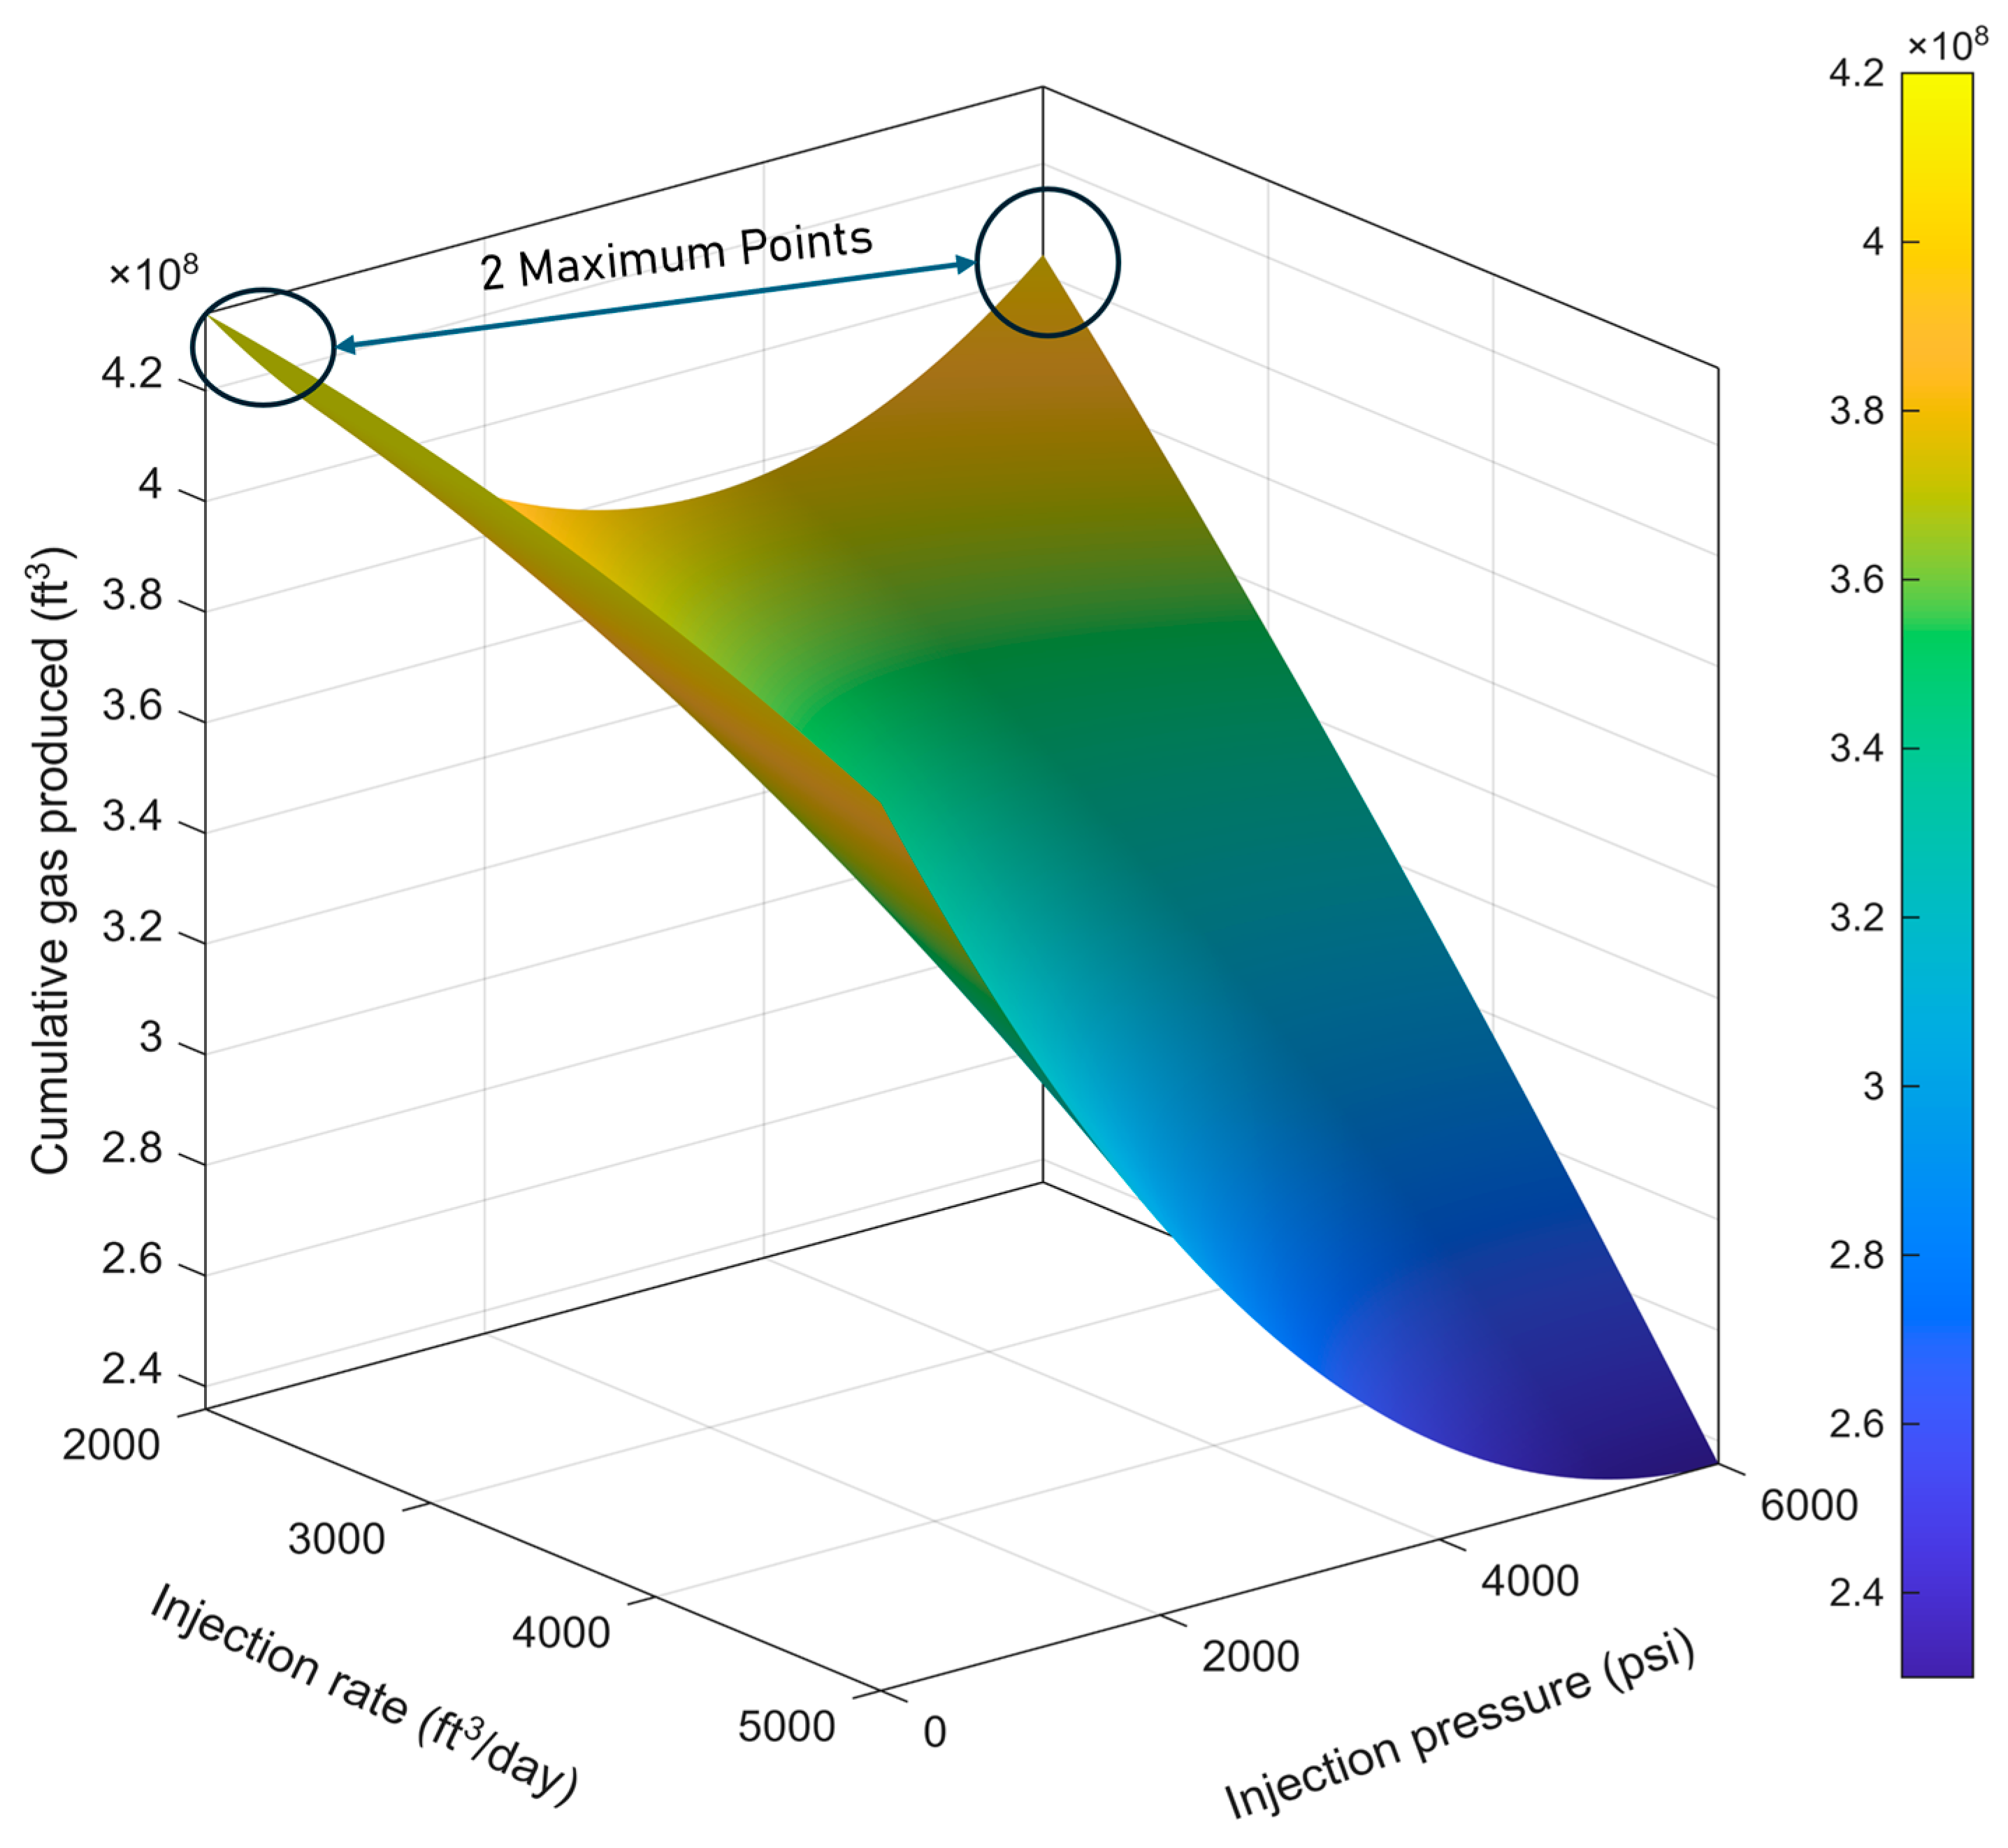
For the effect of pressure on CGP, an interesting relationship was observed. Maximum CGP was attained both at low pressure and high pressure. A sweet spot then develops where minimum pressure and minimum rate combine to generate maximum CGP. Visualizing the combined effect of both injection rate and pressure, in Figure 8, maximum CGP were observed at the following two points: (i) high injection pressure + low injection rate, and (ii) low injection pressure + low injection rate.
The dual-peak behaviour observed in Figure 8, where maximum cumulative gas production (CGP) occurs at both low-pressure + low-rate and high-pressure + low-rate conditions, could plausibly be explained by two complementary physical mechanisms acting within the condensate-banked near-well region. One possible interpretation is that at low injection pressure (~1000 psi), the applied direct current primarily enhances electro-osmotic flow and reduces interfacial tension between the condensate and brine phases. This promotes gentle mobilization of trapped condensate droplets without causing excessive water invasion. The low injection rate supports favourable gas relative permeability, allowing electrokinetic effects to dominate and resulting in a highly efficient capillary-driven cleanup of the condensate bank.
Conversely, at high injection pressure (~6000 psi) and the same low injection rate, the elevated bottom-hole pressure likely re-pressurizes the near-well region above the dewpoint, leading to partial re-vaporization of condensed liquids and a temporary increase in gas mobility. Here, condensate recovery is driven more by thermodynamic re-vaporization than by electrokinetic displacement and requires substantially higher injection pressure which may risk fracturing or altering permeability in tight formations. These interpretations are hypothetical and require dedicated experimental and modelling studies to investigate its validity.
Overall, these results suggest the following two potential operational modes for EK-EOR: (i) a low-pressure, low-rate mode where electrokinetic mobilization dominates, and (ii) a high-pressure, low-rate mode where re-vaporization effects complement the electric-field influence. The genetic algorithm identified the global optimum at the lower-pressure regime, indicating that the gentle, electrokinetically dominated approach achieves the best balance between recovery efficiency and operational sustainability within the studied range.

4.2. Effect of Reservoir Parameter–Porosity and Permeability on EK-EOR

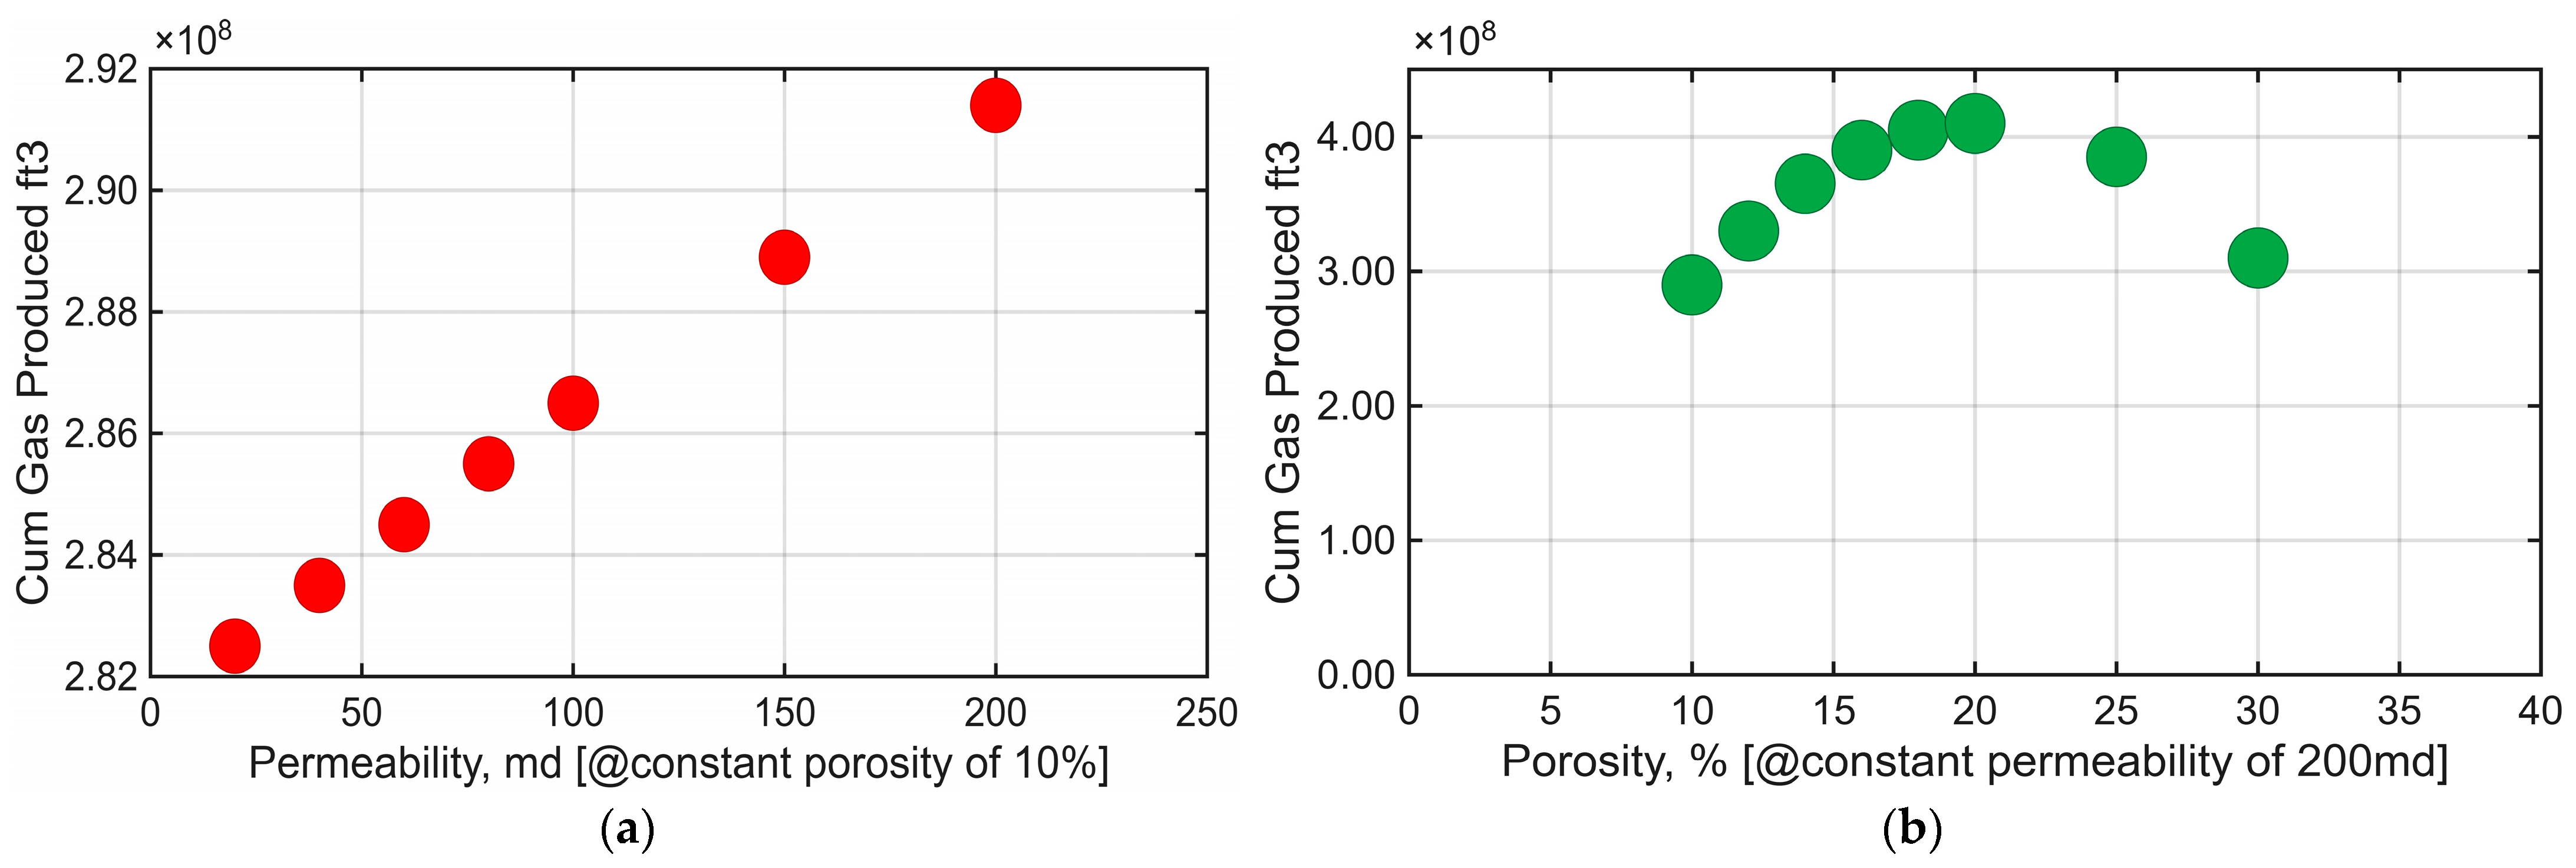
Understanding the influence of reservoir porosity and permeability on the performance of EK-EOR, is vital for pre-screening candidate reservoirs for EK-EOR deployment. A positive linear relationship between permeability and CGP is observed in Figure 9a, and this indicates that higher CGP is obtained from reservoirs with higher permeability.
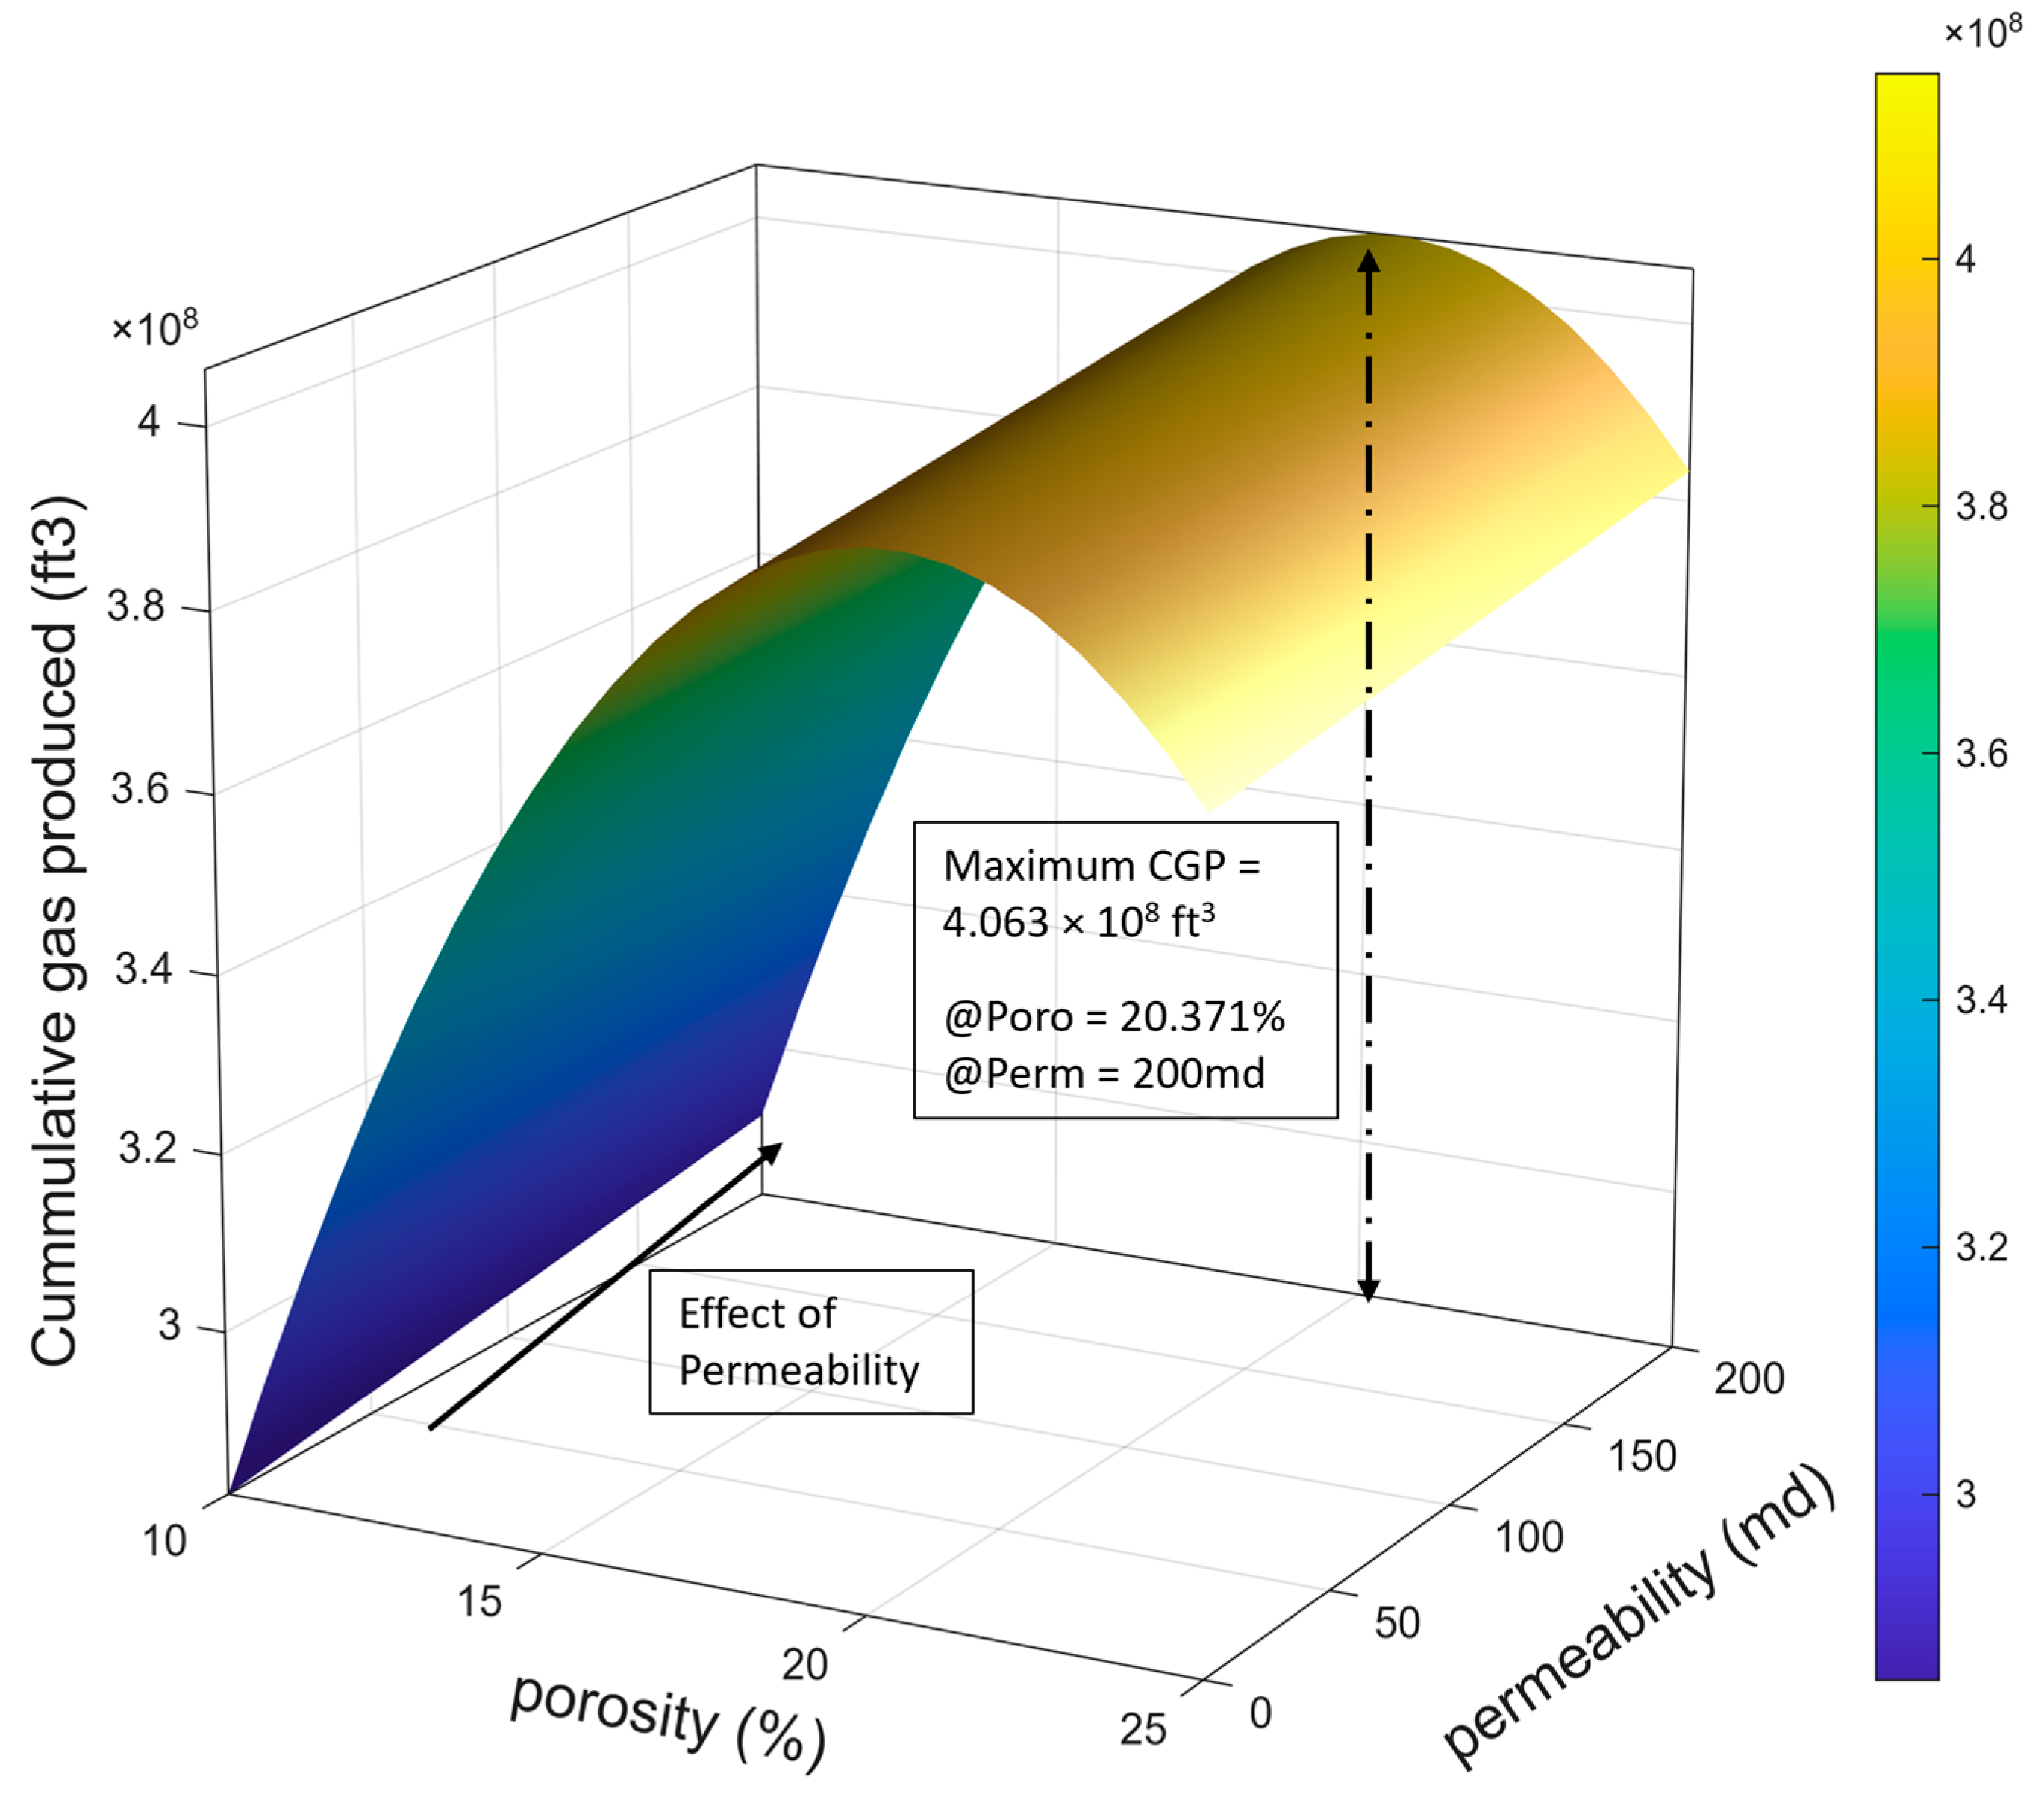
The effect of reservoir permeability and porosity on CGP were obtained keeping all other parameters constant. From the analysis, a second-order polynomial was observed between porosity and CGP as seen in Figure 9b. The maximum gas production was observed on reservoirs with approximately 20% porosity and 200md permeability. Investigating the coupled impact of permeability and porosity on cumulative gas production, our analysis reveal that porosity has a stronger influence on the CGP than permeability as shown in Figure 10. The results demonstrates that EK-EOR is more effective on reservoirs with higher permeability; porosity range between 18 and 22 increase in CGP with permeability reflects the enhanced ease of gas flow and electro-osmotic transport in more conductive formations; higher permeability reduces capillary resistance, allowing the applied electric field to more effectively mobilize condensate and brine along existing pore channels.
The observations from this analysis are consistent with results from other studies [18], which indicate that at low porosity, restricted pore volume and limited fluid connectivity reduce gas mobility and dampen electro-osmotic flow. At very high porosity, the larger pore spaces weaken the capillary pressure gradients that drive condensate displacement under an electric field, leading to reduced sweep efficiency. The resulting optimum range (18–22%) potentially indicates a balance between sufficient pore connectivity and adequate capillary coupling for electrokinetic enhancement. These findings suggest that moderately porous, high-permeability formations are most favourable for EK-EOR deployment of gas-condensate reservoirs.

4.3. Effect of Well Location on EK-EOR Effectiveness

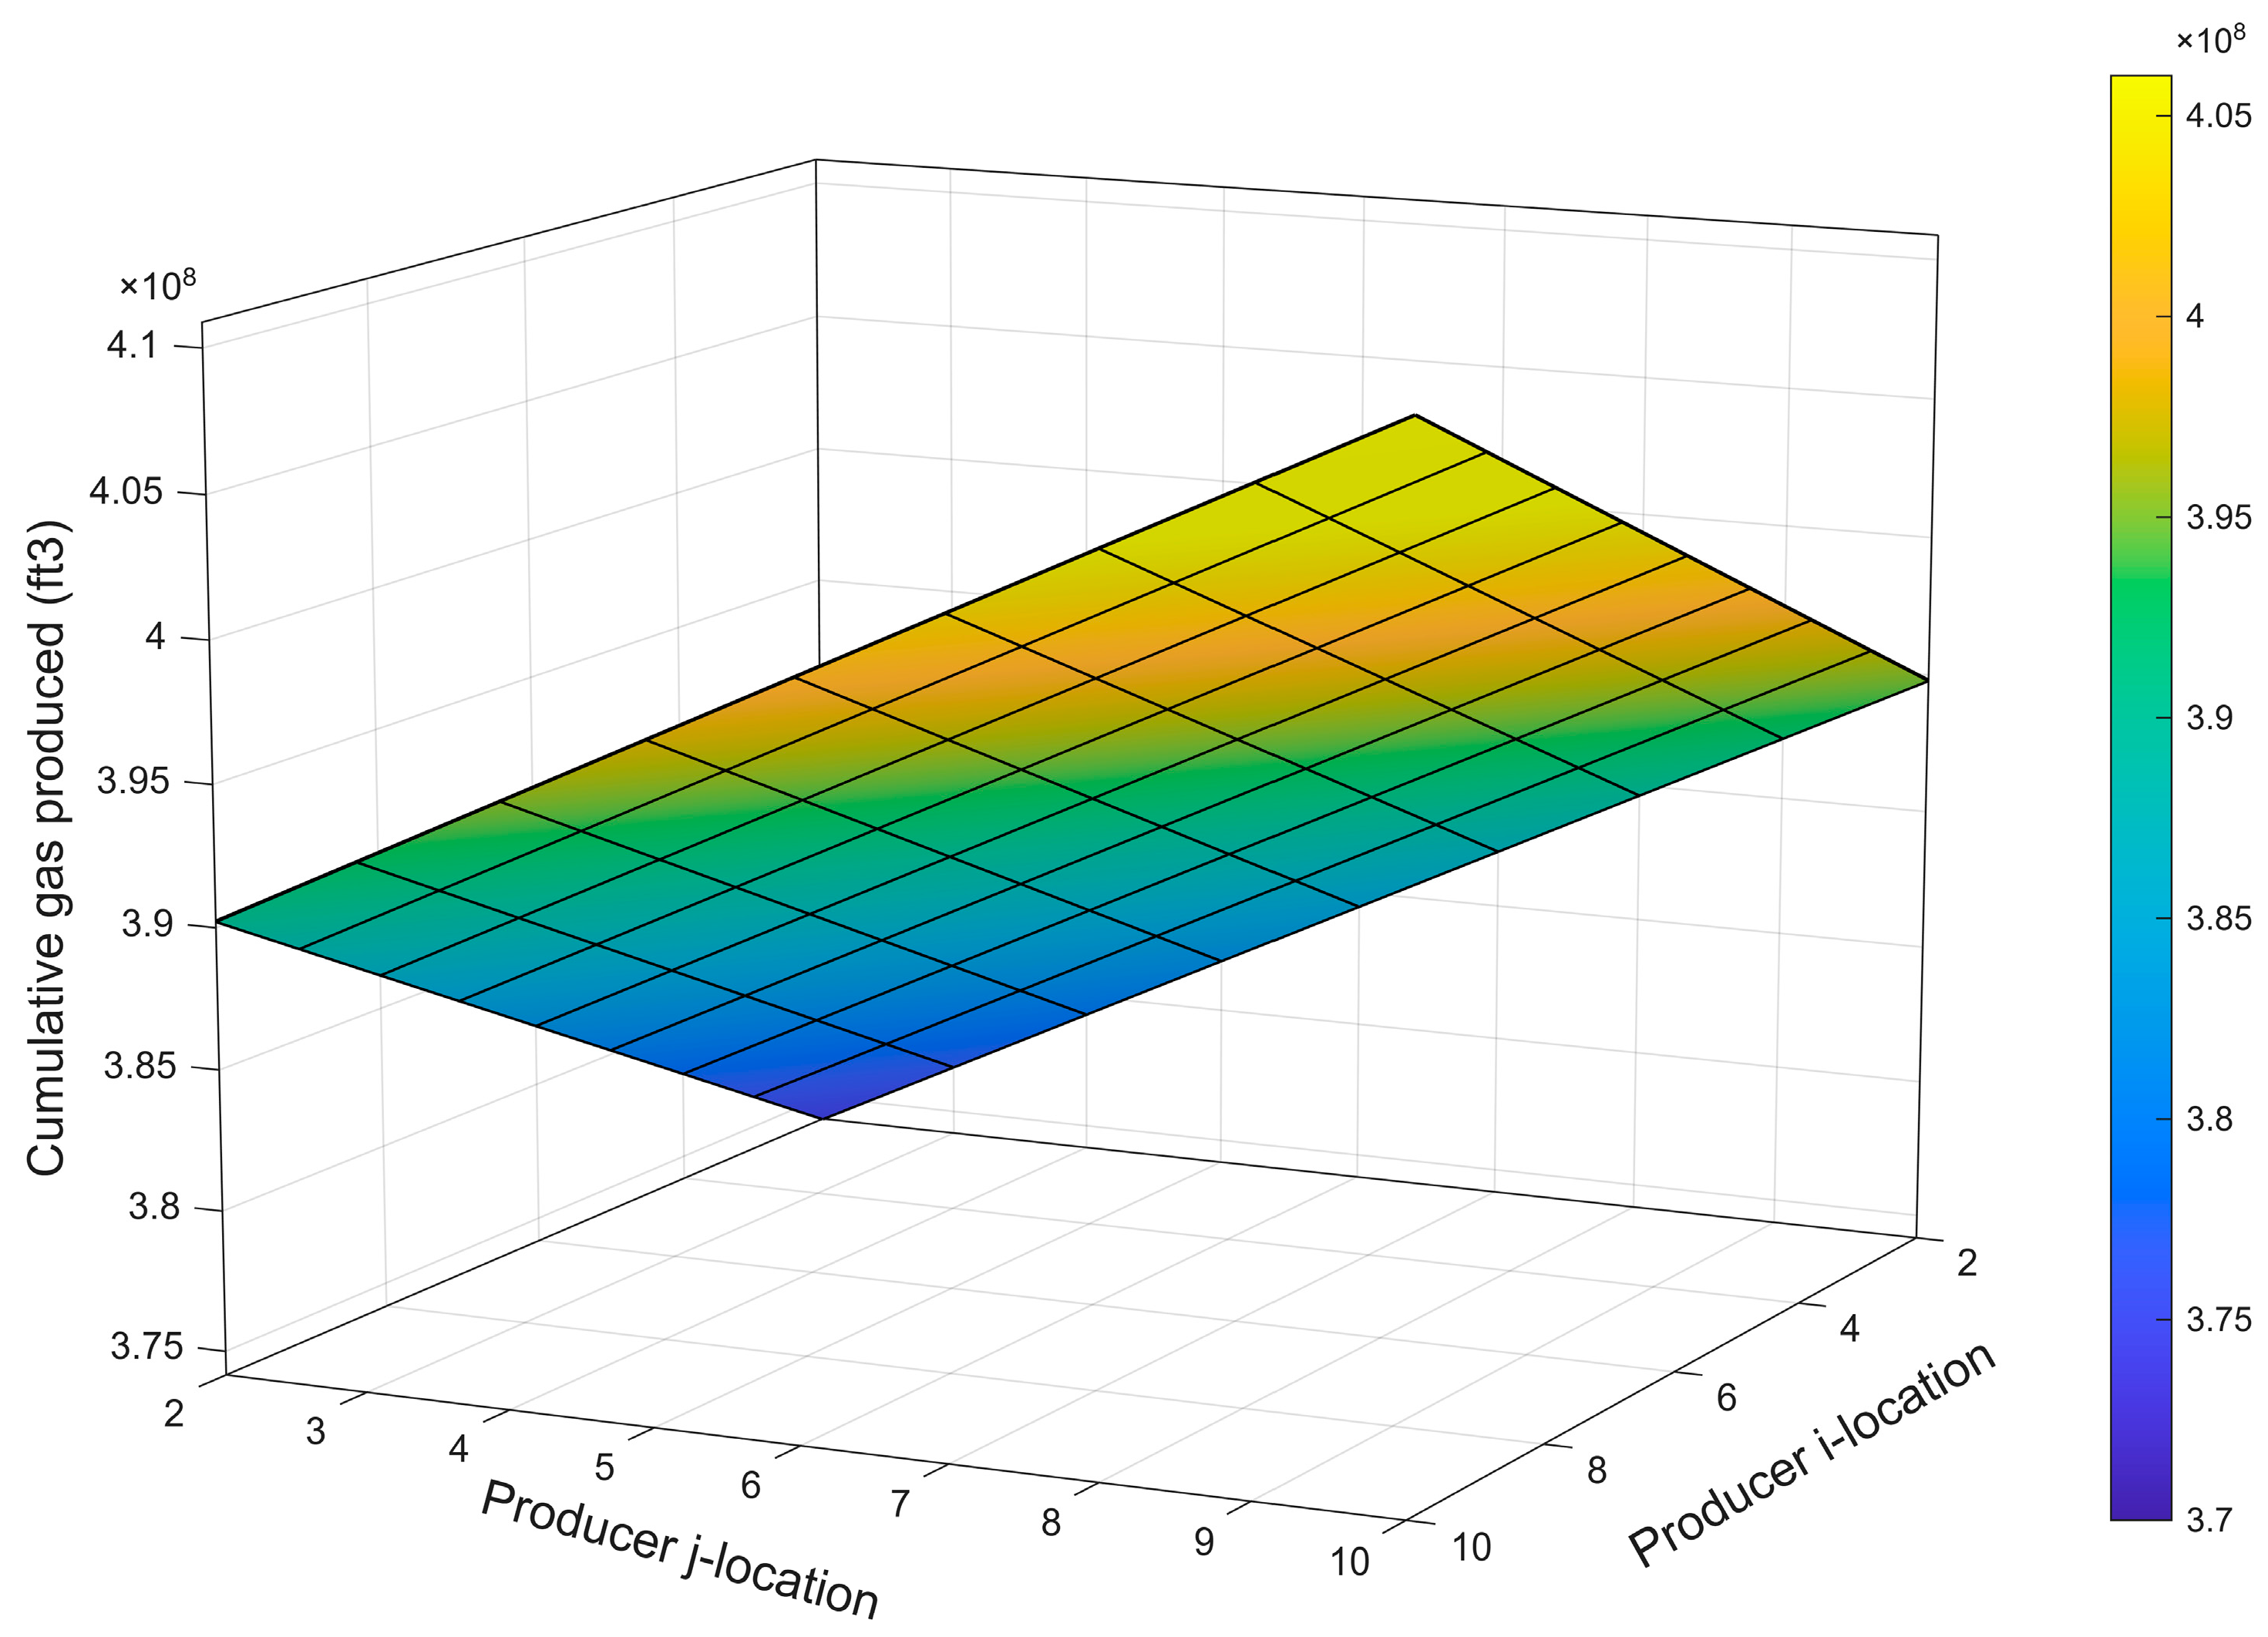
The EK-EOR set-up used for this analysis [10] included both production and injection well. Keeping the location of the injection well constant, enables the use of genetic algorithm to estimate CGP at different possible locations of the production well {i} and {j} as shown in Figure 11. When the producer well is positioned closer to the reservoir boundary, a larger pressure gradient develops between the injector and producer, enhancing sweep efficiency and electrokinetic current distribution across the pore network. This extended drainage path allows the injected low-salinity brine, driven by both hydraulic and electro-osmotic forces, to contact a greater portion of the condensate-banked zone, thereby improving gas mobility and condensate removal. In contrast, producer wells located nearer the injector reduce the effective potential drop and sweep area, leading to early saturation equilibrium and lower recovery. Hence, the optimal well configuration under EK-EOR conditions corresponds to maximizing injector–producer spacing while maintaining adequate electrical connectivity, ensuring both efficient field coverage and sustained electrokinetic stimulation throughout the reservoir.

5. Conclusions

This study extends the analysis on the previous work [10] by developing a surrogate-based optimization workflow to evaluate the effectiveness of electrokinetic enhanced recovery (EK-EOR) for gas condensate banking remediation under various reservoir and operational conditions. Using a Box–Behnken design and 62 compositional simulations, a proxy model was built to predict cumulative gas production from six key factors (reservoir porosity and permeability, production well location, and brine injection rate, pressure, and placement under an applied electric field). The proxy was validated with high accuracy (AAPE~2.2%), and genetic algorithm optimization was then applied. The results indicate that EK-EOR performance is strongly influenced by injection parameters as follows: lower brine injection rates and lower injection pressures were found to maximize gas recovery, likely by minimizing water blocking and efficiently mobilizing condensate. Within the studied range, the optimal scenario occurred at the lowest tested injection rate and pressure. Reservoir properties also play a critical role—higher permeability formations yield greater gas output under EK-EOR, and a moderate porosity (~20%) was optimal for recovery (with both lower and higher porosities giving slightly reduced yields in our model). Additionally, well placement was shown to be important: the genetic algorithm suggests that situating the production well toward the reservoir boundary (maximizing the drainage area between injector and producer) can significantly enhance condensate cleanup and gas production during EK-EOR. These findings provide quantitative guidance on how to design EK-EOR operations (in terms of injection scheduling and well configurations) to achieve the greatest benefit in condensate-rich gas reservoirs.
However, it is important to note the limitations of this study. The simulations assumed a fixed electric field and brine salinity, and a relatively homogeneous reservoir model—factors such as the magnitude of applied voltage, reservoir heterogeneity, and clay content (which influences electro-osmotic flow) were not varied and could impact outcomes. Additionally, the optimized parameters were constrained by the chosen ranges and may shift under different reservoir scenarios, indicating that the true global optimum may lie outside the modelled region. This boundary effect limits the interpretability of the optimum and emphasizes directional influence and relative importance of each parameter. Future research should incorporate the electrokinetic-specific parameters (voltage gradients, electrode configurations, salinity levels) into the optimization and consider history-matched field data or lab experiments to validate the proxy model’s predictions. Despite these limitations, the present study underscores that with an appropriate combination of reservoir conditions and operating parameters, EK-EOR can substantially mitigate condensate blockage and improve gas recovery. It lays a foundation for more comprehensive evaluations of electrokinetic methods as a viable, low-footprint enhancement for gas condensate reservoir production

Author Contributions

Conceptualization, P.M.I.; methodology, P.M.I. and J.U.; software, P.M.I.; validation, J.U., U.I.D. and N.P.O.; formal analysis, P.M.I.; investigation, S.O.; resources, P.M.I. and J.U.; data curation, N.P.O.; writing—original draft preparation, P.M.I.; writing—review and editing, U.I.D.; supervision, J.U., S.O.; project administration, S.O. All authors have read and agreed to the published version of the manuscript.

Funding

This research received no external funding.

Data Availability Statement

The data presented in this study are openly available in [https://doi.org/10.1002/ese3.70356].

Acknowledgments

The author appreciates technical support provided by members of staff at Protium Energy Solutions—especially for providing resources for reservoir simulation.

Conflicts of Interest

Author Princewill M. Ikpeka was employed by the Protium Energy Solutions Ltd. The remaining authors declare that the research was conducted in the absence of any commercial or financial relationships that could be construed as a potential conflict of interest.

Abbreviations

The following abbreviations are used in this manuscript:
CGPCumulative Gas Production
BHPBottomhole Pressure
EK-EORElectrokinetic Enhanced Oil Recovery
RMSERoot mean Square Error
AAPEAverage Absolute Percentage Error

Appendix A. Parameter Realizations and Result from Reservoir Simulation

s/nPorosity (%)Permeability (md)P_iP_jInjection
Rate (ft3/Day)
Injection Pressure (psi)Cumulative Gas (ft3)
1102055350035002.089 × 108
2302055350035002.265 × 108
31020055350035002.152 × 108
43020055350035002.295 × 108
51010015350035002.166 × 108
63010015350035002.310 × 108
71010095350035002.154 × 108
83010095350035002.257 × 108
91010052350035002.125 × 108
103010052350035002.297 × 108
111010059350035002.153 × 108
123010059350035002.257 × 108
131010055200035002.275 × 108
143010055200035002.453 × 108
151010055500035001.810 × 108
163010055500035002.112 × 108
171010055350010002.479 × 108
183010055350010002.623 × 108
191010055350060002.163 × 108
203010055350060002.284 × 108
21202015350035003.109 × 108
222020015350035003.362 × 108
23202095350035003.273 × 108
242020095350035003.225 × 108
25202052350035003.100 × 108
262020052350035003.324 × 108
27202059350035003.273 × 108
282020059350035003.225 × 108
29202055200035003.530 × 108
302020055200035003.715 × 108
31202055500035002.694 × 108
322020055500035002.717 × 108
33202055350010003.798 × 108
342020055350010003.906 × 108
35202055350060003.160 × 108
362020055350060003.286 × 108
372010012350035003.375 × 108
382010092350035003.258 × 108
392010019350035003.285 × 108
402010099350035003.232 × 108
412010015200035003.556 × 108
422010095200035003.585 × 108
432010015500035003.027 × 108
442010095500035002.608 × 108
452010015350010003.831 × 108
462010095350010003.874 × 108
472010015350060003.289 × 108
482010095350060003.211 × 108
492010052200035003.540 × 108
502010059200035003.585 × 108
512010052500035002.990 × 108
522010059500035002.608 × 108
532010052350010003.868 × 108
542010059350010003.874 × 108
552010052350060003.289 × 108
562010059350060003.211 × 108
572010055200010003.840 × 108
582010055500010003.920 × 108
592010055200060003.713 × 108
602010055500060002.709 × 108
612010055350035003.256 × 108
622011055350035003.287 × 108

Appendix B. Model Diagnostics

Gases 06 00016 i001

References

  1. Al-Anazi, H.A.; Pope, G.A.; Sharma, M.M.; Metcalfe, R.S. Laboratory Measurements of Condensate Blocking and Treatment for Both Low and High Permeability Rocks. In Proceedings of the SPE Annual Technical Conference and Exhibition, San Antonio, TX, USA, 29 September–2 October 2002; p. SPE-77546-MS. [Google Scholar] [CrossRef]
  2. Humoud, A.A.; Al-Marhoun, M.A. A New Correlation for Gas-condensate Dewpoint Pressure Prediction. In Proceedings of the SPE Middle East Oil Show, Manama, Bahrain, 11–14 March 2007; pp. 1–8. [Google Scholar] [CrossRef]
  3. Hassan, A.; Mahmoud, M.; Al-Majed, A.; Alawi, M.B.; Elkatatny, S.; BaTaweel, M.; Al-Nakhli, A. Gas condensate treatment: A critical review of materials, methods, field applications, and new solutions. J. Pet. Sci. Eng. 2019, 177, 602–613. [Google Scholar] [CrossRef]
  4. Al-Anazi, H.A.; Al-Otaibi, M.A.; Al-Faifi, M.; Hilab, V.V. Enhancement of Gas Productivity Using Alcoholic Acids: Laboratory and Field Studies. In Proceedings of the SPE Annual Technical Conference and Exhibition, San Antonio, TX, USA, 24–27 September 2006; p. SPE-102383-MS. [Google Scholar] [CrossRef]
  5. Bang, V.; Pope, G.A.; Sharma, M.M.; Baran, J.R.; Ahmadi, M. A new solution to restore productivity of gas wells with condensate and water blocks. SPE Reserv. Eval. Eng. 2010, 13, 323–331. [Google Scholar] [CrossRef]
  6. Ahmadi, M.; Sharma, M.M.; Pope, G.A.; Torres, D.E.; McCulley, C.A.; Linnemeyer, H. Chemical treatment to mitigate condensate and water blocking in gas wells in carbonate reservoirs. SPE Prod. Oper. 2011, 26, 67–74. [Google Scholar] [CrossRef]
  7. Bang, V.S.S.; Yuan, C.; Pope, G.A.; Sharma, M.M.; Baran, J.R., Jr.; Skildum, J.; Linnemeyer, H.C. Improving Productivity of Hydraulically Fractured Gas Condensate Wells by Chemical Treatment. In Proceedings of the Offshore Technology Conference, Houston, TX, USA, 5–8 May 2008; p. OTC-19599-MS. [Google Scholar] [CrossRef]
  8. Hekmatzadeh, M.; Gerami, S. A new fast approach for well production prediction in gas-condensate reservoirs. J. Pet. Sci. Eng. 2018, 160, 47–59. [Google Scholar] [CrossRef]
  9. Ikpeka, P.; Ugwu, J.O.O.; Pillai, G.G.G.; Russell, P. Effect of direct current on gas condensate droplet immersed in brine solution. J. Pet. Explor. Prod. Technol. 2021, 11, 2845–2860. [Google Scholar] [CrossRef]
  10. Ikpeka, P.M.; Uzoagba, C.E.J. Evaluating the Efficacy of Low Salinity Waterflood and Electrokinetic Enhanced Oil Recovery in Mitigating Gas Condensate Banking. Energy Sci. Eng. 2025, 14, 322–334. [Google Scholar] [CrossRef]
  11. Al Shalabi, E.W.; Haroun, M.; Ghosh, B.; Pamukcu, S. The Stimulation of Sandstone Reservoirs Using DC Potential. Pet. Sci. Technol. 2012, 30, 2137–2147. [Google Scholar] [CrossRef]
  12. Ansari, A.; Haroun, M.; Rahman, M.M.; Chilingar, G.V. A novel cost-effective approach for enhancing capillary number while stimulating Abu Dhabi tight carbonate reservoirs. In Proceedings of the Society of Petroleum Engineers-SPE Russian Petroleum Technology Conference and Exhibition, Moscow, Russia, 24–26 October 2016; pp. 1957–1971. [Google Scholar] [CrossRef]
  13. Ghosh, B.; Al Shalabi, E.W.; Haroun, M. The effect of DC electrical potential on enhancing sandstone reservoir permeability and oil recovery. Pet. Sci. Technol. 2012, 30, 2148–2159. [Google Scholar] [CrossRef]
  14. Haroun, M.; Ghosh, B.; Chilingar, G.; Pamukcu, S.; Wittle, J.; Al Badawi, M. A Novel Electrokinetics Method of Oilfield Scale Control. In Proceedings of the SPE Western Regional Meeting, Anaheim, CA, USA, 27–29 May 2010; Society of Petroleum Engineers: Richardson, TX, USA, 2010. [Google Scholar] [CrossRef]
  15. Chilingar, G.V.; El-Nassir, A.; Stevens, R.G. Effect of Direct Electrical Current on Permeability of Sandstone Cores. J. Pet. Technol. 1970, 22, 830–836. [Google Scholar] [CrossRef]
  16. Yim, Y.; Haroun, M.R.; Al Kobaisi, M.; Sarma, H.K.; Gomes, J.S.; Rahman, M.M. Experimental Investigation of Electrokinetic Assisted Hybrid Smartwater EOR in Carbonate Reservoirs. In Proceedings of the Abu Dhabi International Petroleum Exhibition & Conference, Abu Dhabi, United Arab Emirates, 13–16 November 2017; Society of Petroleum Engineers: Richardson, TX, USA, 2017. [Google Scholar] [CrossRef]
  17. Ghazanfari, E.; Pamukcu, S.; Pervizpour, M.; Karpyn, Z. Investigation of Generalized Relative Permeability Coefficients for Electrically Assisted Oil Recovery in Oil Formations. Transp. Porous Media 2014, 105, 235–253. [Google Scholar] [CrossRef]
  18. Paillat, T.; Moreau, E.; Grimaud, P.O.; Touchard, G. Electrokinetic phenomena in porous media applied to soil decontamination. IEEE Trans. Dielectr. Electr. Insul. 2000, 7, 693–704. [Google Scholar] [CrossRef]
  19. Zhang, W.; Ning, Z.; Zhang, B.; Wang, Q.; Cheng, Z.; Huang, L.; Qi, R.; Shang, X. Experimental investigation of driving brine water for enhanced oil recovery in tight sandstones by DC voltage. J. Pet. Sci. Eng. 2019, 180, 485–494. [Google Scholar] [CrossRef]
  20. Alklih, M.Y.; Ghosh, B.; Al-Shalabi, E.W. A Novel Method for Improving Water Injectivity in Tight Sandstone Reservoirs. J. Pet. Eng. 2014, 2014, 864624. [Google Scholar] [CrossRef]
  21. Ren, L.; Lu, H.; He, L.; Zhang, Y. Enhanced electrokinetic technologies with oxidization-reduction for organically-contaminated soil remediation. Chem. Eng. J. 2014, 247, 111–124. [Google Scholar] [CrossRef]
  22. Ikpeka, P.M.; Ugwu, J.O.; Pillai, G.G.; Russell, P. Effectiveness of electrokinetic-enhanced oil recovery (EK-EOR): A systematic review. J. Eng. Appl. Sci. 2022, 69, 60. [Google Scholar] [CrossRef]
  23. Gill, R.T.; Harbottle, M.J.; Smith, J.W.N.; Thornton, S.F. Electrokinetic-enhanced bioremediation of organic contaminants: A review of processes and environmental applications. Chemosphere 2014, 107, 31–42. [Google Scholar] [CrossRef]
  24. Ghazanfari, E.; Shrestha, R.A.; Miroshnik, A.; Pamukcu, S. Electrically assisted liquid hydrocarbon transport in porous media. Electrochim. Acta 2012, 86, 185–191. [Google Scholar] [CrossRef]
  25. Nwanwe, O.I.; Izuwa, N.C.; Ohia, N.P.; Kerunwa, A. A response surface model for assessing the impact of well placement and/or well injection/production control optimization approaches on foam injection performance in heterogeneous oil reservoirs. Int. J. Pet. Geosci. Eng. 2022, 2022, 1–18. [Google Scholar]
  26. Tigran, A.; Dmitriy, O. An Application of Proxy-Modeling Framework for Numerical PVT-Models Matching on Laboratory Measured Data (Russian). In Proceedings of the SPE Russian Petroleum Technology Conference, Moscow, Russia, 16–18 October 2017; Society of Petroleum Engineers: Richardson, TX, USA, 2017. [Google Scholar] [CrossRef]
  27. Ikpeka, P.; Alozieuwa, E.; Duru, U.I.; Ugwu, J. A parametric study on in-situ hydrogen production from hydrocarbon reservoirs–Effect of reservoir and well properties. Int. J. Hydrogen Energy 2024, 80, 733–742. [Google Scholar] [CrossRef]
  28. Bahrami, P.; Sahari Moghaddam, F.; James, L.A. A Review of Proxy Modeling Highlighting Applications for Reservoir Engineering. Energies 2022, 15, 5247. [Google Scholar] [CrossRef]
  29. Forrester, A.I.J.; Sóbester, A.; Keane, A.J. Engineering Design via Surrogate Modelling; Wiley: Chichester, UK, 2008. [Google Scholar] [CrossRef]
  30. Negash, B.M.; Ayoub, M.A.; Jufar, S.R.; Robert, A.J. History Matching Using Proxy Modeling and Multiobjective Optimizations. In Proceedings of the International Conference on Integrated Petroleum Engineering and Geosciences 2016; Springer: Singapore, 2017; pp. 3–16. [Google Scholar] [CrossRef]
  31. Du, S.-Y.; Zhao, X.-G.; Xie, C.-Y.; Zhu, J.-W.; Wang, J.-L.; Yang, J.-S.; Song, H.-Q. Data-driven production optimization using particle swarm algorithm based on the ensemble-learning proxy model. Pet. Sci. 2023, 20, 2951–2966. [Google Scholar] [CrossRef]
  32. Kim, J.; Choe, J.; Lee, K. Sequential field development plan through robust optimization coupling with CNN and LSTM-based proxy models. J. Pet. Sci. Eng. 2022, 209, 109887. [Google Scholar] [CrossRef]
  33. Kenyon, D. Third SPE Comparative Solution Project: Gas Cycling of Retrograde Condensate Reservoirs. J. Pet. Technol. 1987, 39, 981–997. [Google Scholar] [CrossRef]
  34. Ahmadi, M.A.; Ebadi, M. Evolving smart approach for determination dew point pressure through condensate gas reservoirs. Fuel 2014, 117, 1074–1084. [Google Scholar] [CrossRef]
Figure 1. Box–Behnken design.
Gases 06 00016 g001
Figure 2. A methodology employed in proxy model optimization.
Gases 06 00016 g002
Figure 3. Time series for cumulative gas produced.
Gases 06 00016 g003
Figure 4. (a) Distribution type curve fit. (b) Histogram plot.
Gases 06 00016 g004
Figure 5. (a) Cross plot of the proxy model vs. simulated CGP. (b) Simulated and proxy model CGP plot against simulation runs.
Gases 06 00016 g005
Figure 6. Flowgorithm of genetic algorithm used in this study.
Gases 06 00016 g006
Figure 7. (a) Effect of injection rate on EK-EOR CGP; (b) effect of injection pressure on EK-EOR CGP.
Gases 06 00016 g007
Figure 8. Effect of injection parameters on EK-EOR performance.
Gases 06 00016 g008
Figure 9. (a) Relationship between permeability and EK-EOR Cum Gas produced; (b) relationship between porosity and EK-EOR Cum Gas produced.
Gases 06 00016 g009
Figure 10. Effect of porosity and permeability on EK-EOR performance.
Gases 06 00016 g010
Figure 11. Effect of Well location on EK-EOR performance.
Gases 06 00016 g011
Table 1. Input parameter range for the Box–Behnken design.
ParameterUnitSymbolLow CaseMid CaseHigh Case
Porosity %X1102030
Horizontal permeability mdX220100200
Producer location (i) -X3159
Producer location (j)-X4259
Injection rate ft3/dayX5200035005000
Injection pressure (BHP)psiX6100035006000
Table 2. Analysis of variance for the Proxy model.
FactorsSum of SquaresDFF-Valuep-ValueSignificant
X1 8.513 × 10 16 1.0574.530.000*
X2 1.770 × 10 14 1.01.130.295
X3 1.601 × 10 13 1.00.160.696
X4 2.428 × 10 12 1.00.030.857
X5 8.335 × 10 12 1.00.090.767
X6 9.770 × 10 15 1.066.760.000*
(X1)2 8.394 × 10 16 1.0563.440.000*
(X2)2 7.902 × 10 13 1.00.460.504
(X3)2 5.028 × 10 11 1.00.010.908
(X4)2 1.484 × 10 11 1.000.98
(X5)2 2.595 × 10 14 1.01.60.215
(X6)2 5.435 × 10 15 1.036.790.000*
X2. X3 1.993 × 10 14 1.01.610.213
X3. X4 7.966 × 10 12 1.00.060.81
X2. X4 1.586 × 10 14 1.01.260.269
X2. X5 1.205 × 10 14 1.01.050.314
X2. X6 5.810 × 10 10 1.000.976
X5. X6 2.938 × 10 15 1.025.680.000*
X4. X5 5.145 × 10 14 1.04.590.039*
X3. X5 5.018 × 10 14 1.04.460.042*
* parameters with p-value less than 0.05.
Table 3. K-Fold validation of proxy model.
Fold12345Avg R2
R20.9580.9710.9630.9680.9640.965
Table 4. Parameters for tuning the genetic algorithm.
ParameterValue
Population size100
Generations100 × number of variables
Reproduction0.05 × population size
Crossover functionConstraint dependent
Mutation functionConstraint dependent
Table 5. Optimization results.
TechniqueResponseOptimized Parameters
EK-EORMax CGP = 4.06 × 108 ft3 X1 = 20.37, X2 = 200, X3 = 9, X4 = 9, X5 = 2000, X6 = 1000
Disclaimer/Publisher’s Note: The statements, opinions and data contained in all publications are solely those of the individual author(s) and contributor(s) and not of MDPI and/or the editor(s). MDPI and/or the editor(s) disclaim responsibility for any injury to people or property resulting from any ideas, methods, instructions or products referred to in the content.