


Abstract
This study examines how different sustainability assessment approaches influence climate-policy choices when evaluating greenhouse gas (GHG) emissions across industrial value chains. Using Spain as an empirical setting, we apply Environmentally Extended Input–Output Tables combined with Production Layer Decomposition to quantify Scope 1–2–3 emissions and assess economic and employment impacts. The results show that indirect emissions dominate most value chains, revealing structural dependencies that are not captured by sector-level inventories. Incorporating social and economic dimensions highlights the need for transition pathways that minimise employment disruption while maximising environmental gains. Although public procurement can enhance the uptake of emerging low-carbon and circular-economy technologies, it has limited quantitative influence on total value-chain emissions. The findings demonstrate that value-chain-based sustainability assessments provide a more comprehensive basis for designing coherent, equitable, and effective decarbonisation strategies.
1. Introduction
Greenhouse gas (GHG) emissions are the primary driver of anthropogenic climate change, making their mitigation a central policy challenge [1]. Industrial systems—spanning extraction, manufacturing, logistics, product use, and end of life—account for a substantial share of global emissions and are embedded in complex, multi-tiered value chains in which environmental impacts are distributed across multiple stages of production [2]. These emissions include direct releases at the firm or sector level (Scope 1), indirect emissions from purchased energy (Scope 2), and upstream and downstream emissions along supply chains (Scope 3), the latter representing the most comprehensive yet least-consistently reported component of corporate carbon footprints. For many manufacturing industries, Scope 3 emissions account for a dominant share of total emissions—often exceeding 70 percent—underscoring the need for greater value-chain transparency in climate governance [3,4]. Industrial value chains can therefore be understood as interconnected networks of production and transformation activities whose environmental profiles vary according to technological characteristics, resource bases, and production structures [5].
From a sustainability perspective, the focus on emissions, while crucial, is only one aspect of the broader challenge—particularly when policy decisions involve prioritisation among sectors and value chains. Ensuring the continuity of jobs and minimising disruptions to economic activity are equally significant considerations in the design of decarbonisation strategies, especially in energy- and material-intensive industries [6]. This multiple focus reflects the need for an integrated approach that recognises the interconnections between the environmental, social, and economic dimensions of sustainability [7]. In this context, a just transition—one that not only addresses ecological goals but also safeguards livelihoods—has become a central concern in the formulation of climate and industrial policies [8,9].
While integrated sustainability assessments (SAs) have the potential to support more informed policy decisions, existing approaches differ substantially in terms of system boundaries, analytical focus, and dimensional coverage. As a result, alternative assessment frameworks may lead to different interpretations of industrial performance and divergent evaluations of climate policy options, particularly when indirect emissions and value-chain interdependencies are considered [10].
Against this backdrop, this article examines the following research question: How does the adoption of different sustainability-oriented approaches to assessing GHG emissions along industrial value chains shape the evaluation of climate-policy options?
In particular, this analysis compares sector-based and value-chain perspectives, along with emissions-focused and multidimensional sustainability assessments.
To address this question, we employ Spain as an empirical setting. Spain offers a particularly relevant context for analysing the sustainability dimensions of industrial value chains. Many of its medium-technology and energy-intensive industries operate within extensive international value chains and rely structurally on imported energy, materials, and industrial intermediates—factors that amplify the importance of indirect emissions. Although national GHG emissions declined by 18% between 2008 and 2018 [11] due to efficiency gains and power-sector decarbonisation, several industrial branches remain dependent on carbon-intensive upstream activities. Spain’s reliance on industrial activity is broadly in line with the EU average (20% versus 22% of GDP in 2023, according to theglobaleconomy.com accessed on 15 December 2025), and its industrial base is relatively labour-intensive due to the notable presence of medium- and low-technology sectors [12]. Spain’s diverse industrial composition—including ceramics, cement, refining, non-ferrous metals, textiles, food processing, and automotive components—thus provides an informative landscape for examining how emissions and other sustainability dimensions accumulate across heterogeneous value chains.
Our study contributes to four strands of the literature.
First, it contributes to the literature on industrial greenhouse gas emissions by moving beyond production-based and sector-level perspectives and examining how emissions accumulate across interconnected industrial value chains, with particular attention to Scope 3 emissions. In doing so, it responds to calls for analytical approaches capable of capturing embodied emissions and cross-sectoral dependencies in modern production systems.
Second, this paper contributes to research on Scope 3 accounting and value-chain emissions by comparing alternative sustainability assessment approaches and examining how their underlying assumptions shape the evaluation of climate policy options. This perspective highlights how methodological choices influence not only measured emissions but also the interpretation of mitigation priorities.
Third, this study contributes to the sustainability assessment literature by empirically applying frameworks that integrate environmental, economic, and social dimensions into industrial value chains and showing how alternative assessment choices lead to different policy-relevant rankings and priorities. Thus, it addresses a gap between the availability of system-wide analytical tools and their empirical application in policy-relevant contexts.
Finally, this paper contributes to the literature on industrial and climate policy by providing evidence relevant to the design of decarbonisation strategies that are sensitive to value-chain structures, employment considerations, and economic interdependencies. By focusing on Spain as an empirical setting, this study offers insights relevant for countries with similar industrial profiles and exposure to indirect emissions.
The remainder of this article is structured as follows. Section 2 reviews the relevant literature on GHG emissions, Scope 3 accounting, sustainability assessment, and value-chain analysis. Section 3 explains the methodological steps taken to conduct the empirical analysis. Section 4 presents the results. Section 5 discusses the findings in light of climate and industrial policy options. Section 6 presents the main conclusions, and Section 7 discusses this study’s limitations.
2. Literature Review
2.1. Greenhouse Gas Emissions and Industrial Systems
Recent empirical studies conducted across the agri-food, manufacturing, petrochemical, and extractive industries show that indirect emissions frequently exceed direct on-site emissions. For example, Akamati et al. [13] demonstrated that in the Greek poultry sector, emissions associated with feed production, fertiliser use, and transport outweigh emissions occurring at the farm level. Their analysis shows that sectoral climate impacts depend critically on upstream inputs and supporting activities rather than final production processes alone.
Similar patterns are observed in energy-intensive and extractive industries. Acevedo Blanco and Gallo [14], analysing offshore oil and gas platforms, found that most emissions originate from combustion processes used to power extraction, compression, and auxiliary operations. In addition, they identified fugitive methane emissions as a relevant component of total climate impact, noting that such emissions are characterised by high global warming potential and substantial measurement uncertainty. These findings highlight the heterogeneous nature of industrial emissions, which include both CO2 from energy use and non-CO2 gases linked to operational practices and monitoring regimes.
Recent contributions [15,16,17] increasingly conceptualise industrial activity as part of interconnected production networks, in which emissions are distributed across multiple sectors and stages of production. Input–output-based and footprint analyses show that emissions embodied in traded intermediates and energy carriers may be located far upstream of final production. These studies indicate that mitigation strategies focusing exclusively on plant-level emissions risk overlooking important sources of emissions embedded in material supply, energy provision, and inter-sectoral linkages.
Taken together, the empirical literature suggests that analysing industrial GHG emissions requires approaches capable of capturing cross-sectoral flows, embodied emissions, and process-specific sources rather than relying solely on direct emissions at the point of production. Table 1 summarises the main directions of empirical research on industrial GHG emissions and highlights their implications for system-level analysis.
Table 1.
Main directions of research on greenhouse gas emissions in industrial systems.
2.2. Scope 1, Scope 2, and Scope 3 Emissions
The Scope 1–2–3 classification developed under the Greenhouse Gas Protocol has become a central framework for carbon accounting, disclosure, and climate-related target-setting. Scope 1 covers direct emissions from owned or controlled sources; Scope 2 refers to indirect emissions from purchased electricity, heat, and steam; and Scope 3 includes upstream and downstream emissions embodied in supply chains, such as intermediate inputs, transport, capital goods, and product use. This classification underpins corporate reporting standards and is widely used in empirical assessments of industrial emissions.
The empirical literature shows that Scope 3 emissions typically represent the largest share of total climate footprints in most industrial sectors, often exceeding Scope 1 emissions by a considerable margin [3]. Thus far, research [18,19] has consistently found that emissions embodied in materials, energy carriers, and intermediate goods dominate total impacts, particularly in the manufacturing and processing industries. Reviews relating to industrial ecology report that Scope 3 emissions frequently account for the majority of lifecycle emissions in industrial systems, reflecting the structure of modern production networks [4].
Despite their quantitative importance, Scope 3 emissions remain the least consistently measured component of industrial carbon footprints. Data constraints, heterogeneous system boundaries, and reliance on generic emission factors contribute to substantial variation in reported values across firms and sectors. Recent analyses of corporate disclosure practices indicate that while Scope 1 and Scope 2 reporting have become relatively standardised, Scope 3 estimates remain uneven in terms of coverage and methodological quality, with many firms reporting only selected categories or relying on simplified assumptions [20,21,22,23].
Scope 2 emissions, although conceptually more straightforward, are also frequently underemphasised in sectoral analyses [24]. The carbon intensity of purchased energy varies significantly across countries and over time, implying that identical industrial processes can generate substantially different emissions depending on the electricity and heat mix. This reinforces the need to account explicitly for energy-system characteristics when assessing industrial emissions.
Value chain analyses are consistent with the previous findings. Empirical studies adopting value-chain and lifecycle perspectives show that a substantial share of industrial greenhouse gas emissions is generated upstream of final production through material extraction, intermediate processing, and energy provision. Sectoral carbon footprints therefore often dominated by indirect emissions embedded in inputs rather than by on-site activities. Evidence from manufacturing industries indicates that sectors such as chemicals, non-metallic minerals, transport equipment, and machinery exhibit particularly high exposure to upstream emissions due to their reliance on energy-intensive and internationally sourced intermediates [25]. Comparable patterns are documented in broader European and global value-chain analyses, which have found that emissions embodied in traded intermediates frequently outweigh direct emissions in advanced industrial economies [26]. These results reinforce the need for analytical approaches that account for value-chain structures when assessing sectoral emissions profiles.
Overall, the empirical literature indicates that Scope 3 emissions constitute both the most significant and most methodologically challenging component of industrial climate footprints. This has motivated the development of analytical approaches that combine firm-level accounting with system-wide methods capable of tracing embodied emissions across value chains.
2.3. Sustainability Assessment: Frameworks for and Approaches to Analysis
Sustainability assessment is a broad methodological field concerned with evaluating the environmental, economic, and social implications of policies and production systems [10]. In the context of industrial systems characterised by complex value chains and significant indirect emissions, SA frameworks combine diverse tools—including indicators, simulation models, life-cycle assessment (LCA), and hybrid data-integration techniques—to support decision-making under conditions of interdependence and uncertainty [27,28].
- Indicator-based frameworks and monitoring capacity
Indicator systems remain widely used, particularly in policy and institutional settings, where they support monitoring, benchmarking, and comparison across regions and sectors. The empirical literature shows that such frameworks are well suited to tracking progress and communicating performance, although persistent challenges remain regarding data quality, weighting schemes, and spatial resolution [29]. In the EU and Spain, indicator-based frameworks underpin assessments of circular economy performance, resource efficiency, and industrial decarbonisation pathways and are increasingly aligned with climate and industrial policy objectives [30]. However, indicator systems typically offer limited insight into the underlying structural drivers of sustainability outcomes, particularly when impacts are generated through multi-tier value chains.
- Simulation tools and dynamic policy interactions
Simulation tools are commonly used to capture long-term dynamics, feedback effects, and interactions between policy interventions, technological change, and behaviour. Espinoza et al. [31], analysing the Colombian biodiesel sector, showed how policy shocks and technology choices jointly shape sustainability outcomes over time. More-recent applications confirm the relevance of simulation-based approaches for evaluating industrial decarbonisation strategies under uncertainty, especially in sectors exposed to volatile global markets and energy prices [32]. At the same time, simulation models tend to be case-specific and assumption-intensive, which can limit their applicability in comparative or system-wide assessments of industrial value chains.
- Life Cycle Assessment and upstream impacts
Life cycle assessment (LCA) plays a central role in quantifying upstream and downstream environmental impacts and is widely used for estimating Scope 3 emissions. It evaluates impacts across all life-cycle stages, from raw material extraction to end of life [28,33]. Empirical studies consistently show that upstream processes are frequently the dominant source of total greenhouse gas emissions: automotive LCAs attribute 70–80% of emissions to materials and components [34,35], while LCAs of textiles, agri-food systems, and appliances similarly identify materials, fertilisers, and logistics as major drivers [18,36,37]. While LCA provides detailed process-level insights, its application often remains bounded to specific products or cases, making it less suited to capturing economy-wide interdependencies.
- Hybrid and query-combination approaches
More recent developments include hybrid approaches that combine input–output tables, emissions coefficients, and trade data through structured queries. These methods enable more granular tracing of indirect emissions across multi-tier value chains and are increasingly applied in large-scale sustainability analyses. Examples include multi-regional input–output tracing of deep-tier emissions [38], global value-chain mapping [39,40], sustainability dashboards [41], and detailed carbon-footprint disaggregation [27,42]. Such approaches partially bridge the gap between product-level detail and system-wide coverage, although they still rely on assumptions about aggregation and sectoral homogeneity.
- Input–output modelling and system-wide interdependencies
Input–output tables extended with environmental and social variables have become a cornerstone of sustainability analysis in recent decades. Research has incorporated indicators related to energy, water, materials, employment, land use, and greenhouse-gas emissions [43,44,45,46,47]. Environmentally extended input–output tables (EEIOTs) are particularly relevant for estimating embodied emissions along value chains and underpin national inventories, multi-regional IO databases, and hybrid LCA approaches.
Recent applications confirm the relevance of IO-based approaches for climate policy analysis. Integrated economic–environmental modelling has been used to examine trade-offs between economic activity and emissions [48], while structural decomposition analysis helps distinguish structural from technological drivers of embodied emissions across regions and sectors [19,49]. These approaches are well suited to capturing cross-sectoral dependencies, although their level of aggregation can obscure firm-level or intra-sectoral dynamics.
- Extending sustainability assessment beyond environmental metrics
While early sustainability assessments focused primarily on environmental pressures, Elkington’s [7] “Triple Bottom Line” framework articulated a broader perspective integrating economic, environmental, and social dimensions. The subsequent literature emphasises that economic continuity and social well-being are integral components of sustainable development rather than peripheral concerns [50,51]. In the context of industrial transitions, employment preservation, skill adaptation, and economic resilience have been identified as key evaluation criteria [52,53]. This has motivated the use of integrated assessment approaches capable of capturing interactions among environmental outcomes, labour markets, and economic structures [54,55].
2.4. Policy Measures Applied in Pursuit of Sustainability
Policy frameworks increasingly recognise that effective decarbonisation requires addressing direct emissions (Scope 1), purchased energy (Scope 2), and value-chain emissions (Scope 3). Regulatory initiatives such as the EU’s Corporate Sustainability Reporting Directive (CSRD), European Sustainability Reporting Standards (ESRS), and taxonomy framework mandate or encourage disclosure of full value-chain impacts, reflecting the growing consensus that reducing direct emissions alone is insufficient and that supply-chain relations, product design, energy use, and business models must also be transformed [30,56].
Sustainability assessment increasingly functions as a governance instrument within industrial policy [57,58,59]. By shaping problem definitions, prioritisation, and stakeholder coordination, SA frameworks influence how climate and competitiveness objectives are aligned [10,60].
At the same time, the empirical literature shows that sustainability policy cannot ignore the social and economic dimensions associated with industrial sectors and value chains. Employment, job quality, and economic resilience are critical for ensuring that climate policies are both effective and socially acceptable, particularly in regions dependent on energy-intensive industries [53,61,62]. This has led to increasing attention to the concept of a just transition, which integrates environmental objectives with equity and distributional considerations [8,9,63].
Public procurement has emerged as a relevant policy lever in this context. Green public procurement can stimulate demand for low-carbon materials, reward suppliers with lower life-cycle emissions, and accelerate the diffusion of clean technologies [64]. However, empirical studies also identify persistent barriers related to cost perceptions, administrative capacity, and coordination across supply chains [65].
2.5. Linking Sustainability Assessment and Industrial Value Chains
Recent studies have recognised the central role of supply and value chains in structuring economic activity and shaping environmental outcomes [66]. A value chain encompasses the full set of activities through which inputs are transformed into products and services, from conception to end use [67]. Because these activities are interdependent, changes in one segment propagate upstream and downstream, making value-chain structures a key determinant of Scope 3 emissions. Supply and value chains can therefore be understood as complementary representations of extended production networks [68].
Environmentally extended input–output tables provide a robust analytical framework for assessing these interdependencies. By embedding environmental variables into IO structures, EEIOT models allow analysts to evaluate sustainability impacts across complete value chains [69]. Since their introduction by Leontief [70], IOTs have been used to represent economic structures and intersectoral relations; their environmental extensions enable systematic tracing of emissions, resource use, and employment across interconnected activities.
Value chains strongly condition where environmental and social impacts materialise and how they are distributed across actors [66,71]. Supply-chain sustainability research examines how investment, procurement, and operational decisions influence environmental, social, and governance outcomes [56]. As a result, value-chain analysis has become an important tool for understanding interdependencies within national and global economies [72]. Recently, researchers have increasingly been integrating social and environmental dimensions into global value-chain analysis, reflecting the need to identify where economic value, environmental pressures, and social outcomes co-evolve along the chain [73].
Despite these advances, a great deal of sustainability research remains focused on carbon footprints and mitigation options within supply-chain management [74]. The inherent complexity of value chains—with multiple actors, decision nodes, and types of feedback—continues to challenge their governance [75]. Value-chain mapping has emerged as one response, providing visual representations of actors, flows, and relationships that support our understanding of complexity and the identification of leverage points [76,77,78]. Such maps have proven useful for addressing sustainability challenges, including climate change, supply-chain disruptions, and critical-materials dependency [56].
2.6. Research Gap
The literature reviewed in Section 2.1, Section 2.2, Section 2.3, Section 2.4 and Section 2.5 shows significant advances in the measurement of greenhouse gas emissions across industrial systems, particularly through life-cycle assessment, environmentally extended input–output modelling, and hybrid approaches capable of tracing Scope 3 emissions along supply and value chains. At the same time, sustainability assessment frameworks are increasingly acknowledging the need to integrate environmental, economic, and social dimensions, and policy frameworks explicitly call for value-chain-oriented perspectives.
Despite this progress, sustainability assessments remain largely centred on emissions accounting and sector-based analyses, with limited application of integrated approaches that treat industrial value chains as the primary unit of analysis. As a result, upstream and downstream interdependencies, the role of intermediate activities, and the interaction between environmental impacts and economic or social outcomes are often only partially captured, creating a gap between the analytical tools available in the literature and the types of system-level insights required to inform industrial and climate policy.
Against this backdrop, there is a need for sustainability assessments that transcend the calculation of emissions alone and explicitly focus on industrial value chains rather than individual firms or aggregated sectors. Addressing this gap can improve our understanding of how sustainability outcomes emerge across interconnected activities and provide more policy-relevant insights into industrial transition pathways.
3. Methodology
3.1. Empirical Setting
We focus on Spain as an empirical setting due to its unique relevance in the analysis of industrial value-chain emissions. Spain’s economy is heavily shaped by medium-technology and energy-intensive industries, many of which are embedded in global value chains that depend on imported energy, materials, and industrial intermediates. This reliance on external inputs significantly amplifies indirect emissions, making Spain an informative case for examining the hidden environmental costs of industrial production [79]. Despite a decline of 18% in national GHG emissions between 2008 and 2018, largely driven by improvements in energy efficiency and decarbonisation of the power sector, various industrial sectors in Spain remain highly dependent on carbon-intensive upstream activities.
Moreover, Spain’s industrial footprint is notable in terms of its contribution to the national economy, accounting for around 20% of GDP in 2023, which aligns closely with the EU average of 22%. The labour intensity of Spanish industry further underscores its importance, as medium- and low-tech sectors play a prominent role, creating significant employment opportunities within these industries [62]. This makes Spain a particularly valuable setting for studying the intersections between economic activity, employment dynamics, and emission mitigation strategies, offering insights into the challenges of transitioning to a more sustainable industrial economy.
3.2. Base Methodological Choice
An assessment of greenhouse gas (GHG) emissions in industrial contexts can draw on a diverse set of methodological approaches, each offering distinct analytical strengths depending on the scale, boundaries, and objectives of the study. At the individual-firm level, commonly used methods include process-based life cycle assessment (LCA), corporate carbon accounting aligned with the Greenhouse Gas Protocol, and engineering-based bottom-up estimations that rely on activity data and emission factors. These approaches vary in their granularity and data requirements, ranging from highly detailed process inventories to more aggregated estimations based on energy use or material throughput.
When the analytical focus extends beyond a firm to encompass value chains or broader industrial ecosystems, methodological options expand to include environmentally extended input–output analysis (EEIO), hybrid LCA models, and multi-regional input–output (MRIO) frameworks capable of capturing upstream and downstream emissions embodied in trade and intersectoral linkages. These variants differ in their capacity to represent indirect emissions, sectoral interdependencies, and geographical dispersion, offering complementary perspectives on the distribution of carbon burdens across supply networks.
While LCA methods and their variants ensure the evaluation of resource consumption and environmental impacts across the sequential phases of a product or service’s life cycle, their primary use is often localised at the organisational or firm level for strategic environmental management and decision-making. However, when the objective is to understand the sustainability impacts of final demand at the level of nations, regions, or entire industrial systems, LCA becomes impractical. A full LCA of an entire country’s industrial fabric would require enormous quantities of detailed data for every process, material flow, and technology type. Even recent attempts to automate data collection through process mining [80] cannot overcome this fundamental limitation.
For these broader analyses, EEIOTs offer a more suitable approach [81]. Input–output (IO) analysis allows capturing the full network of intersectoral relationships across an economy, enabling estimation of the environmental impacts embodied in production and final demand. While process-based LCA offers precision, IO models provide the system-wide coverage necessary for regional or national assessments [82]. Several authors have employed EEIOT approaches to assess environmental impacts from a value-chain perspective. In recent years, this methodology has become increasingly prominent, as reflected in a growing body of academic publications [46,82,83,84,85].
As our objective is to examine how direct and indirect emissions vary across different industrial value chains in Spain, using EEIOT analysis would be most prudent. Capturing complex sectoral interdependencies requires a modelling framework capable of tracing embodied emissions through the entire economic system rather than limiting the analysis to firm-level or process-specific boundaries. EEIOT analysis provides precisely this system-wide visibility: it links environmental extensions to national IO accounts, enabling the quantification of emissions embodied in intermediate consumption, final demand, and intersectoral exchanges and revealing structural patterns that would remain invisible in process-based or organisational accounting approaches.
This is particularly relevant for policy-oriented research, where the objective is not only to quantify emissions but also to inform strategic intervention options at the sectoral or national level. For these reasons, even considering the limitations presented in Section 7 of this paper, EEIOT analysis provides the analytical breadth, systemic perspective, and methodological coherence required to meet the aims of this study, offering a rigorous and comprehensive basis for assessing the distribution and drivers of direct and indirect emissions across Spanish industrial value chains.
3.3. Value Chain Analyses
Evaluating the emissions and socio-economic effects produced by a country’s value chains using input–output tables requires the acquisition and integration of data from multiple sources as presented in Table 2.
Table 2.
Data, description, and sources for deriving value chains.
Our research yielded corroborating results from multiple analytical standpoints, all of which are validated by their reliance on National Accounts, a dataset generally accepted as the benchmark for reliable economic forecasting and governance decisions.
Industrial value chains are defined by the aggregation of products and services destined for final demand, along with all upstream intermediate activities and products required for their production. Since, up to the four-digit-level codes, the structure of CPA (Classification of Products by Activity) corresponds to that of NACE (Classification of Economic Activities) [89], products have been linked to economic branches of activities according to the NACE classification.
From matrices X and Y, the total output (wi) for each sector of origin is calculated as follows:
where i is the sector of origin, n is the number of sectors present in the symmetric matrix, and k is the number of components constituting final demand (household demand, government demand, etc.). Consequently, wi represents the total output of a sector.
Using this value, the n × n matrix of technical coefficients (A) is calculated, where each of its components is determined according to the following formula:
where is the quantity of input required from sector i for each unit of output for sector j. This allows calculation of the inverse Leontief matrix (L) using the following formula:
This matrix is composed of coefficients αij that capture the direct and indirect requirements of sector i for each unit of final demand in sector j. Subsequently, using the Production Layer Decomposition (PLD) method, L is decomposed via its Taylor expansion in the following formula:
where each of the summands (I, A, A2, …, An) represents the requirements generated by each unit of final demand across the different sectors in their various upstream stages (final demand, level 1, level 2, etc.). Since the coefficients constituting the technical coefficient matrix have a value less than 1, the terms of the equation become progressively smaller, and the summation converges to the value of L.
Given a final demand vector Y, the GHG emission footprint is calculated as follows:
where m represents the vector of total emission factors (TCO2-eq/unit economic flow) for n sectors, and q represents the vector of direct emission factors (TCO2-eq/unit economic flow) for n sectors. Each term in the summation expresses the emissions associated with each layer of the value chain.
Analysing all the operations required to perform the matrix calculations for the preceding formula reveals that they can be presented in the following form:
In the case of the symmetric table applied in this article, the summands corresponding to each of the layers are as follows: Layer 1, 20 terms; Layer 2, 400 terms; Layer 3, 8000 terms; Layer 4, 160,000 terms; Layer 5, 3,200,000 terms; Layer 6, 64,000,000 terms; and so on. The number of summands increases exponentially.
Interestingly, each of the summands constituting the formula represents the emissions generated in one link of the upstream value chain, starting from final demand. For instance, the summand for Layer 3, represents the emissions produced by Sector 3 to service Sector 7 in the proportional component of the latter’s activity, which is necessary to allow Sector 4 to provide products and services for the final demand at the value of y4, as illustrated in Figure 1.
Figure 1.
Graphical representation of the equation corresponding to a link.
Considering the potential number of links resulting from the analysis of the upstream value chains, we simplified the relationships between the different sectors, maintaining the most significant ones based on the stages presented in Figure 2.
Figure 2.
Value chain construction and emissions calculation steps.
STEP 1. This step involved preparing the tables for subsequent processing. Specifically, we associated products with CPA with the corresponding NACE sectors. Then, we extracted the input–output matrix relative to the industrial sectors for both intermediate and final consumption from the original tables obtained from Eurostat. Then, we built an EEIOT by calculating the emissions associated with the economic exchanges between the industrial sectors and the final demand in thousands of TCO2-eq.
STEP 2. To reduce the model’s complexity and facilitate the search for linearity between the remaining links, a trimming process was performed for emission links between sectors. Consequently, intersectoral links associated with negligible emission levels were omitted. This reduction in complexity streamlined the model while preserving the representativeness of the total emission data. Because of this process, the total emissions retained in the model were greater than 95% of the initial intersectoral emissions.
STEP 3. The order of rows and columns in the matrix resulting from Step 2 was permuted to achieve triangulation by maximising the concentration of emission linkages below the diagonal of the matrix, thus optimising the identification of intersectoral emission flows within the data. As indicated, the triangulation process enables the visualisation of an economy’s fundamental structure and facilitates between-country comparisons, which, in this case, are conducted from the perspective of GHG emissions.
STEP 4. After the triangulation process, value chains were constructed. To establish the fundamental structure of these value chains, the combinatorial capabilities of Power Query [90] were employed to iteratively trace the supply chain from the final demand upstream until all relationships were captured. Building upon this initial construction, the emissions and employment associated with each generated link were allocated by calculating the proportional distributions of the emission and employment values.
STEP 5. The final step involved visualising the constructed value chains. Two primary representation methods were employed. The first is a tree-based graphical representation depicting the value chain structure in a hierarchical format, where each node represents a specific sector, and the arrows represent the links between sectors. The total emissions and jobs associated with each link are also presented to highlight their proximity to the final demand. The second method is a database representation, which is used to organise the value chain data in a tabular format. Each row represents a specific link or connection between the sectors. The matrix includes information such as the sectors involved, associated emissions, and employment values.
3.4. Triple-Bottom-Line Assessment
Following the concept of sustainability established by Elkington [7], the above-described method leads to assessments of sectors and value chains according to three dimensions of sustainability—an economic one (economic activity), an environmental one (GHG emissions), and a social one (employment)—as presented in Table 3.
Table 3.
Criteria for ranking value chains and sectors.
As such, this triple-bottom-line configuration serves as a framework for identifying the most opportune sectors to subject to policy measures. Consequently, we posit that as per the sustainability assessment approach employed—with a sector or value-chain focus, considering only Scope 1 emissions or Scope 2 and 3 emissions as well (that is, being purely emission-centric), or including socio-economic dimensions as well—the industries to be targeted by policy measures ought to alter.
The complete methodology behind the simplification, construction, and calculation of the analysed variables (economic flow, emissions, and employment) is detailed in [91]. We applied this methodology to data on 20 industrial value chains in Spain, encompassing detailed information for each link in the chain, including the corresponding producing sector, the consuming sector, the position (scope) in the value chain, economic flow, associated employment, and the emissions generated.
In accordance with the adopted methodology, the emissions attributed to each value chain (Section 4.1) were computed as the sum of emissions generated by the economic activities of the individual links that constitute the chain. Emissions for each sector (Section 4.1) were determined by aggregating the emissions generated by the economic activities of all links originating in that sector, irrespective of their destination sector or the value chain to which they belong.
Sectors and value chains (Section 4.2) were prioritised in accordance with the evaluation framework and weighting criteria outlined in Table 3. Emissions were allocated to the corresponding scope (Section 4.3) by combining the positional information of the links generating these emissions with the nature of the originating sector of economic activity (e.g., electricity, oil and gas, and manufacturing).
The proportional share of emissions from each value chain was allocated to household consumption, public administration consumption, or exports (Section 4.4) by calculating the corresponding share of final demand represented by each demand origin within the value chain relative to the total emissions of that chain.
Emissions and employment associated with each link were estimated by applying the proportion corresponding to the share of economic activity represented by that link within the sector’s overall activity (Section 4.5) to the sector’s total emissions and total employment.
4. Results
This section begins (see Section 4.1) with a presentation of the value-chain-level insights that could be derived from the database through the methodological steps outlined in Section 3.3. This is provided in an illustrative manner based on a single industrial value chain. Section 4.2 then compares, in terms of emissions, adopting a sector perspective (Scope 1) with adopting an industrial value chain perspective (Scope 1–2–3). In Section 4.3, we decompose the aggregate emissions at the industrial-value-chain-level into the respective Scope 1–2–3 components. Afterwards, for each value chain, segments of emissions based on consumption per user group is presented. Section 4.5 then presents a multi-dimensional sustainability assessment of the value chain from an environmental, social, and economic perspective. The section concludes with an overview of rankings according to the results at the sector- versus value-chain level and the Scope 1–2–3 level, emissions according to consumption per user group, and an integrated assessment in environmental, employment, and economic terms (Section 4.6).
In this section, we present the results obtained by applying the aforementioned methodology. These results are interpreted in the subsequent sections (Section 5 and Section 6).
4.1. Results of the Database Analysis at the Industrial-Value-Chain Level
Following the application of the methodology outlined in the preceding section, information was obtained concerning 20 industrial value chains in Spain, with detailed information for each link in the chain and the corresponding economic activity generated, the associated employment, and the emissions released. In Table 4, we illustrate the former by means of Sector 10–12: foodstuffs, beverages, and tobacco products. The symbol “→” denotes the relationship between the sectors. The sector placed to the left of the symbol represents the origin of the product or service, while the sector on the right indicates the destination sector. Scope 1 emissions for this sector are represented by row ‘10–12 → FC’ (=5771.2) (FC = final consumption), Scope 2 emissions are represented by row ’35 → 10–12’ (=2154.5), and Scope 3 emissions are represented by the rest of the rows. In addition, we provide information on employment and economic activity per link.
Table 4.
Excerpt from the value chain representation for Spanish manufacture of foodstuffs, beverages, and tobacco products.
Each row of the table above represents a link in the value chain. The hierarchical order of the rows indicates the position of each link in the value chain. Each row has a TBL configuration (emissions—TCO2-eq; employment—jobs; economic activity—M€) and its graphical representation
In this case, the first line of the table shows that Sector 10–12, “Manufacture of foodstuffs, beverages and tobacco”, emits 5771 TCO2-eq to satisfy final consumption. This activity accounts for 521,500 jobs and an economic activity figure valued at EUR 72,431 million. The second line illustrates that for this output to be generated, Sector 23, “Manufacture of other non-metallic mineral products” (likely associated with the production of glass necessary for preservation), emits 7117 TCO2-eq, requires 33,686 jobs, and accounts for EUR 1311 million worth of economic activity. The third line shows that for Sector 23 to meet the demand of Sector 10–12 in covering final demand, Sector 35, “Electricity, gas, steam and air conditioning supply”, must proportionally generate EUR 461 million worth of economic value, emit 346 TCO2-eq, and account for 1005 jobs.
A graphical representation of the value chain in question, along with its associated emissions, is presented in Figure 3.
Figure 3.
Emissions by link in value chains based on initial NACE Sector 10–12.
The figure above demonstrates how the most significant emissions in the food, beverage, and tobacco value chain originate from the production of the glass required for packaging the end products (23), followed by the (manufacturing) processes employed by the companies pertaining to the focal sector (10–12) and the generation of energy consumed by this sector (35).
4.2. Sectoral Versus Value Chain Emissions
Table 5 draws a comparison between individual sector emissions and emissions when Scope 2 and 3 emissions are included in the sector’s value chain, as measured at the level of industrial value chains (VCs). The table contains, for each sector, two key variables: direct emissions attributed to the sector itself, and total emissions when all upstream contributions are added to the sector’s emissions when serving final demand.
Table 5.
Sectoral vs. value-chain comparison in terms of emissions accounting.
By analysing the table, it is possible to assess each sector’s contribution to emissions according to its role either as a supplier of products for final demand or as an upstream sector supplying intermediate demand. This analysis is presented in the following sections.
4.3. Scope-Based Decomposition of Industrial Value Chain Emissions
Figure 4 presents the distribution of total value chain emissions segmented by Scopes 1–2–3. This visual representation reveals how the environmental burden is allocated throughout the chain and shows how effective intervention “points” can be identified. Scope 1 and Scope 2 represent the share of emissions from activities carried out by the focal sector (Level 0) and from power generation activities associated with the consumption of electrical energy by the focal sector (Level 1). Scope 3-M reflects the share of GHG emissions from upstream non-energy input suppliers to the focal sector (Level 1 and higher), while columns Scope 3-E-e (Energy—Electricity. Level 2 and higher) and Scope 3-E-o (Energy—Oil and Gas. Level 1 and higher) indicate the share of GHG emissions from upstream electricity, oil, and gas providers to the aforementioned upstream input suppliers and the focal sector.
Figure 4.
Distribution of value chain emissions by scope.
Note that the database represents chains of economic links prioritised by their GHG emissions to represent a high percentage of the country’s total emissions (over 94%). Thus, the retained links do not represent the entirety of the relationships within the value chain and their corresponding emissions but rather the prioritised links that account for a high percentage of each country’s emissions. This is why, for example, the emissions of sectors 26 or 35 are not captured beyond Scope 1 emissions. This does not imply that such emissions do not exist but rather that they are not of sufficiently representative magnitude within the country’s locally produced total emissions.
4.4. Relative Weights of Final-Consumption User Groups in Value Chain GHG Emissions
Table 6 presents the relative importance of different final-consumption user groups with respect to the emissions generated along each value chain. We distinguish between household consumption, public administration consumption, exports, and gross fixed capital formation/changes in inventories. The variables in columns 2 to 5 are expressed in TCO2-eq, and those in columns 6 to 9 are expressed as percentages of total value chain emissions due to final demand.
Table 6.
Value chain GHG emissions attributable to final consumption by user group.
This structure allows readers to identify which demand components drive the environmental footprint of each chain and compare the relative importance of domestic versus external demand. For example, it enables an examination of the significance of government demand as a lever for influencing the value chain through green public-procurement mechanisms.
4.5. Triple-Bottom-Line Assessment of Value Chains
Table 7 presents an analysis of the examined value chains from a triple-bottom-line (TBL) perspective. The first column identifies the sector code that serves as the head of the value chain, followed by the total emissions of the chain, the total economic activity associated with it, the total employment generated, and the ratios of emissions relative to economic activity and associated employment. The information contained in this table enables an assessment of the societal implications that policy-making interventions may entail.
Table 7.
Environmental, economic, and social assessment of value chains.
These variables provide a multidimensional portrayal of each chain’s environmental, economic, and social attributes. The table allows readers to compare chains not only in terms of their absolute scale but also with respect to their relative intensity across the three dimensions of the triple bottom line. Such information is highly pertinent for governmental decision-making, as public authorities must consider the systemic impacts that policy measures may generate.
4.6. Synthesis in the Form of Rankings
Table 8 synthesises the empirical outputs by presenting a set of rankings constructed based on the analytical criteria defined in the preceding methodological section. These rankings draw directly from the different dimensions examined throughout the Section 4. By integrating these distinct evaluative dimensions into a consolidated ranking framework, the table provides a structured overview of how sectors and their corresponding value chains position themselves when assessed through multiple analytical lenses. This consolidated presentation enables readers to identify, at a glance, which chains consistently occupy prominent positions across several criteria and which ones shift in relative importance depending on the specific metric applied.
Table 8.
Sector and value chain rankings based on different sustainability approaches to GHG emission assessment.
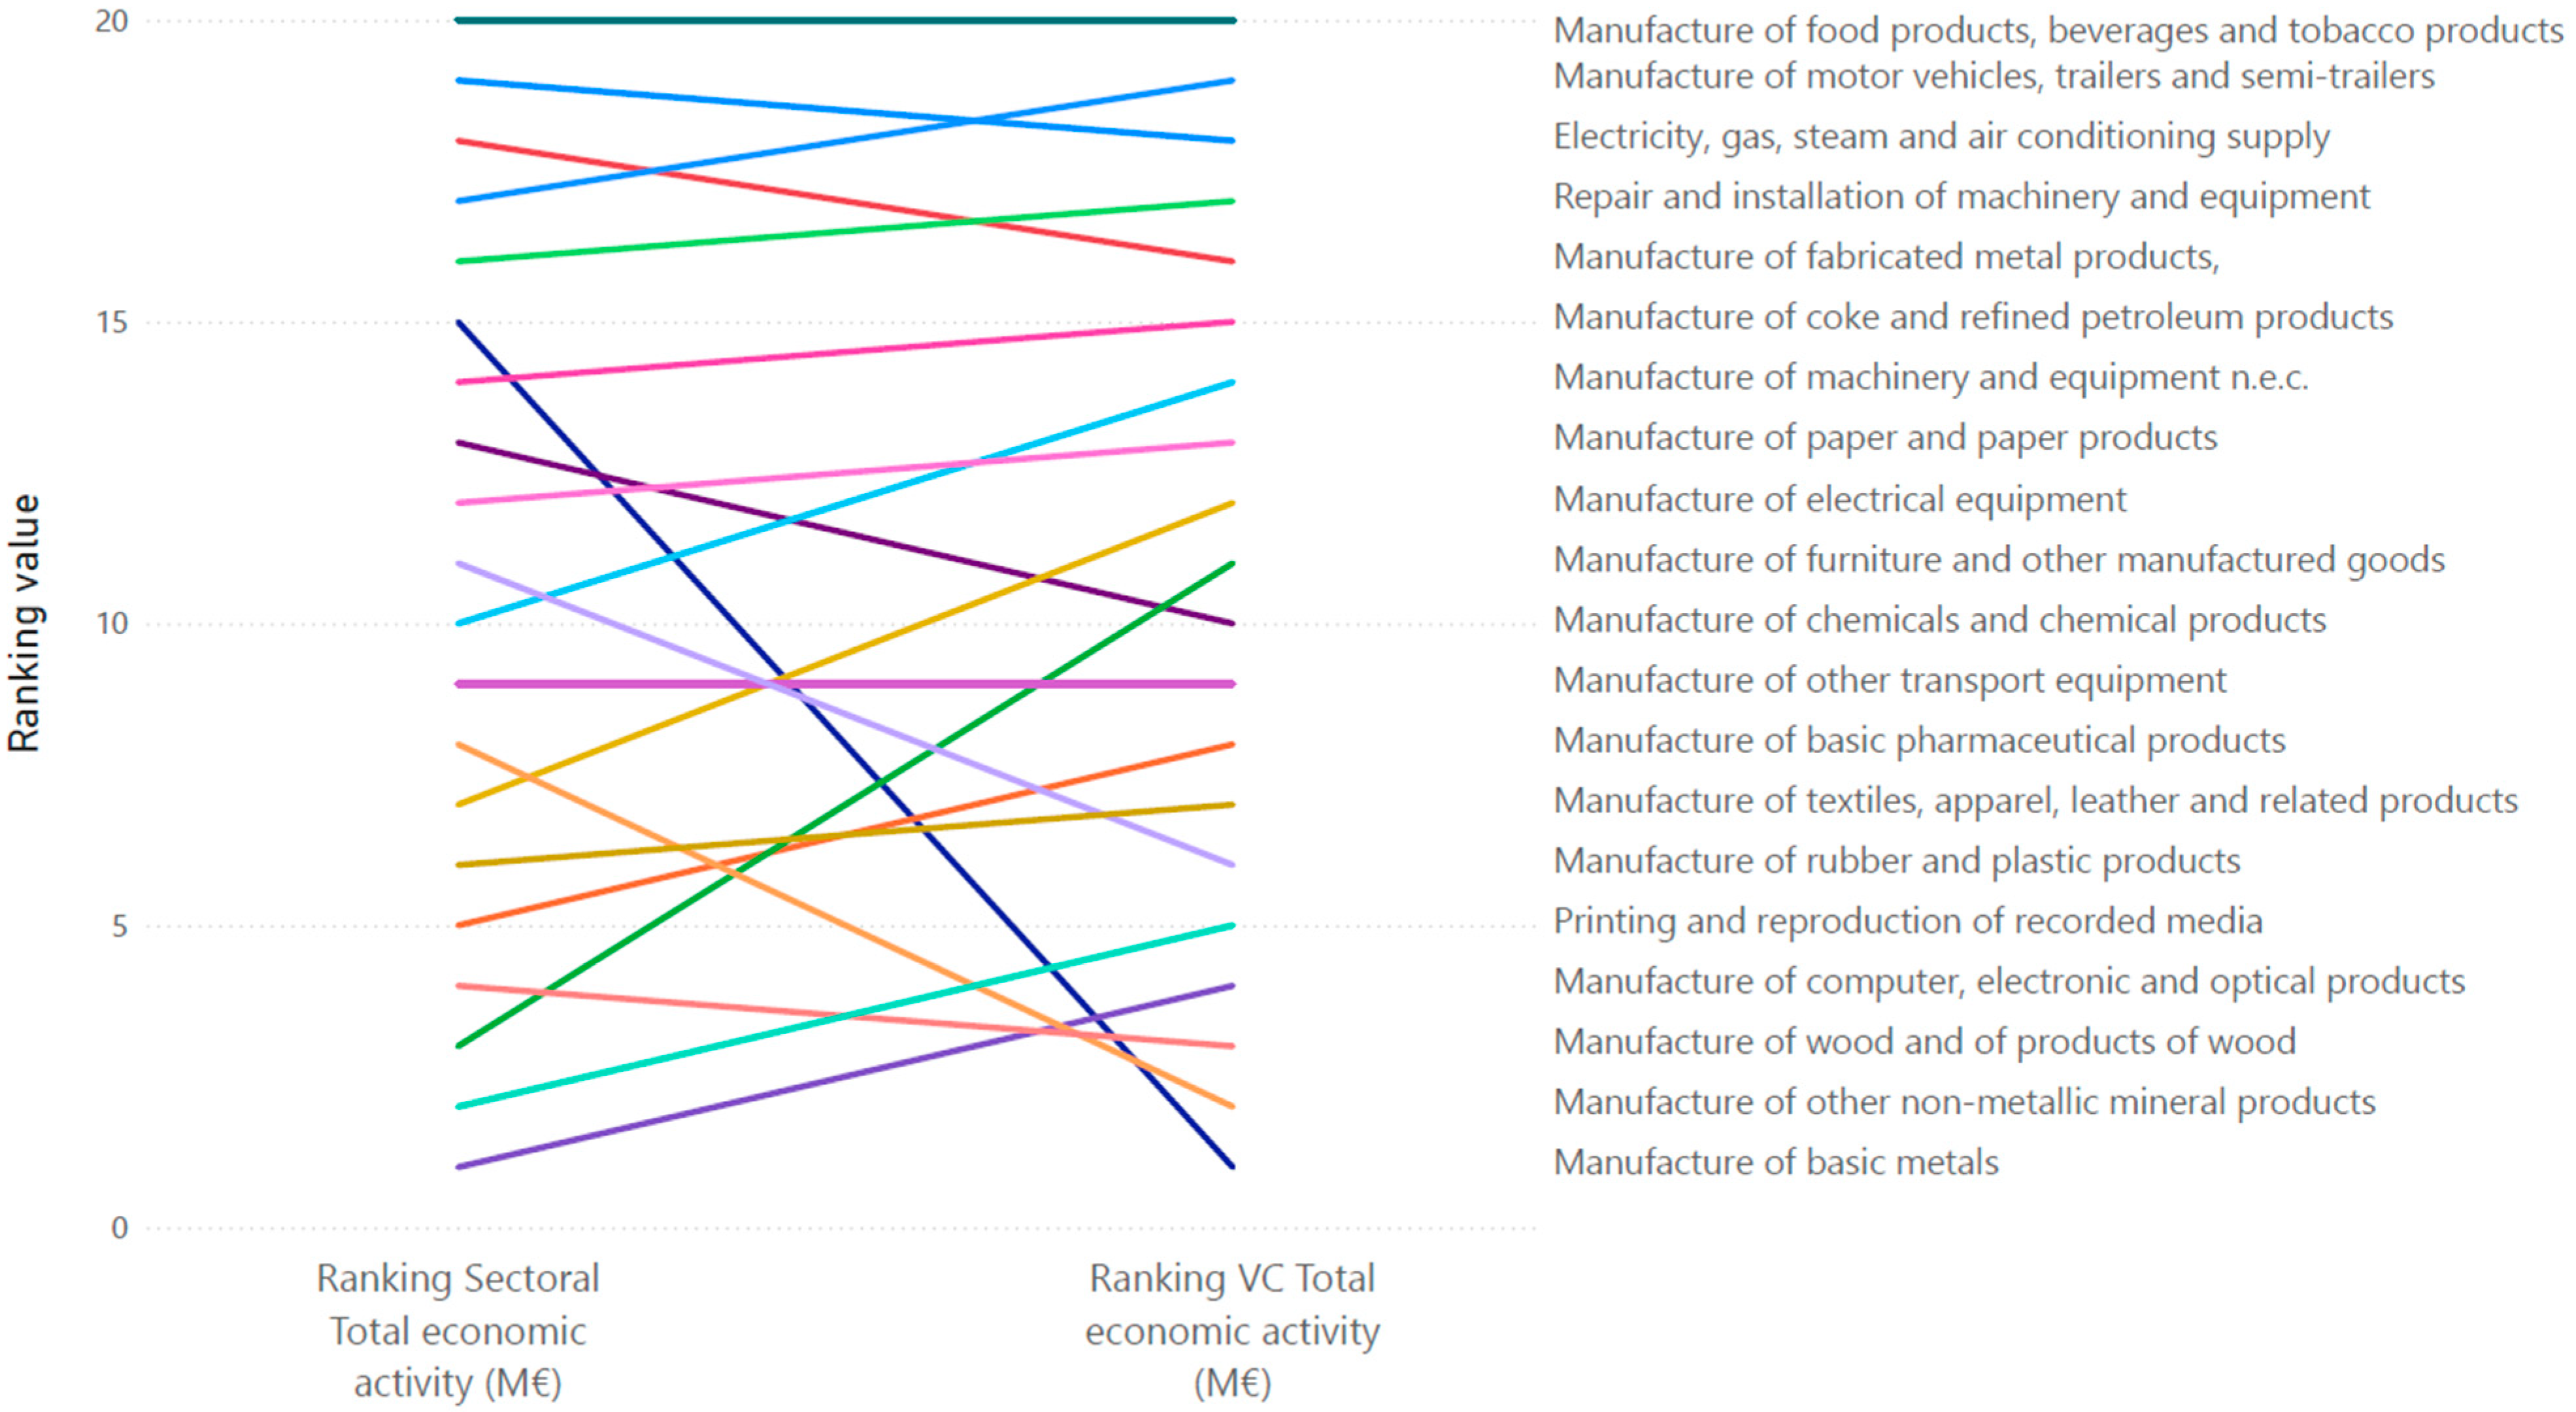
The two figures in Appendix A graphically illustrate how perceptions regarding employment generation and economic activity differ depending on whether a sectoral or value-chain perspective is adopted.
The combination of these tables and figures provides a robust descriptive foundation for the subsequent interpretative sections. By presenting the results in a structured, multi-layered manner, the section equips readers with a clear understanding of the empirical patterns that emerge from the application of this methodology.
5. Discussion and Implications for Policy Making
This section examines how climate policy priorities vary depending on two fundamental analytical choices: first, whether greenhouse gas mitigation is assessed through a narrow emissions-focused lens or through a broader triple-bottom-line perspective, and second, whether emissions are accounted for at the sector level (Scope 1) or across entire value chains (Scopes 1–2–3). Drawing explicitly on the empirical evidence in the Tables presented in Section 4 “Results”, the discussion illustrates how these choices lead policymakers to prioritise different sectors for intervention, with significant implications for the effectiveness and legitimacy of climate policy. Taken together, these results show that analytical choices regarding system boundaries and assessment frameworks not only affect measurement outcomes but also systematically reshape policy priorities.
5.1. Sector-Level Mitigation: Prioritising Direct Emitters
When mitigation strategies rely exclusively on sector-level emissions, sectors are ranked according to their direct, on-site GHG emissions. As shown in Table 5, this approach clearly singles out sectors such as electricity, gas, steam, and air conditioning supply (35); manufacture of other non-metallic mineral products (23); and manufacture of coke and refined petroleum products (19) as primary candidates for policy intervention. These sectors dominate the emissions ranking because their production processes are intrinsically carbon-intensive and energy-demanding.
From a policy perspective, this approach is attractive because it offers clarity and regulatory tractability. Emissions are observable at the point of production, responsibility is clearly assigned, and well-established instruments—such as carbon pricing, emissions-trading systems, and performance standards—can be applied [63,92]. In this framework, climate policy would naturally focus on accelerating fuel switching in electricity generation, mandating cleaner kilns in cement-related activities, or promoting low-carbon alternatives in refining.
However, as widely discussed in the literature on production-based accounting [93,94], this perspective systematically overlooks the role of final demand and inter-sectoral dependencies. Sectors with relatively low emissions may escape policy attention, even if their economic activity indirectly drives substantial emissions elsewhere in the economy.
5.2. Expanding the Boundary: Value Chain Mitigation and Scope 1–2–3 Emissions
Once the accounting boundary is extended to include Scope 2 and Scope 3 emissions, policy preferences shift markedly. Table 5 shows that several sectors that rank low when assessed in isolation move up significantly when emissions are attributed to final demand along the value chain. For example, manufacture of furniture and other manufactured goods (31–32) and printing and reproduction of recorded media (18) display modest direct emissions but substantially higher value chain emissions once upstream inputs—such as basic metals, non-metallic minerals, electricity, and transport services—are fully accounted for.
From a value chain perspective, these sectors emerge as non-trivial contributors to overall emissions, not because of how they produce but because of what they consume. In this setting, a mitigation-oriented policy would no longer prioritise these sectors for end-of-pipe regulation or technology substitution at the production stage. Instead, it would target them through product standards, material efficiency requirements, circular economy instruments, or demand-side measures aimed at reducing material throughput and extending product lifetimes [95,96]. This finding extends the Scope 3 literature by empirically showing how downstream manufacturing sectors can exert substantial indirect climate pressure despite limited direct emissions, reinforcing the need to analyse mitigation responsibility at the level of value chains rather than individual sectors.
This analytical shift also alters how upstream-heavy sectors are interpreted. Manufacture of basic metals (24), for instance, ranks relatively high in Scope 1 emissions but drops substantially when assessed as a value chain serving final demand. This indicates that its emissions are largely generated by other sectors’ demand rather than autonomous final consumption. Consequently, a value chain approach would not prioritise basic metals for demand-reduction policies but rather for technology-oriented support measures, recognising its role as a foundational supplier for multiple downstream activities.
5.3. User Groups and Responsibility: Insights from Final Consumption
Table 6 further refines policy interpretation by decomposing value chain emissions according to user groups, highlighting that certain value chains are disproportionately driven by household consumption, while others are more closely linked to government consumption or investment demand. For policymakers, this distinction is critical. For instance, if emissions embedded in furniture or printing value chains are largely generated by household demand, policy instruments such as eco-design standards, information disclosure, or incentives for reuse become more relevant than traditional industrial regulation.
Public procurement is increasingly recognised as a strategic policy instrument for advancing decarbonisation objectives across industrial sectors [64]. The empirical findings from this research indicate that public procurement’s capacity to directly influence greenhouse gas emissions is more qualitative than quantitative. In most value chains, the share of emissions induced by public consumption represents only a marginal fraction of total sectoral emissions, with the notable exception of the pharmaceutical sector. This limited quantitative impact suggests that public procurement alone cannot drive large-scale decarbonisation throughout the economy. However, it also highlights an important nuance: its strategic value does not lie primarily in its volumetric influence on emissions; rather, it lies in its ability to shape markets, set precedents, and legitimise emerging technological solutions.
This finding aligns with the growing body of research advocating consumption-based and demand-oriented climate policies to complement production-side measures [97,98]. It also reinforces the idea that climate responsibility cannot be fully understood without tracing emissions back to the agents and uses that ultimately drive production. Therefore, this analysis contributes to demand-oriented and consumption-based climate policy debates by clarifying how different user groups shape emissions along industrial value chains, thereby linking accounting frameworks to responsibility attribution.
5.4. Introducing the Triple Bottom Line: Re-Ranking Policy Priorities
When environmental performance is assessed alongside employment and economic activity (as in Table 7), policy priorities are reshaped yet again. High-emission value chains often coincide with high levels of employment and economic output. Electricity and energy supply (35) and non-metallic mineral products (23), for example, combine large environmental footprints with significant economic relevance. When considered using a purely emissions-focused logic, these sectors would be prime candidates for aggressive intervention. When considered with respect to a triple-bottom-line approach, however, they become politically and socially sensitive targets.
By contrast, some value chains exhibit a combination of high emissions and relatively low employment and economic contribution. These sectors appear particularly attractive for stricter regulatory intervention when all three dimensions are considered simultaneously. Targeting them allows policymakers to achieve relatively large emission reductions while minimising adverse employment and fiscal effects.
This empirical pattern illustrates what the literature describes as the inherent trade-offs of sustainability transitions [99,100]. No single sector optimises environmental, social, and economic objectives simultaneously. Climate policy therefore cannot rely on a single ranking or metric but must instead manage trade-offs explicitly and transparently. This result contributes to the sustainability assessment literature by providing empirical evidence that multidimensional evaluations lead to fundamentally different sectoral rankings relative to emissions-only approaches, thereby operationalising long-standing conceptual debates on trade-offs in sustainability transitions.
5.5. Divergent Policy Outcomes Under Alternative Approaches
The tables demonstrate that different sustainability approaches lead policymakers to prioritise different sectors. A sectoral, emissions-only approach would focus on electricity supply and heavy process industries, while a Scope 1–2–3 value chain perspective shifts attention toward downstream manufacturing sectors with high embedded emissions, such as furniture or printing. Introducing a triple-bottom-line lens further differentiates between high-emission sectors with strong socio-economic importance and those with limited employment relevance, resulting in differentiated policy mixes rather than uniform interventions.
These differences are not merely technical, as they shape the perceived fairness, feasibility, and effectiveness of climate policy. Policies based solely on direct emissions may be efficient but socially disruptive, whereas value-chain-based approaches, while environmentally more comprehensive, are institutionally more demanding. As emphasised by Workman et al. [101], the central challenge lies not in the availability of analytical evidence but in the translation of such evidence into decision-making processes. Accordingly, the sectoral and value chain rankings presented here should be understood as decision-support tools that inform deliberation, stakeholder engagement, and institutional learning rather than as prescriptive solutions. This finding advances the literature on climate-policy governance by showing that assessment frameworks function as implicit governance devices, shaping perceptions of fairness, feasibility, and legitimacy rather than merely supplying neutral evidence.
From this perspective, the just transition framework articulated by [102] provides a critical lens for policy design. When high-emission sectors with substantial employment and fiscal relevance are targeted under sectoral-only approaches, climate policy must be accompanied by compensatory and enabling measures, including reskilling, income protection, and regional development strategies. Conversely, sectors with lower socio-economic relevance may justifiably be subject to more rapid and stringent regulatory intervention.
5.6. Implications for Climate Policy Design
Sectoral accounting encourages production-side technological solutions. Value chain Scope 1–2–3 accounting redirects attention toward final demand and supply chain coordination. Triple-bottom-line assessments require moving from optimisation to strategic prioritisation under explicit trade-offs.
Rather than identifying a single “best” sector to target, effective climate policy must therefore adopt a portfolio approach, combining different instruments at different points in the value chain. As argued in the broader policy literature [103], aligning climate mitigation with economic and social objectives requires analytical transparency about boundaries, responsibilities, and trade-offs.
Ultimately, the adoption of broader sustainability approaches does not dilute climate ambition; it reframes it. By revealing how emissions are embedded in value chains and intertwined with employment and economic activity, these approaches provide a more robust basis for designing climate policies that are not only environmentally effective but also socially and politically sustainable.
6. Conclusions
In this article, we set out to examine how different sustainability approaches to assessing greenhouse gas emissions across industrial value chains shape the evaluation of climate-policy options. By integrating environmentally extended input–output analysis with a multidimensional sustainability perspective, our study demonstrates that the way emissions are conceptualised, measured, and allocated across value chains has profound implications for the prioritisation of decarbonisation strategies. This contribution lies in demonstrating that sustainability assessment approaches are not interchangeable analytical tools but play a central role in shaping how climate-policy problems are defined and addressed in industrial systems.
Our first key conclusion is that adopting a value chain lens fundamentally alters the perceived distribution of climate responsibility. Many sectors that appear relatively “clean” under Scope 1 accounting emerge as significant contributors to national emissions once their indirect dependencies are considered. This shift is not merely technical; it reshapes the strategic landscape for climate policy. By empirically illustrating this shift, this study contributes to the literature on industrial emissions by clarifying how value chain structures redistribute climate responsibility across sectors and actors. Policies that target only the most emission-intensive sectors risk overlooking leverage points located elsewhere in the chain—particularly in upstream material production and energy-intensive intermediates. Conversely, sectors with modest direct emissions may hold disproportionate influence over the decarbonisation trajectories of their suppliers through procurement choices, product design, and innovation strategies. Recognising these relational dynamics is essential for designing policies that align incentives across the chain as opposed to reinforcing fragmented or contradictory interventions.
Our second conclusion concerns the integration of environmental, economic, and social dimensions into sustainability assessments. The results show that industrial value chains are not only sources of emissions but also critical sources of employment, technological capabilities, and regional economic resilience. Policies that focus exclusively on emissions reduction without considering these socio-economic interdependencies risk generating unintended consequences, including job losses, supply-chain disruptions, and regional inequalities. Our analysis therefore supports the argument that sustainability assessments must be explicitly multidimensional. Beyond reinforcing this argument conceptually, the findings demonstrate how multidimensional sustainability assessments can be operationalised in practice and used to inform policy prioritisation under real-world trade-offs. Incorporating employment intensity, value added, and technological structure into the evaluation of value chains enables policymakers to identify transition pathways that minimise socio-economic disruption while maximising environmental gains.
Our third conclusion concerns the limited quantitative capacity of public procurement to influence value chain emissions. Our analysis shows that, in most sectors, the share of emissions directly attributable to public demand is small, which constrains its ability to deliver substantial reductions in aggregate terms. Yet this quantitative limitation does not diminish its qualitative relevance. In fact, because its volumetric impact is modest, public procurement’s strategic value lies elsewhere: in providing early credibility, feasibility, and market visibility to low-carbon technologies and circular-economy solutions that are not yet competitive at scale. By signalling institutional support and reducing perceived risks for innovators, green public procurement can help emerging technologies demonstrate viability and gain traction, even if the immediate emissions impact remains limited. This finding underscores that public procurement should not be viewed primarily as a tool for achieving large cuts in short-term emissions but rather as a mechanism for enabling technological maturation and supporting long-term systemic transformation. This nuance adds to the public-procurement literature by distinguishing between quantitative emissions impacts and qualitative system-shaping effects, thereby refining expectations regarding its role in industrial decarbonisation.
From a policy perspective, the findings have several strategic implications. First, parties responsible for designing climate policy should prioritise interventions in upstream, energy-intensive segments of value chains, where the largest emission reductions can be achieved. This includes accelerating the decarbonisation of basic materials such as steel, cement, chemicals, and non-ferrous metals, which serve as foundational inputs for numerous downstream industries. Second, policies should support the diffusion of low-carbon technologies through coordinated action across the chain, including standards, procurement, innovation incentives, and supply-chain transparency requirements. Third, sustainability assessments should be institutionalised within industrial policy frameworks to ensure that decisions regarding investment, regulation, and transition planning are informed by a holistic understanding of environmental and socio-economic impacts.
In sum, this research demonstrates that the adoption of different sustainability approaches to assessing GHG emissions profoundly shapes climate-policy choices. A value chain perspective reveals hidden dependencies, identifies new leverage points, and highlights the need for integrated, multidimensional assessments that reflect the complex realities of industrial systems. By combining methodological rigour with policy relevance, this study provides a framework that can support more coherent, equitable, and effective decarbonisation strategies. As countries intensify their efforts to meet climate targets, such approaches will be essential for navigating the intertwined environmental, economic, and social challenges of industrial transformation. Taken together, these contributions position the study at the intersection of industrial emissions analysis, sustainability assessment, and climate-policy design, offering a coherent framework for evaluating decarbonisation strategies in complex industrial systems and clarifying how assessment choices shape policy reasoning and prioritisation.
7. Limitations
As shown in this paper, IO tables provide necessary insights for assessing sustainability at a national or regional level. However, IO analysis also has inherent limitations. The sectoral aggregation inherent in IO tables can mask important differences among individual value chains within the same category [104]. As a result, EEIOTs provide breadth at the cost of some granularity.
Author Contributions
Conceptualisation, J.R., and J.I.I.; methodology, J.R.; software, J.R.; validation, J.R. B.K., and J.I.I.; formal analysis, J.R., and B.K.; investigation, J.R.; resources, J.R.; data curation, J.R.; writing—original draft preparation, J.R.; writing—review and editing, J.R., B.K., and J.I.I.; visualisation, J.R.; supervision, J.R.; project administration, J.R.; funding acquisition, does not apply. All authors have read and agreed to the published version of the manuscript.
Funding
This research received no external funding.
Institutional Review Board Statement
The authors confirm that the study does not involve any activity requiring specific ethical safeguards under the categories listed by the institution. In particular, the research does not include clinical experimental procedures with human participants; the collection, processing, or analysis of genetic data; animal experimentation; the use of biological agents posing health risks; the handling of personal or sensitive data; or social interventions with ethical implications. Likewise, the study does not entail behavioural or observational research, fieldwork, archaeological investigations, interviews, life histories, surveys, or related methodologies involving human subjects. Although none of these categories apply to the present work, the authors state that the corresponding Ethical Committee certification will be obtained and provided in accordance with institutional requirements. The study will fully comply with all applicable ethical standards and procedural guidelines established by the relevant oversight bodies. Certification of Ethical Committee will follow.
Informed Consent Statement
No human participants, human data, or human tissue was involved in this study.
Data Availability Statement
The original contributions presented in this study are included in the article. Further inquiries can be directed to the corresponding author.
Acknowledgments
A preliminary view of some results of this research was briefly presented at the 19th International Conference on Industrial Engineering and Industrial Management (ICIEIM) and the XXIX Congreso de Ingeniería de Organización (Sevilla, Spain, 3–4 July 2025). The current article, however, constitutes a substantially reworked and expanded study that goes well beyond the scope of the conference contribution [105].
Conflicts of Interest
The authors declare no conflicts of interest.
Appendix A
Figure A1.
Jobs: sectoral vs. value chain perspective.
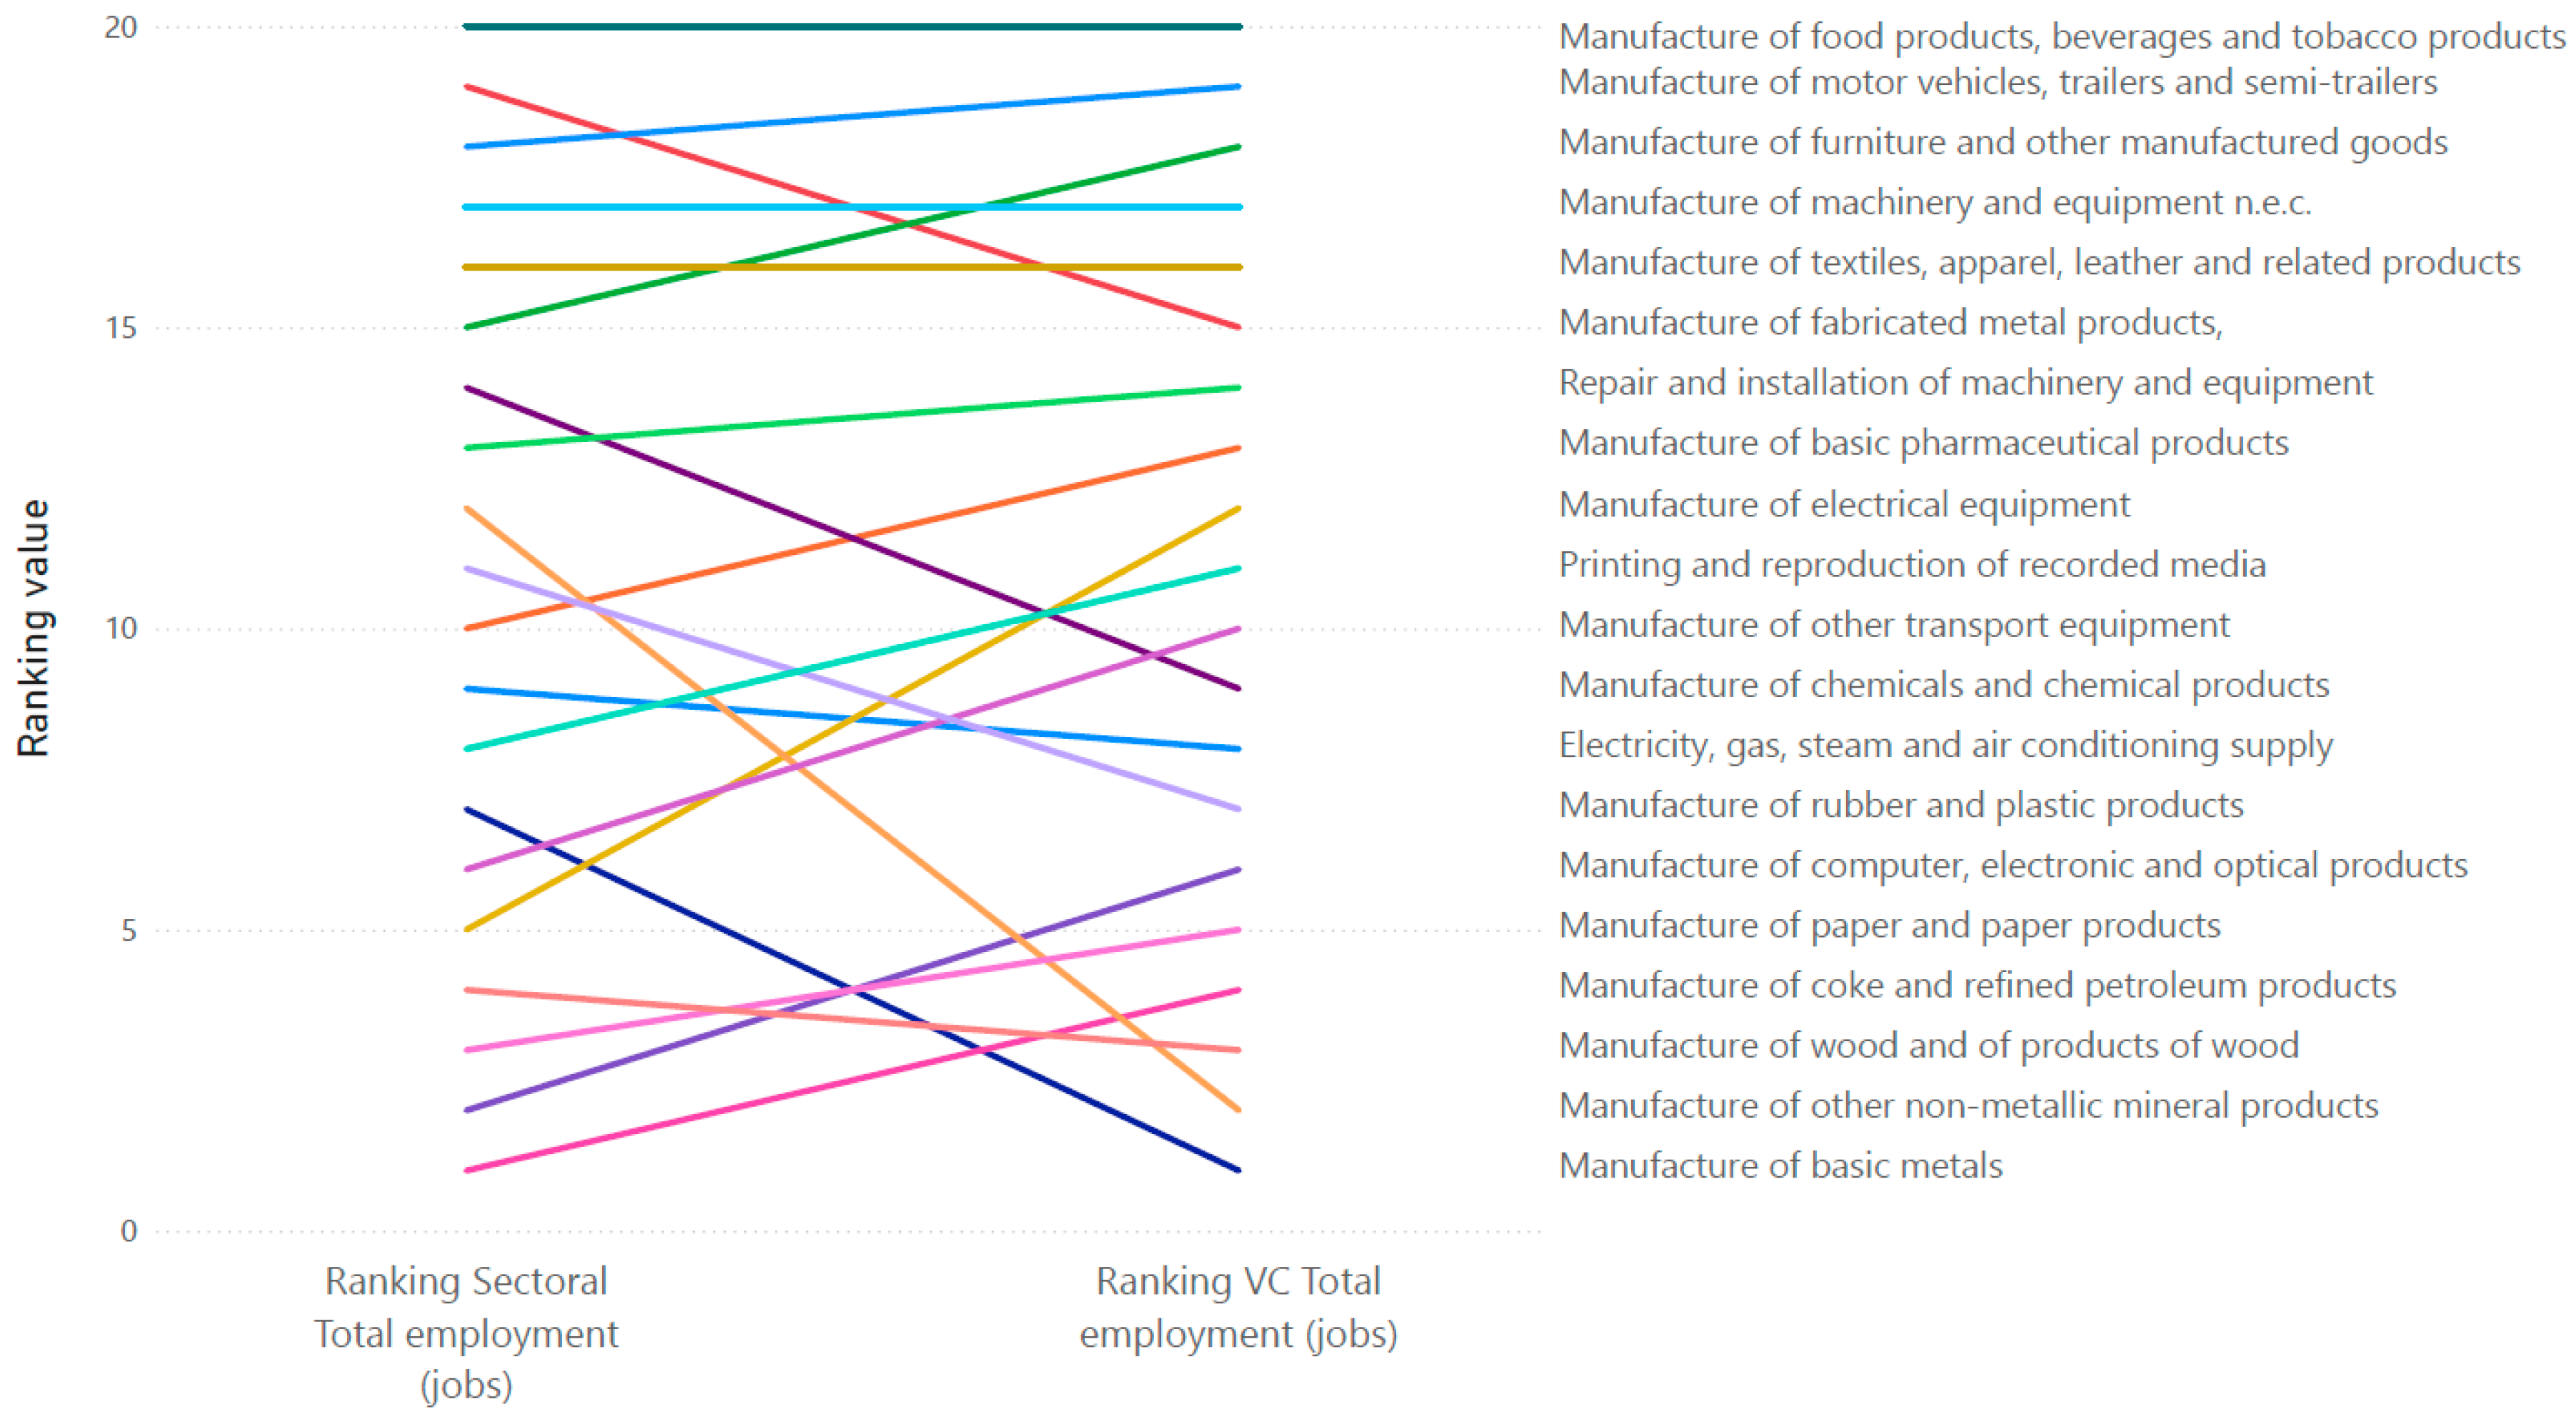
Figure A2.
Economic activity: sectoral vs. value chain perspective.
References
- Intergovernmental Panel on Climate Change (IPCC). Summary for Policymakers. In Global Warming of 1.5 °C; Masson-Delmotte, V., Zhai, H.-O., Pörtner, D., Roberts, J., Skea, R., Shukla, A., Pirani, W., Moufouma-Okia, C., Péan, R., Pidcock, S., et al., Eds.; Cambridge University Press: New York, NY, USA, 2022; pp. 1–24. [Google Scholar] [CrossRef] [Scilit]
- Hertwich, E.G.; Ali, S.; Ciacci, L.; Fishman, T.; Heeren, N.; Masanet, E.; Asghari, F.N.; Olivetti, E.; Pauliuk, S.; Tu, Q.; et al. Material efficiency strategies to reducing greenhouse gas emissions associated with buildings, vehicles, and electronics—A review. Environ. Res. Lett. 2019, 14, 043004. [Google Scholar] [CrossRef] [Scilit]
- Hertwich, E.G.; Wood, R. The growing importance of scope 3 greenhouse gas emissions from industry. Environ. Res. Lett. 2018, 13, 104013. [Google Scholar] [CrossRef] [Scilit]
- Yang, X.; Smith, T.M.; Prado, A.M.; Yang, Y. Net-zero greenhouse gas mitigation potential across multi-tier supply chains. Commun. Earth Environ. 2025, 6, 230. [Google Scholar] [CrossRef] [Scilit]
- Pauliuk, S.; Hertwich, E.G. Socioeconomic metabolism as paradigm for studying the biophysical basis of human societies. Ecol. Econ. 2015, 119, 83–93. [Google Scholar] [CrossRef] [Scilit]
- Sovacool, B.K.; Martiskainen, M.; Hook, A.; Baker, L. Decarbonization and its discontents: A critical energy justice perspective on four low-carbon transitions. Clim. Change 2019, 155, 581–619. [Google Scholar] [CrossRef] [Scilit]
- Elkington, J. Accounting for the triple bottom line. Meas. Bus. Excell. 1998, 2, 18–22. [Google Scholar] [CrossRef] [Scilit]
- Seyfang, G.; Haxeltine, A. Growing Grassroots Innovations: Exploring the Role of Community-Based Initiatives in Governing Sustainable Energy Transitions. Environ. Plann. C Gov. Policy 2012, 30, 381–400. [Google Scholar] [CrossRef] [Scilit]
- Heffron, R.J.; McCauley, D. The concept of energy justice across the disciplines. Energy Policy 2017, 105, 658–667. [Google Scholar] [CrossRef] [Scilit]
- Sala, S.; Ciuffo, B.; Nijkamp, P. A systemic framework for sustainability assessment. Ecol. Econ. 2015, 119, 314–325. [Google Scholar] [CrossRef] [Scilit]
- International Energy Agency. Spain, 2021 Energy Policy Review; International Energy Agency: Paris, France, 2021. [Google Scholar]
- Potters, L. R&D in Low-Tech Sectors; EconStor: Hamburg/Kiel, Germany, 2009. [Google Scholar]
- Akamati, K.; Laliotis, G.P.; Bizelis, I. Greenhouse Gas Emissions of the Poultry Sector in Greece and Mitigation Potential Strategies. Gases 2023, 3, 47–56. [Google Scholar] [CrossRef] [Scilit]
- Acevedo Blanco, V.L.; Gallo, W.L.R. Diagnosis of GHG Emissions in an Offshore Oil and Gas Production Facility. Gases 2024, 4, 351–370. [Google Scholar] [CrossRef] [Scilit]
- Tukker, A.; Wood, R.; Giljum, S. Relevance of Global Multi Regional Input Output Databases for Global Environmental Policy: Experiences with EXIOBASE 3. J. Ind. Ecol. 2018, 22, 482–484. [Google Scholar] [CrossRef] [Scilit]
- Wiedmann, T.; Lenzen, M.; Keyßer, L.T.; Steinberger, J.K. Scientists’ warning on affluence. Nat. Commun. 2020, 11, 3107. [Google Scholar] [CrossRef] [Scilit]
- Huang, X.; Chen, R.; Zhuang, E.H.H.; Kong, S.; Zhiquan, Y.; Kong, Y. Environmental footprint in specific industries: Intellectual base and research status. Carbon Footpr. 2025, 4, 18. [Google Scholar] [CrossRef] [Scilit]
- Sandin, G.; Roos, S.; Spak, B.; Zamani, B.; Peters, G. Environmental assessment of Swedish clothing consumption—Six garments, sustainable futures. Mistra Future Fash. 2019. [Google Scholar] [CrossRef]
- Gu, A.; Zhou, X.; Chen, Q.; Dong, Y. Tracking greenhouse gas emissions in Chinese value chains with an interprovincial input–output model. Energy Clim. Manag. 2025, 1, 9400001. [Google Scholar] [CrossRef] [Scilit]
- Hettler, M.; Graf-Vlachy, L. Corporate scope 3 carbon emission reporting as an enabler of supply chain decarbonization: A systematic review and comprehensive research agenda. Bus. Strategy Environ. 2024, 33, 263–282. [Google Scholar] [CrossRef] [Scilit]
- Vieira, L.C.; Longo, M.; Mura, M. Impact pathways: The hidden challenges of Scope 3 emissions measurement and management. Int. J. Oper. Prod. Manag. 2024, 44, 326–334. [Google Scholar] [CrossRef] [Scilit]
- Borchardt, M.; Pereira, G.; Milan, G.; Pereira, E.; Lima, L.; Bianchi, R.; Carmo, A.S.D. Are Sustainable Supply Chains Managing Scope 3 Emissions? A Systematic Literature Review. Sustainability 2025, 17, 6066. [Google Scholar] [CrossRef] [Scilit]
- Traub, J.; Morillas, C.; Gil, R.; Álvarez, S.; Martínez, S. Evaluating Corporate Carbon Emissions Reporting: Assessing Transparency and Completeness with the Carbon Integrity Index. Sustainability 2025, 17, 7628. [Google Scholar] [CrossRef] [Scilit]
- Stachelscheid, S.; Dutzi, A. Almost 10 years of dual reporting of Scope 2: Chaos or comparability? Carbon Manag. 2025, 16, 2459920. [Google Scholar] [CrossRef] [Scilit]
- Arce, G.; López, L.A.; Guan, D. Carbon emissions embodied in international trade: The post-China era. Appl. Energy 2016, 184, 1063–1072. [Google Scholar] [CrossRef] [Scilit]
- Wood, R.; Stadler, K.; Simas, M.; Bulavskaya, T.; Giljum, S.; Lutter, S.; Tukker, A. Growth in Environmental Footprints and Environmental Impacts Embodied in Trade: Resource Efficiency Indicators from EXIOBASE3. J. Ind. Ecol. 2018, 22, 553–564. [Google Scholar] [CrossRef] [Scilit]
- Beylot, A.; Corrado, S.; Sala, S. Environmental impacts of European trade: Interpreting results of process-based LCA and environmentally extended input–output analysis towards hotspot identification. Int. J. Life Cycle Assess. 2020, 25, 2432–2450. [Google Scholar] [CrossRef] [Scilit]
- Guinée, J.B.; Heijungs, R.; Huppes, G.; Zamagni, A.; Masoni, P.; Buonamici, R.; Ekvall, T.; Rydberg, T. Life cycle assessment: Past, present, and future. Environ. Sci. Technol. 2011, 45, 90. [Google Scholar] [CrossRef] [Scilit]
- Dizdaroglu, D. The role of indicator systems in monitoring and comparison: Challenges in data quality, weighting, and spatial resolution. Environ. Sci. Policy 2017, 75, 29–39. [Google Scholar] [CrossRef] [Scilit]
- European Commission. Corporate Sustainability Reporting Directive; European Commission: Brussels, Belgium, 2021. [Google Scholar]
- Espinoza, R.; Rodríguez, R.; Martínez, L. System dynamics in the biodiesel sector: Modelling feedback loops and policy shocks in Colombia. Environ. Model. Softw. 2017, 95, 197–210. [Google Scholar] [CrossRef] [Scilit]
- Safarzyńska, K.; Frenken, K.; Van Den Bergh, J.C. Evolutionary theorizing and modeling of sustainability transitions. Res. Policy 2012, 41, 1011–1024. [Google Scholar] [CrossRef] [Scilit]
- ISO 14040:2006; Environmental Management—Life Cycle Assessment—Requirements and Guidelines. ISO: Geneva, Switzerland, 2006.
- Hawkins, T.R.; Singh, B.; Majeau-Bettez, G.; Strømman, A.H. Comparative Environmental Life Cycle Assessment of Conventional and Electric Vehicles. J. Ind. Ecol. 2013, 17, 53–64. [Google Scholar] [CrossRef] [Scilit]
- Ellingsen, L.A.W.; Singh, B.; Strømman, A.H. The size and range effect: Lifecycle greenhouse gas emissions of electric vehicles. Environ. Res. Lett. 2016, 11, 054010. [Google Scholar] [CrossRef] [Scilit]
- Notarnicola, B.; Sala, S.; Anton, A.; McLaren, S.J.; Saouter, E.; Sonesson, U. The role of life cycle assessment in supporting sustainable agri-food systems. J. Clean. Prod. 2017, 140, 399–409. [Google Scholar] [CrossRef] [Scilit]
- Ardente, F.; Cellura, M. Economic allocation in life cycle assessment. J. Ind. Ecol. 2012, 16, 387–398. [Google Scholar] [CrossRef] [Scilit]
- Lenzen, M.; Moran, D.; Kanemoto, K.; Geschke, A. Mapping the structure of the world economy. Environ. Sci. Technol. 2012, 46, 8374–8381. [Google Scholar] [CrossRef] [Scilit] [PubMed]
- Tukker, A.; Bulavskaya, T.; Giljum, S.; De Koning, A.; Lutter, F.S.; Simas, M.S.; Stadler, K.; Wood, R. The global resource footprint of nations: Carbon, water, land and materials embodied in trade and final consumption calculated with EXIOBASE 2.1. In The Netherlands Organisation for Applied Scientific Research—NL-2628 XE Delft; Leiden University, NL-2300 RA Leiden; Vienna University of Economics and Business, A-1020 Vienna, Norwegian University of Science and Technology, NO-7491 Trondheim; TNO: The Hague, The Netherlands, 2014; ISBN 978-3-200-03637-6. [Google Scholar]
- Kanemoto, K.; Moran, D.; Lenzen, M.; Geschke, A. International trade undermines national emission reduction targets: New evidence from multi-region input–output analysis. Nat. Clim. Change 2014, 4, 647–651. [Google Scholar] [CrossRef] [Scilit]
- Moran, D.; Wood, R. Convergence between the EIPRO and ReCiPe environmental impact assessment methods. J. Ind. Ecol. 2014, 18, 684–695. [Google Scholar] [CrossRef] [Scilit]
- Li, M.; Wiedmann, T.; Hadjikakou, M. Enabling Full Supply Chain Corporate Responsibility: Scope 3 Emissions Targets for Ambitious Climate Change Mitigation. Environ. Sci. Technol. 2020, 54, 400–411. [Google Scholar] [CrossRef] [Scilit]
- Hoekstra, A.Y.; Mekonnen, M.M. The water footprint of humanity. Proc. Natl. Acad. Sci. USA 2012, 109, 3232–3237. [Google Scholar] [CrossRef] [Scilit]
- Markandya, A.; Arto, I.; González-Eguino, M.; Román, M.V. Towards a green energy economy? Tracking the employment effects of low-carbon technologies in the European Union. Appl. Energy 2016, 179, 1342–1350. [Google Scholar] [CrossRef] [Scilit]
- Ivanova, D.; Wood, R.; Hertwich, E.G. Multi-criteria environmental impacts in sustainability assessments: A review of input-output models. Ecol. Indic. 2016, 69, 123–136. [Google Scholar] [CrossRef] [Scilit]
- Oei, P.Y.; Geng, Y.; Liu, Z. Material flow analysis in the context of input-output modeling: Applications in environmental sustainability. Ecol. Econ. 2020, 169, 106523. [Google Scholar] [CrossRef] [Scilit]
- Zhang, B.; Li, J.; Peng, B. Multi-regional input-output analysis for China’s regional CH4 emissions. Front. Earth Sci. 2014, 8, 163–180. [Google Scholar] [CrossRef] [Scilit]
- Barbosa, A.L.; Salvucci, R.; Rózsai, M.; Neuwahl, F.; Mubareka, S.; Hristov, J.; Blujdea, V.; Pilli, R.; Hilferink, M.; Witzke, H.P.; et al. A Multi-Sectoral Integrated Modelling Framework for Assessing Greenhouse Gas Emissions and Removals in The European Agriculture, Forestry and Land Use Sectors; European Commission: Brussels, Belgium, 2023. [Google Scholar]
- Luo, M.; Zheng, R.; Fan, R.; Zhang, Y.; Yang, M. Research on Interprovincial Embodied Carbon Transfer Network in China and Its Endogenous Dynamic Evolutionary Mechanism. Sustainability 2024, 16, 10814. [Google Scholar] [CrossRef] [Scilit]
- Sachs, J.D. The Age of Sustainable Development; Columbia University Press: New York, NY, USA, 2015. [Google Scholar]
- UNDESA. World Social Report 2019: Inequality in a Rapidly Changing World; Often cited in discussions of why economic/social dimensions matter in sustainability; United Nations: New York, NY, USA, 2019. [Google Scholar]
- McCollum, D.L.; Zhou, W.; Bertram, C.; De Boer, H.S.; Bosetti, V.; Busch, S.; Després, J.; Drouet, L.; Emmerling, J.; Fay, M.; et al. Energy investment needs for fulfilling the Paris Agreement and achieving the Sustainable Development Goals. Nat. Energy 2018, 3, 589–599. [Google Scholar] [CrossRef] [Scilit]
- Vona, F. Job losses and political acceptability of climate policies: Why the ‘job-killing’ argument is so persistent and how to overturn it. Clim. Policy 2019, 19, 524–532. [Google Scholar] [CrossRef] [Scilit]
- Griggs, D.; Stafford-Smith, M.; Gaffney, O.; Rockström, J.; Öhman, M.C.; Shyamsundar, P.; Steffen, W.; Glaser, G.; Kanie, N.; Noble, I. Sustainable development goals for people and planet. Nature 2013, 495, 305–307. [Google Scholar] [CrossRef] [Scilit] [PubMed]
- Frieler, K.; Lange, S.; Piontek, F.; Reyer, C.P.; Schewe, J.; Warszawski, L.; Zhao, F.; Chini, L.; Denvil, S.; Emanuel, K.; et al. Assessing the impacts of 1.5 °C global warming—Simulation protocol of the Inter-Sectoral Impact Model Intercomparison Project (ISIMIP2b). Geosci. Model Dev. 2017, 10, 4321–4345. [Google Scholar] [CrossRef] [Scilit]
- WEF. Supply Chain Sustainability Policies: State of Play; White Paper; World Economic Forum: Geneva, Switzerland, 2022. [Google Scholar]
- IEA. Net Zero by 2050: A Roadmap for the Global Energy Sector; International Energy Analysis: Paris, France, 2021. [Google Scholar]
- IREES. Industrial Decarbonisation in Spain: A Policy-Oriented Assessment; IREES: Karlsruhe, Germany, 2018. [Google Scholar]
- IREES. Sustainability Indicators for Industrial Policy: Strategic Assessments for Decarbonisation in Spain; IREES: Karlsruhe, Germany, 2020. [Google Scholar]
- Ness, B.; Urbel-Piirsalu, E.; Anderberg, S.; Olsson, L. Categorising tools for sustainability assessment. Ecol. Econ. 2007, 60, 498–508. [Google Scholar] [CrossRef] [Scilit]
- Pfeiffer, A.; Millar, R.; Hepburn, C.; Beinhocker, E. The ‘2 °C capital stock’ for electricity generation: Committed cumulative carbon emissions from the electricity generation sector and the transition to a green economy. Appl. Energy 2016, 179, 1395–1408. [Google Scholar] [CrossRef] [Scilit]
- OECD. Aligning Policies for a Low-Carbon Economy; OECD Publishing: Paris, France, 2020. [Google Scholar]
- Newell, R.G.; Pizer, W.A.; Raimi, D. Carbon Market Design, Stability, and Reform; Working Paper EE 13-01; Duke University Press: Durham, NC, USA, 2013. [Google Scholar]
- Kadefors, A.; Lingegård, S.; Uppenberg, S.; Alkan-Olsson, J.; Balian, D. Designing and implementing procurement requirements for carbon reduction in infrastructure construction—International overview and experiences. J. Environ. Plan. Manag. 2021, 64, 611–634. [Google Scholar] [CrossRef] [Scilit]
- Testa, F.; Annunziata, E.; Iraldo, F.; Frey, M. Drawbacks and opportunities of green public procurement: An effective tool for sustainable production. J. Clean. Prod. 2016, 112, 1893–1900. [Google Scholar] [CrossRef] [Scilit]
- Ghadge, A.; Gölgeci, I.; Nudurupati, S.S. Sustainable supply chain management: A systematic literature review. Int. J. Prod. Econ. 2020, 226, 107618. [Google Scholar] [CrossRef] [Scilit]
- Gereffi, G.; Fernández-Stark, K. Global Value Chain Analysis: A Primer. Center on Globalization, Governance & Competitiveness (CGGC); Technical report; Duke University Press: Durham, NC, USA, 2011. [Google Scholar]
- Feller, I.; Boin, A.; Kutz, L. Supply and value chains: Complementary views on firm networks and sustainability. Bus. Soc. Rev. 2006, 111, 231–250. [Google Scholar] [CrossRef] [Scilit]
- Faße, A.; Grote, U.; Winter, E. Value Chain Analysis Methodologies in the Context of Environment and Trade Research. Diskussionsbeitrag, No. 429. 2009. Available online: https://hdl.handle.net/10419/37104 (accessed on 15 December 2025).
- Leontief, W. Quantitative input and output relations in the economic system of the United States. Rev. Econ. Stat. 1936, 18, 105–125. [Google Scholar] [CrossRef] [Scilit]
- Terra dos Santos, L.C.; Frimaio, A.; Giannetti, B.F.; Agostinho, F.; Liu, G.; Almeida, C.M. Integrating environmental, Social, and Economic Dimensions to Monitor Sustainability in the G20 Countries. Sustainability 2023, 15, 6502. [Google Scholar] [CrossRef] [Scilit]
- Kaplinsky, R.; Morris, M. A Handbook for Value Chain Research; Working paper; International Developement Research Center (IDRC): Ottawa, ON, Canada, 2001. [Google Scholar]
- Frederick, S. Global value chain mapping. In Handbook on Global Value Chains; Ponte, S., Gereffi, G., Raj-Reichert, G., Eds.; Edward Elgar Publishing: Cheltenham, UK, 2019; pp. 29–53. ISBN 9781788113762. [Google Scholar] [CrossRef] [Scilit]
- McKinnon, A.; Piecyk, M. Measuring and Managing CO2 Emissions in European Chemical Transport. CEFIC 2010. Available online: https://pure.hw.ac.uk/ws/portalfiles/portal/5046005/McKinnon_Report_Transport_GHG_emissions_24.01.11.pdf (accessed on 15 December 2025).
- Anastasiadis, F.; Alebaki, M. Mapping the greek wine supply chain: A proposed research framework. Foods 2021, 10, 2859. [Google Scholar] [CrossRef] [Scilit]
- Gardner, B.; Cooper, M. Strategic supply chain mapping approaches. J. Bus. Logist. 2003, 24, 37–64. [Google Scholar] [CrossRef] [Scilit]
- Christopher, M.; Lee, H. Mitigating supply chain risk through improved confidence. Int. J. Phys. Distrib. Logist. Manag. 2004, 34, 388–396. [Google Scholar] [CrossRef] [Scilit]
- Ghadge, A.; Wurtmann, H.; Seuring, S. Managing climate change risks in global supply chains: A review and research agenda. Int. J. Prod. Res. 2020, 58, 44–64. [Google Scholar] [CrossRef] [Scilit]
- Liu, Z.; Dong, H.; Geng, Y.; Lu, C.; Ren, W. Insights into the Regional greenhouse gas (GHG) emission of industrial processes: A case study of Shenyang, China. Sustainability 2014, 6, 3669–3685. [Google Scholar] [CrossRef] [Scilit]
- Horsthofer-Rauch, J.; Guesken, S.R.; Weich, J.; Rauch, A.; Bittner, M.; Schulz, J.; Zaeh, M.F. Sustainability-integrated value stream mapping with process mining. Prod. Manuf. Res. 2024, 12, 2334294. [Google Scholar] [CrossRef] [Scilit]
- Peters, G.P.; Minx, J.C.; Weber, C.L.; Edenhofer, O. Growth in emission transfers via international trade from 1990 to 2008. Proc. Natl. Acad. Sci. USA 2011, 108, 8903–8908. [Google Scholar] [CrossRef] [Scilit]
- Rauf, A. Reducing Life Cycle Embodied Energy of Residential Buildings: Importance of Building and Material Service Life. Buildings 2022, 12, 1821. [Google Scholar] [CrossRef] [Scilit]
- Mi, Z.; Meng, J.; Guan, D. Integrated modelling of economic activity and greenhouse gas emissions: Assessing trade-offs for climate policy. Environ. Econ. Policy Stud. 2017, 19, 451–468. [Google Scholar] [CrossRef] [Scilit]
- Brown, N.; Berglund, M.; Bivered, M.; Gray, M.; Nakamura, S. Producing Environmental Accounts with Environmentally Extended Input Output Analysis; Eurostat: Luxembourg, 2021. [Google Scholar]
- He, J.; Wang, S.; Heijungs, R.; Yang, Y.; Shu, S.; Zhang, W.; Xu, A.; Fang, K. Interprovincial food trade aggravates China’s land scarcity. Humanit. Soc. Sci. Commun. 2024, 11, 76. [Google Scholar] [CrossRef] [Scilit]
- Eurostat. Symmetric Input-Output Table at Basic Prices (Product by Product). Available online: https://ec.europa.eu/eurostat/databrowser/view/naio_10_cp1700/default/table?lang=en (accessed on 1 May 2024).
- Eurostat. Air Emissions Accounts by NACE Rev. 2 Activity. Available online: https://ec.europa.eu/eurostat/databrowser/product/page/env_ac_ainah_r2__custom_10009087 (accessed on 1 May 2024).
- Eurostat. Employment by Sex, Age and Detailed Economic Activity (NACE Rev. 2 Two-Digit Level) (2008–2026). Available online: https://ec.europa.eu/eurostat/databrowser/view/LFSA_EGAN22D__custom_11397898/default/table?lang=en (accessed on 1 May 2024).
- Eurostat. Rev, N.A.E. 2 Statistical Classification of Economic Activites in the European Community; European Communities: Luxembourg, 2008; ISSN 1977-0375. ISBN 978-92-79-04741-1. [Google Scholar]
- Microsoft Corporation. Power Query Software. Available online: https://learn.microsoft.com/es-es/power-query/power-query-what-is-power-query (accessed on 1 May 2024).
- Retegi, J.; Ibarra, D.; Igartua, J.I. Assessing the sustainability of industrial value chains in Europe: A mapping method proposal. Prod. Manuf. Res. 2025, 13, 2448010. [Google Scholar] [CrossRef] [Scilit]
- Stavins, R.N. Experience with Market-Based Environmental Policy Instruments. In Handbook of Environmental Economics; Elsevier: Amsterdam, The Netherlands, 2003; pp. 355–435. [Google Scholar] [CrossRef] [Scilit]
- Peters, G.P.; Hertwich, E.G. CO2 Embodied in International Trade with Implications for Global Climate Policy. Environ. Sci. Technol. 2008, 42, 1401–1407. [Google Scholar] [CrossRef] [Scilit] [PubMed]
- Davis, S.J.; Caldeira, K. Consumption-based accounting of CO2 emissions. Proc. Natl. Acad. Sci. USA 2010, 107, 5687–5692. [Google Scholar] [CrossRef] [Scilit]
- Allwood, J.M.; Ashby, M.F.; Gutowski, T.G.; Worrell, E. Material efficiency: A white paper. Resour. Conserv. Recycl. 2011, 55, 362–381. [Google Scholar] [CrossRef] [Scilit]
- Hertwich, E. Increased carbon footprint of materials production driven by rise in investments. SocArXiv 2019. [Google Scholar] [CrossRef] [Scilit]
- Creutzig, F.; Roy, J.; Lamb, W.F.; Azevedo, I.M.; De Bruin, W.B.; Dalkmann, H.; Edelenbosch, O.Y.; Geels, F.W.; Grubler, A.; Hepburn, C.; et al. Towards demand-side solutions for mitigating climate change. Nat. Clim. Change 2018, 8, 260–263. [Google Scholar] [CrossRef] [Scilit]
- Ivanova, D.; Barrett, J.; Wiedenhofer, D.; Macura, B.; Callaghan, M.; Creutzig, F. Quantifying the potential for climate change mitigation of consumption options. Environ. Res. Lett. 2020, 15, 093001. [Google Scholar] [CrossRef] [Scilit]
- Nilsson, L.J.; Bauer, F.; Åhman, M.; Andersson, F.N.G.; Bataille, C.; Can, S.d.l.R.d.; Ericsson, K.; Hansen, T.; Johansson, B.; Lechtenböhmer, S.; et al. An industrial policy framework for transforming energy and emissions intensive industries towards zero emissions. Clim. Policy 2021, 21, 1053–1065. [Google Scholar] [CrossRef] [Scilit]
- Markard, J.; Raven, R.; Truffer, B. Sustainability transitions: An emerging field of research and its prospects. Res. Policy 2012, 41, 955–967. [Google Scholar] [CrossRef] [Scilit]
- Workman, M.; Heap, R.; Mackie, E.; Connon, I. Decision making for net zero policy design and climate action: Considerations for improving translation at the research-policy interface: A UK Carbon Dioxide Removal case study. Front. Clim. 2023, 5, 1288001. [Google Scholar] [CrossRef] [Scilit]
- Stevis, D.; Felli, R. Global labour unions and just transition to a green economy. Int. Environ. Agreem. 2015, 15, 29–43. [Google Scholar] [CrossRef] [Scilit]
- Grubb, M. Planetary Economics: Energy, Climate Change and the Three Domains of Sustainable Development; Routledge: London, UK, 2014. [Google Scholar]
- Nomaler, Z.O.; Verspagen, B. Analysing Global Value Chains Using Input-Ouput Economies: Proceed with Care; MERIT working papers 2014-070; United Nations University—Maastricht Economic and Social Research Institute on Innovation and Technology: Maastricht, The Netherlands, 2014. [Google Scholar]
- Retegi, J.; Ibarra, D.; Igartua, J.I.; Rabanete, L. Assessing Scope 3 Emissions in Industrial Value Chains: A Query Combination Methodology Approach. In Proceedings of 19th International Conference on Industrial Engineering and Industrial Management (ICIEIM) and XXIX Congreso de Ingeniería de Organización; Barbadilla, E., Ed.; Springer Nature: Cham, Switzerland, 2025. [Google Scholar] [CrossRef] [Scilit]
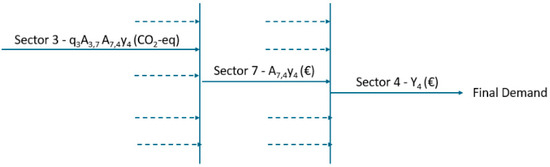
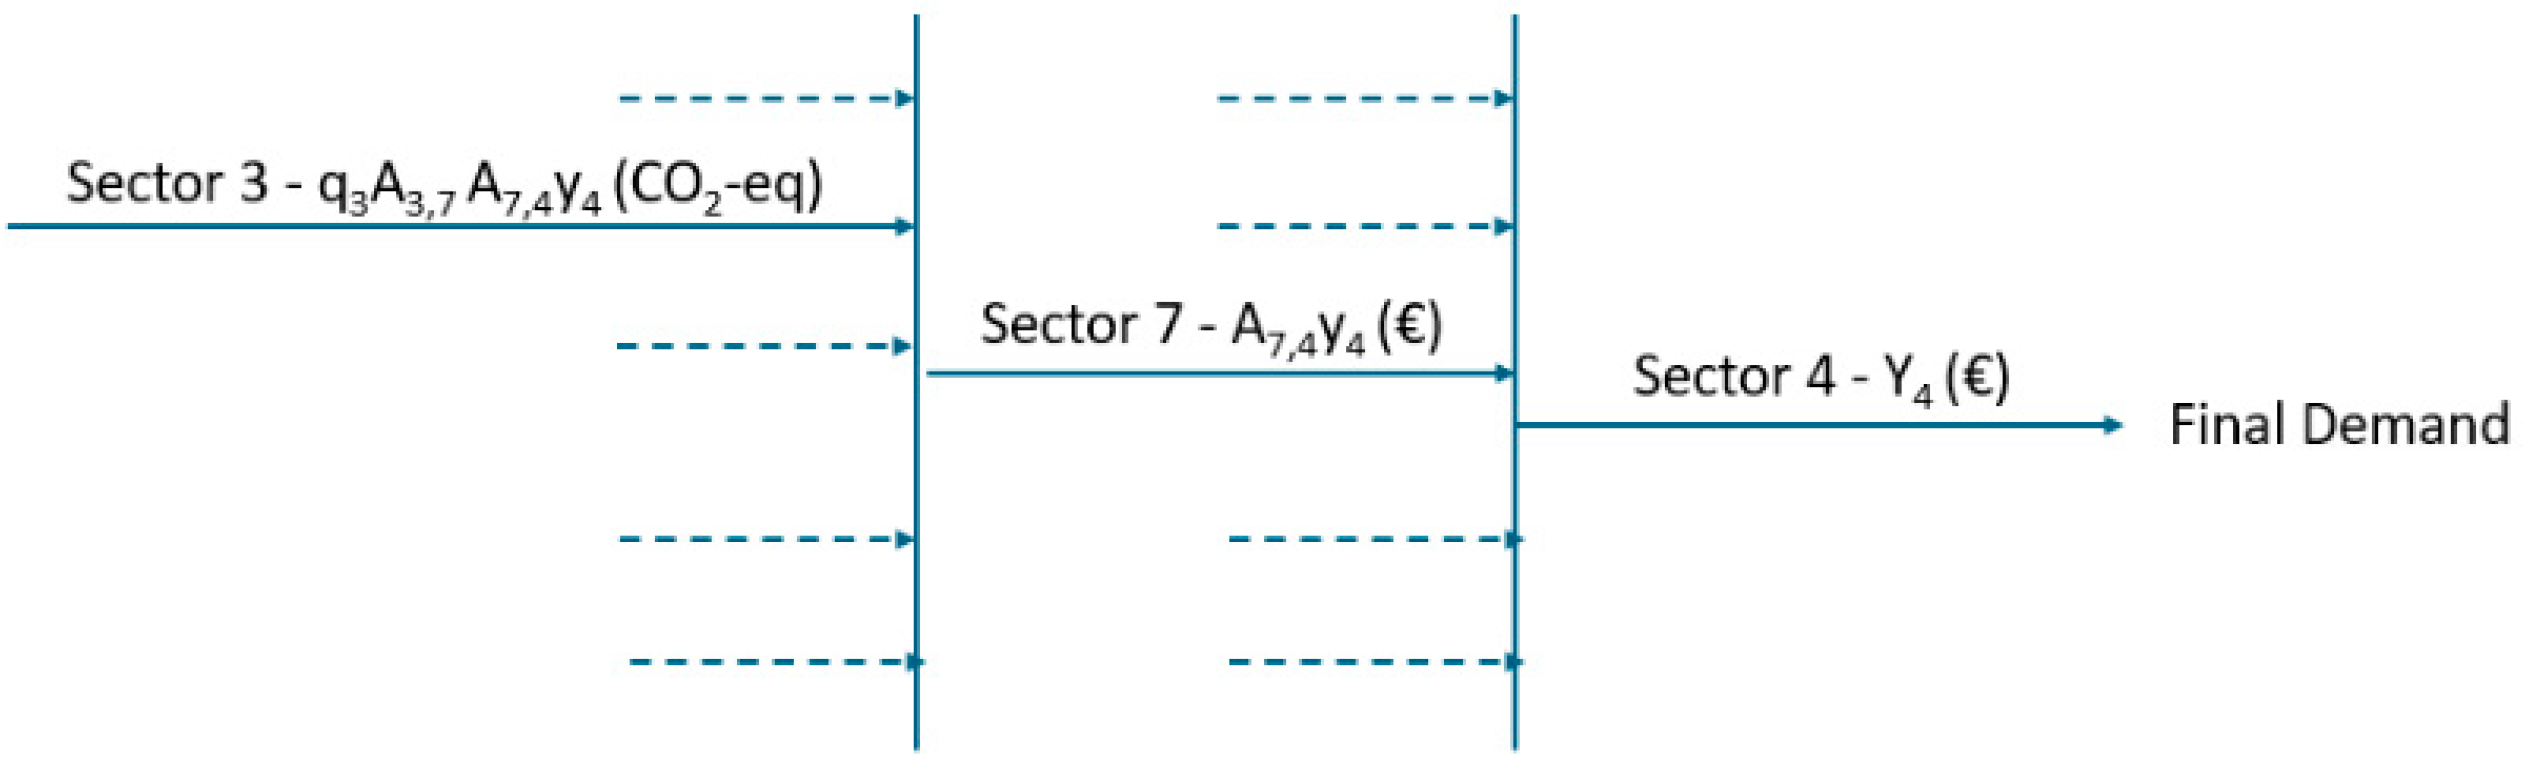


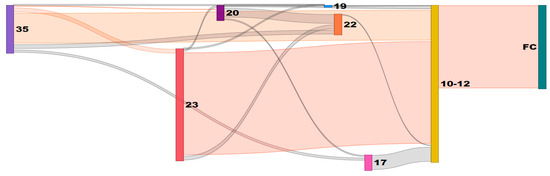
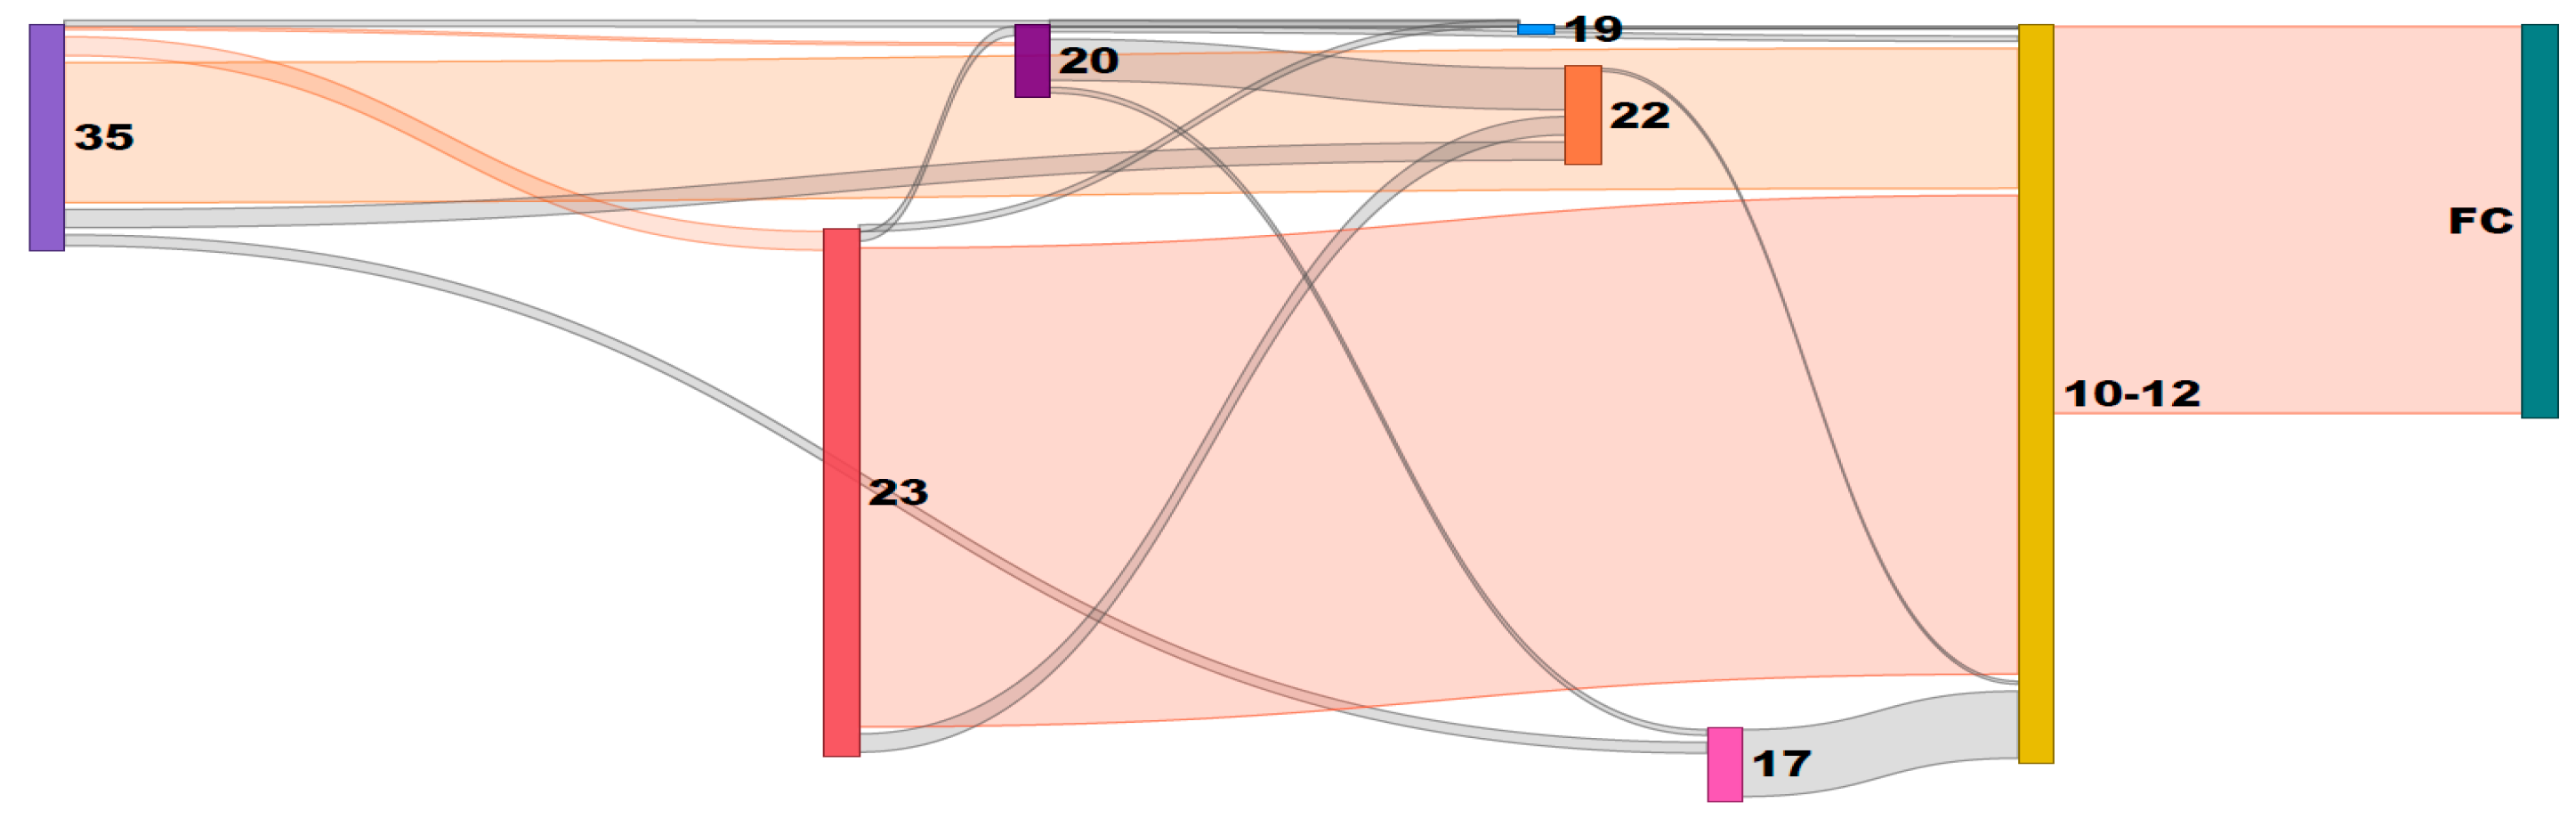
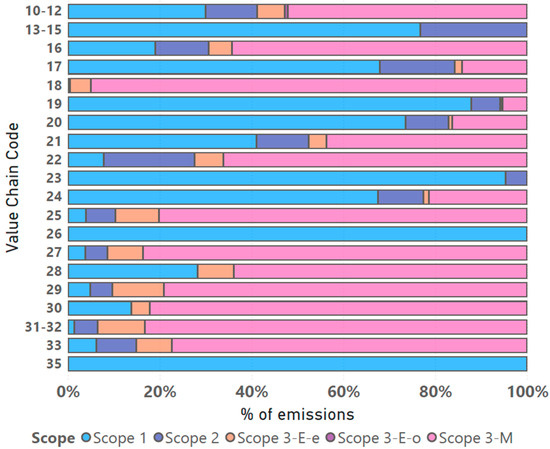
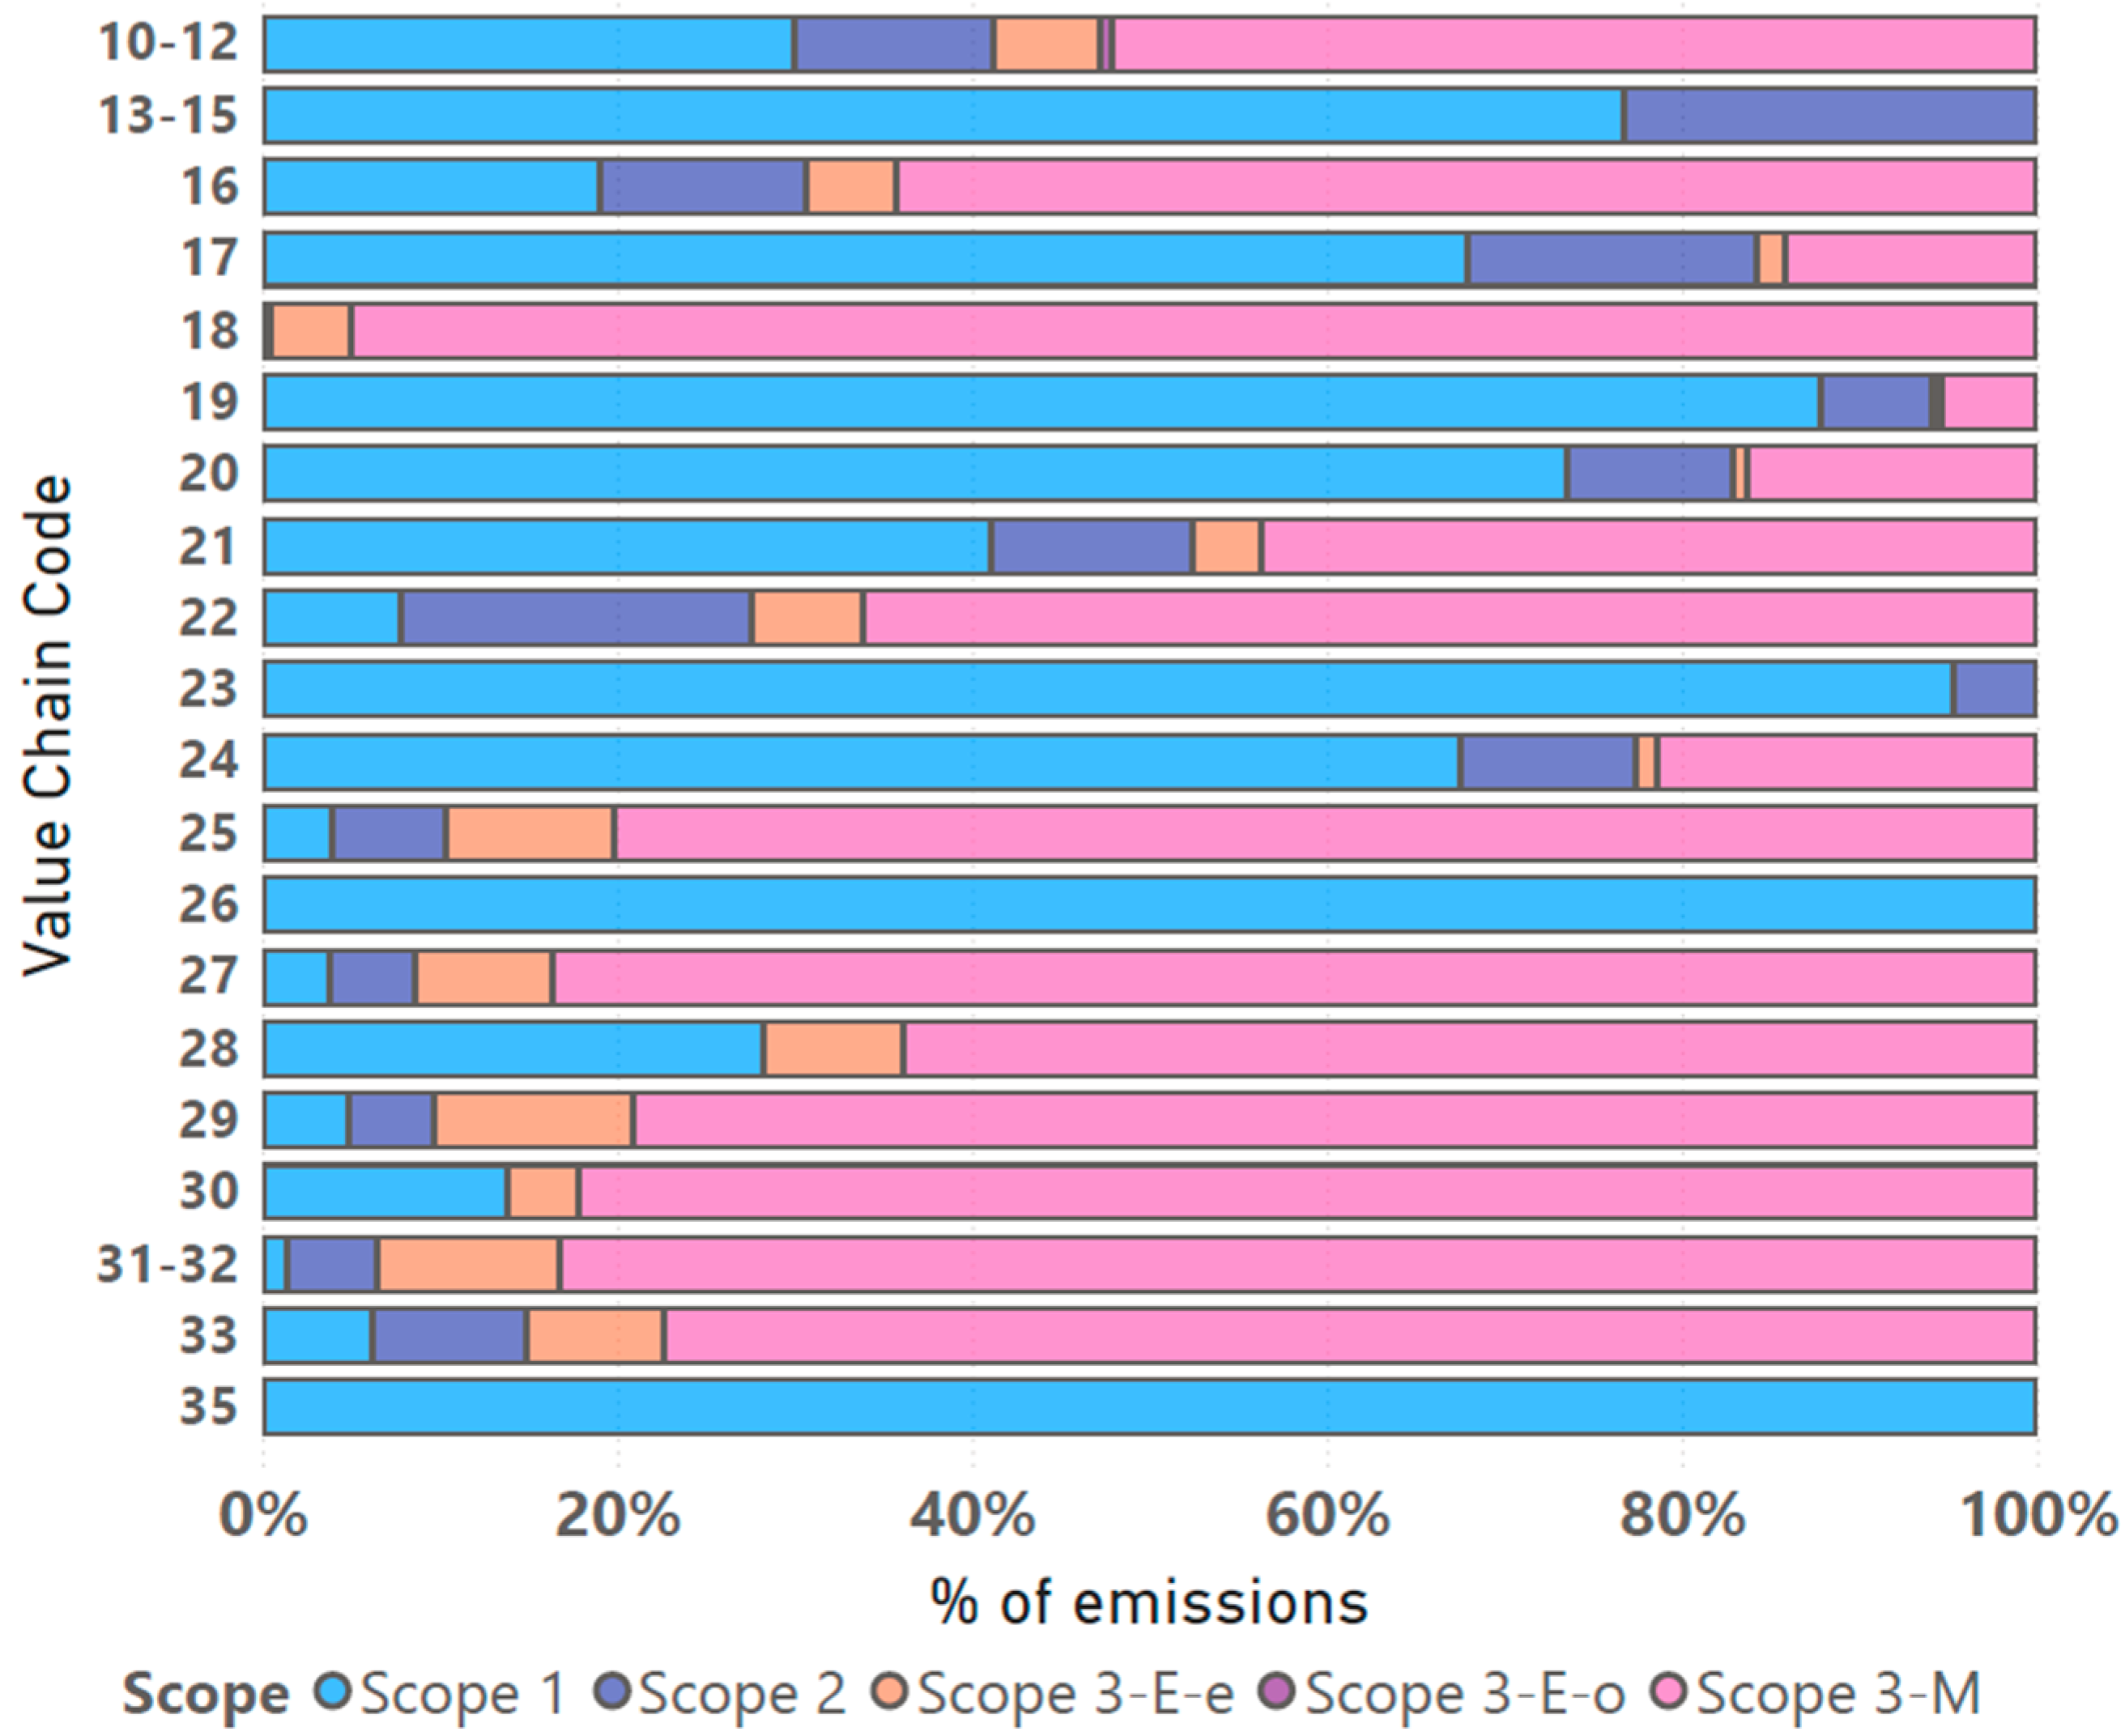

Disclaimer/Publisher’s Note: The statements, opinions and data contained in all publications are solely those of the individual author(s) and contributor(s) and not of MDPI and/or the editor(s). MDPI and/or the editor(s) disclaim responsibility for any injury to people or property resulting from any ideas, methods, instructions or products referred to in the content. |
© 2026 by the authors. Licensee MDPI, Basel, Switzerland. This article is an open access article distributed under the terms and conditions of the Creative Commons Attribution (CC BY) license.