


Abstract
Winter precipitation in Northeastern Asia has important implications for regional climate and weather hazards, yet its month-to-month evolution under global warming remains poorly understood. Using observations and the Policy Decision-making for Future climate change (d4PDF) large-ensemble simulations, this study investigates winter precipitation from November to March (NDJFM) and its projected changes under +2 K and +4 K global warming. Observations show a broadly U-shaped month-to-month evolution, with less precipitation in midwinter than at the beginning and end of winter. d4PDF generally reproduces the observed spatial pattern and month-to-month evolution, despite some regional biases. Winter precipitation is projected to increase across Northeastern Asia, with larger relative increases over the dry continental regions. Warming also reorganizes the monthly distribution of precipitation: the U-shaped evolution generally weakens, while the direction of subseasonal shifts varies regionally. Moisture-budget analysis indicates that submonthly moisture transport plays an important role in wintertime moisture convergence and its projected changes. Over the continental regions, enhanced submonthly moisture convergence offsets changes associated with the monthly mean flow, while thermodynamic effects dominate changes in the monthly component.
1. Introduction
East Asia is frequently affected by cold spells, snowfall, and freezing-rain events during winter [1,2,3,4,5,6]. Compared with low temperatures alone, heavy snowfall can cause more direct and severe impacts on power infrastructure, transportation, agriculture, and daily life [1,7,8]. In recent years, northern China has experienced several severe snowstorms. In November 2021, snowstorms across Northeast and North China affected more than 350,000 people and caused substantial economic losses [9,10]. In November 2023, repeated snowstorms affected the region again, with daily precipitation at 41 national meteorological stations in Heilongjiang, Jilin, and Liaoning exceeding their historical November records [11,12,13]. The associated impacts, including major transportation disruptions and infrastructure damage, highlight the high vulnerability of Northeastern Asia to winter precipitation extremes. Understanding how winter precipitation may change under global warming is therefore important for improving climate-risk assessment and disaster preparedness.
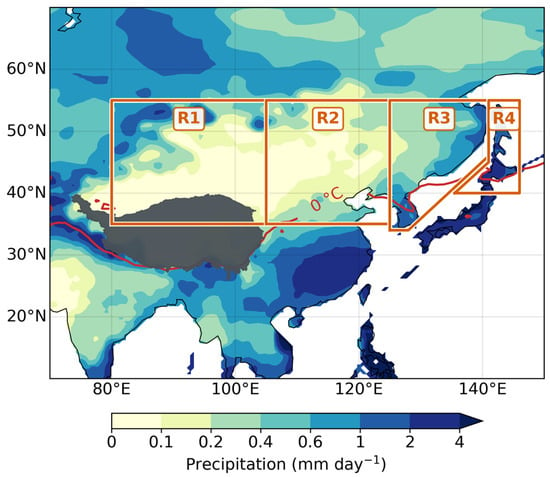
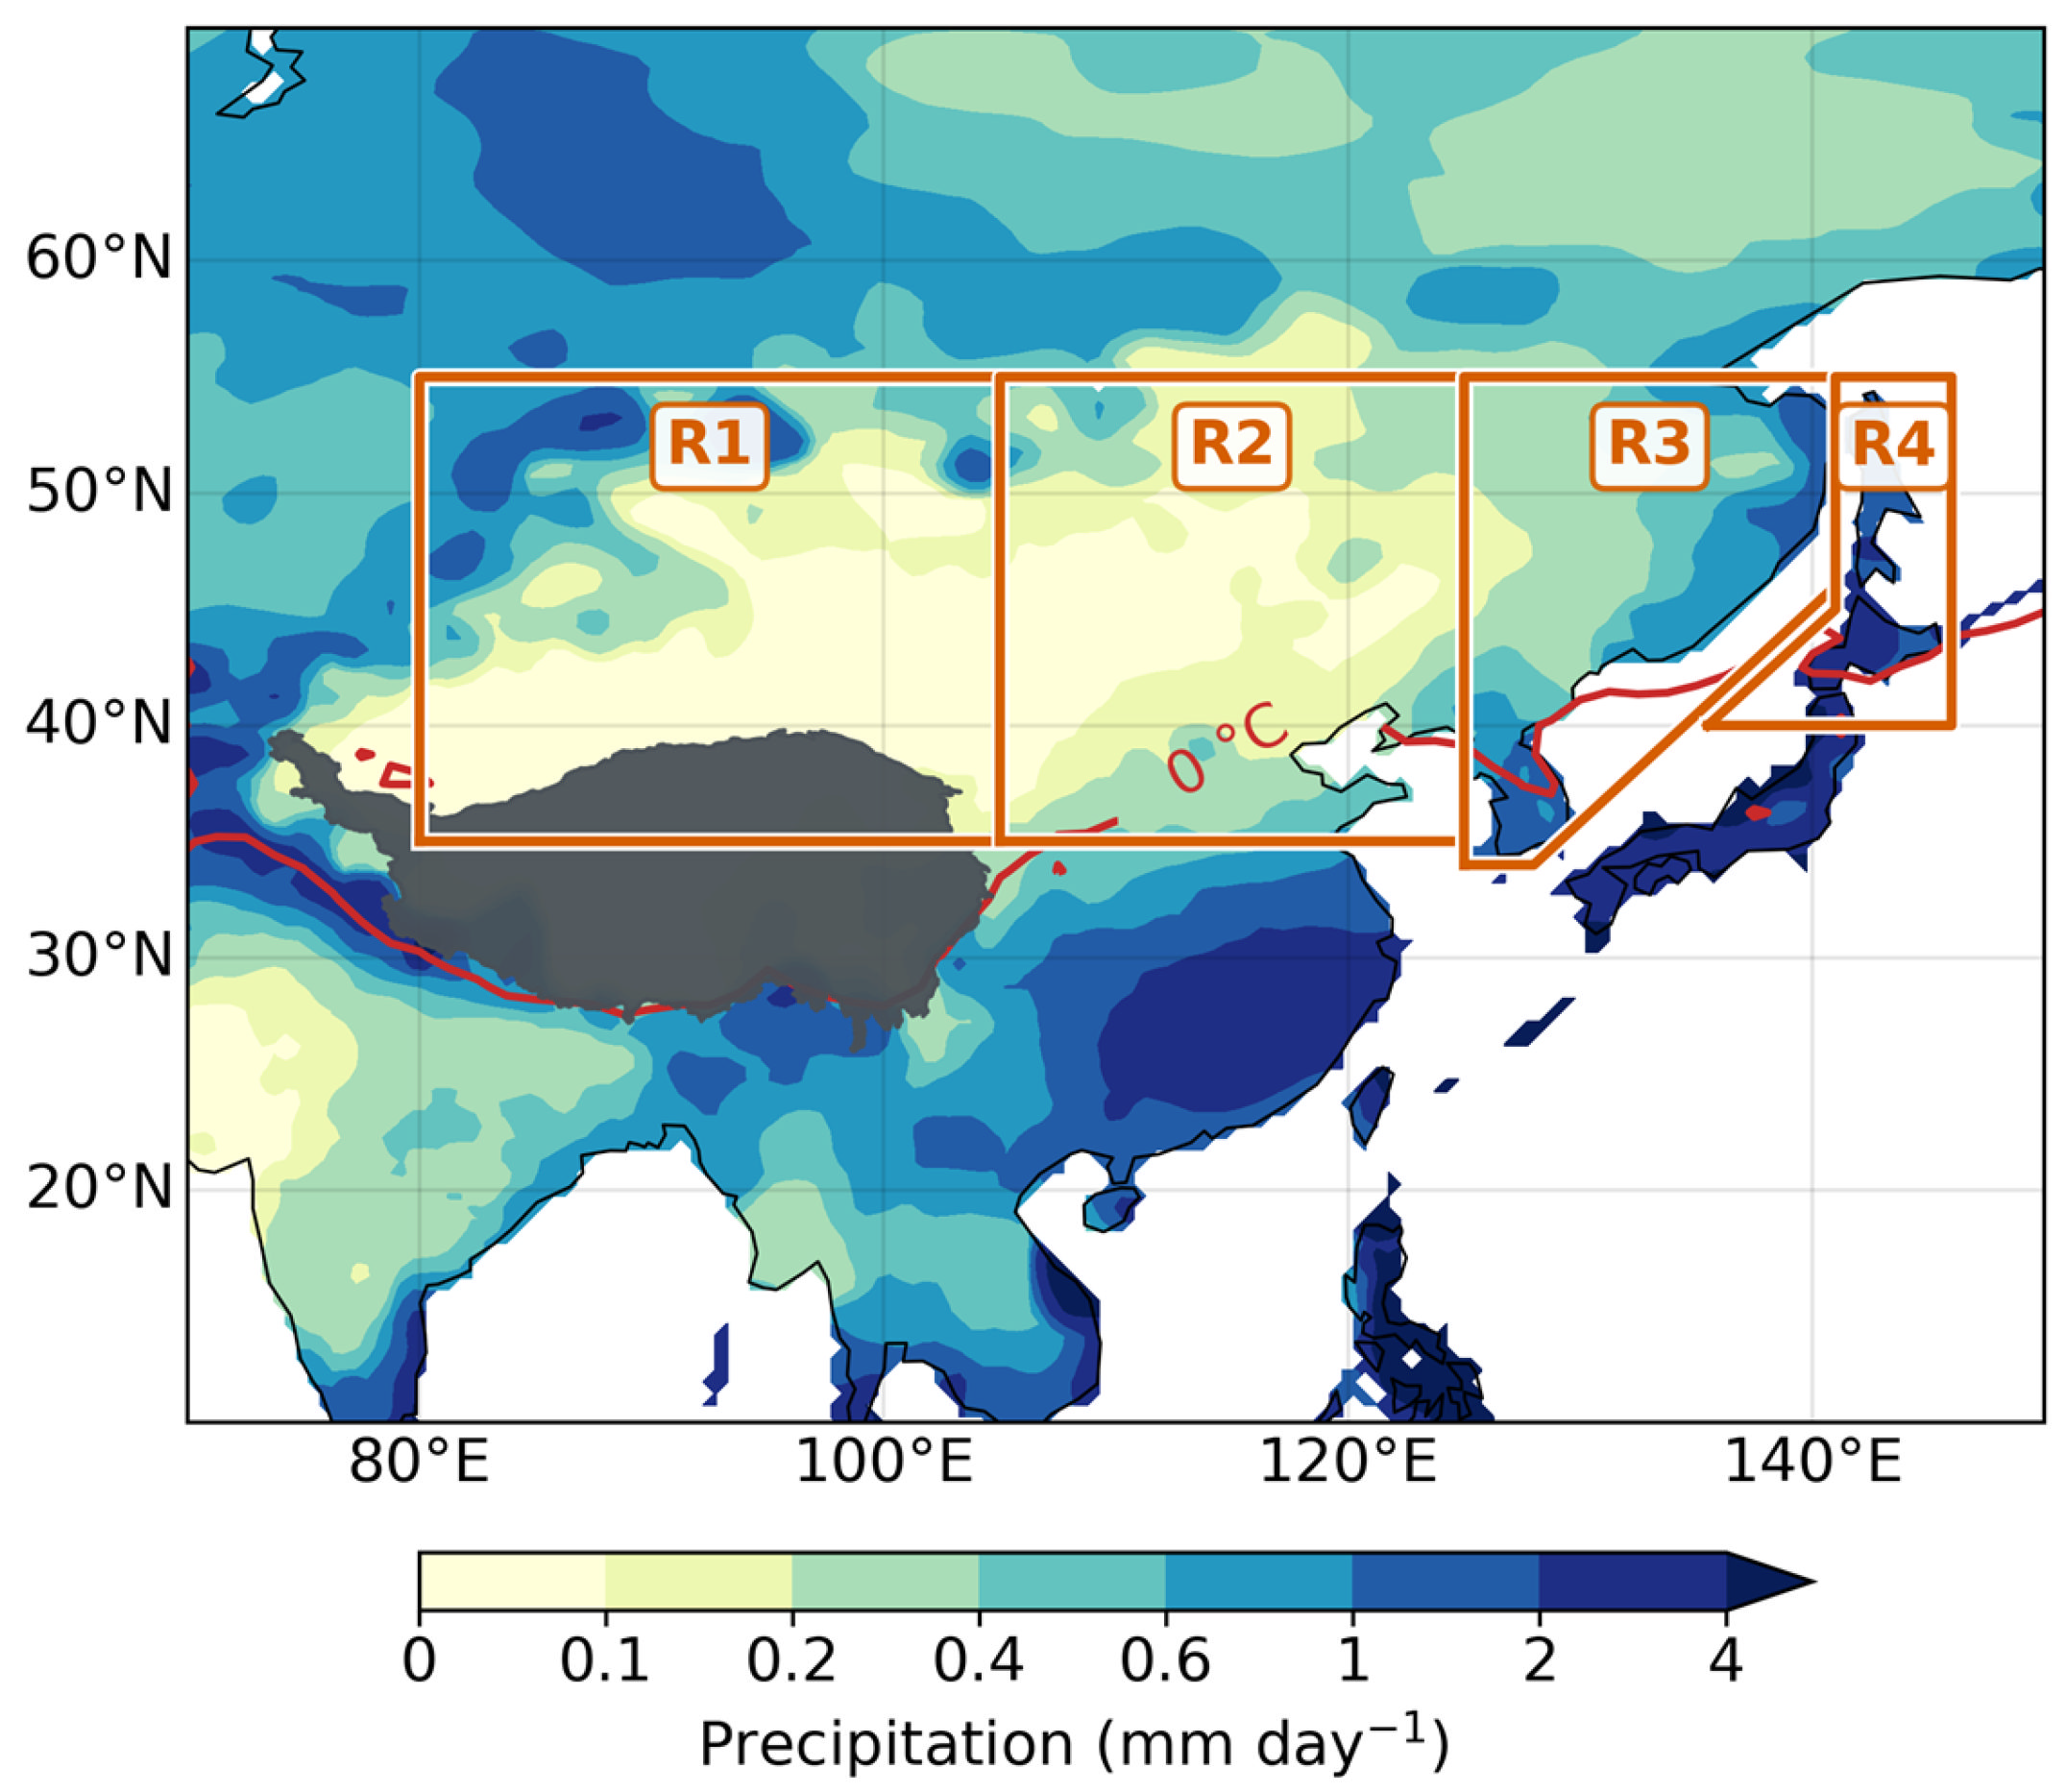
Although winter precipitation is much lower in northern East Asia than in southern East Asia [14,15], mean winter temperatures are below freezing across much of the north (Figure 1), making snowfall-related hazards more frequent. Northeast China and Inner Mongolia are particularly prone to snow disasters, where heavy snowfall frequently causes power-line icing, road icing, and damage to buildings and agricultural facilities. This study therefore focuses on the region north of the climatological 0 °C isotherm (Figure 1).
Figure 1.
Study domain and four subregions in Northeastern Asia. R1–R4 denote the western inland cold-arid region, Mongolia–North China transition region, Northeast China–Korean Peninsula region, and northern Japan, respectively. Shading indicates the climatological mean winter precipitation (mm day−1). The climatological 0 °C isotherm is shown as a reference for defining the winter precipitation study domain in Northeastern Asia. Grey shading denote the location of Tibet Plateau.
Previous studies of winter precipitation in East Asia have primarily focused on the rainfall belt from southern China to southern Japan [3,4,5,16,17,18], largely because the climatological winter precipitation maximum is located in the south (Figure 1) [14]. The leading EOF mode of winter precipitation over China is characterized by coherent variations in southern China and explains approximately 43% of the total variance [19,20]. On intraseasonal timescales, winter precipitation in southern China is strongly influenced by the East Asian winter monsoon circulation and the Madden–Julian Oscillation (MJO) [21,22,23,24], whereas its interannual variability is closely associated with the combined effects of the East Asian winter monsoon and ENSO [14,18,25,26,27,28,29,30,31,32,33]. Using machine learning models, Qian and Jia (2023) [19] further identified western Pacific sea surface temperature and Arctic sea ice as key predictors of seasonal winter precipitation over southern China. Thus, although the variability and mechanisms of winter precipitation in southern East Asia have been extensively investigated, much less attention has been paid to northern regions because of their relatively low climatological precipitation.
Several studies have investigated future changes in winter climate over East Asia under global warming [34,35,36,37,38]. The IPCC Sixth Assessment Report, based on the CMIP6 multi-model ensemble mean, projects an increase in annual precipitation over northern Eurasia, including northern China, under global warming of 2 °C and 4 °C [34]. You et al. (2022) [36] further showed that annual precipitation over East Asia is projected to increase by 1.7–1.9% and 2.5–2.7% under 1.5 °C and 2 °C warming, respectively, while the East Asian winter monsoon circulation is likely to weaken, albeit with considerable uncertainty. For northern East Asia, Miao et al. (2020) [35] projected increases in winter precipitation of approximately 8% and 12% under 1.5 °C and 2 °C warming, respectively. Using precipitation–temperature scaling, Liang and Zhang (2021) [39] estimated that East Asian precipitation increases by about 3% °C−1 in summer but by about 7% °C−1 in winter. Overall, these studies consistently suggest an increase in winter precipitation over Northeastern Asia under global warming.
However, most previous studies have focused on seasonal or annual mean changes [6,20,26,27,37,38,40,41], with much less attention paid to the month-to-month evolution of winter precipitation. This study therefore focuses on the evolution of winter precipitation from November to March (NDJFM) in Northeastern Asia. We first evaluate the ability of the model to reproduce the observed month-to-month evolution. We then investigate how global warming alters the magnitude and relative distribution of precipitation across the five months, with particular attention to whether precipitation shifts toward early or late winter. Finally, a moisture-budget analysis is used to diagnose the physical processes responsible for the projected changes.
The remainder of this paper is organized as follows. Section 2 describes the datasets and methods, with a focus on the database for Policy Decision-making for Future climate change (d4PDF) [42] large-ensemble simulations used in this study. Section 3.1 characterizes the month-to-month evolution of winter precipitation in Northeastern Asia and evaluates the model’s ability to reproduce the observed features. Section 3.2 examines projected changes in the month-to-month evolution under global warming, with particular emphasis on the reorganization of the month-to-month precipitation progression. Section 3.3 diagnoses the possible mechanisms underlying the projected precipitation changes using a moisture-budget analysis. Section 4 and Section 5 provide discussions and conclusions, respectively.
2. Datasets and Methods
2.1. Datasets
This study focuses on the winter months from November to March (NDJFM). The analysis covers the 60-year period from 1951 to 2010, which is common to all datasets. The study domain is Northeastern Asia, approximately (35–55° N, 80–140° E), where the climatological winter-mean temperature is generally below 0 °C (Figure 1). Based on regional climatic characteristics, the domain is further divided into four subregions: R1, the western inland cold-arid region (35–55° N, 80–105° E); R2, the Mongolia–North China transition region (35–55° N, 105–125° E); R3, the Northeast China–Korean Peninsula region (continental areas east of 125° E and south of 55° N); and R4, northern Japan (north of 40° N) (Figure 1). Throughout this study, we focus exclusively on precipitation over land grid cells, defined as grid cells whose centers are located over land.
2.1.1. Observations and Reanalysis
The precipitation dataset used in this study is the Precipitation Reconstruction over Land (PREC/L) [43], provided by the National Oceanic and Atmospheric Administration (NOAA) PSL, Boulder, Colorado, USA, from their website at https://psl.noaa.gov (accessed on 15 January 2026). PREC/L is reconstructed from observations at more than 17,000 land-based stations worldwide. We use the version with a spatial resolution of 0.5° × 0.5°, which provides monthly precipitation from January 1948 to the present. CRU-TSv4.10 [44] precipitation data is also employed in this study, with the 0.5° × 0.5° spatial resolution and time range of 1902–2025.
We also use the Japanese Reanalysis for Three Quarters of a Century (JRA-3Q) [45]. This reanalysis is developed by the Numerical Prediction Division, Information Infrastructure Department, Japan Meteorological Agency, Tokyo, Japan. Monthly mean 2-m air temperature (T2m) is obtained from the 1.25° surface analysis fields (anl_surf125). JRA-3Q covers the period from September 1947 to the present.
2.1.2. Large-Ensemble Model Outputs
The Database for Policy Decision-Making for Future Climate Change (d4PDF) is used to assess projected changes under +2 K and +4 K global warming levels [42,46]. d4PDF is a large-ensemble dataset generated by a global atmospheric model rather than a coupled climate model. Sea surface temperature (SST), sea ice concentration (SIC), and sea ice thickness (SIT) are prescribed as lower-boundary conditions, while greenhouse gases, ozone, and aerosols are specified as external forcings.
We use three sets of global model experiments: (1) the historical climate simulations (Hist), consisting of 100 members for 1951–2010; (2) the +2 K simulations, consisting of 54 members for 2031–2090; and (3) the +4 K simulations, consisting of 90 members for 2051–2110. Monthly mean data at 1.25° horizontal resolution are used in this study. For the +2 K and +4 K experiments, six SST warming patterns derived from CMIP5 models are prescribed to represent uncertainty in the spatial pattern of future SST warming. The consistency of precipitation changes among these six patterns is used to assess the robustness of the projected response.
2.2. Methods
2.2.1. Definitions of Indices
We define four indices to characterize winter precipitation and its month-to-month evolution (Table 1): NDJFM total precipitation, monthly precipitation fraction, seasonal curvature index, and seasonal asymmetry index.
Table 1.
Indices for describing the month-to-month evolution of winter precipitation.
The seasonal curvature index () measures the curvature of the seasonal evolution. The weights used for are [2, −1, −2, −1, 2] for November–March. They represent the quadratic orthogonal contrast for five equally spaced points and are proportional to the curvature coefficient obtained from a least-squares quadratic fit. Specifically, representing November–March as x = (−2, −1, 0, 1, 2), the centered quadratic term yields the weights (2, −1, −2, −1, 2). These weights isolate the quadratic curvature of the monthly precipitation distribution and quantify the strength of its U-shaped pattern. This formulation does not assume an exact parabolic evolution; rather, it extracts the lowest-order curvature component, while deviations from this idealized shape are retained in . A larger indicates a more pronounced U-shaped evolution, with greater precipitation fractions in early and late winter and a smaller fraction in midwinter.
The weights used for are [−1, −1, 0, 1, 1], which directly compare precipitation contributions between early and late winter. A larger indicates a greater shift of precipitation toward late winter, whereas a smaller (more negative) value indicates a shift toward early winter. Together, and IA describe the curvature and asymmetry of the month-to-month precipitation evolution, respectively.
2.2.2. Atmospheric Moisture Budget
Following Xu et al. (2024) [47], the atmospheric moisture budget is expressed as
where and are precipitation and evaporation, respectively; denotes the horizontal divergence in the pressure coordinate, is the horizontal wind velocity, is pressure, is the specific humidity, is the gravitational acceleration, is the residual term. For a given variable , indicates its monthly mean, denotes the subseasonal deviation.
The total moisture-flux convergence (MFC) is further separated into monthly and submonthly components (Equation (2)). The monthly term represent moisture transport by the mean circulation, whereas the submonthly term primarily represents transient-eddy moisture transport. In this study, the submonthly MFC is calculated by total MFC minus the monthly MFC.
Future changes are expressed as (Equation (3))
where denote the differences between the +4 K and Hist climatologies, indicates the Hist climatology. The change in net precipitation () is decomposed into the monthly term, submonthly term, and residual (Equation (3)). Further, the monthly term is separated into dynamic, thermodynamic and nonlinear components (Equation (4)). The dynamic term represents the effect of circulation changes under the historical moisture filed, the thermodynamic term represents the effect of moisture changes under the historical circulation, and the nonlinear term represents the interaction between circulation and moisture changes [48,49].
Two criteria were used to assess the robustness of the projected changes.
Bootstrap significance test. Historical and future ensemble members were independently resampled 1000 times. For each resampling, the ensemble-mean monthly precipitation was calculated first, followed by , , and , and their future-minus-historical differences. The 2.5th and 97.5th percentiles of the bootstrap distribution defined the 95% confidence interval. A change was considered significant when the interval did not include zero.
Agreement among SST warming patterns. Future members were grouped into six SST warming patterns [42]. For each pattern, the ensemble-mean change relative to the historical ensemble mean was calculated. Agreement was identified when at least five of the six patterns showed the same sign as the change based on all future ensemble members.
Generative artificial intelligence (GenAI), i.e., the ChatGPT version GPT-5.6-Sol light, was used in this paper to assist with coding during the analysis, all AI-assisted code was carefully reviewed and verified by the authors to ensure its correctness.
3. Results
3.1. Month-to-Month Evolution of Winter Precipitation in Northeastern Asia
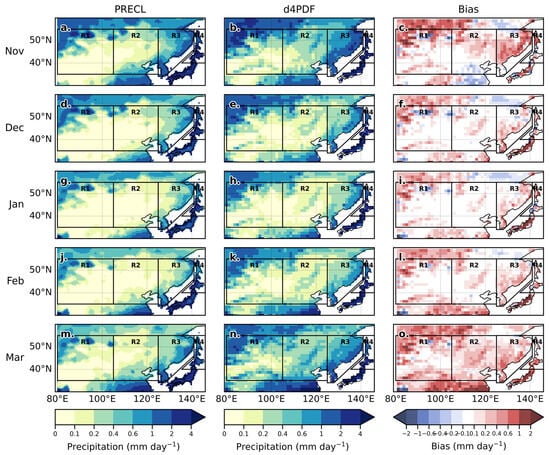
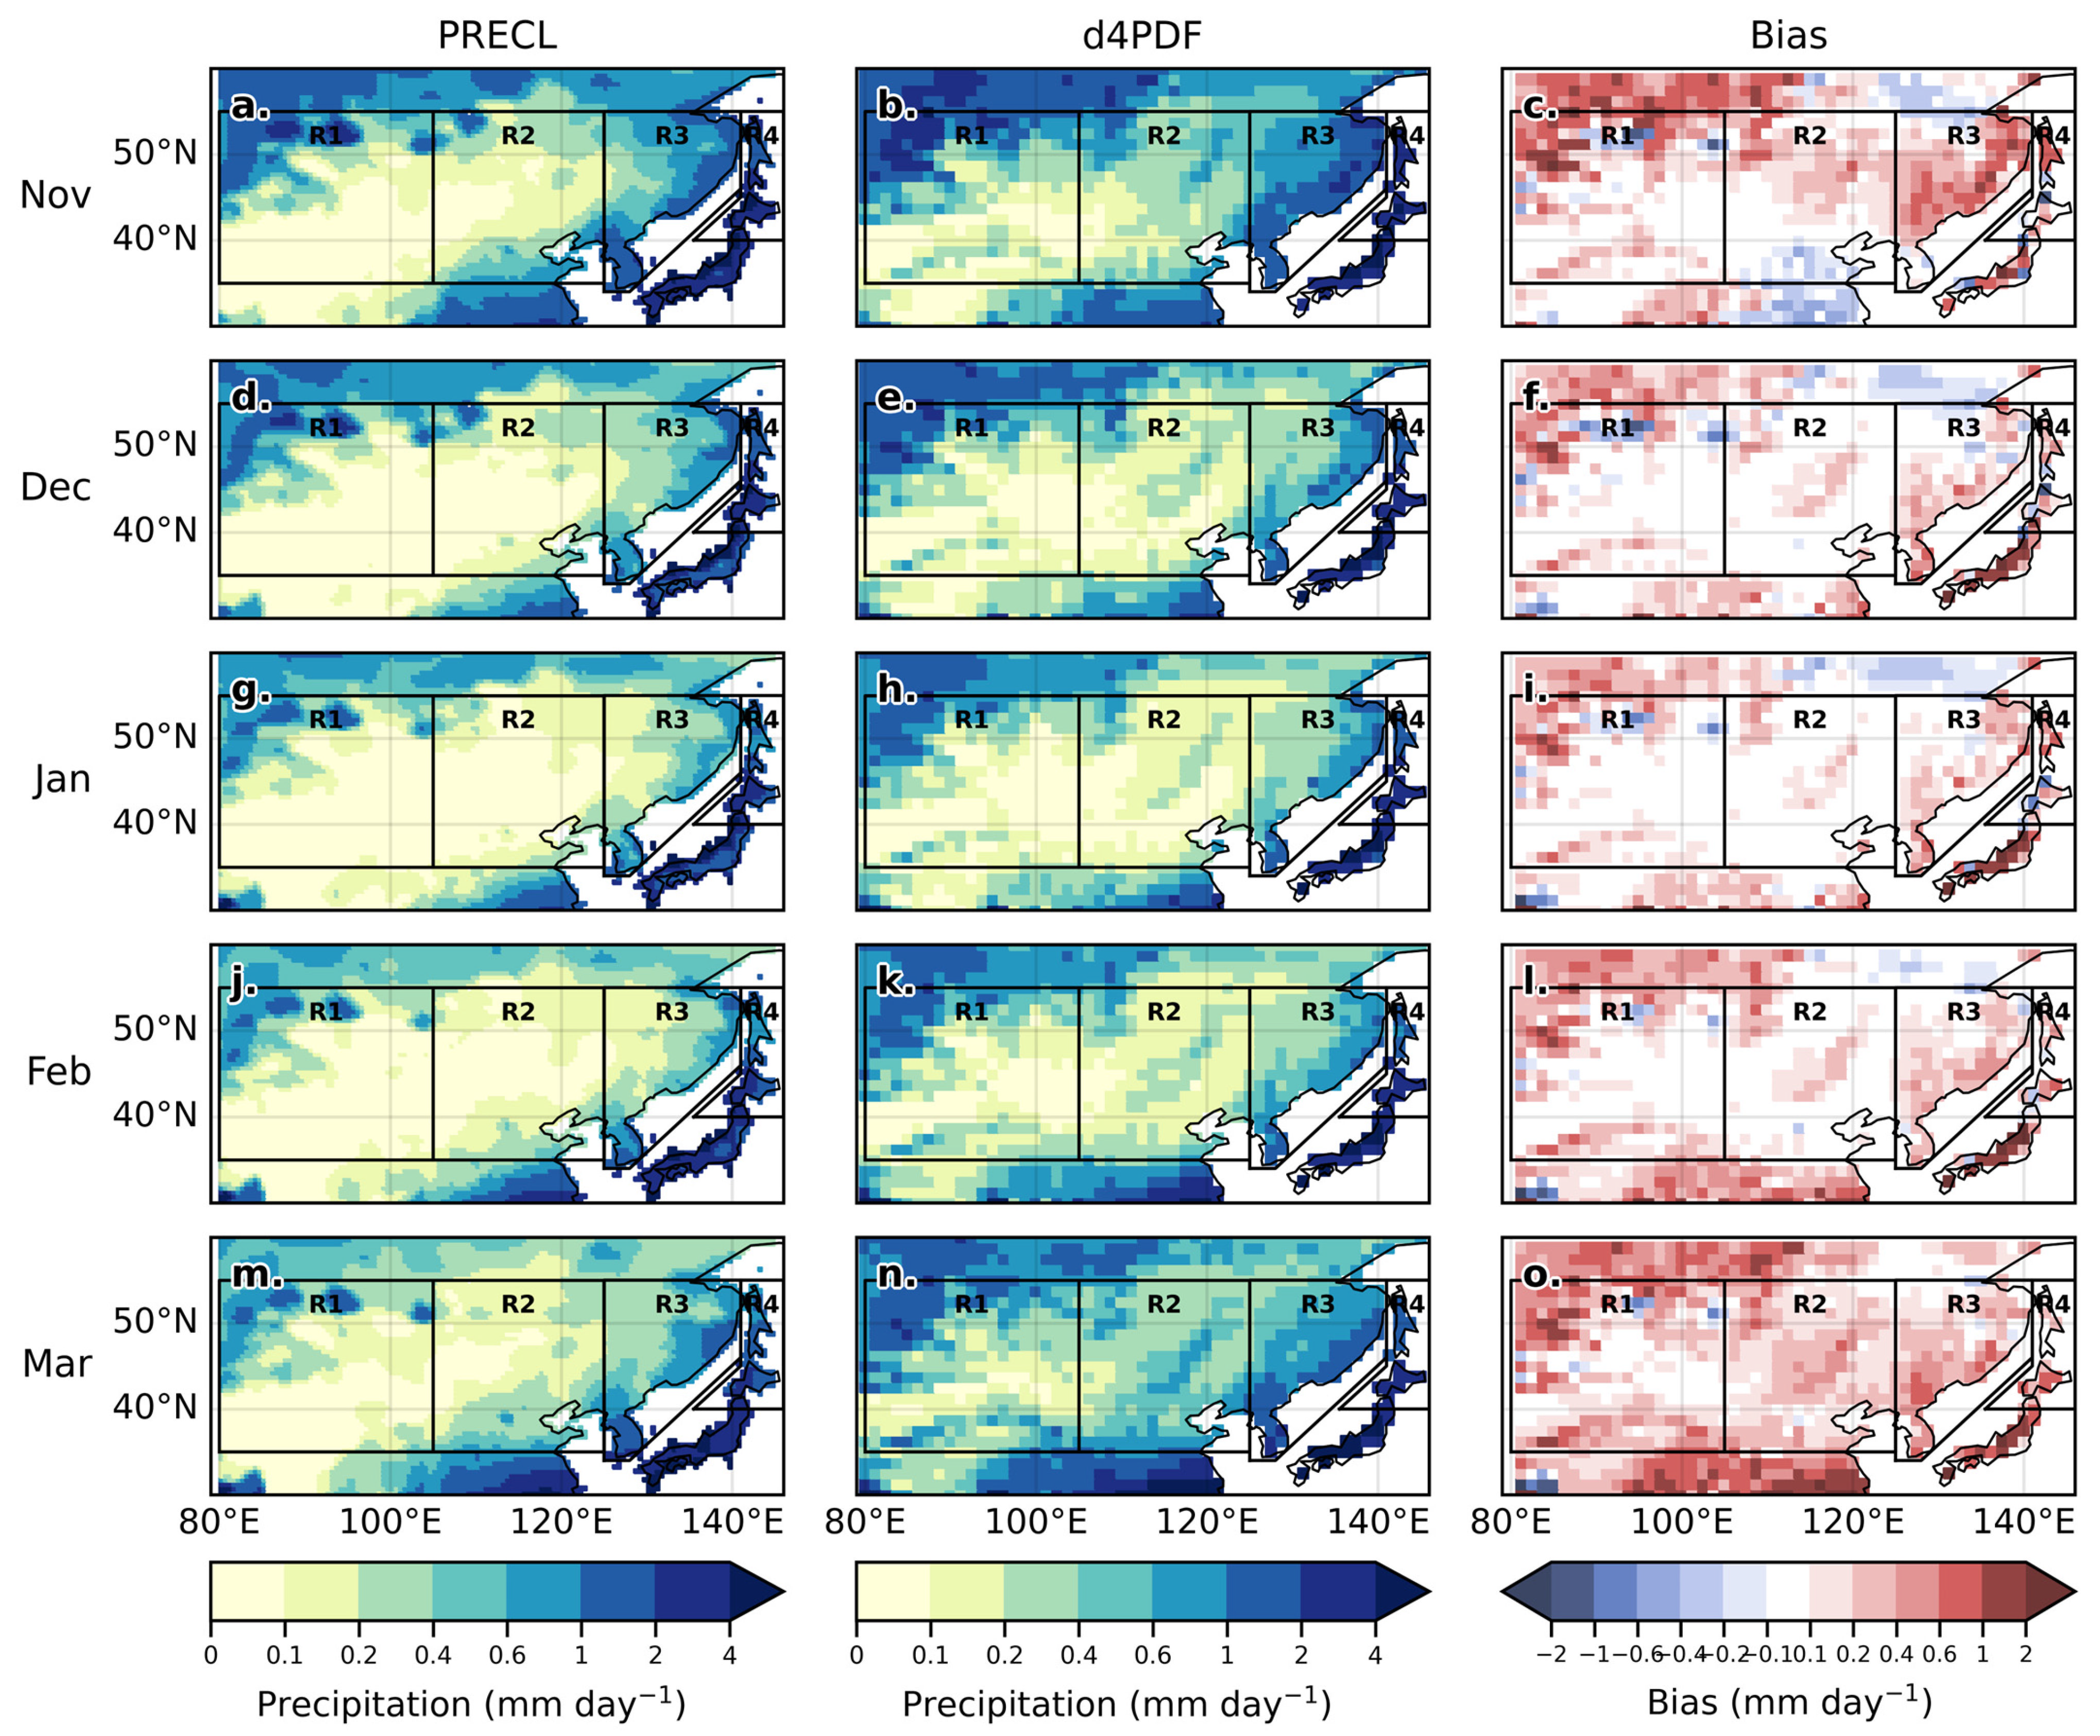
Figure 2 shows the spatial distribution and month-to-month evolution of winter precipitation in Northeastern Asia based on PREC/L observations and d4PDF simulations. Observed precipitation exhibits a pronounced west–east gradient, with dry conditions over the inland region (R1), a transition zone along the margin of the East Asian monsoon region (R2), wetter conditions in the eastern coastal region (R3), and abundant precipitation over northern Japan (R4), where moisture supply is relatively plentiful. From November to January, the dry region gradually expands, followed by a retreat from January to March, indicating a clear month-to-month evolution of winter precipitation.
Figure 2.
Climatology of winter precipitation (shading; mm day−1) from PRECL observations and d4PDF simulations. (a) Spatial distribution of November precipitation from PRECL. (b) As in (a), but for the 100-member ensemble mean of the Hist experiment. (c) Difference between Hist and PRECL (b–a). (d–o) As in (a–c), but for December–March, respectively.
The 100-member Hist ensemble mean reproduces the observed spatial pattern and month-to-month evolution well, although precipitation is generally overestimated, particularly in wetter regions. As this study focuses on the month-to-month evolution of winter precipitation, the causes of these systematic biases are not examined further.
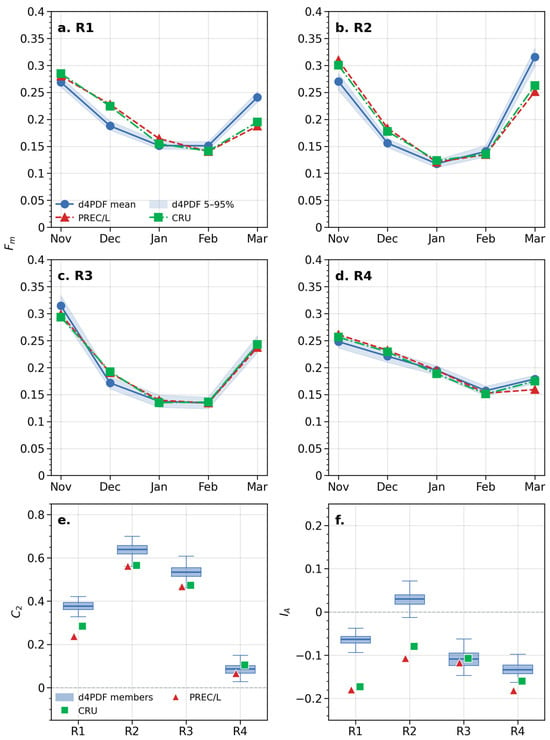
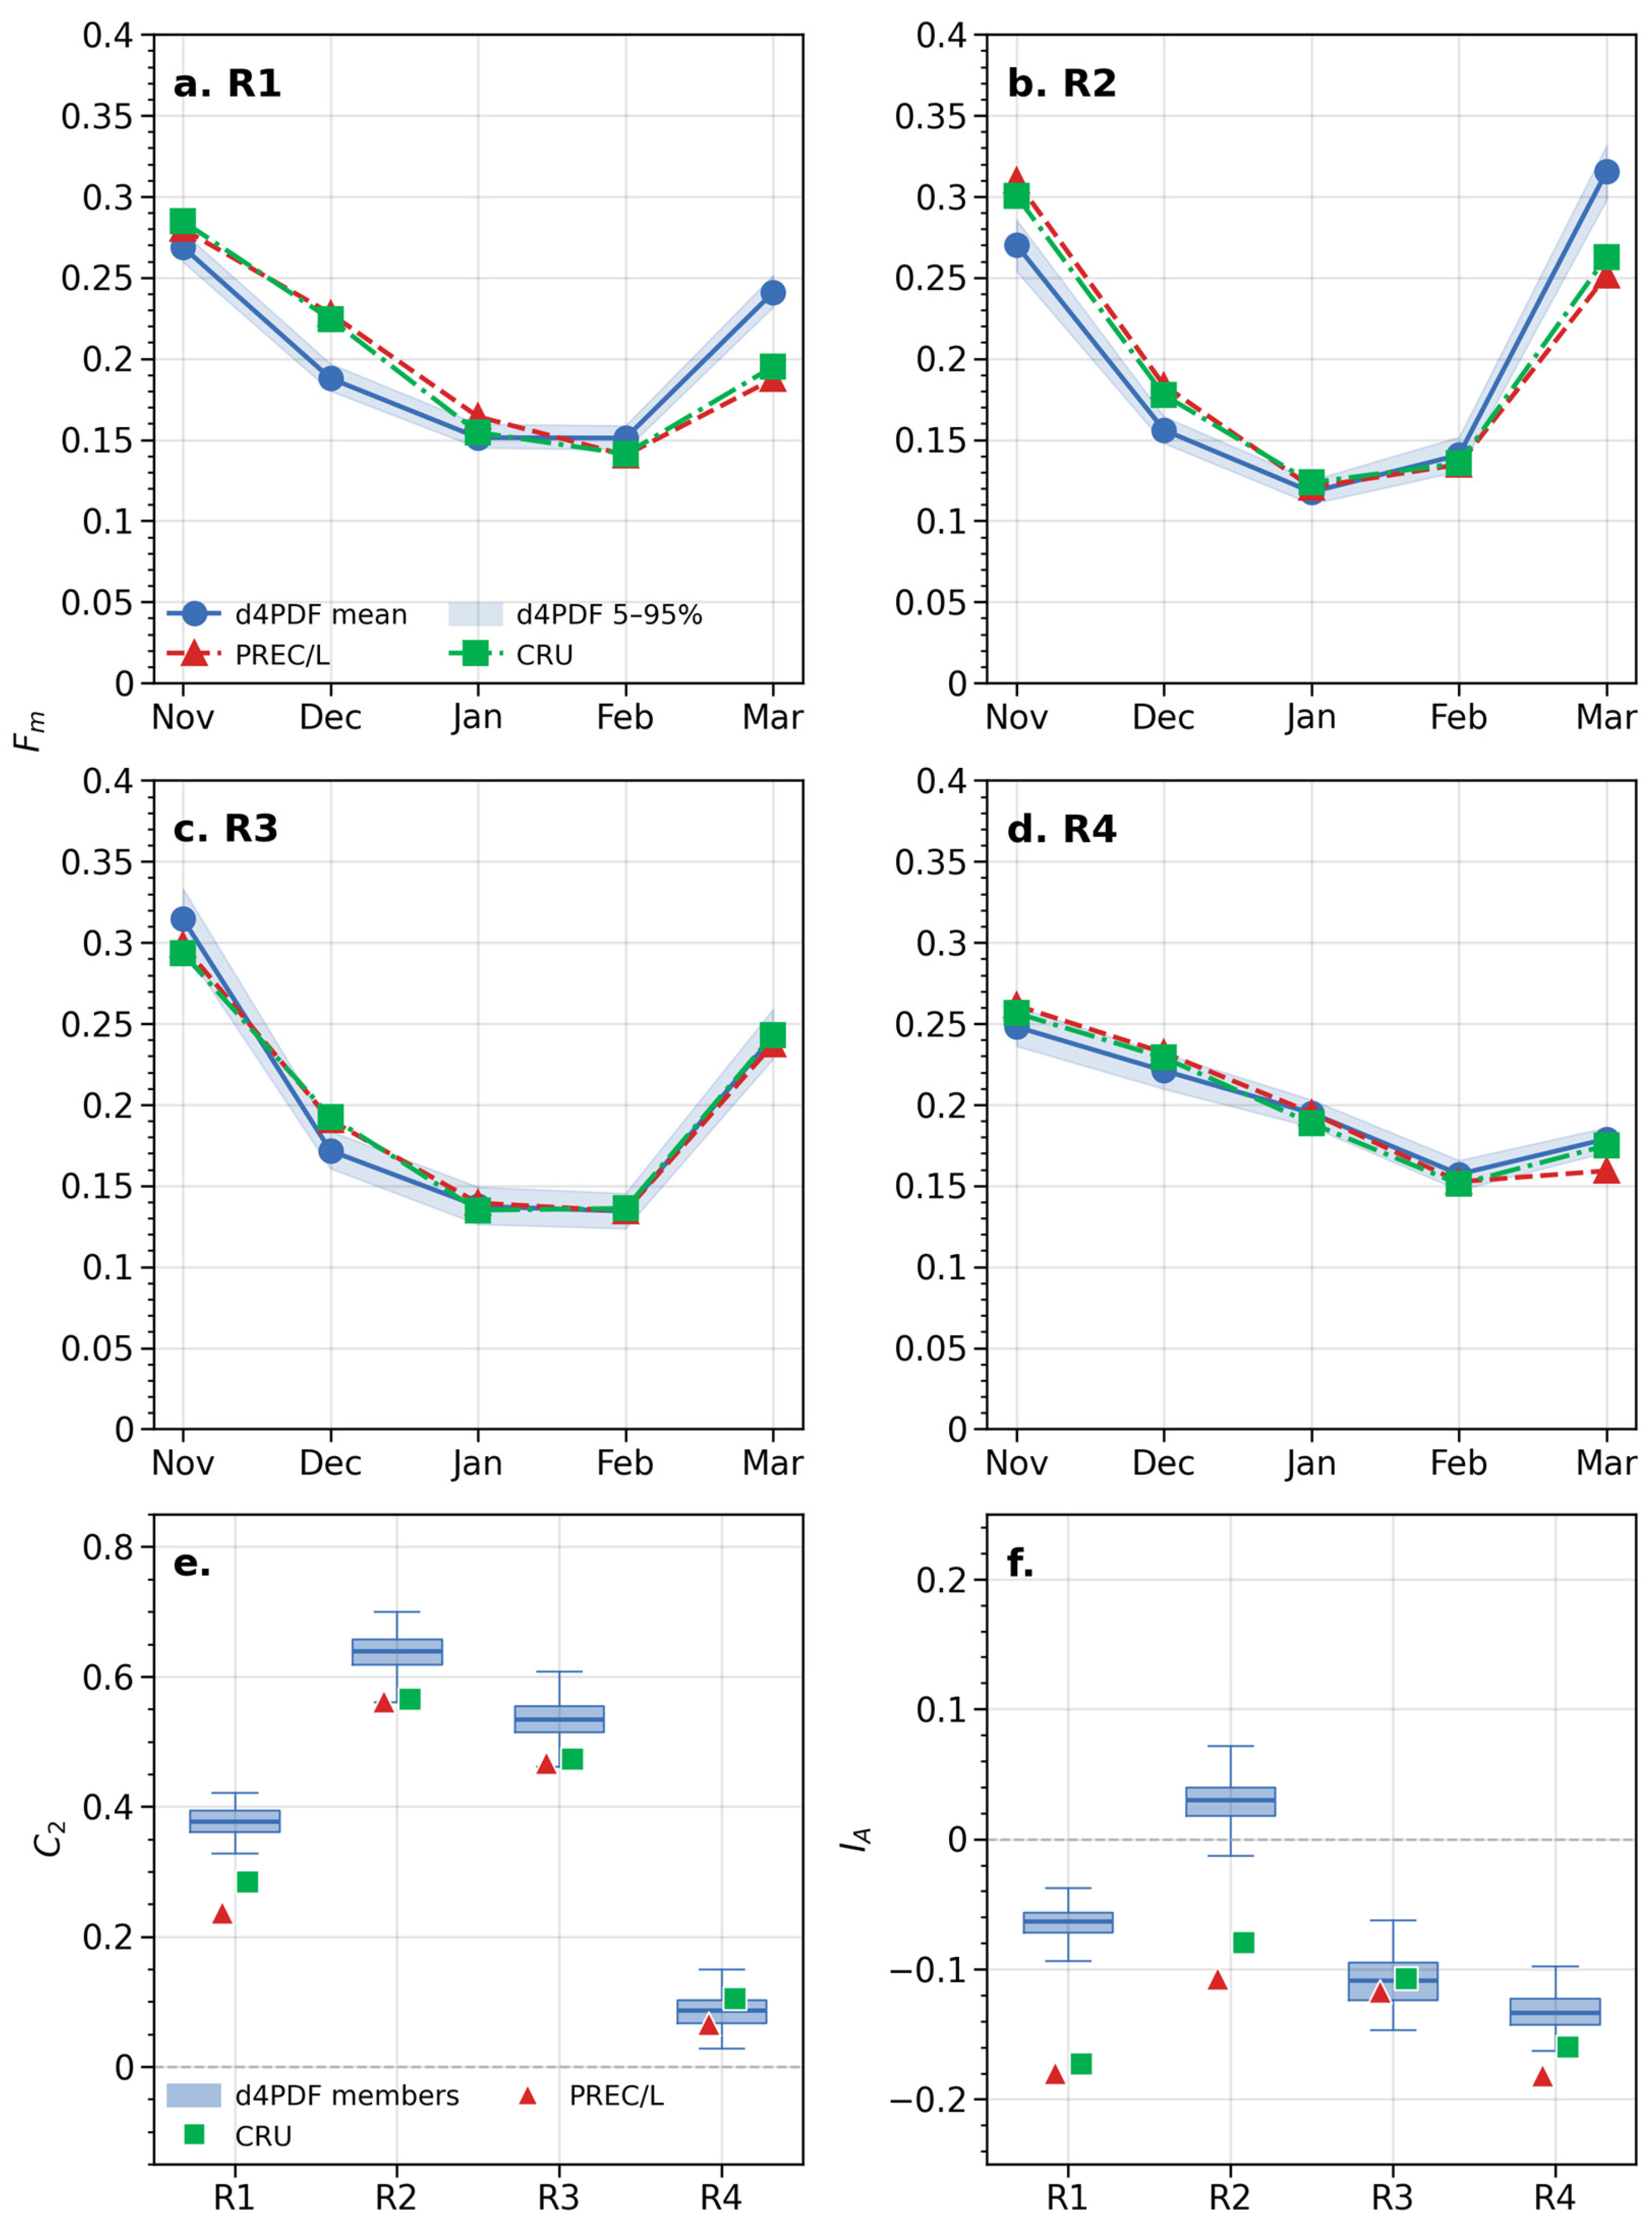
Figure 3 shows the observed and simulated month-to-month evolution of winter precipitation in the four subregions. All four regions exhibit a broadly U-shaped evolution, with lower precipitation in midwinter and higher precipitation in early and late winter. However, the detailed evolution differs among regions. R2 shows the clearest U-shaped pattern, with the minimum precipitation fraction in January, whereas R3 has comparable fractions in January and February. The minimum occurs in February in R1 and R4. In all four regions, precipitation is lower in late winter (February–March) than in early winter (November–December), indicating a general early-winter preference.
Figure 3.
Characteristics of the month-to-month evolution of winter precipitation in the four subregions. (a–d) Monthly precipitation fraction (Fm; %) for R1–R4, respectively. Red and green dashed lines indicate estimates from PREC/L and CRU-TS, respectively. Blue lines show the d4PDF Hist ensemble mean, with light blue shading indicating the 5th–95th percentile range across members. (e) Seasonal curvature index (C2) for R1–R4. (f) As in (e), but for the seasonal asymmetry index (IA).
The model reproduces the monthly precipitation fractions () well in R3 and R4, whereas noticeable biases occur in R1 and R2. For the seasonal curvature index (), the observations fall outside the model ensemble spread in R1 but within the spread in R2–R4. For the seasonal asymmetry index (), the model performs well in R3 and R4, whereas the observations fall outside the ensemble spread in R1 and R2. Historical biases in the month-to-month precipitation distribution over R1 and R2 cause the observed and values to fall outside the 5th–95th percentile ensemble ranges. Nevertheless, a bias-correction sensitivity test produces only minor changes in the projected and over both regions (details are provided in the Section 4 Discussion and Supplementary Information).
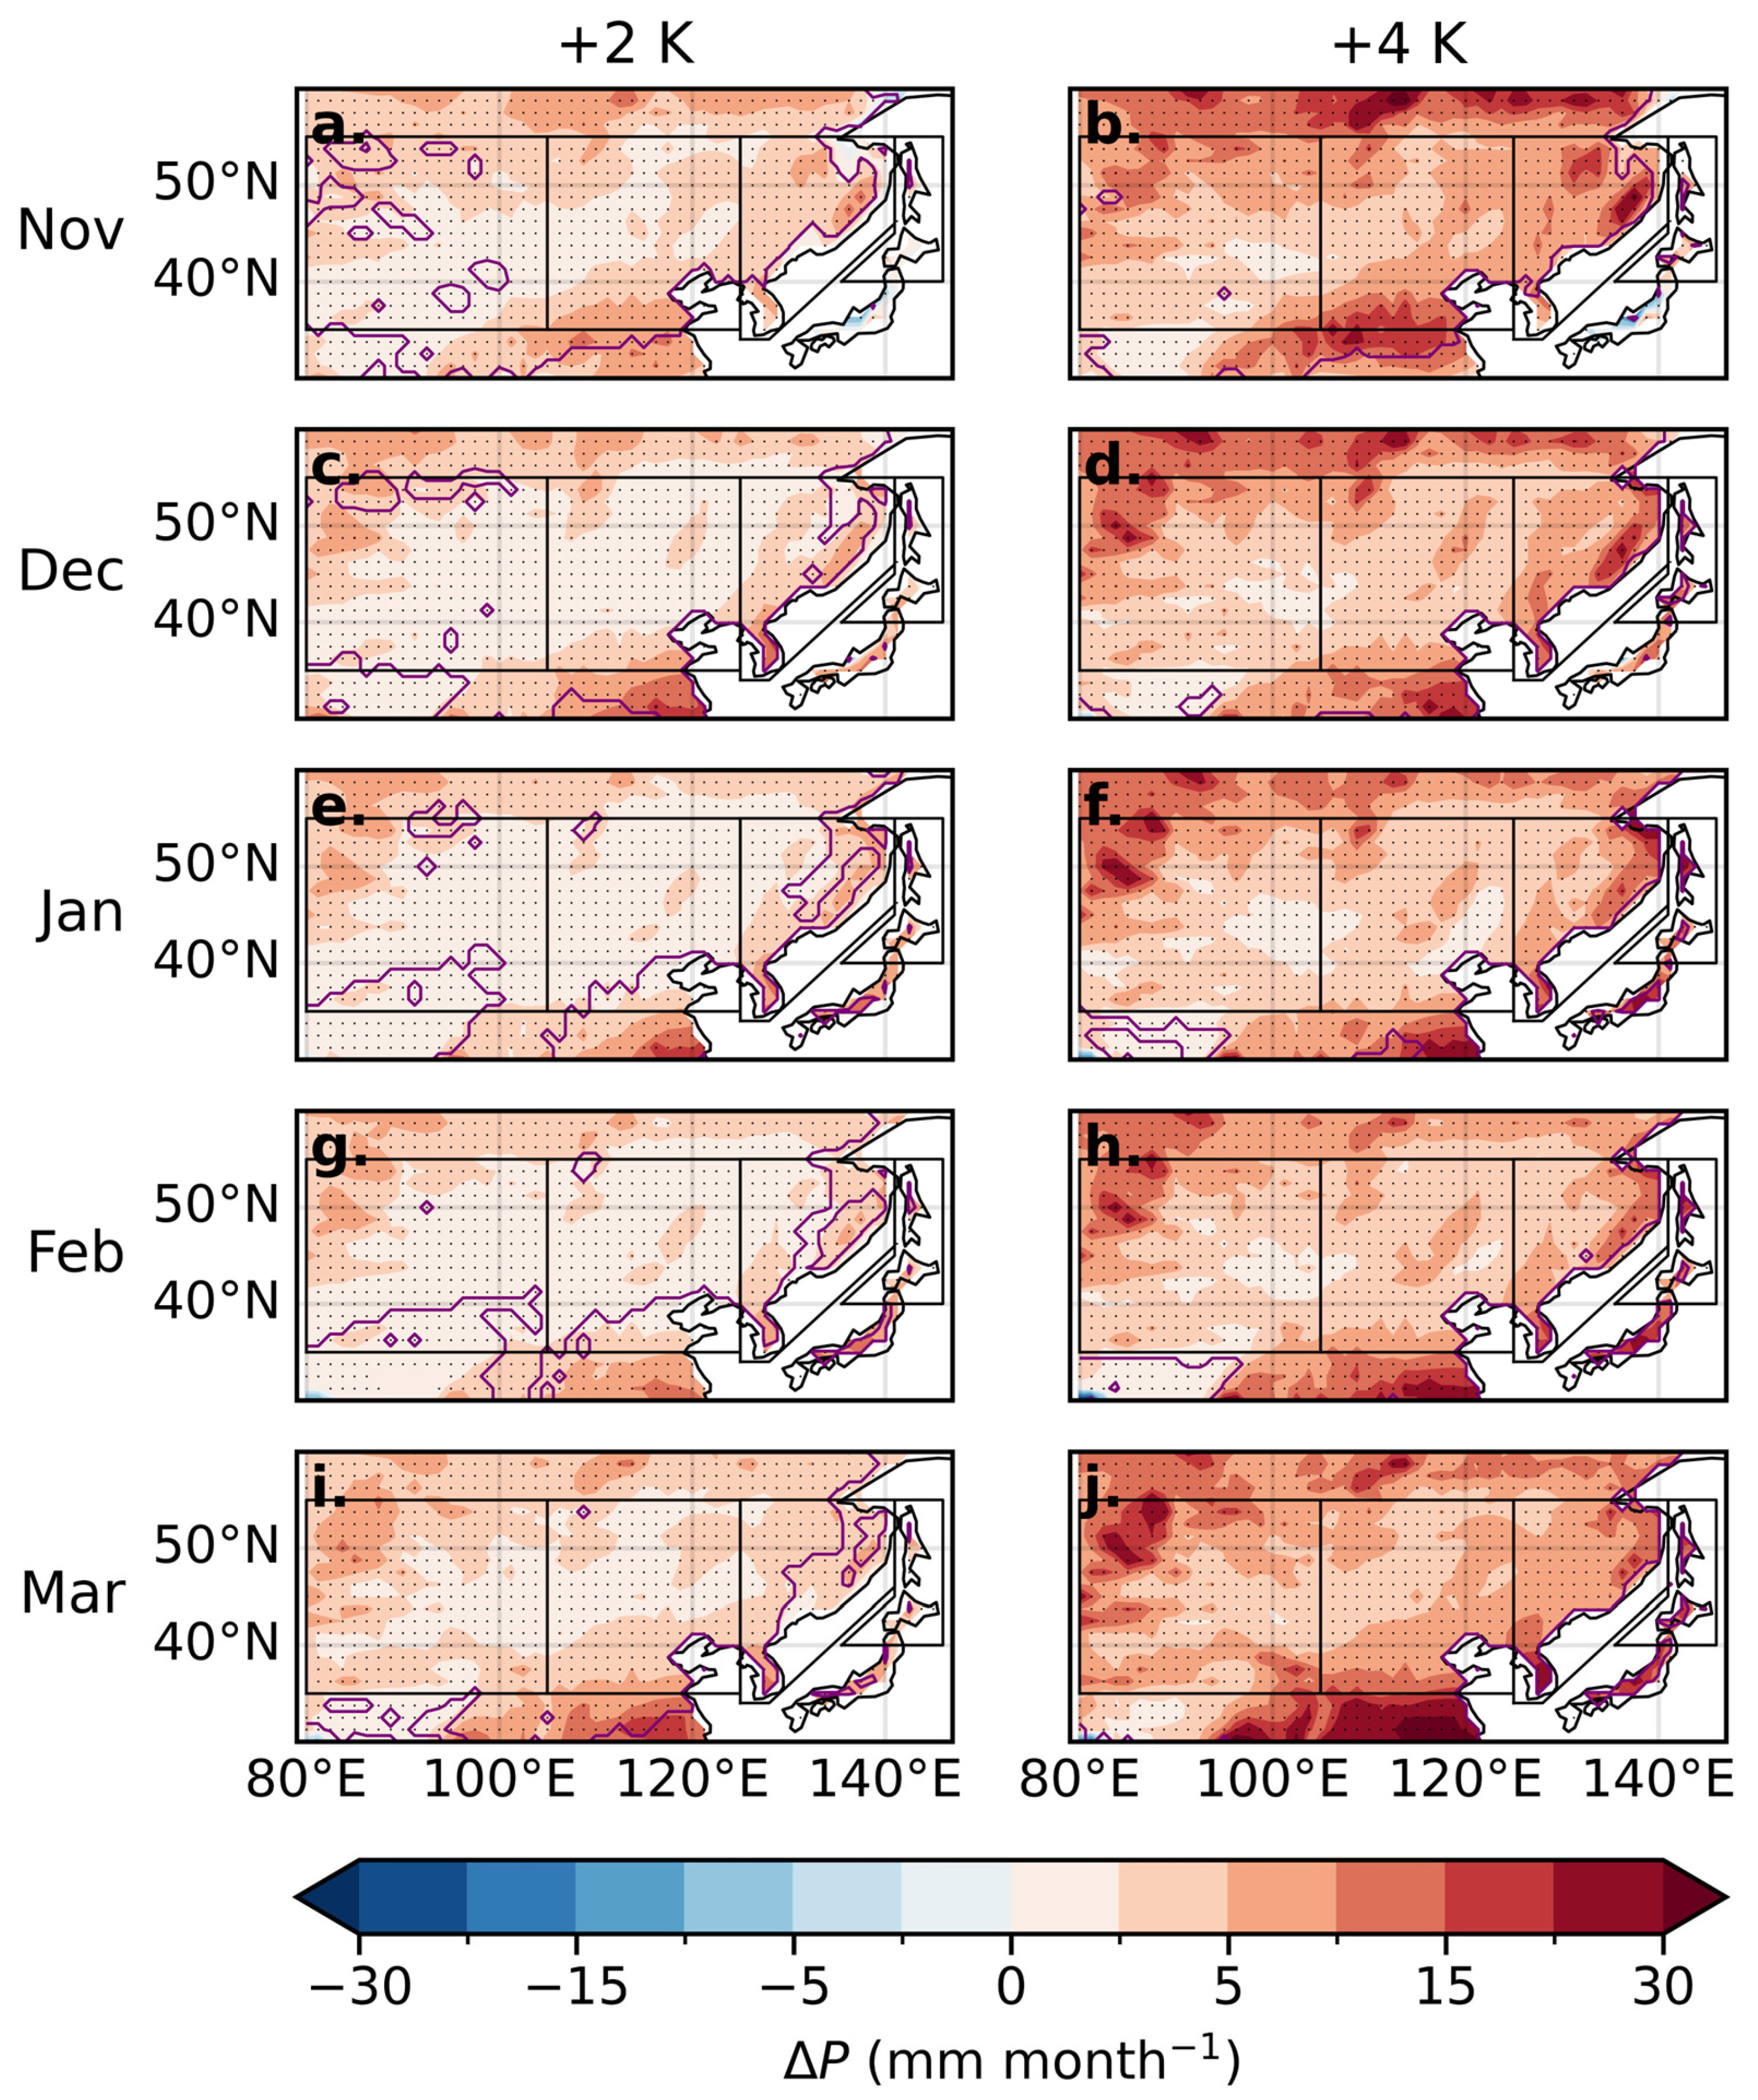
Despite these biases, d4PDF generally captures the overall spatial distribution and month-to-month evolution of winter precipitation in Northeastern Asia (Figure 3a–d). We therefore use the +2 K and +4 K experiments to investigate projected changes in winter precipitation under global warming (Figure 4), while keeping in mind the potential influence of biases in the historical simulations.
Figure 4.
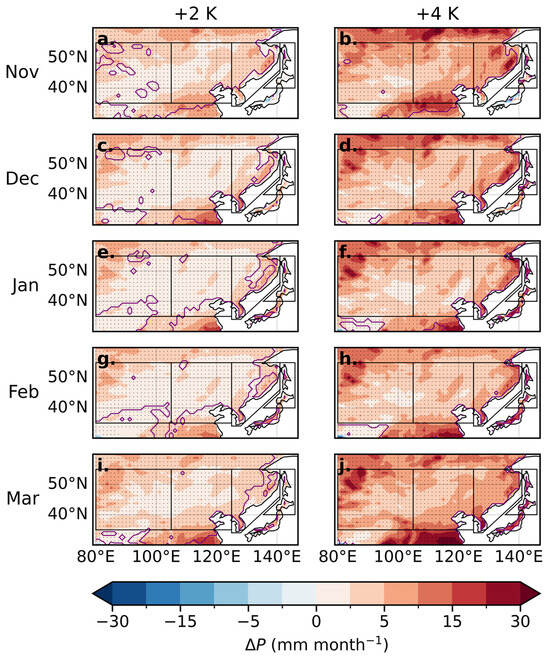
Projected changes in winter precipitation (shading; mm month−1) under +2 K and +4 K global warming. (a) Spatial distribution of November precipitation changes between the +2 K and Hist ensemble means (+2 K minus Hist). Gray stippling indicates changes that are statistically significant at the 95% confidence level (p < 0.05), and purple contours indicate agreement among the six SST warming patterns on the sign of the change. (b) As in (a), but for +4 K minus Hist. (c–j) As in (a,b), but for December–March, respectively.
3.2. Projected Changes in the Month-to-Month Evolution Under Global Warming
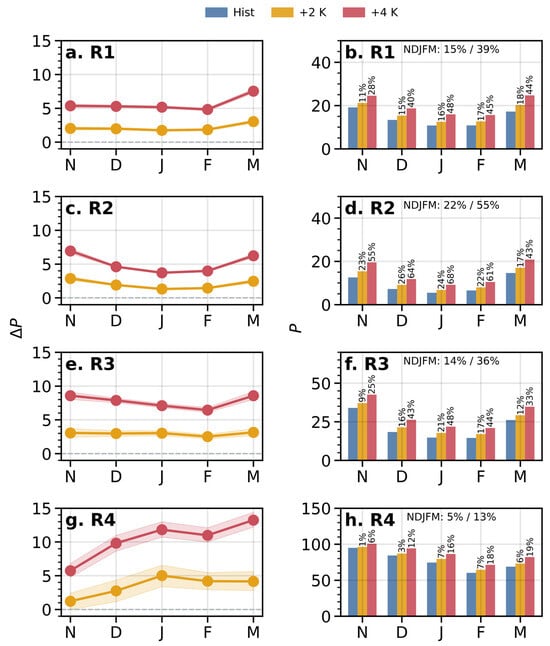
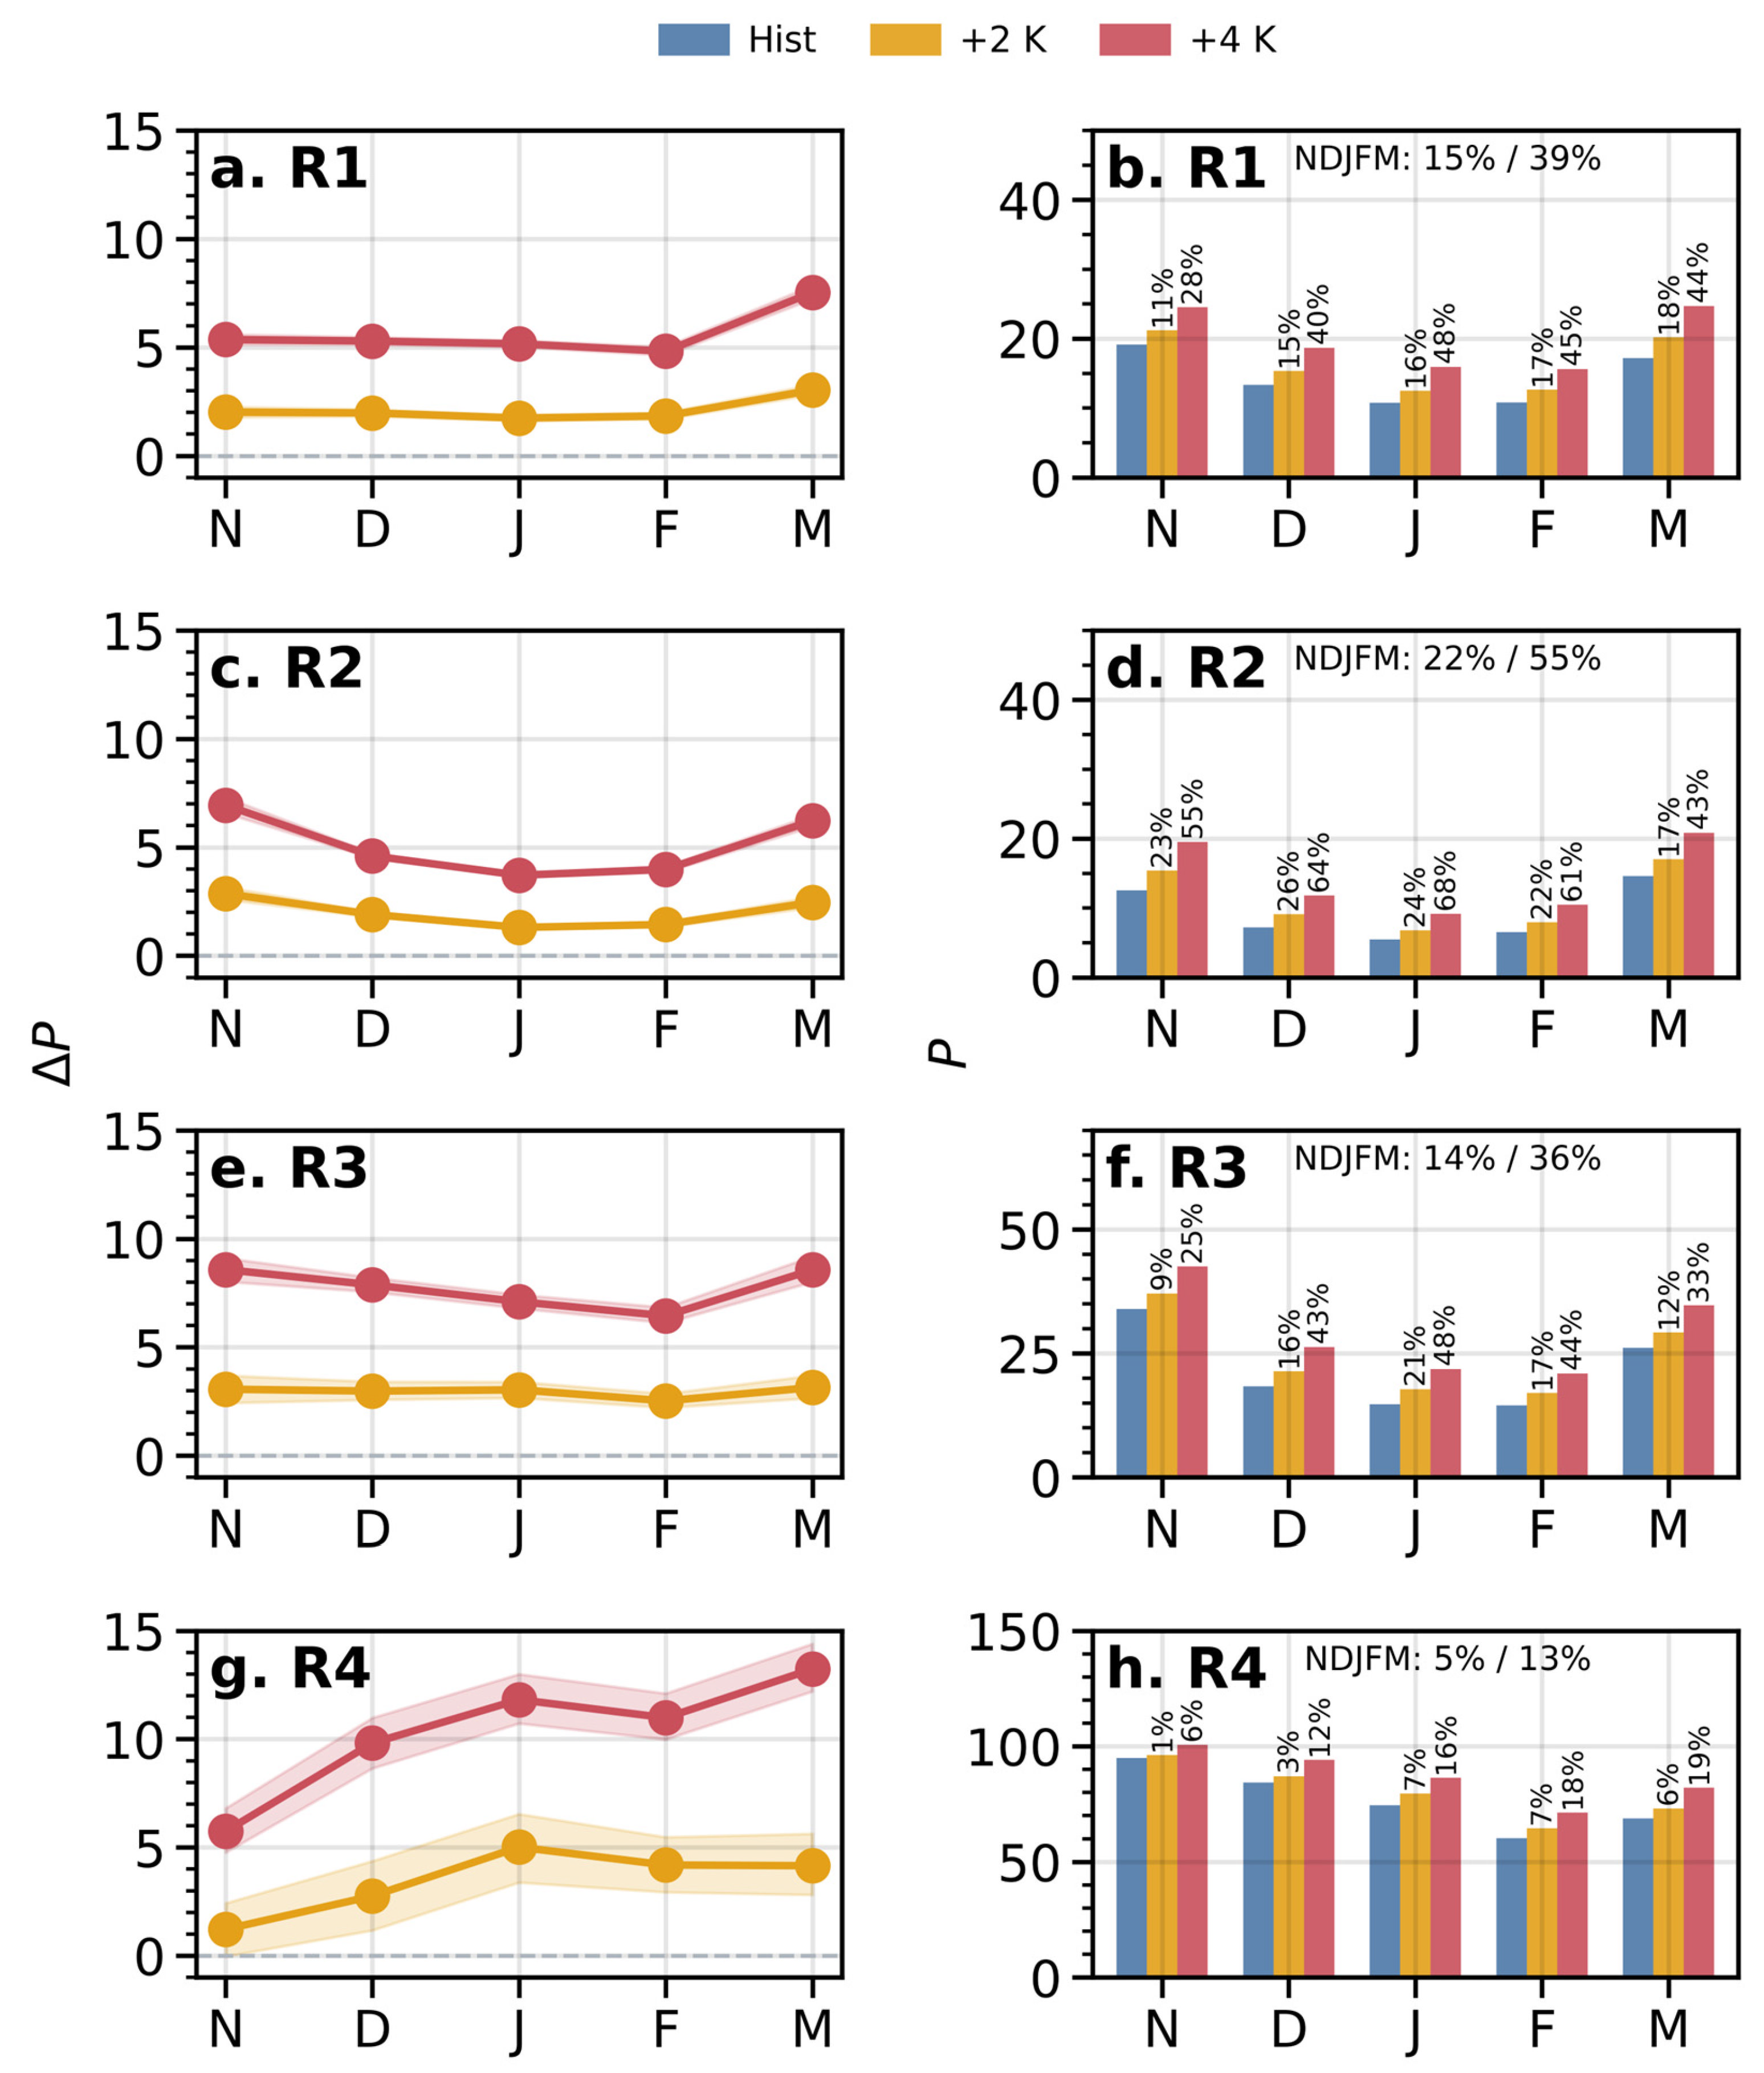
Figure 4, Figure 5 and Figure 6 show the projected changes in winter precipitation over Northeastern Asia, with Figure 4 focusing on the spatial distribution and Figure 5 on the month-to-month evolution in the four subregions. As shown in Figure 5, winter precipitation generally increases under both +2 K and +4 K warming, consistent with previous studies. The increase is spatially heterogeneous, with larger absolute increases in climatologically wet regions and smaller increases in dry regions.
Figure 5.
(a) Projected changes in R1-averaged monthly precipitation (+2 K/+4 K minus Hist) from November to March. (b) As in (a), but expressed as percentage changes relative to Hist, i.e., (+2 K/+4 K − Hist)/Hist × 100%. (c–h) As in (a,b), but for R2–R4, respectively. Shading colors in (a,c,e,g) indicate the 5th–95th percentile range across members.
Figure 6.
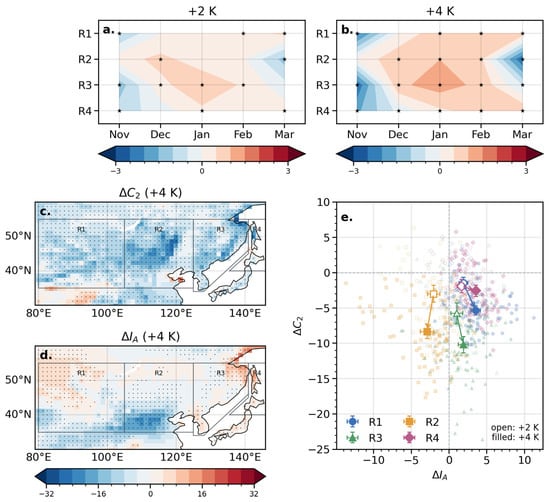
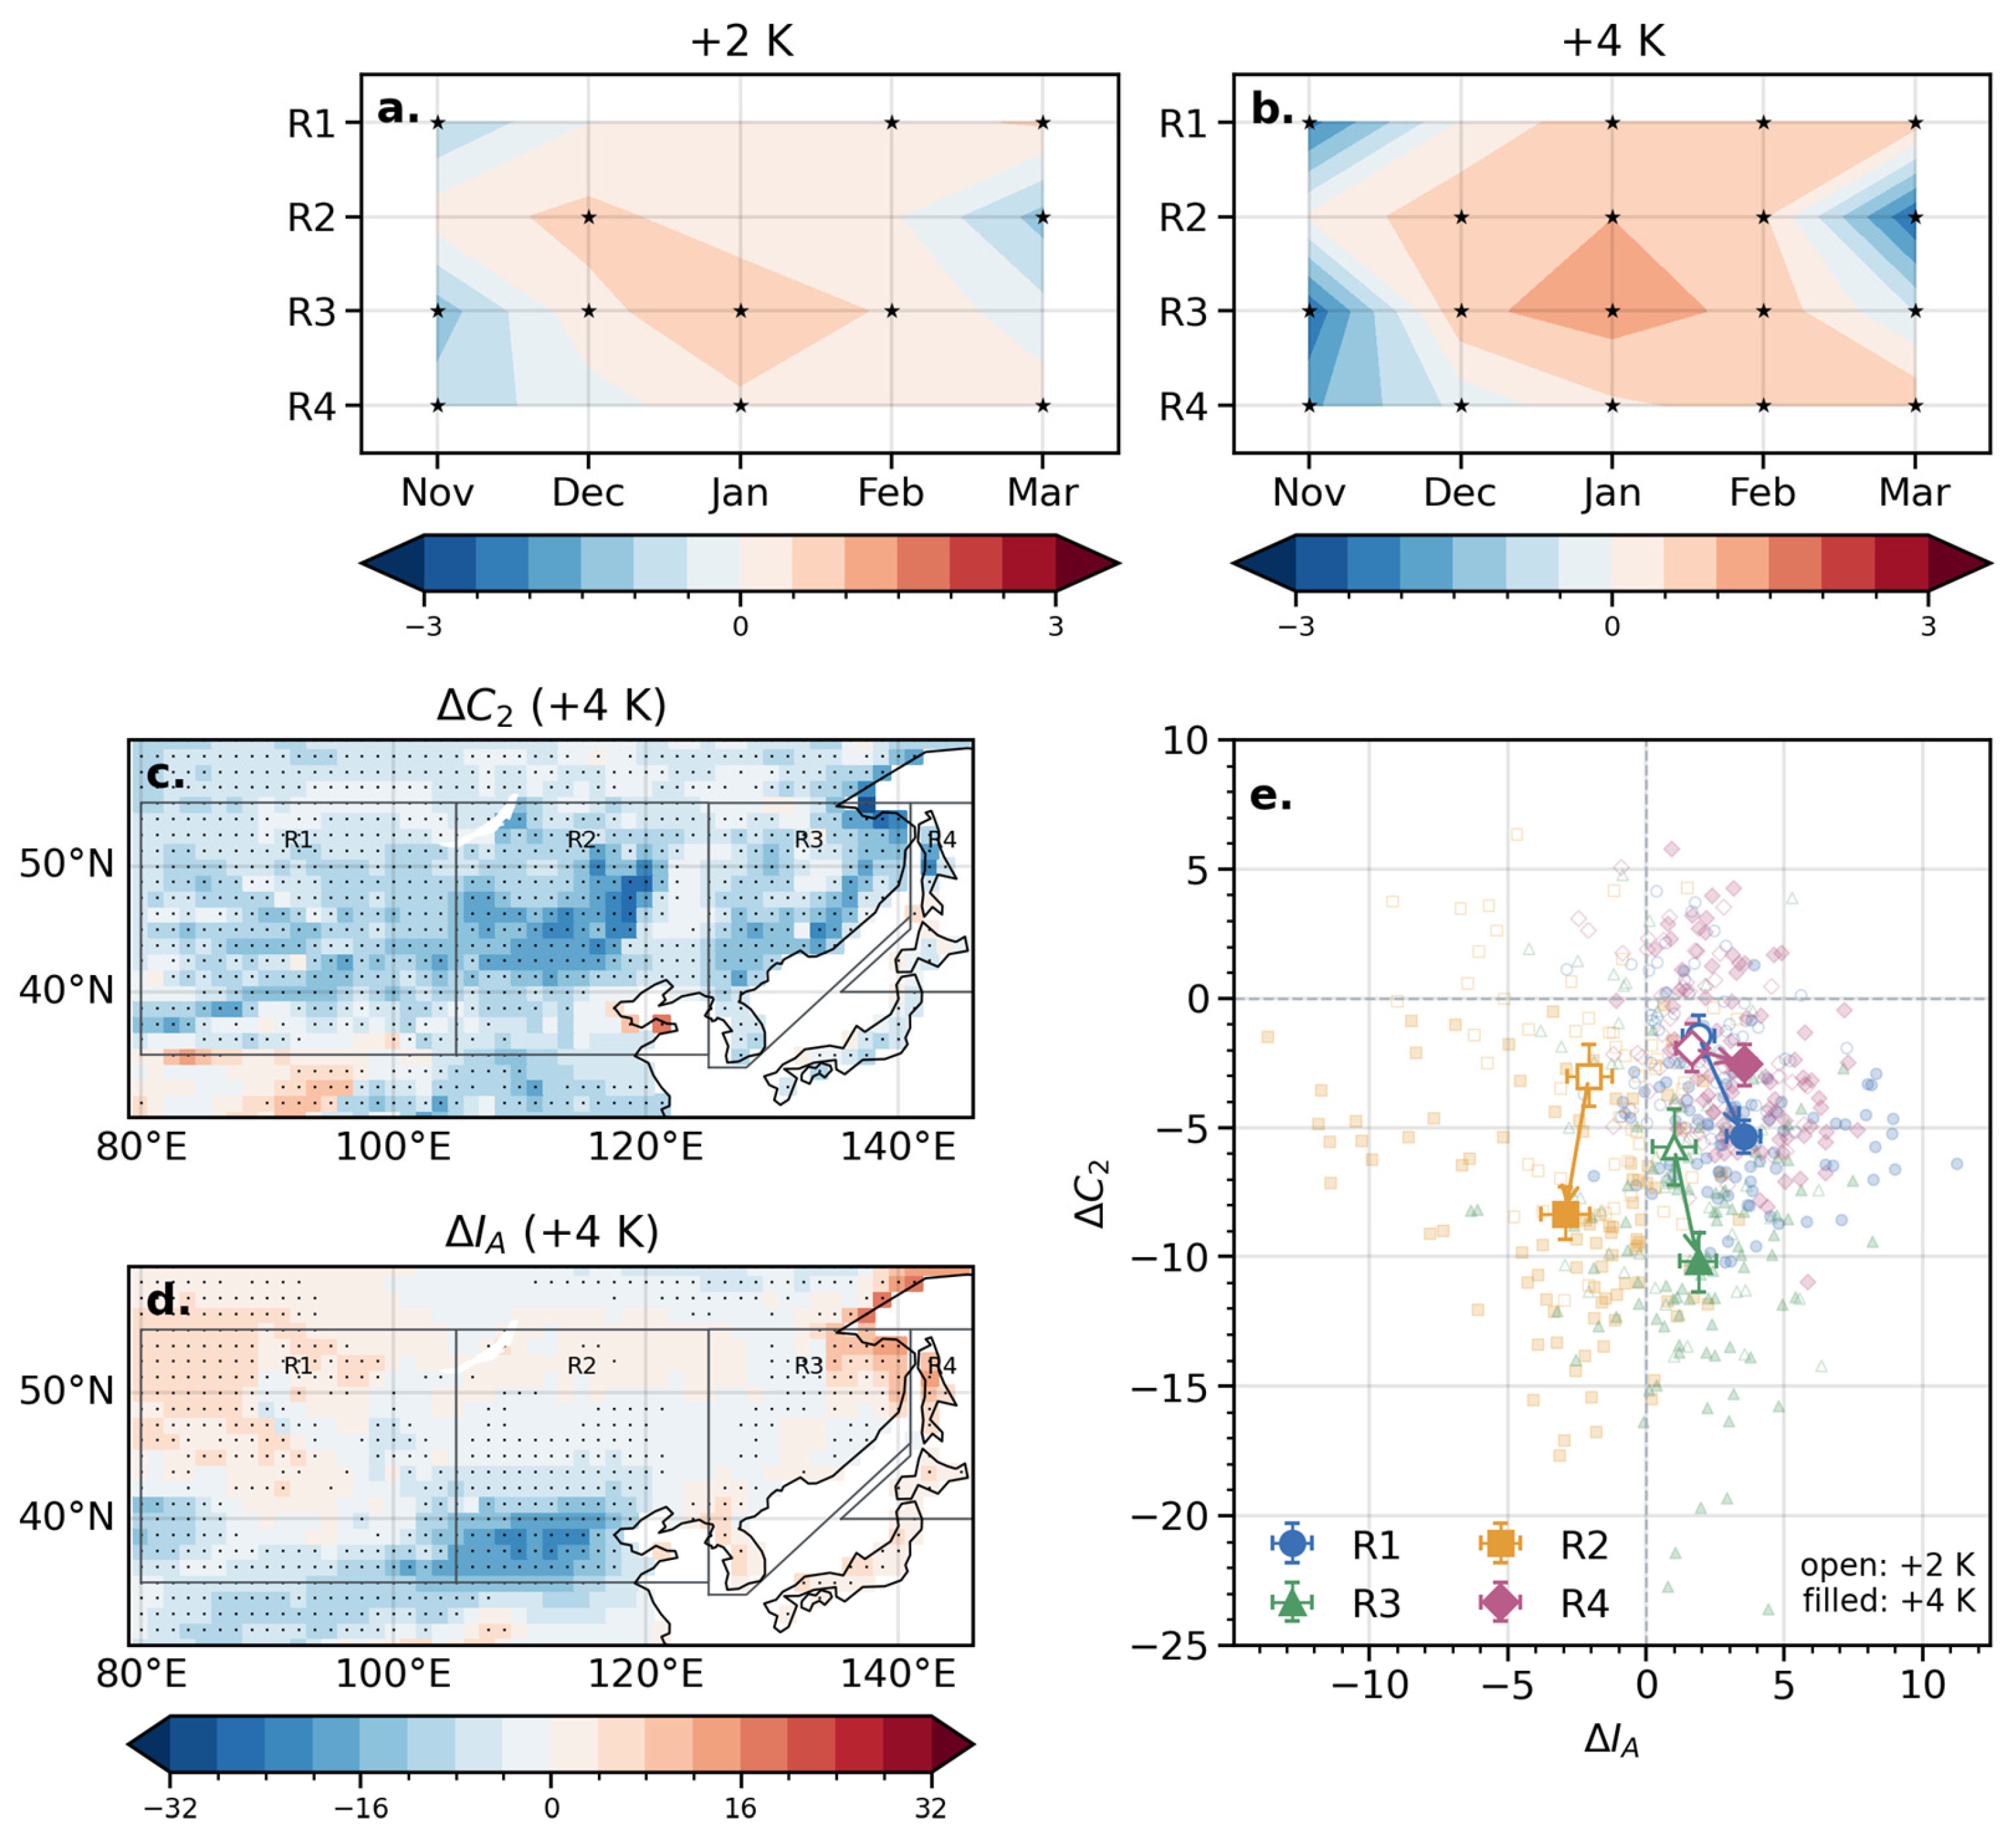
Projected changes in the month-to-month evolution of winter precipitation in the four subregions. (a) Heatmap of changes in the monthly precipitation fraction (Fm) under +2 K warming. (b) As in (a), but for +4 K warming. Star markers indicate agreement among the six SST warming patterns on the sign of the change. (c) Changes in the seasonal curvature index () under +4 K warming. (d) Changes in the seasonal asymmetry index () under +4 K warming. (e) Combined changes in and for the four subregions. Note that the Fm, , and are dimensionless, and their values are scaled/multiplied by 100 in (a–e).
Although the absolute increases are relatively small in the dry regions R1 and R2, their percentage increases relative to Hist are larger. NDJFM total precipitation increases by 15% and 39% in R1 under +2 K and +4 K warming, respectively, and by 22% and 55% in R2. The corresponding increases are 14% and 36% in R3, while R4 shows the smallest relative increases, at 5% and 13%, respectively.
Figure 5 shows the absolute and relative changes in monthly precipitation across the four subregions. A notable feature in R1–R3 is that the largest relative increase occurs in midwinter, particularly in January (Figure 5b,d,f). For example, in R2, January precipitation increases by 24% and 68% under +2 K and +4 K warming, respectively, compared with 23% and 55% in early winter (November–December) and 17% and 43% in late winter (February–March). The enhanced midwinter precipitation may have important implications for snowfall and freezing-rain hazards and warrants further investigation.
R4 shows a different month-to-month response, with relatively larger increases in late winter (Figure 5h). For example, March precipitation increases by 6% and 19% under +2 K and +4 K warming, respectively, whereas November precipitation increases by only 1% and 6%.
Figure 6 further shows the projected changes in the indices describing the month-to-month evolution of winter precipitation. Figure 6a,b illustrate changes in the monthly precipitation fraction (Fm). In R1, the precipitation fraction shifts toward late winter under warming. R2 shows increased contributions from early to midwinter and decreased contributions from late winter. In R3, the midwinter contribution increases at the expense of both early- and late-winter precipitation. In contrast, R4 shows a clear shift from early to late winter, with a decreased contribution in early winter and an increased contribution in late winter.
Figure 6c shows the spatial distribution of changes in the curvature index (). A decrease in indicates a weaker U-shaped evolution, with a reduced contrast between midwinter and the beginning and end of winter. The results show that decreases over most of Northeastern Asia, indicating a general weakening of the U-shaped evolution of winter precipitation.
Figure 6d shows changes in the asymmetry index (). A negative change indicates a shift in precipitation toward early winter, whereas a positive change indicates a shift toward late winter. An early-winter shift is projected mainly over the southern part of the study domain, whereas R4, northern R3, and the Korean Peninsula generally show a late-winter shift. Overall, changes in seasonal asymmetry exhibit pronounced spatial heterogeneity across Northeastern Asia. Figure 6e presents the combined changes in and from +2 K to +4 K. Most simulations project a weakening of the U-shaped evolution across all four subregions, with area-mean precipitation shifting toward early winter in R2 and toward late winter in the other three regions.
3.3. Understanding Forms the Atmospheric Moisture Budget
To understand the possible mechanisms underlying the observed month-to-month evolution and its projected changes, we next examine the atmospheric moisture budget.
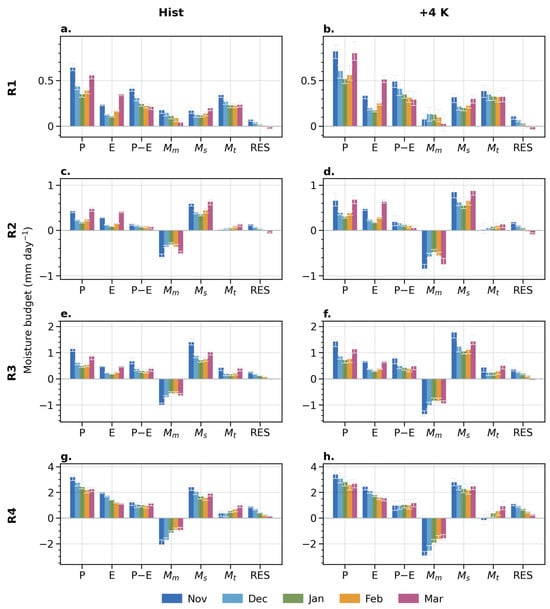
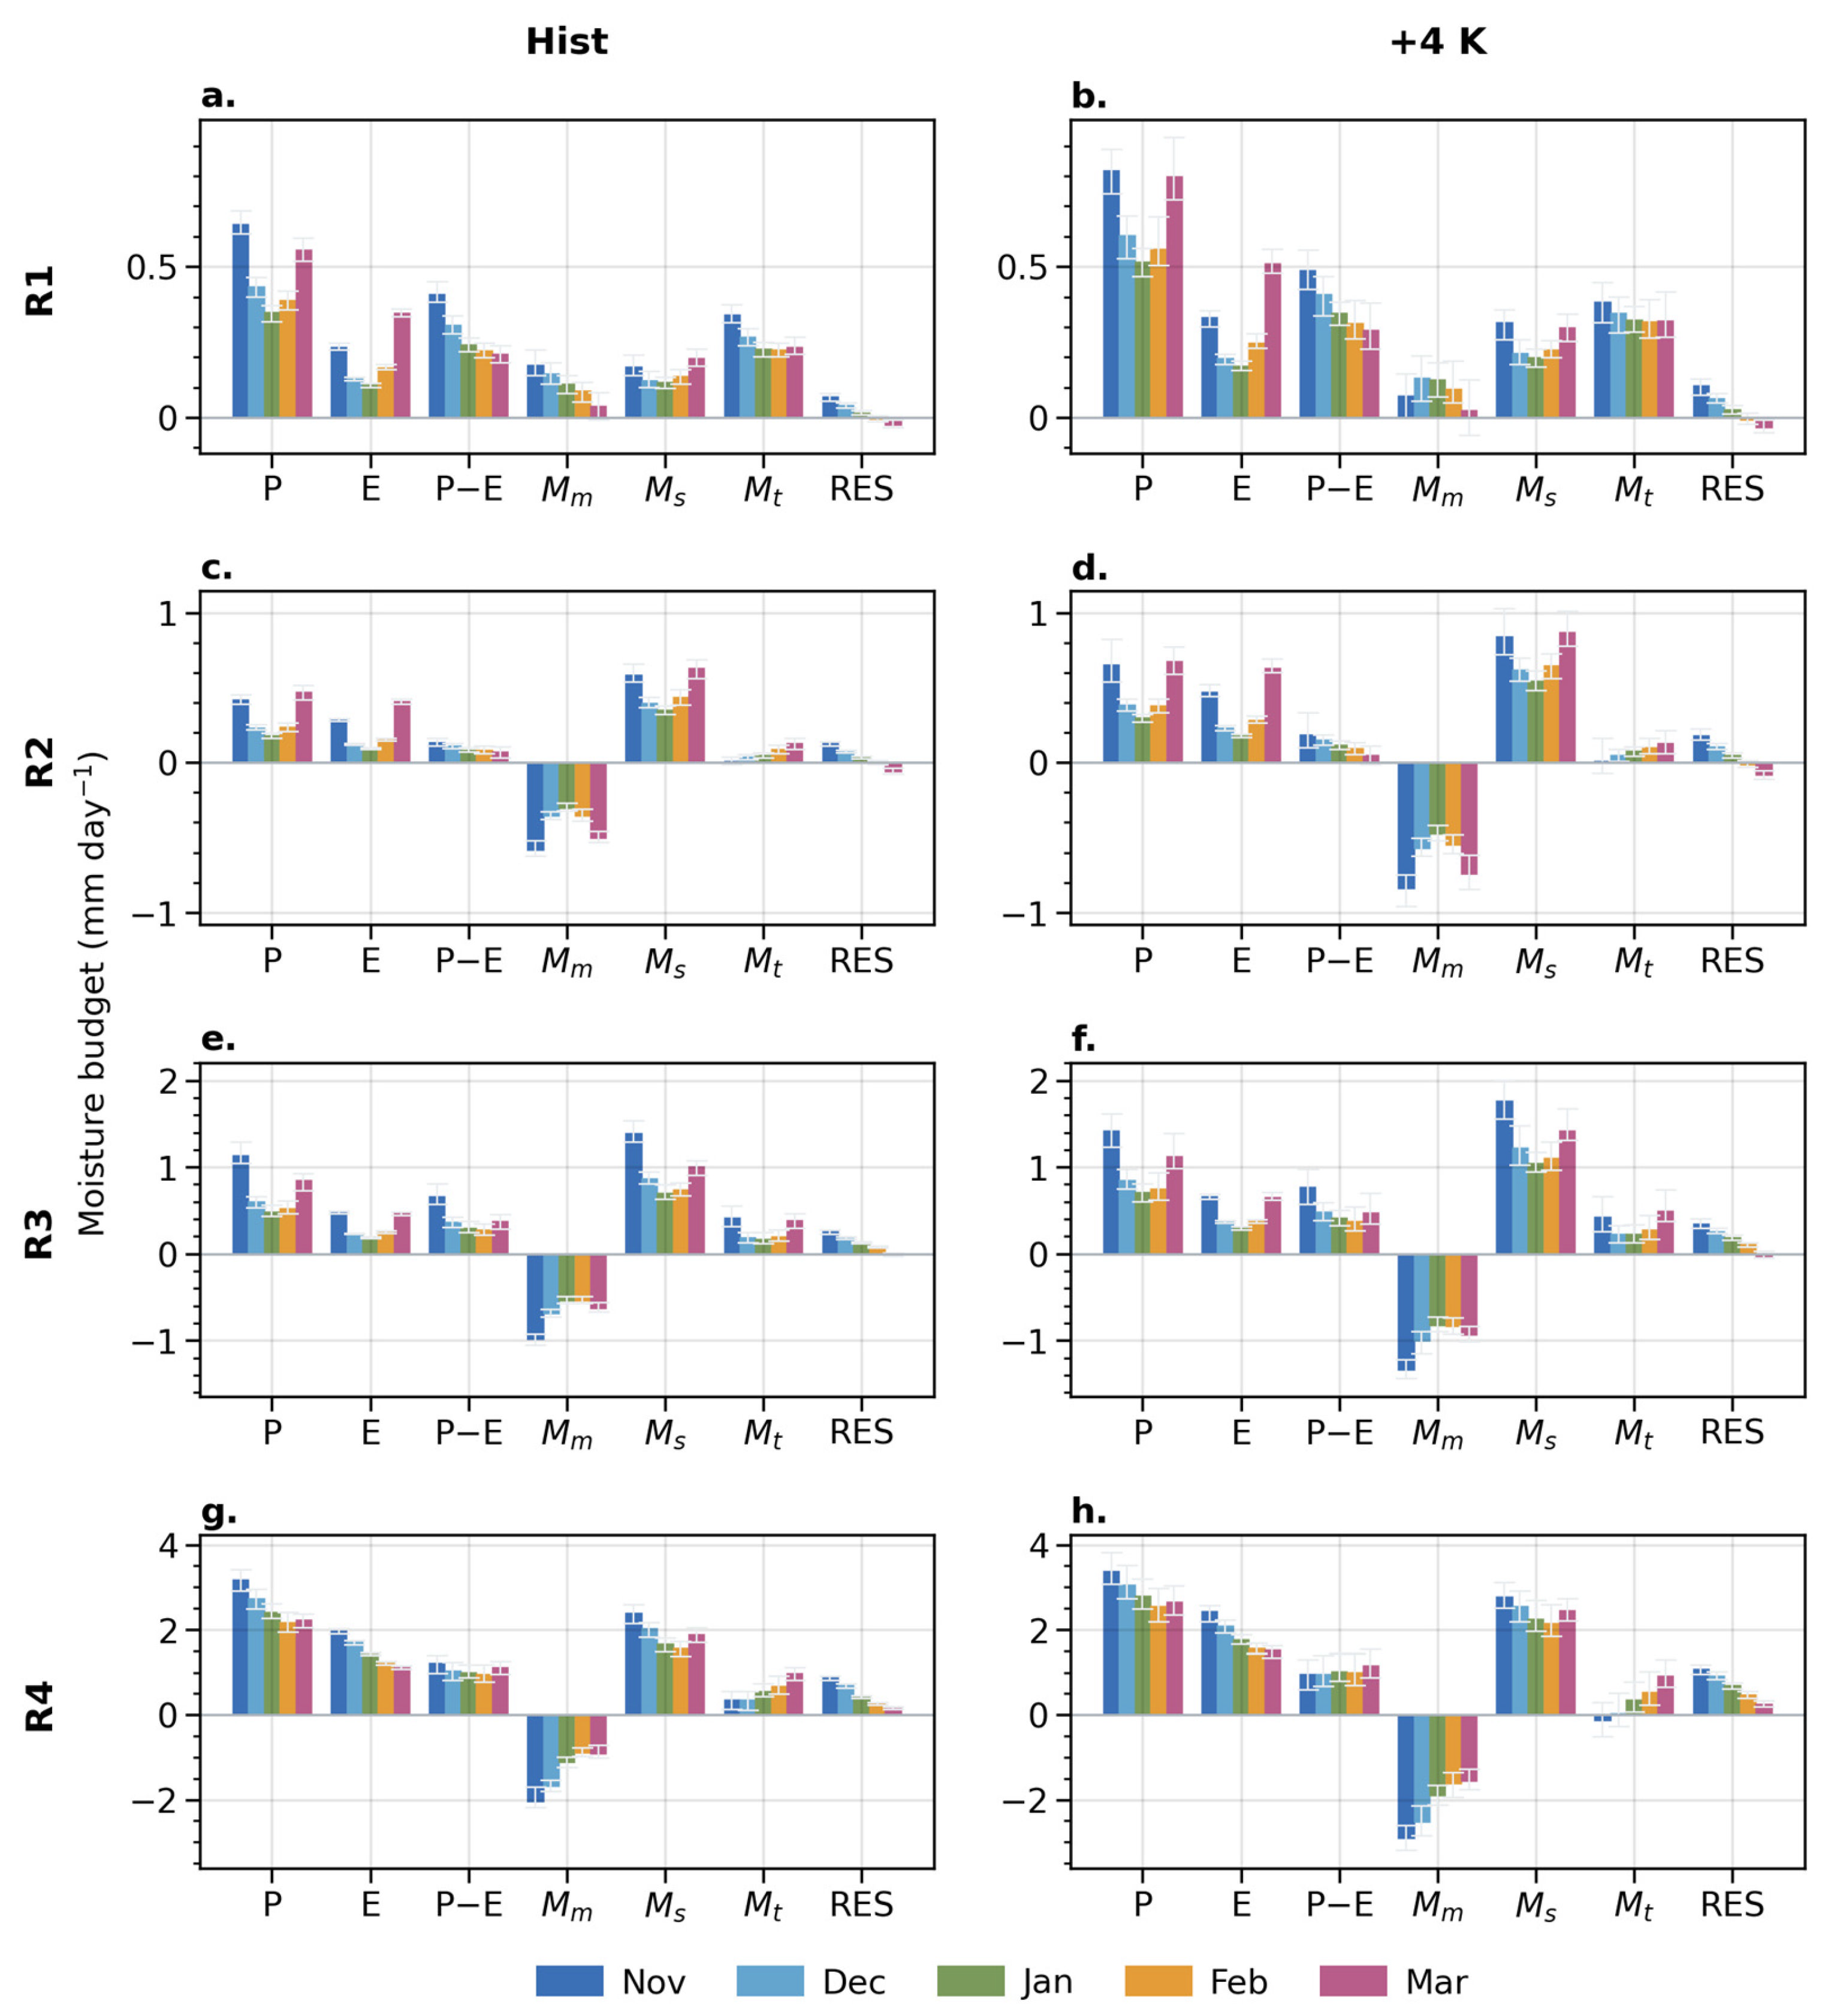
Figure 7 shows the November–March climatology of each atmospheric moisture budget term in the Hist and +4 K experiments. All four subregions are characterized by positive net precipitation (). In R1, both the monthly and submonthly terms contribute positively to moisture-flux convergence (MFC), indicating contributions from both the monthly mean flow and submonthly moisture transport. Compared with Hist, the +4 K experiment shows enhanced eddy-induced MFC, particularly in late winter.
Figure 7.
Atmospheric moisture budget from November to March. P, E, and P − E denote precipitation, evaporation, and net precipitation, respectively; and denote the monthly and submonthly moisture convergence terms, respectively; and Res denotes the residual term (see Equation (2) for more details). (a) Climatological moisture budget for R1 in the Hist experiment. (b) As in (a), but for the +4 K experiment. Error bars indicate the minimum-to-maximum range across ensemble members. (c–h) As in (a,b), but for R2–R4, respectively.
In R2–R4, the monthly term contributes negatively to MFC, whereas the submonthly term makes a positive contribution. This indicates that submonthly moisture transport play a dominant role in maintaining wintertime moisture convergence over these regions. The relative contributions of the monthly and submonthly terms also vary from November to March, broadly reproducing the month-to-month evolution of winter precipitation across the four subregions.
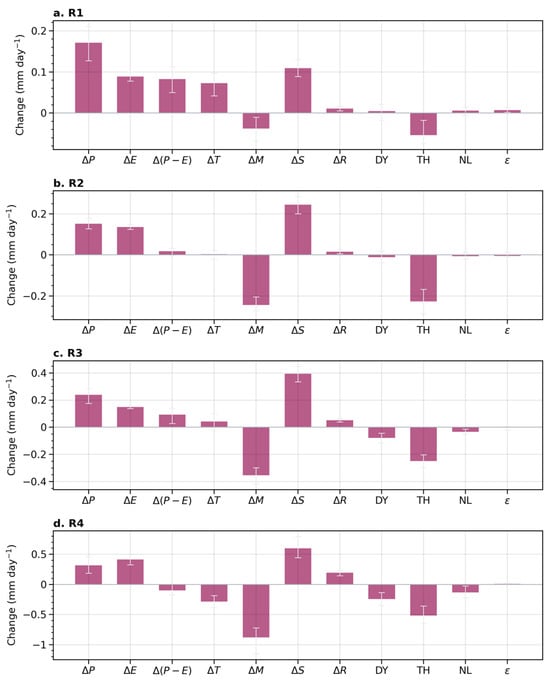
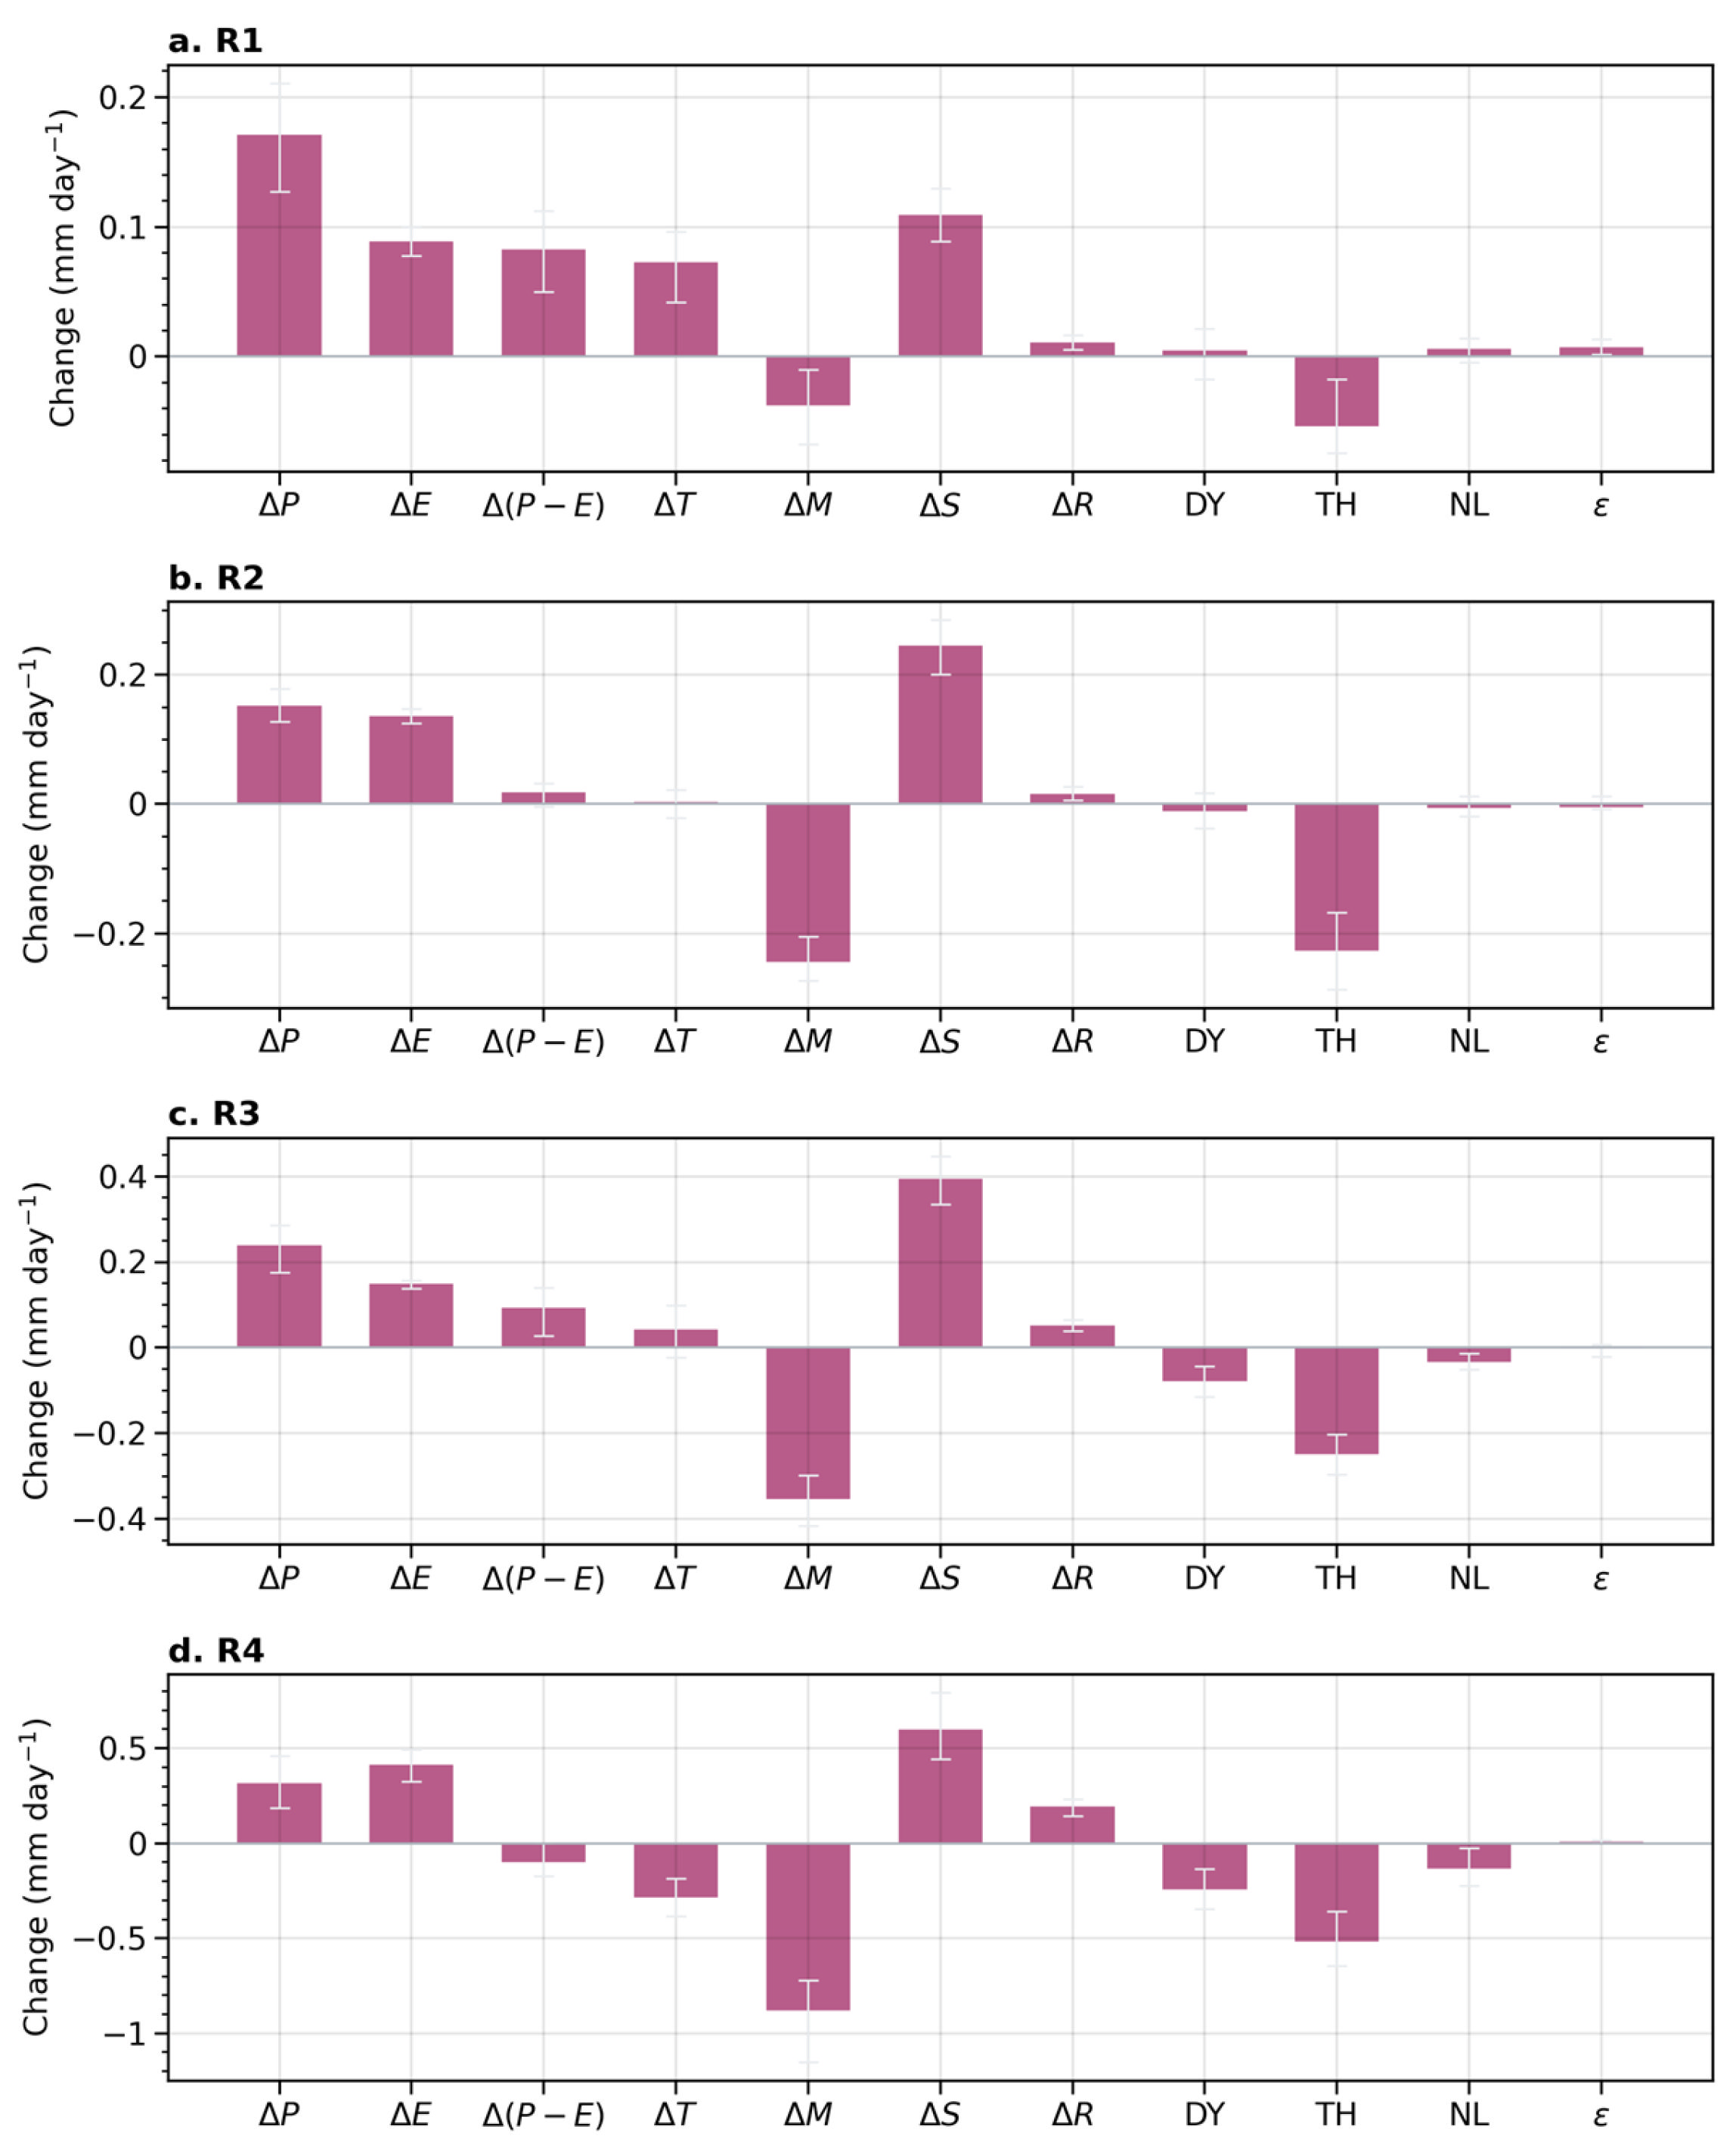
Figure 8 presents the changes in the atmospheric moisture budget between the Hist and +4 K experiments. Here, we focus on the NDJFM mean changes, as the month-to-month variations generally resemble those shown above. Consistent with Figure 4, precipitation increases in all four subregions. However, changes in net precipitation show clear regional differences, with increases over the continental regions (R1–R3) but a decrease over northern Japan (R4).
Figure 8.
Changes in the atmospheric moisture budget under +4 K warming. Here, denotes the difference between +4 K and Hist (+4 K minus Hist). P, E, and P − E denote precipitation, evaporation, and net precipitation, respectively; T, M, S, and R denote the total moisture-flux convergence (MFC), its monthly term, submonthly term, and residual, respectively. DY, TH, and NL denote the dynamical, thermodynamic, and nonlinear components of the monthly term, respectively. is the montly decomposition error, i.e., M − DY − TH − NL. See Equation (4) for details. Error bars indicate the minimum-to-maximum range across ensemble members.
Over R1–R3, the increase in net precipitation is mainly associated with enhanced total MFC, although the increase is relatively small in R2. The change in total MFC results from opposing changes in the monthly and submonthly terms, with the positive submonthly contribution dominating. Further decomposition of the monthly term shows that the thermodynamic component dominates its negative change across R1–R3, while the dynamical component plays a secondary role.
Over R4, precipitation increases under global warming, but evaporation increases more strongly, resulting in a decrease in . Thus, the negative response reflects enhanced local evaporation rather than decreased precipitation. The decrease in net precipitation is associated with opposing effects of the monthly mean flow and submonthly moisture transport, with the monthly term dominating the total MFC change. Both thermodynamic and dynamical components contribute substantially to the monthly term change, with the thermodynamic contribution being larger. Overall, the moisture-budget analysis indicates that projected changes in wintertime MFC result from competing responses of the monthly mean flow and submonthly moisture transport, while thermodynamic effects play a major role in changes associated with the monthly mean circulation.
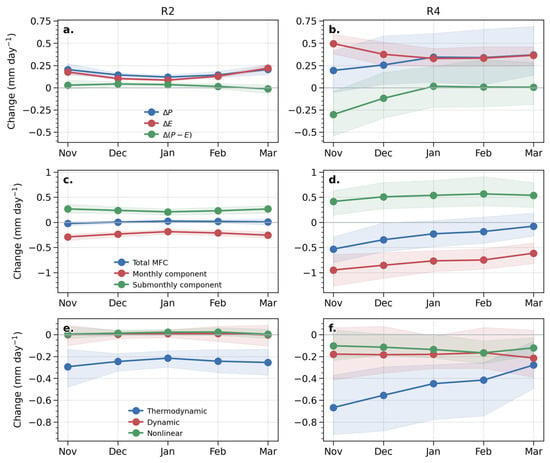
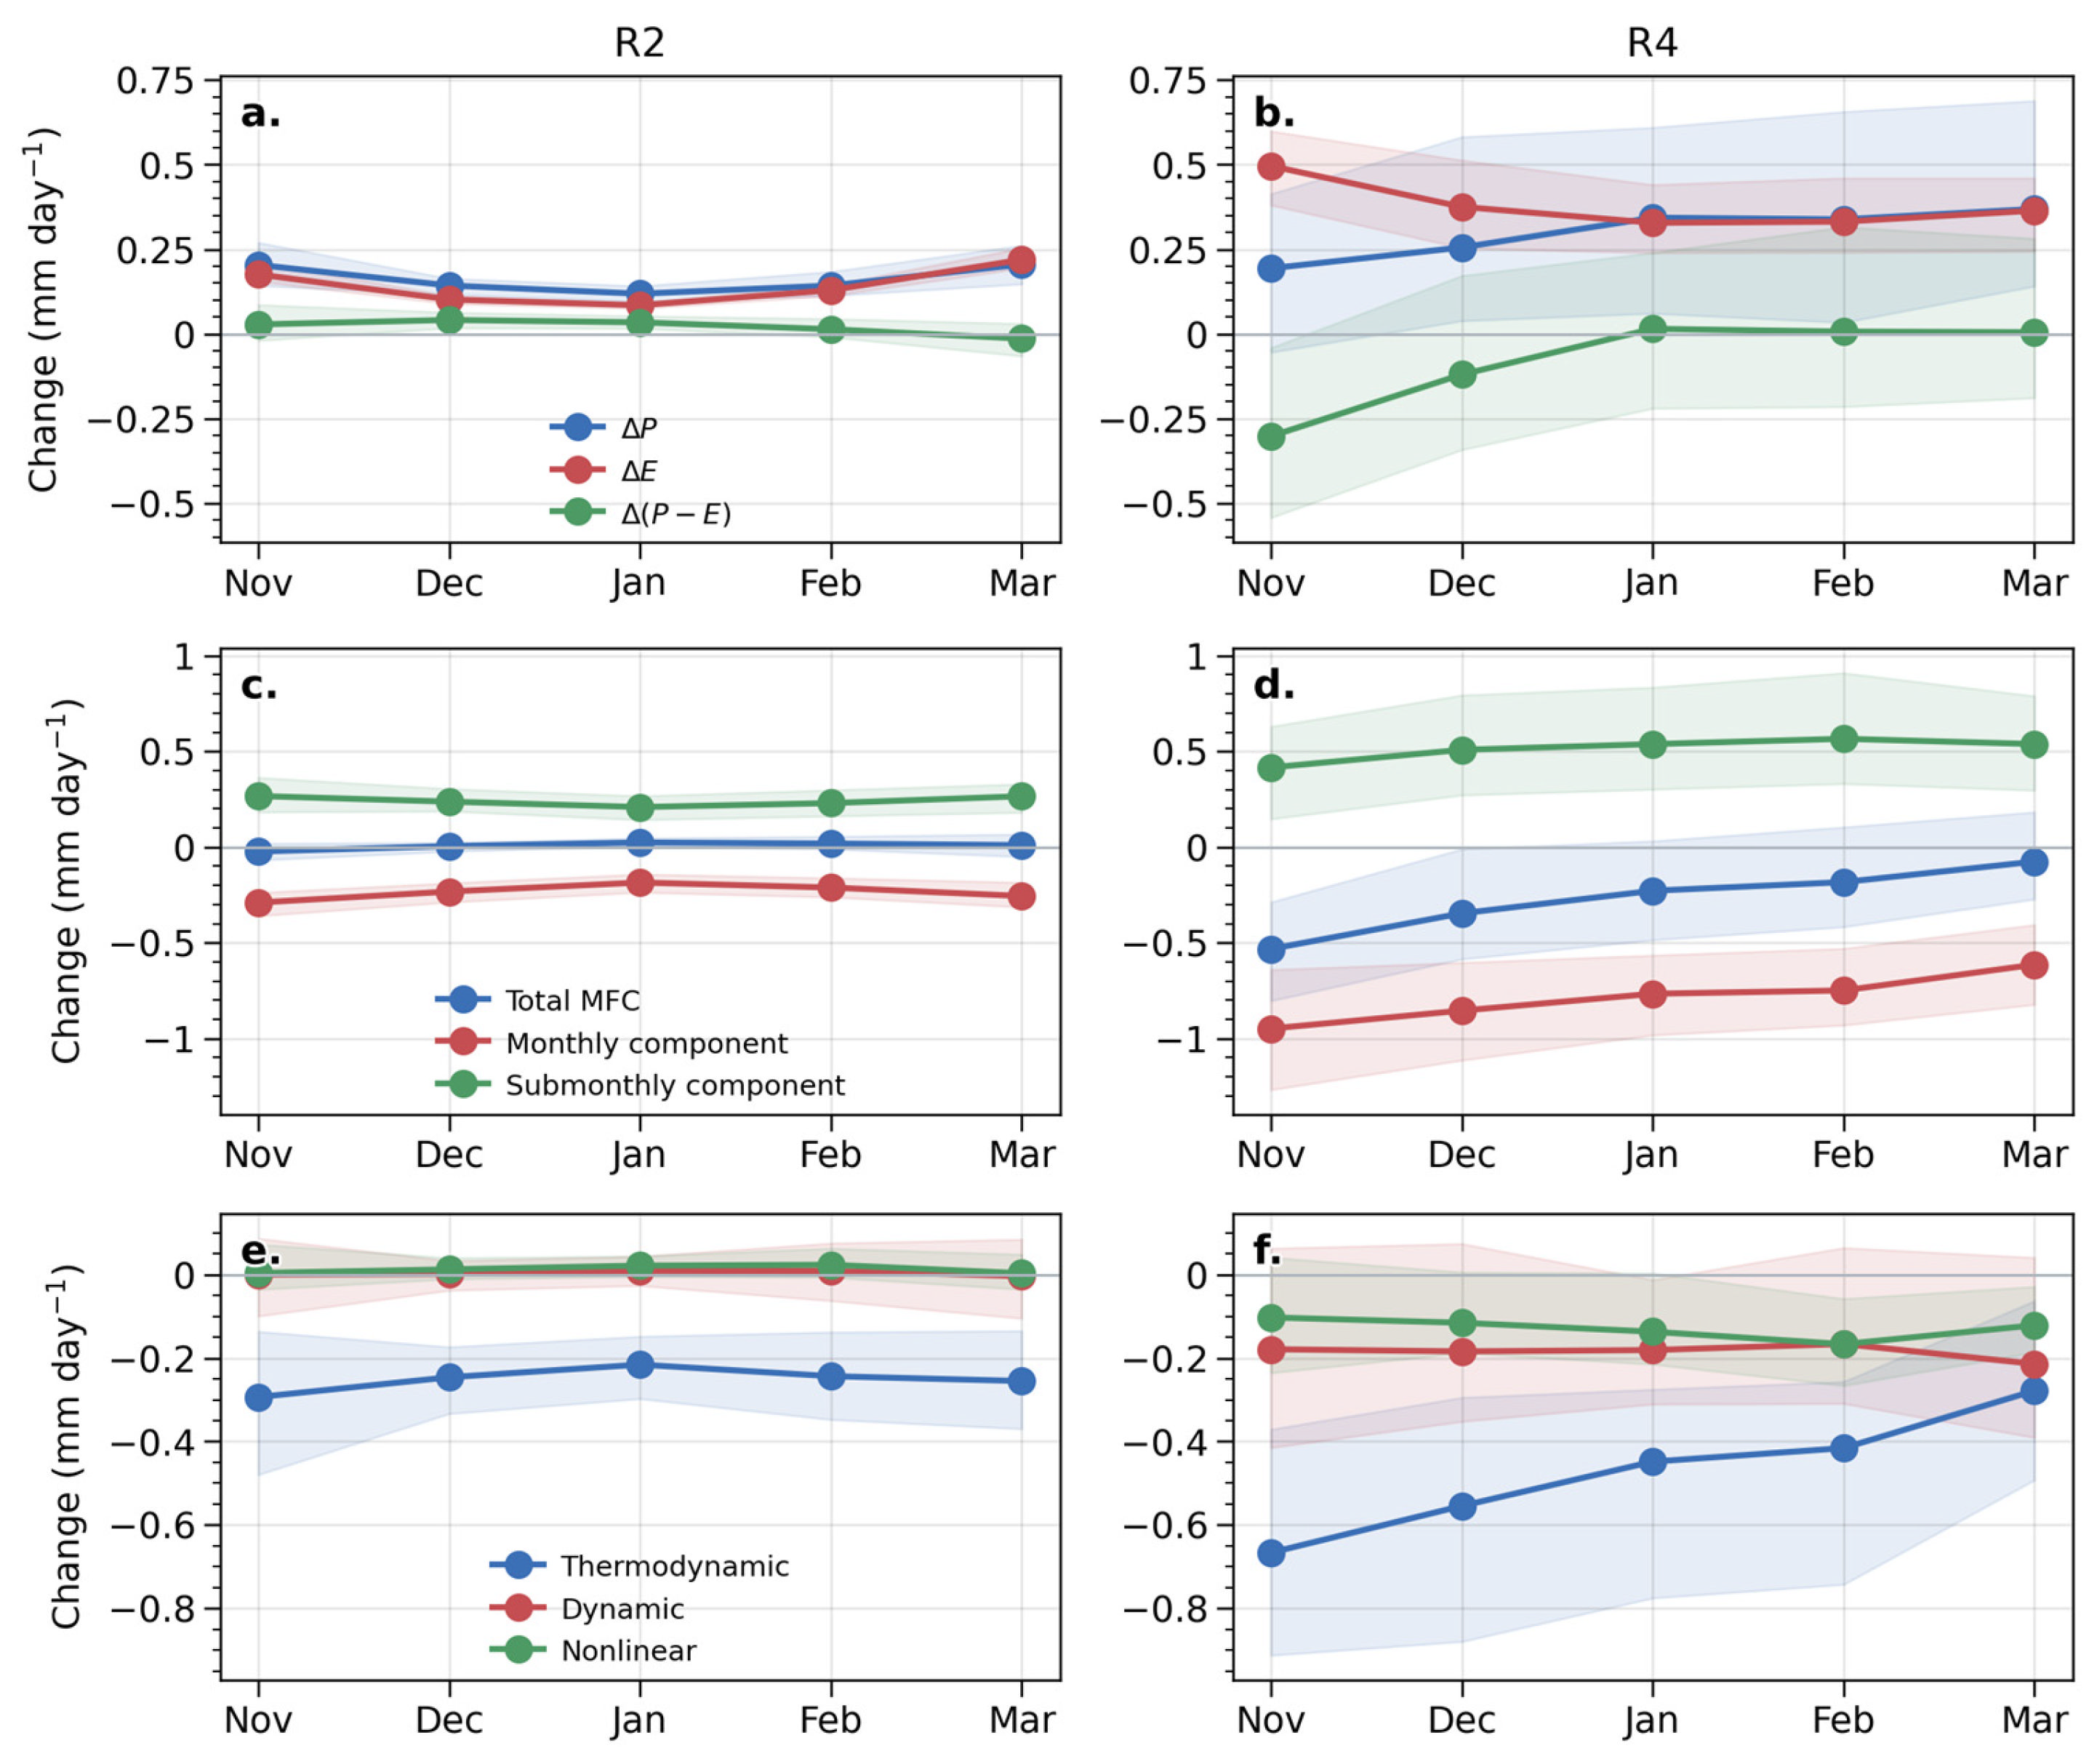
Figure 9 shows the atmospheric moisture budget changes under +4 K over R2 and R4, which exhibit contrasting responses. Over R2, precipitation and evaporation increase by similar amounts, while moisture-flux convergence changes little because its monthly and submonthly components largely offset each other. Although the absolute precipitation increases are comparable among months, the lower midwinter climatology results in larger relative increases in January and February, thereby reducing .
Figure 9.
Changes in the atmospheric moisture budget under +4 K warming for R2 (a,c,e) and R4 (b,d,f). Here, Δ denotes the difference between +4 K and Hist (+4 K minus Hist). P, E, and P − E denote precipitation, evaporation, and net precipitation, respectively; the total moisture-flux convergence (MFC) is decomposed into monthly component, submonthly component, and residual, respectively. The monthly term is further decomposed into dynamical, thermodynamic, and nonlinear components, respectively. See Equation (4) for details. Shading indicate the 5th–95th range across ensemble members.
Over R4, evaporation increases more than precipitation, particularly in November and December, reducing in early winter. Moisture-flux convergence also decreases most strongly in November and gradually approaches zero toward March. The negative monthly component, dominated by the thermodynamic term, is partially offset by the positive submonthly component. This stronger early-winter response favors a shift toward late-winter precipitation, consistent with the positive change in .
4. Discussion
Several limitations should be noted. First, although d4PDF generally reproduces the observed month-to-month evolution, systematic precipitation biases remain, particularly in R1 and R2. The physical origins of these biases are not investigated in this study and may influence the projected regional responses. Second, the moisture-budget analysis identifies the relative contributions of monthly mean and submonthly moisture transport but does not fully resolve the specific circulation systems responsible for these changes. The submonthly component likely includes contributions from synoptic disturbances and other intramonth variability. However, the present moisture-budget decomposition cannot uniquely attribute this term to specific weather systems, such as storm tracks or atmospheric rivers. Such attribution would require additional diagnostics based on daily or sub-daily atmospheric fields and therefore remains an important direction for future research.
Additional analysis using CMIP6 coupled models provides qualitative multi-model support for the projected reorganization of winter precipitation. Although the CMIP6 historical simulations exhibit substantial wet biases, they generally reproduce the observed U-shaped month-to-month evolution (Figure S1). Under future warming, precipitation increases in nearly all winter months, but the magnitude of the increase differs among months. In the long-term period (2081–2100) of SSP5–8.5 simulations, the relative contribution of November precipitation generally decreases, whereas that of the mid- and late-winter months increases. The curvature index () decreases over extensive parts of continental Northeastern Asia, indicating a weakening of the historical U-shaped evolution. Changes in the asymmetry index () show greater regional and inter-model differences.
The CMIP6 and d4PDF results should nevertheless be viewed as complementary rather than directly comparable. CMIP6 incorporates interactive atmosphere–ocean processes and samples structural differences among coupled models, whereas d4PDF uses a single atmospheric model forced by prescribed SSTs. In contrast, the much larger d4PDF ensemble within a consistent model framework is better suited to separating the forced response from internal variability. Moreover, the present CMIP6 analysis does not isolate the specific contribution of air–sea coupling to the projected precipitation changes.
A month-specific bias-correction (see Section S3 for detailed method) sensitivity test was conducted for R1 and R2, where the observed precipitation lies outside the historical ensemble spread. The correction substantially improves the simulated historical , , and , bring them closer to the observations (Figure S3a–d). More importantly, the projected changes in , , and , remain broadly consistent after bias correction (Figure S3e–h). In both regions, the corrected results retain the negative , confirming the projected weakening of the U-shaped month-to-month evolution (Figure S3g). The also remains similar after correction (Figure S3h).
The relatively large precipitation increases over the continental regions are consistent with greater atmospheric moisture availability under warming. Over R2, increased evaporation accompanies the precipitation increase, while the reduced monthly moisture-flux convergence is largely offset by the enhanced submonthly component. Because the historical precipitation is lower in midwinter, comparable absolute increases produce larger relative increases in January and February, weakening the U-shaped evolution and decreasing .
The response differs over R4, where evaporation increases more strongly than precipitation and moisture-flux convergence decreases, particularly in early winter. The stronger early-winter reduction in favors a relative shift toward late-winter precipitation and a positive change in . These results demonstrate that regional changes in and depend on both the historical monthly climatology and the seasonally varying balance among evaporation and monthly and submonthly moisture transport.
5. Conclusions
This study investigates the month-to-month evolution of winter precipitation from November to March (NDJFM) in Northeastern Asia and its projected changes under +2 K and +4 K global warming using the d4PDF large-ensemble simulations. The main conclusions are as follows.
First, winter precipitation in Northeastern Asia exhibits a pronounced spatial gradient and a broadly U-shaped month-to-month evolution, with lower precipitation in midwinter and higher precipitation at the beginning and end of winter. Despite some regional biases, d4PDF generally reproduces the observed spatial pattern and month-to-month evolution.
Second, winter precipitation is projected to increase across Northeastern Asia under both +2 K and +4 K warming. The absolute increase is generally larger in climatologically wet regions, whereas the relative increase is larger over the dry continental regions. Warming also reorganizes the seasonal distribution of precipitation. The U-shaped evolution generally weakens, while the direction of the subseasonal shift varies regionally, with an early-winter shift in R2 and late-winter shifts in the other three subregions.
Third, the moisture-budget analysis highlights the important role of submonthly moisture transport in wintertime moisture convergence and its response to warming. Over the continental regions R1–R3, increased net precipitation is mainly associated with enhanced moisture-flux convergence from the submonthly component, which offsets the opposing change in the monthly component. Within the monthly component, thermodynamic effects generally dominate over dynamical effects. These results demonstrate that global warming not only increases winter precipitation in Northeastern Asia but also modifies its month-to-month distribution through changes in both monthly mean and submonthly moisture transport.
Supplementary Materials
The following supporting information can be downloaded at: https://www.mdpi.com/article/10.3390/earth7050172/s1. Text S1. CMIP6 data and methods; Text S2. CMIP6 results; Text S3. Bias correction method; Table S1. CMIP6 models and ensemble members used in the supplementary analysis; Figure S1. Historical and projected monthly precipitation from November to March over the four subregions based on CMIP6 models; Figure S2. Projected changes in the month-to-month distribution of winter precipitation based on CMIP6 models; Figure S3. Sensitivity of the historical and projected precipitation indices to month-specific multiplicative bias correction over R1 and R2.
Author Contributions
Conceptualization, T.M. and W.C.; formal analysis, S.W.; writing—original draft preparation, S.W. and T.M.; writing—review and editing, L.S. and T.M.; visualization, S.W. and T.M.; supervision, T.M.; funding acquisition, T.M. and W.C. All authors have read and agreed to the published version of the manuscript.
Funding
This research was jointly supported by the National Natural Science Foundation of China (42475043 and W2412059), Yunnan Provincial Science and Technology Department (Award number 202505AB350001, 202403AP140009, 202501CF070065), Yunnan Southwest United Graduate School Science and Technology Special Project (Award number 202302AP370003), the China Scholarship Council (202304910131).
Data Availability Statement
The JRA-3Q reanalysis is available from National Center for Atmospheric Research (NCAR): https://www.data.jma.go.jp/jra/html/JRA-3Q/index_en.html (accessed on 15 January 2026). The PREC/L is provided by the NOAA PSL: https://www.psl.noaa.gov/data/gridded/data.precl.html (accessed on 15 January 2026). The d4PDF database is available from the Data Integration and Analysis System (DIAS): https://www.miroc-gcm.jp/d4PDF/index_en.html (accessed on 15 September 2025).
Acknowledgments
The d4PDF was produced with the Earth Simulator under corporations among science programs (SOUSEI, TOUGOU, SI-CAT, DIAS) sponsored by the Ministry of Education, Culture, Sports, Science and Technology (MEXT), Japan. Generative artificial intelligence (GenAI), ChatGPT version GPT-5.6-Sol light, was used in this paper to assist with coding during the analysis and improve English. All AI-assisted code and text were carefully reviewed and verified by the authors to ensure its correctness. The authors have reviewed and edited the output and take full responsibility for the content of this publication.
Conflicts of Interest
The authors declare no conflicts of interest.
Abbreviations
The following abbreviations are used in this manuscript:
| MFC | Moisture-flux convergence |
| d4PDF | Database for policy decision-making for future climate change |
| R1 | Subregion 1: western inland cold-arid region |
| R2 | Subregion 2: Mongolia–North China transition region |
| R3 | Subregion 3: Northeast China–Korean Peninsula region |
| R4 | Subregion 4: northern Japan |
References
- Yao, Y.; Zhuo, W.; Gong, Z.; Luo, B.; Luo, D.; Zheng, F.; Zhong, L.; Huang, F.; Ma, S.; Zhu, C.; et al. Extreme Cold Events in North America and Eurasia in November-December 2022: A Potential Vorticity Gradient Perspective. Adv. Atmos. Sci. 2023, 40, 953–962. [Google Scholar] [CrossRef] [Scilit]
- Yao, Y.; Zhang, W.; Luo, D.; Zhong, L.; Pei, L. Seasonal Cumulative Effect of Ural Blocking Episodes on the Frequent Cold events in China during the Early Winter of 2020/21. Adv. Atmos. Sci. 2022, 39, 609–624. [Google Scholar] [CrossRef] [Scilit]
- Li, X.; Wen, Z.; Huang, W.-R. Modulation of South Asian Jet wave train on the extreme winter precipitation over Southeast China: Comparison between 2015/16 and 2018/19. J. Clim. 2020, 33, 4065–4081. [Google Scholar] [CrossRef] [Scilit]
- Li, X.; Chen, Y.D.; Zhou, W. Response of Winter Moisture Circulation to the India–Burma Trough and Its Modulation by the South Asian Waveguide. J. Clim. 2017, 30, 1197–1210. [Google Scholar] [CrossRef] [Scilit]
- Li, X.; Zhou, W.; Chen, D.; Li, C.; Song, J. Water Vapor Transport and Moisture Budget over Eastern China: Remote Forcing from the Two Types of El Niño. J. Clim. 2014, 27, 8778–8792. [Google Scholar] [CrossRef] [Scilit]
- Chen, W.; Zhang, R.; Wu, R.; Wen, Z.; Zhou, L.; Wang, L.; Hu, P.; Ma, T.; Piao, J.; Song, L.; et al. Recent Advances in Understanding Multi-scale Climate Variability of the Asian Monsoon. Adv. Atmos. Sci. 2023, 40, 1429–1456. [Google Scholar] [CrossRef] [Scilit]
- Ding, Y.H.; Wang, Z.Y.; Song, Y.F.; Zhang, J. The Unprecedented Freezing Disaster in January 2008 in Southern China and Its Possible Association with the Global Warming. Acta Meteorol. Sin. 2008, 22, 538–558. [Google Scholar]
- Zhou, B.; Gu, L.; Ding, Y.; Shao, L.; Wu, Z.; Yang, X.; Li, C.; Li, Z.; Wang, X.; Cao, Y.; et al. The Great 2008 Chinese Ice Storm: Its Socioeconomic–Ecological Impact and Sustainability Lessons Learned. Bull. Am. Meteorol. Soc. 2011, 92, 47–60. [Google Scholar] [CrossRef] [Scilit]
- Ministry of Emergency Management of the People’s Republic of China. Available online: https://www.mem.gov.cn/xw/yjglbgzdt/202201/t20220123_407199.shtml (accessed on 30 August 2026). (In Chinese)
- Gao, K.; Wang, J.; Chen, D.; Hu, W.; Zhang, Y.; Duan, A.; Zhang, X. Synoptic Climate Settings and Moisture Supply for the Extreme Heavy Snowfall in Northern China during 6–8 November 2021. J. Meteorol. Res. 2023, 37, 75–89. [Google Scholar] [CrossRef] [Scilit]
- Ye, Y.; Qian, C.; Dai, A.; Zhang, Y.; Jiang, J.; Zhang, X. Attribution of a record-breaking cold event in the historically warmest year of 2023 and assessing future risks. npj Clim. Atmos. Sci. 2025, 8, 14. [Google Scholar] [CrossRef] [Scilit]
- Gong, H.; Ma, K.; Wang, L.; Chen, W. Attribution of the Record-Breaking Extreme Cold Event Over Northern East Asia in December 2023. Geophys. Res. Lett. 2024, 51, e2024GL112568. [Google Scholar] [CrossRef] [Scilit]
- Chen, H.; Jiang, J.; Liu, Y. Investigating the December 2023 warm-to-cold weather whiplash in China using a novel flash-cold metric. Environ. Res. Lett. 2024, 20, 014040. [Google Scholar] [CrossRef] [Scilit]
- Zhou, L.-T.; Wu, R. Respective impacts of the East Asian winter monsoon and ENSO on winter rainfall in China. J. Geophys. Res. Atmos. 2010, 115, D02107. [Google Scholar] [CrossRef] [Scilit]
- Zhou, L.T.; Tam, C.Y.; Zhou, W.; Chan, J.C.L. Influence of South China Sea SST and the ENSO on winter rainfall over South China. Adv. Atmos. Sci. 2010, 27, 832–844. [Google Scholar] [CrossRef] [Scilit]
- Qin, D.; Li, X.; Zhao, Y. Motivating Mechanisms of the South Asian Jet Wave Train by Disturbances over the North Atlantic in Winter. J. Clim. 2024, 37, 5025–5036. [Google Scholar] [CrossRef] [Scilit]
- Yu, S.; Sun, J. Persistent Mode of February-to-March Precipitation over Southern China: Variation, Mechanism, and Prediction. J. Clim. 2023, 36, 131–154. [Google Scholar] [CrossRef] [Scilit]
- Zhang, J.; Hu, K.; Huang, G.; Wang, Y. The upper-level atmospheric pathway of ENSO’s impact on winter rainfall in southern China. Geosci. Lett. 2025, 12, 26. [Google Scholar] [CrossRef] [Scilit]
- Qian, Q.; Jia, X. Seasonal forecast of winter precipitation over China using machine learning models. Atmos. Res. 2023, 294, 106961. [Google Scholar] [CrossRef] [Scilit]
- Ma, T.; Chen, W.; An, X. Quantifying the Teleconnections Between East Asian Winter Precipitation and Tropical Sea Surface Temperatures Using Causal Analysis. JGR Atmos. 2025, 130, e2024JD042689. [Google Scholar] [CrossRef] [Scilit]
- Jeong, J.-H.; Kim, B.-M.; Ho, C.-H.; Noh, Y.-H. Systematic variation in wintertime precipitation in East Asia by MJO-induced extratropical vertical motion. J. Clim. 2008, 21, 788–801. [Google Scholar] [CrossRef] [Scilit]
- Jiao, Y.; Wu, R. Propagation and influence on tropical precipitation of intraseasonal variation over mid-latitude East Asia in boreal winter. Atmos. Ocean. Sci. Lett. 2019, 12, 155–161. [Google Scholar] [CrossRef] [Scilit]
- Chen, Y.-L.; Sui, C.-H.; Chang, C.-P.; Tseng, K.-C. Effect of the MJO on East Asian Winter Rainfall as Revealed by an SVD Analysis. J. Clim. 2021, 34, 9729–9746. [Google Scholar] [CrossRef] [Scilit]
- Xiu, J.; Jiang, X.; Zhang, R. Linking the subseasonal variability of the East Asia winter monsoon and the Madden-Julian Oscillation through wave disturbances along the subtropical jet. npj Clim. Atmos. Sci. 2025, 8, 185. [Google Scholar] [CrossRef] [Scilit]
- Chen, W.; Graf, H.F.; Huang, R. The Interannual Variability of East Asian Winter Monsoon and Its Relation to the Summer Monsoon. Adv. Atmos. Sci. 2000, 17, 48–60. [Google Scholar] [CrossRef] [Scilit]
- Ma, T.; Chen, W.; Feng, J.; Wu, R. Modulation effects of the East Asian winter monsoon on El Nino-related rainfall anomalies in southeastern China. Sci. Rep. 2018, 8, 14107. [Google Scholar] [CrossRef] [Scilit]
- Zhang, Y.; Ma, T.; Li, Y.; Chen, W. Interannual Variations in Winter Precipitation in Northern East Asia. Water 2025, 17, 219. [Google Scholar] [CrossRef] [Scilit]
- Yan, J.; Zhang, W.; Hu, S.; Jiang, F. Different ENSO Impacts on Eastern China Precipitation Patterns in Early and Late Winter Associated with Seasonally-Varying Kuroshio Anticyclonic Anomalies. Adv. Atmos. Sci. 2024, 41, 1691–1703. [Google Scholar] [CrossRef] [Scilit]
- Hao, S.; Li, J.; Mao, J. Interannual Relationship between Summer North Atlantic Oscillation and Subsequent November Precipitation Anomalies over Yunnan in Southwest China. J. Meteorol. Res. 2022, 36, 718–732. [Google Scholar] [CrossRef] [Scilit]
- Yu, S.; Sun, J. Revisiting the relationship between El Niño-Southern Oscillation and the East Asian winter monsoon. Int. J. Climatol. 2018, 38, 4846–4859. [Google Scholar] [CrossRef] [Scilit]
- Tang, X.; Li, J.; Yang, Y.; Zhao, Y.; Diao, Y.; Zhao, H.; Liu, Y. Synergistic effect of El Niño and negative phase of arctic oscillation on winter precipitation over southern China. Clim. Dyn. 2026, 64, 133. [Google Scholar] [CrossRef] [Scilit]
- Zhi, R.; Zheng, Z.; Qiao, S.; Feng, G. Causes of positive precipitation anomalies in South China during La Niña winters. Clim. Dyn. 2023, 61, 3343–3352. [Google Scholar] [CrossRef] [Scilit]
- Sun, Y.; Li, J. Synergistic effect of El Niño and the North Pacific Oscillation on wintertime precipitation over Southeastern China and the East China Sea Kuroshio area. Clim. Dyn. 2022, 58, 1635–1649. [Google Scholar] [CrossRef] [Scilit]
- Intergovernmental Panel on Climate Change (Ipcc). Climate Change 2021–The Physical Science Basis: Working Group I Contribution to the Sixth Assessment Report of the Intergovernmental Panel on Climate Change; Cambridge University Press: Cambridge, UK, 2023. [Google Scholar]
- Miao, J.; Wang, T.; Chen, D. More robust changes in the East Asian winter monsoon from 1.5 to 2.0 °C global warming targets. Int. J. Climatol. 2020, 40, 4731–4749. [Google Scholar] [CrossRef] [Scilit]
- You, Q.; Jiang, Z.; Yue, X.; Guo, W.; Liu, Y.; Cao, J.; Li, W.; Wu, F.; Cai, Z.; Zhu, H.; et al. Recent frontiers of climate changes in East Asia at global warming of 1.5 °C and 2 °C. npj Clim. Atmos. Sci. 2022, 5, 80. [Google Scholar] [CrossRef] [Scilit]
- Jiang, W.; Huang, P.; Yu, J.; Song, X.; Chen, M.; Huang, G. Uncertainty in El Niño-Driven Northwest Pacific Anticyclone Projections Linked to Indo-Pacific Circulation Changes. Geophys. Res. Lett. 2025, 52, e2025GL118494. [Google Scholar] [CrossRef] [Scilit]
- Huang, Y.; Ren, H.-L.; Kug, J.-S.; Wang, R.; Li, J. Projected change of East-Asian winter precipitation related to strong El Niño under the future emission scenarios. Clim. Change 2023, 176, 81. [Google Scholar] [CrossRef] [Scilit]
- Liang, W.; Zhang, M. Summer and winter precipitation in East Asia scale with global warming at different rates. Commun. Earth Environ. 2021, 2, 150. [Google Scholar] [CrossRef] [Scilit]
- Song, S.-Y.; Yeh, S.-W.; Allan, R.P.; Xie, S.-P.; An, S.-I.; Park, H.-S. Climate sensitivity controls global precipitation hysteresis in a changing CO2 pathway. npj Clim. Atmos. Sci. 2023, 6, 156. [Google Scholar] [CrossRef] [Scilit]
- Yang, X.; Zhou, B.; Xu, Y.; Han, Z. CMIP6 Evaluation and Projection of Precipitation over Northern China: Further Investigation. Adv. Atmos. Sci. 2023, 40, 587–600. [Google Scholar] [CrossRef] [Scilit]
- Ishii, M.; Mori, N. D4PDF: Large-ensemble and high-resolution climate simulations for global warming risk assessment [Dataset]. Prog. Earth Planet Sci. 2020, 7, 58. [Google Scholar] [CrossRef] [Scilit]
- Chen, M.Y.; Xie, P.P.; Janowiak, J.E.; Arkin, P.A. Global land precipitation: A 50-yr monthly analysis based on gauge observations. J. Hydrometeorol. 2002, 3, 249–266. [Google Scholar] [CrossRef] [Scilit]
- Harris, I.; Osborn, T.J.; Jones, P.; Lister, D. Version 4 of the CRU TS monthly high-resolution gridded multivariate climate dataset. Sci. Data 2020, 7, 109. [Google Scholar] [CrossRef] [Scilit]
- Kosaka, Y.; Kobayashi, S.; Harada, Y.; Kobayashi, C.; Naoe, H.; Yoshimoto, K.; Harada, M.; Goto, N.; Chiba, J.; Miyaoka, K.; et al. The JRA-3Q Reanalysis [Dataset]. J. Meteorol. Soc. Jpn. 2024, 102, 49–109. [Google Scholar] [CrossRef] [Scilit]
- Mizuta, R.; Murata, A.; Ishii, M.; Shiogama, H.; Hibino, K.; Mori, N.; Arakawa, O.; Imada, Y.; Yoshida, K.; Aoyagi, T.; et al. Over 5000 Years of Ensemble Future Climate Simulations by 60-km Global and 20-km Regional Atmospheric Models. Bull. Am. Meteorol. Soc. 2017, 98, 1383–1398. [Google Scholar] [CrossRef] [Scilit]
- Xu, Z.; Kosaka, Y.; Toda, M.; Iwakiri, T.; Huang, G.; Ji, F.; Miyamoto, A.; Tao, W. Irreversibility of winter precipitation over the Northeastern Pacific and Western North America against CO2 forcing. npj Clim. Atmos. Sci. 2024, 7, 300. [Google Scholar] [CrossRef] [Scilit]
- Wallace, J.M.; Battisti, D.S.; Thompson, D.W.J.; Wallace, J.M.; Battisti, D.S.; Thompson, D.W.J.; Hartmann, D.L. The Atmospheric General Circulation; Cambridge University Press: Cambridge, UK, 2023. [Google Scholar]
- Akinsanola, A.A.; Chen, Z.; Kooperman, G.J.; Bobde, V. Robust future intensification of winter precipitation over the United States. npj Clim. Atmos. Sci. 2024, 7, 212. [Google Scholar] [CrossRef] [Scilit]

Disclaimer/Publisher’s Note: The statements, opinions and data contained in all publications are solely those of the individual author(s) and contributor(s) and not of MDPI and/or the editor(s). MDPI and/or the editor(s) disclaim responsibility for any injury to people or property resulting from any ideas, methods, instructions or products referred to in the content. |
© 2026 by the authors. Licensee MDPI, Basel, Switzerland. This article is an open access article distributed under the terms and conditions of the Creative Commons Attribution (CC BY) license.