


Abstract
Sustainable expansion of irrigated agriculture requires the identification of areas with favorable biophysical conditions while also considering water-resource and infrastructure constraints. This study assessed the biophysical land suitability for potential irrigation development within the Ertis Water Management Basin (WMB), Kazakhstan, using an integrated remote sensing, geographic information system (GIS), and Analytic Hierarchy Process (AHP) framework. Four criteria—slope, normalized difference vegetation index (NDVI), land use/land cover (LULC), and soil texture—were standardized into five suitability classes and integrated using an AHP-based weighted overlay. The derived weights were 0.51 for slope, 0.26 for NDVI, 0.14 for LULC, and 0.09 for soil texture, with a consistency ratio of approximately 1%. The resulting assessment classified approximately 10% of the basin as highly suitable (S1), 43% as suitable (S2), 18% as moderately suitable (S3), 2% as marginally suitable (S4), and 27% as not suitable (NS), indicating that approximately 53% of the basin falls within the two highest suitability classes. Regional analysis showed that substantial shares of suitable land are concentrated in Pavlodar and Abay Regions, while suitable areas were identified across a wide range of distances from the river network. These findings indicate considerable biophysical potential for irrigation development across the Ertis WMB, with suitable areas occurring both near and farther from the river network. The resulting suitability map provides a spatial basis for identifying areas where more detailed assessments of water availability, irrigation infrastructure, and development feasibility can subsequently be undertaken.
1. Introduction
Agriculture in Kazakhstan faces significant challenges due to the country’s predominantly arid and semi-arid climate, characterized by limited and highly variable precipitation, recurrent droughts, and increasing pressure on water resources. These conditions can constrain agricultural productivity and increase the vulnerability of crop production to climatic variability [1,2]. Irrigation therefore plays an important role in enhancing agricultural productivity, stabilizing crop production during dry periods, and supporting food security and sustainable agricultural development.
Surface water resources, particularly rivers and reservoirs, represent the primary sources of irrigation water in Kazakhstan [3]. To facilitate the management and allocation of these resources, the country is divided into eight major water management basins. Among these basins, the Ertis Water Management Basin (WMB) is of particular importance, as it has the highest annual runoff and contains a substantial proportion of Kazakhstan’s freshwater resources [4]. With only a relatively small proportion of the basin’s agricultural land currently irrigated [5], assessing the potential for future irrigation development is particularly relevant in the context of increasing pressure on water resources in Kazakhstan [6]. In addition, the predominance of extensive grasslands, favorable soil conditions, and regulated surface water resources contribute to favorable conditions for sustainable irrigation development [7,8,9].
Determining where land is potentially suitable for irrigation development requires the simultaneous evaluation of multiple environmental factors. The integration of geographic information systems (GIS) with multi-criteria decision analysis (MCDA), particularly the Analytic Hierarchy Process (AHP), has therefore been widely applied in agricultural and irrigation land suitability assessments [10,11]. These approaches enable multiple environmental and socio-economic criteria to be integrated within a common spatial framework [12,13]. Commonly considered criteria include soil properties, topography, land use/land cover (LULC), water-related factors, and climatic conditions [13,14,15]. However, the selection and relative importance of individual criteria vary according to regional characteristics, data availability, and the objectives of the assessment. For example, proximity to water sources is frequently considered in water-scarce and arid regions, whereas slope may receive greater importance in areas where topographic constraints strongly influence irrigation development [12,16,17,18]. Some studies have also incorporated socio-economic factors, such as road accessibility and population density, to account for infrastructure and development conditions [13].
Although GIS–MCDA approaches have been widely applied to land suitability assessment for irrigation, their application requires adaptation to the environmental and water-management context of the study area. Previous research in Kazakhstan has demonstrated the applicability of integrated AHP, GIS, and remote sensing approaches for assessing land suitability for irrigation [12]. The present study focuses specifically on the Ertis WMB and applies a basin-specific assessment based on slope, NDVI, LULC, and soil texture, together with spatial constraints related to steep slopes, potentially flood-prone areas, and urban land. In addition, the spatial distribution of the resulting suitability classes is examined in relation to the river network and administrative regions to provide a basin-scale perspective on the potential for irrigation development.
2. Materials and Methods
2.1. Study Area
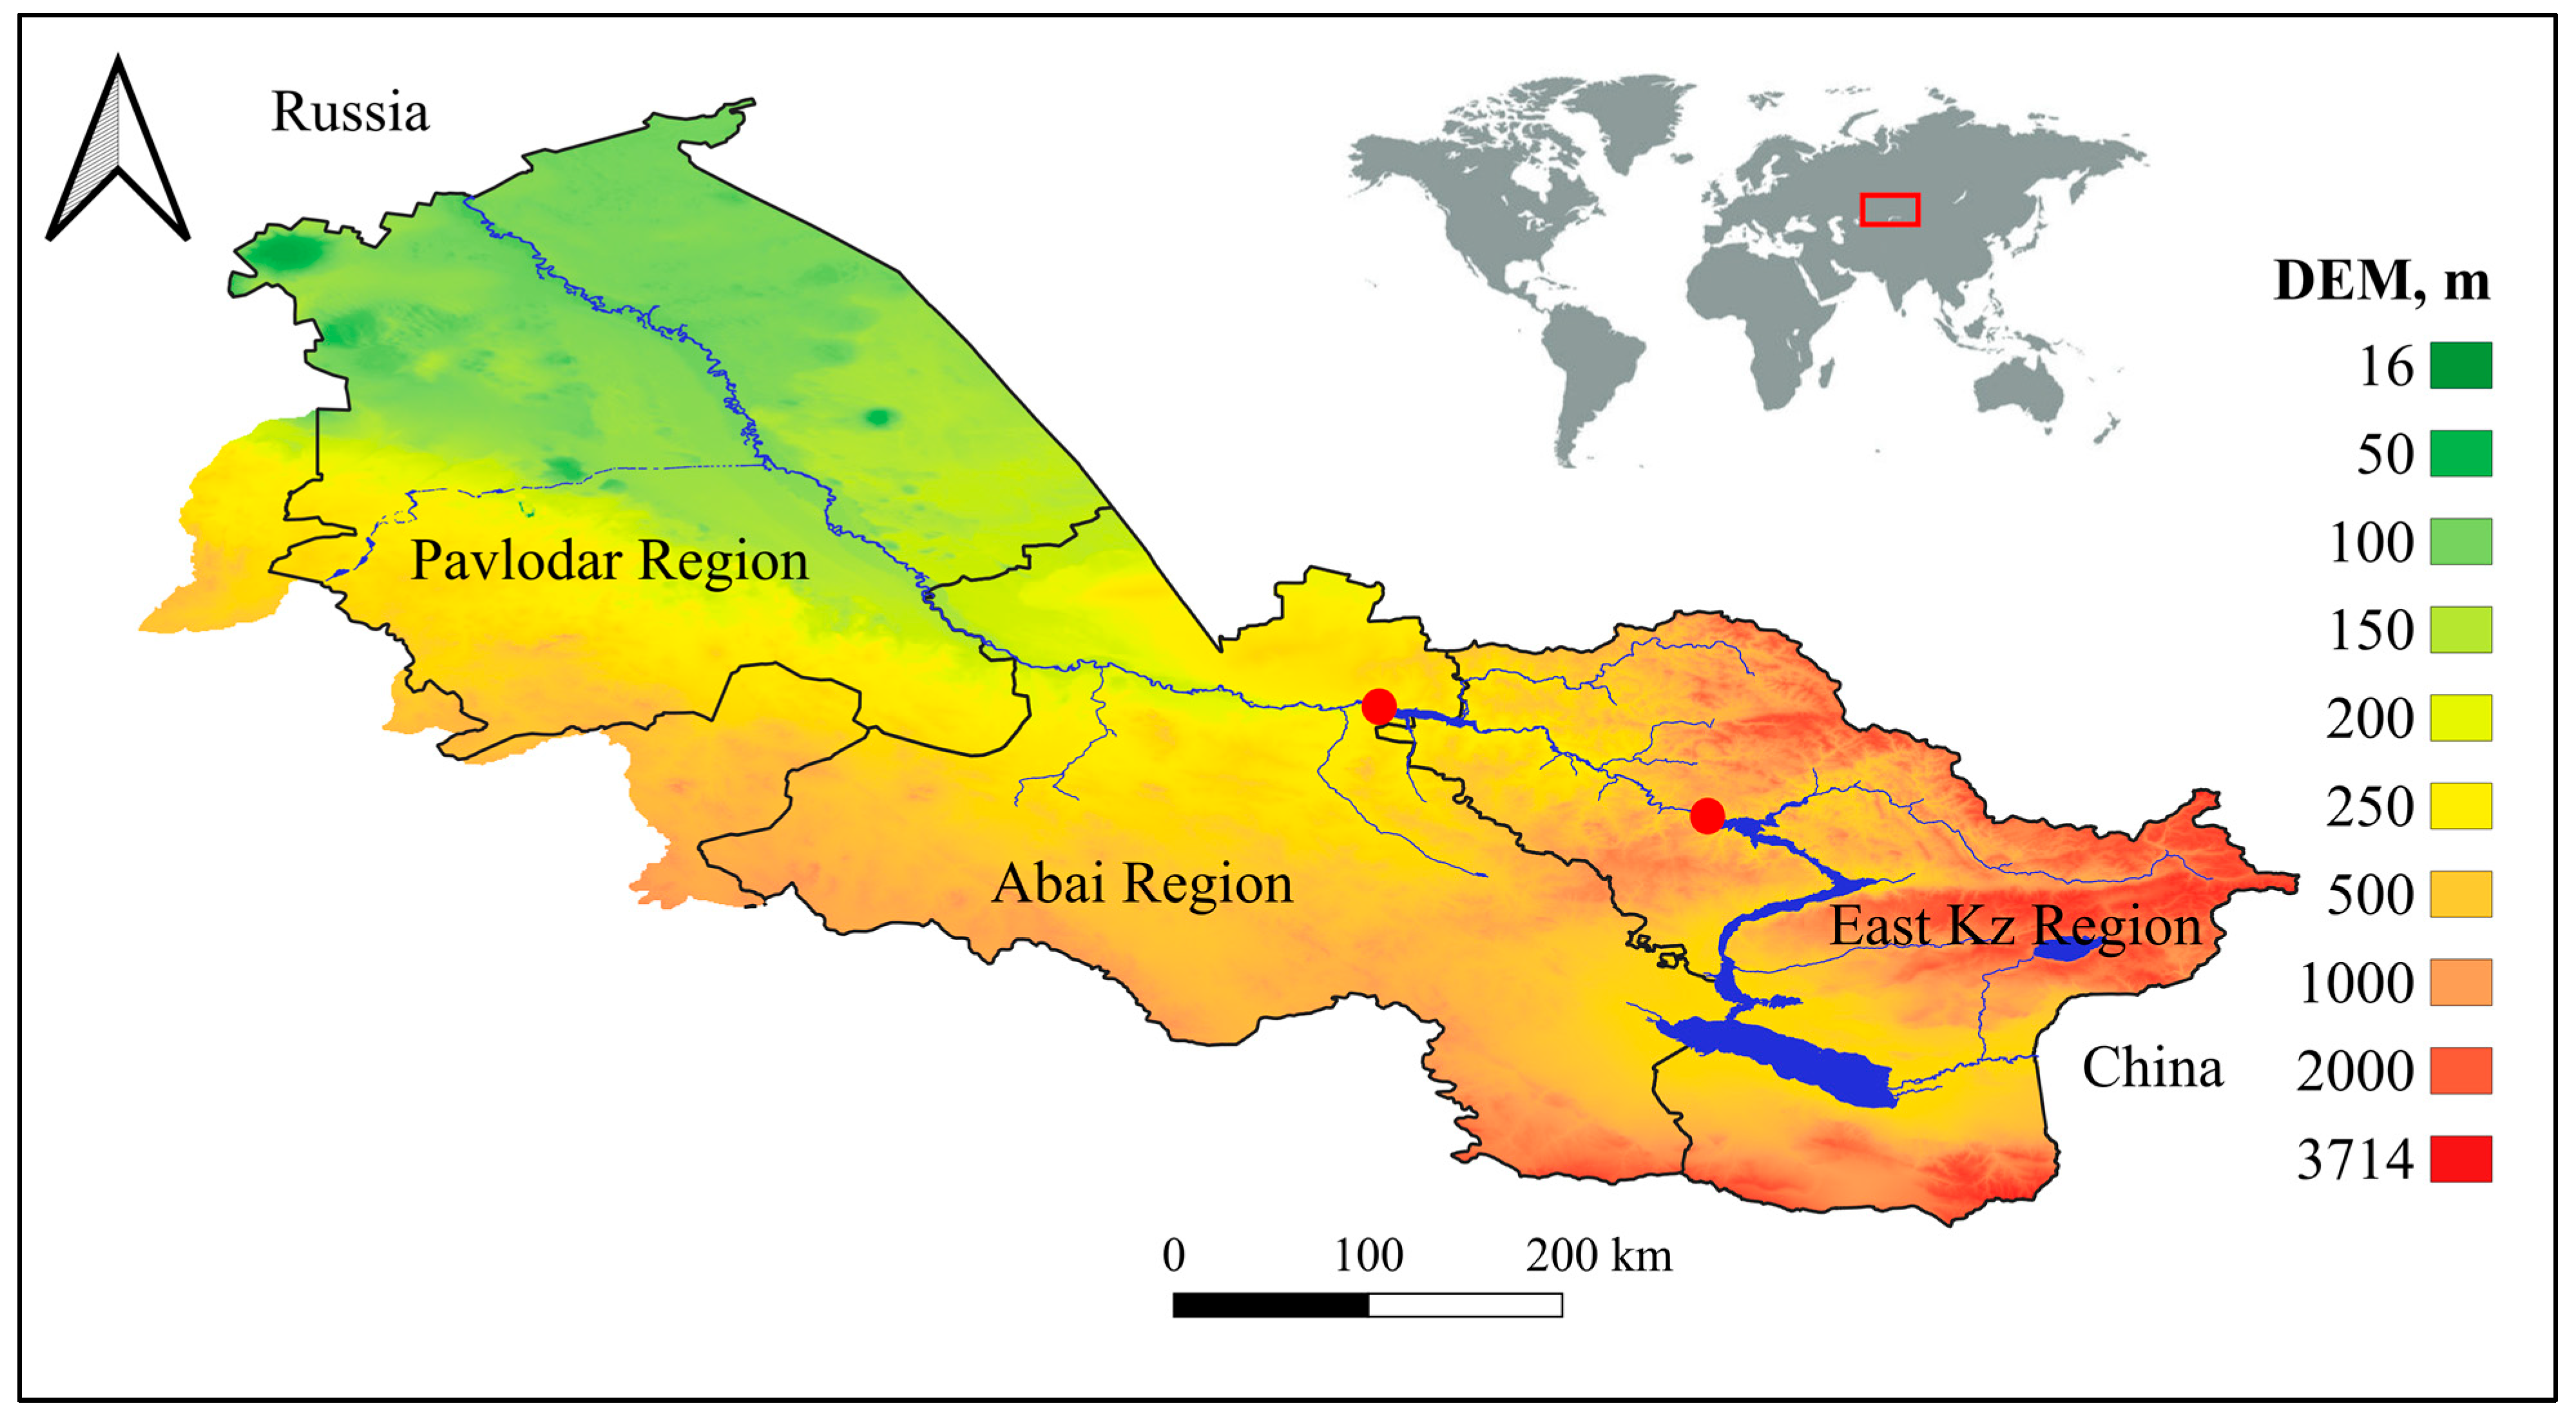
The Ertis WMB is one of the eight officially recognized water management basins of Kazakhstan and is located in the eastern part of the country (Figure 1). The basin forms part of the larger Ob River basin, which ultimately drains into the Arctic Ocean.
The Ertis River is the principal river of the Ertis WMB (Figure 1) and one of the major transboundary rivers of Central Asia, with a total length exceeding 4000 km. The river originates in the Altai Mountains of northern Xinjiang, China, and flows through China, Kazakhstan, and Russia. Consequently, a substantial proportion of the surface-water resources entering the Kazakhstani part of the basin originates outside the country [8].
The river flow resources of the Ertis basin, including its tributaries, account for approximately 33.5% of Kazakhstan’s total renewable surface water resources, corresponding to about 33.5 km3 out of 102.3 km3 in 2023. The river serves multiple purposes, including hydropower generation, domestic and industrial water supply, agriculture, and environmental needs. In addition, water from the Ertis River is transferred to other regions of Kazakhstan through the Irtysh–Karaganda (Satpayev) Canal [4,8].
According to the Köppen–Geiger climate classification, the Ertis WMB is predominantly characterized by a warm-summer humid continental climate with no dry season (Dfb) [19]. Over the past 25 years, the basin had a mean annual air temperature of approximately 3.7 °C and mean annual precipitation of approximately 465 mm, with standard deviations of 2.2 °C and 227 mm, respectively [20].
Agriculture represents an important land use within the Ertis WMB, with cropland covering approximately 10% of the basin area [7]. The dominant crops include spring wheat, barley, sunflower, and forage crops [5]. Agricultural production within the basin is predominantly rainfed, with only approximately 10% of the total agricultural land currently under irrigation [5].
Figure 1.
Geographic location of the Ertis WMB in Kazakhstan (indicated by the red rectangle in the inset), showing the Ertis River and its major tributaries and canals (blue), major reservoirs (red dots), administrative regions, and the digital elevation model (DEM) of the study area [21].
2.2. Data Sources and Criteria
Land suitability assessments for irrigation commonly consider physical factors such as topography, soil properties, and land use/land cover (LULC), which influence the suitability of land for irrigation development. Accordingly, slope, soil texture, and LULC were selected as the principal physical criteria in the present study. Slope represents topographic constraints that may affect irrigation implementation, while soil texture influences soil water-holding and drainage characteristics. LULC was included to represent existing land-use conditions and identify land-cover types that may favor or constrain potential irrigation development. Soil texture was characterized using data for the upper 0–30 cm soil layer.
Additional factors may be incorporated depending on local environmental conditions, data availability, and the objectives of the assessment. In this study, the Normalized Difference Vegetation Index (NDVI) was included as a supplementary biophysical criterion to characterize vegetation condition and spatial variation in land productivity. Rather than representing climate directly, NDVI was used to characterize the realized vegetation response to the combined effects of climatic and land-surface conditions during the growing season. NDVI data for 2020–2025 were used to represent recent vegetation conditions. For each year, the maximum NDVI value during the growing season (April–September) was derived, and the mean of the annual maximum values was subsequently calculated for the 2020–2025 period. Distance to the river network was not included as an AHP criterion but was analyzed separately after the suitability assessment to examine the spatial distribution of suitability classes in relation to surface-water proximity.
In addition to the suitability criteria, spatial constraints were applied to exclude areas considered unsuitable for potential irrigation development. These included slopes greater than 8%, land-cover types considered incompatible with irrigation development, and potentially flood-prone areas. Potentially flood-prone areas were identified using the Height Above Nearest Drainage (HAND) approach, based on the SRTM 30 m DEM and the MERIT Hydro drainage network. Areas with HAND values ≤ 8 m were classified as potentially flood-prone. This threshold was used as a terrain-based screening criterion and was not associated with a specific flood return period. The resulting delineation was visually inspected against high-resolution satellite imagery to assess its spatial correspondence with recognizable river-valley and floodplain features. These constraints were applied after the AHP weighted overlay and final suitability classification, with all excluded pixels reassigned to the non-suitable (NS) class.
The distance-to-river analysis used Euclidean (straight-line) distance from the MERIT Hydro river network and was applied after the suitability assessment as a supplementary characterization of surface-water proximity rather than as a direct measure of irrigation-water accessibility or conveyance feasibility. AHP pairwise-comparison calculations, criterion weights, CI, and CR were calculated in Microsoft Excel (Microsoft Excel for Mac, version 16.78 (Microsoft Corporation, Redmond, WA, USA)). Spatial data processing, raster reclassification, weighted overlay, application of exclusion constraints, distance analysis, and calculation of the final suitability classes were performed in QGIS 3.34.3 (Prizren).
All parameters used in this study were derived from freely available geospatial datasets with different native spatial resolutions. To ensure spatial consistency during the analysis, the criterion layers were projected, aligned, and resampled to a common 30 m analysis grid. Continuous variables were resampled using bilinear interpolation, whereas categorical variables were resampled using nearest-neighbor interpolation. The 30 m grid represents the common computational resolution of the analysis and does not increase the intrinsic spatial resolution of the coarser input datasets. A summary of the datasets, including their sources, native spatial resolutions, and characteristics, is presented in Table 1.
Table 1.
Input datasets.
2.3. Classification of Suitability Criteria
To ensure consistency and comparability among the selected criteria, each criterion was reclassified into five irrigation suitability classes based on the FAO land evaluation framework, ranging from S1 (highly suitable) to NS (not suitable) (Table 2). The classification thresholds were established with reference to previous irrigation suitability studies, agronomic considerations, and the environmental characteristics of the Ertis WMB. The four criteria—slope, soil texture, LULC, and NDVI—were subsequently standardized using this common suitability scale to generate the thematic layers used in the AHP-based assessment.
Table 2.
FAO land suitability classification structure [24].
Slope was classified according to its influence on surface water distribution, runoff, erosion risk, and irrigation infrastructure requirements, with flatter terrain assigned higher suitability. Soil texture was classified according to its influence on water retention, infiltration, and drainage, with medium-textured soils assigned higher suitability. LULC classes were ranked according to their compatibility with potential irrigation development: existing cropland was assigned to S1, grassland to S2, shrubland and bare/sparse vegetation to S3, and wetlands to S4, while tree cover, water bodies, snow and ice, built-up areas, and moss and lichen were assigned to the NS class (Table 3).
Table 3.
Irrigation suitability classification criteria and corresponding thresholds.
NDVI was used as an indicator of vegetation condition and spatial variation in land productivity, reflecting the combined influence of climatic and land-surface conditions during the growing season. Unlike the other criteria, the NDVI thresholds were defined with reference to the observed distribution of NDVI values within the study area (mean ≈ 0.50; SD ≈ 0.20). These descriptive statistics were used to guide the selection of fixed 0.10 NDVI intervals, with thresholds at 0.35, 0.45, 0.55, and 0.65 representing progressively increasing vegetation conditions (Table 3). The thresholds were not mathematically derived as exact fractions or multiples of the standard deviation.
2.4. AHP-Based Criteria Weighting and Consistency Assessment
In this study, the Analytic Hierarchy Process (AHP), developed by Saaty [26], was applied to determine the relative importance of the four selected criteria through pairwise comparison. The pairwise judgments were established by the research team based on the relative functional importance of each criterion for irrigation suitability, informed by previous land- and irrigation-suitability studies and consideration of the environmental characteristics of the Ertis WMB. The judgments were assigned using Saaty’s fundamental scale, in which values from 1 to 9 represent increasing levels of relative importance between two criteria (Table 4).
Table 4.
Saaty scale for pairwise comparison of parameters.
The relative importance of the criteria was evaluated in the context of the Ertis WMB rather than by directly adopting weights reported in previous studies. The pairwise judgments were based on the relative functional importance of the criteria for irrigation suitability, informed by previous land- and irrigation-suitability studies and the environmental context of the Ertis WMB. Slope was assigned the greatest relative importance because of its direct influence on surface-water distribution, runoff, erosion risk, and irrigation infrastructure requirements. NDVI was assigned the second-highest importance as an indicator of observed vegetation condition and spatial variations in land productivity, while LULC represented the compatibility of existing land-cover conditions with potential irrigation development. Soil texture was assigned a lower relative weight, while still being recognized as an important factor influencing water infiltration, water-holding capacity, and drainage conditions. The observed spatial variability of the criteria was not used to derive the pairwise comparison values or criterion weights; rather, it was considered subsequently when interpreting their spatial discriminatory effects. Based on these considerations, the pairwise comparison matrix was constructed as presented in Table 5.
Table 5.
Pairwise comparison matrix.
The pairwise comparison matrix was normalized to derive the relative weight of each criterion. The resulting weights were 0.51 for slope, 0.26 for NDVI, 0.14 for LULC, and 0.09 for soil texture (Table 6).
Table 6.
Normalized pairwise comparison matrix and derived criteria weights.
To verify the consistency of the pairwise comparison matrix, standard Analytical Hierarchy Process (AHP) consistency measures were applied. The Consistency Index (CI) was first calculated based on the maximum eigenvalue of the matrix (Equation (1)). The Consistency Ratio (CR) was then determined by comparing the CI with the corresponding Random Index (RI), thereby accounting for the size of the pairwise comparison matrix (Equation (2)). The CI and CR were calculated as:
where λmax is the maximum eigenvalue of the pairwise comparison matrix and n is the number of criteria.
where RI is the Random Index corresponding to the number of criteria in the matrix.
CI = (λmax − n)/(n − 1)
CR = CI/RI
In this study, the calculated CR was approximately 1%, which is well below the commonly accepted threshold of 10% in AHP. This indicates a high level of consistency in the pairwise judgments and supports the reliability of the derived criterion weights.
The derived criterion weights were subsequently applied in a weighted overlay analysis to integrate the four standardized criterion layers. The composite suitability score was calculated as:
where S represents the composite suitability score and the coefficients represent the AHP-derived weights of the respective criteria. The resulting composite suitability scores were reclassified into five final suitability classes. Scores ranging from 1.0 to less than 2.0 were classified as highly suitable (S1), scores from 2.0 to less than 3.0 as suitable (S2), scores from 3.0 to less than 4.0 as moderately suitable (S3), and scores from 4.0 to less than 5.0 as marginally suitable (S4), while a score of 5.0 represented not suitable (NS). Lower composite scores therefore indicate more favorable conditions for potential irrigation development, whereas higher scores represent increasing suitability limitations. Following this classification, the spatial constraints described in Section 2.2 were applied, and all excluded areas were assigned to the NS class.
S = 0.51(Slope) + 0.26(NDVI) + 0.14(LULC) + 0.09(Soil Texture)
To evaluate the sensitivity of the suitability results to changes in the AHP weights, a one-at-a-time (OAT) sensitivity analysis was applied following approaches commonly used in GIS-based multi-criteria suitability assessments [27]. The weights of the two dominant criteria, slope and NDVI, were independently increased and decreased by 20%. When the weight of one criterion was modified, the weights of the remaining criteria were proportionally adjusted so that the sum of all weights remained equal to 1. An equal-weight scenario, in which each criterion was assigned a weight of 0.25, was additionally evaluated as a reference representing the removal of the original AHP weighting structure. All criterion classification thresholds, spatial constraints, and other processing procedures were kept unchanged across the scenarios.
For validation, high-resolution satellite imagery was visually examined to identify agricultural areas with clear evidence of irrigation. The validation areas included both circular fields with spatial patterns consistent with center-pivot irrigation and non-circular agricultural fields located adjacent to identifiable artificial irrigation channels. These areas were manually delineated as validation polygons independently of the AHP suitability map, without reference to their modeled suitability classes. A total of 10 validation polygons were identified and subsequently overlaid with the final suitability map to determine the proportion of their area corresponding to each suitability class.
3. Results
3.1. Spatial Distribution of the Thematic Layers
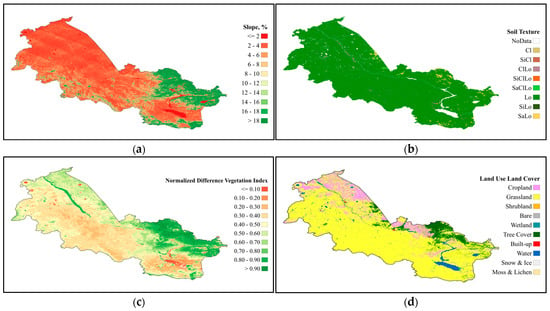
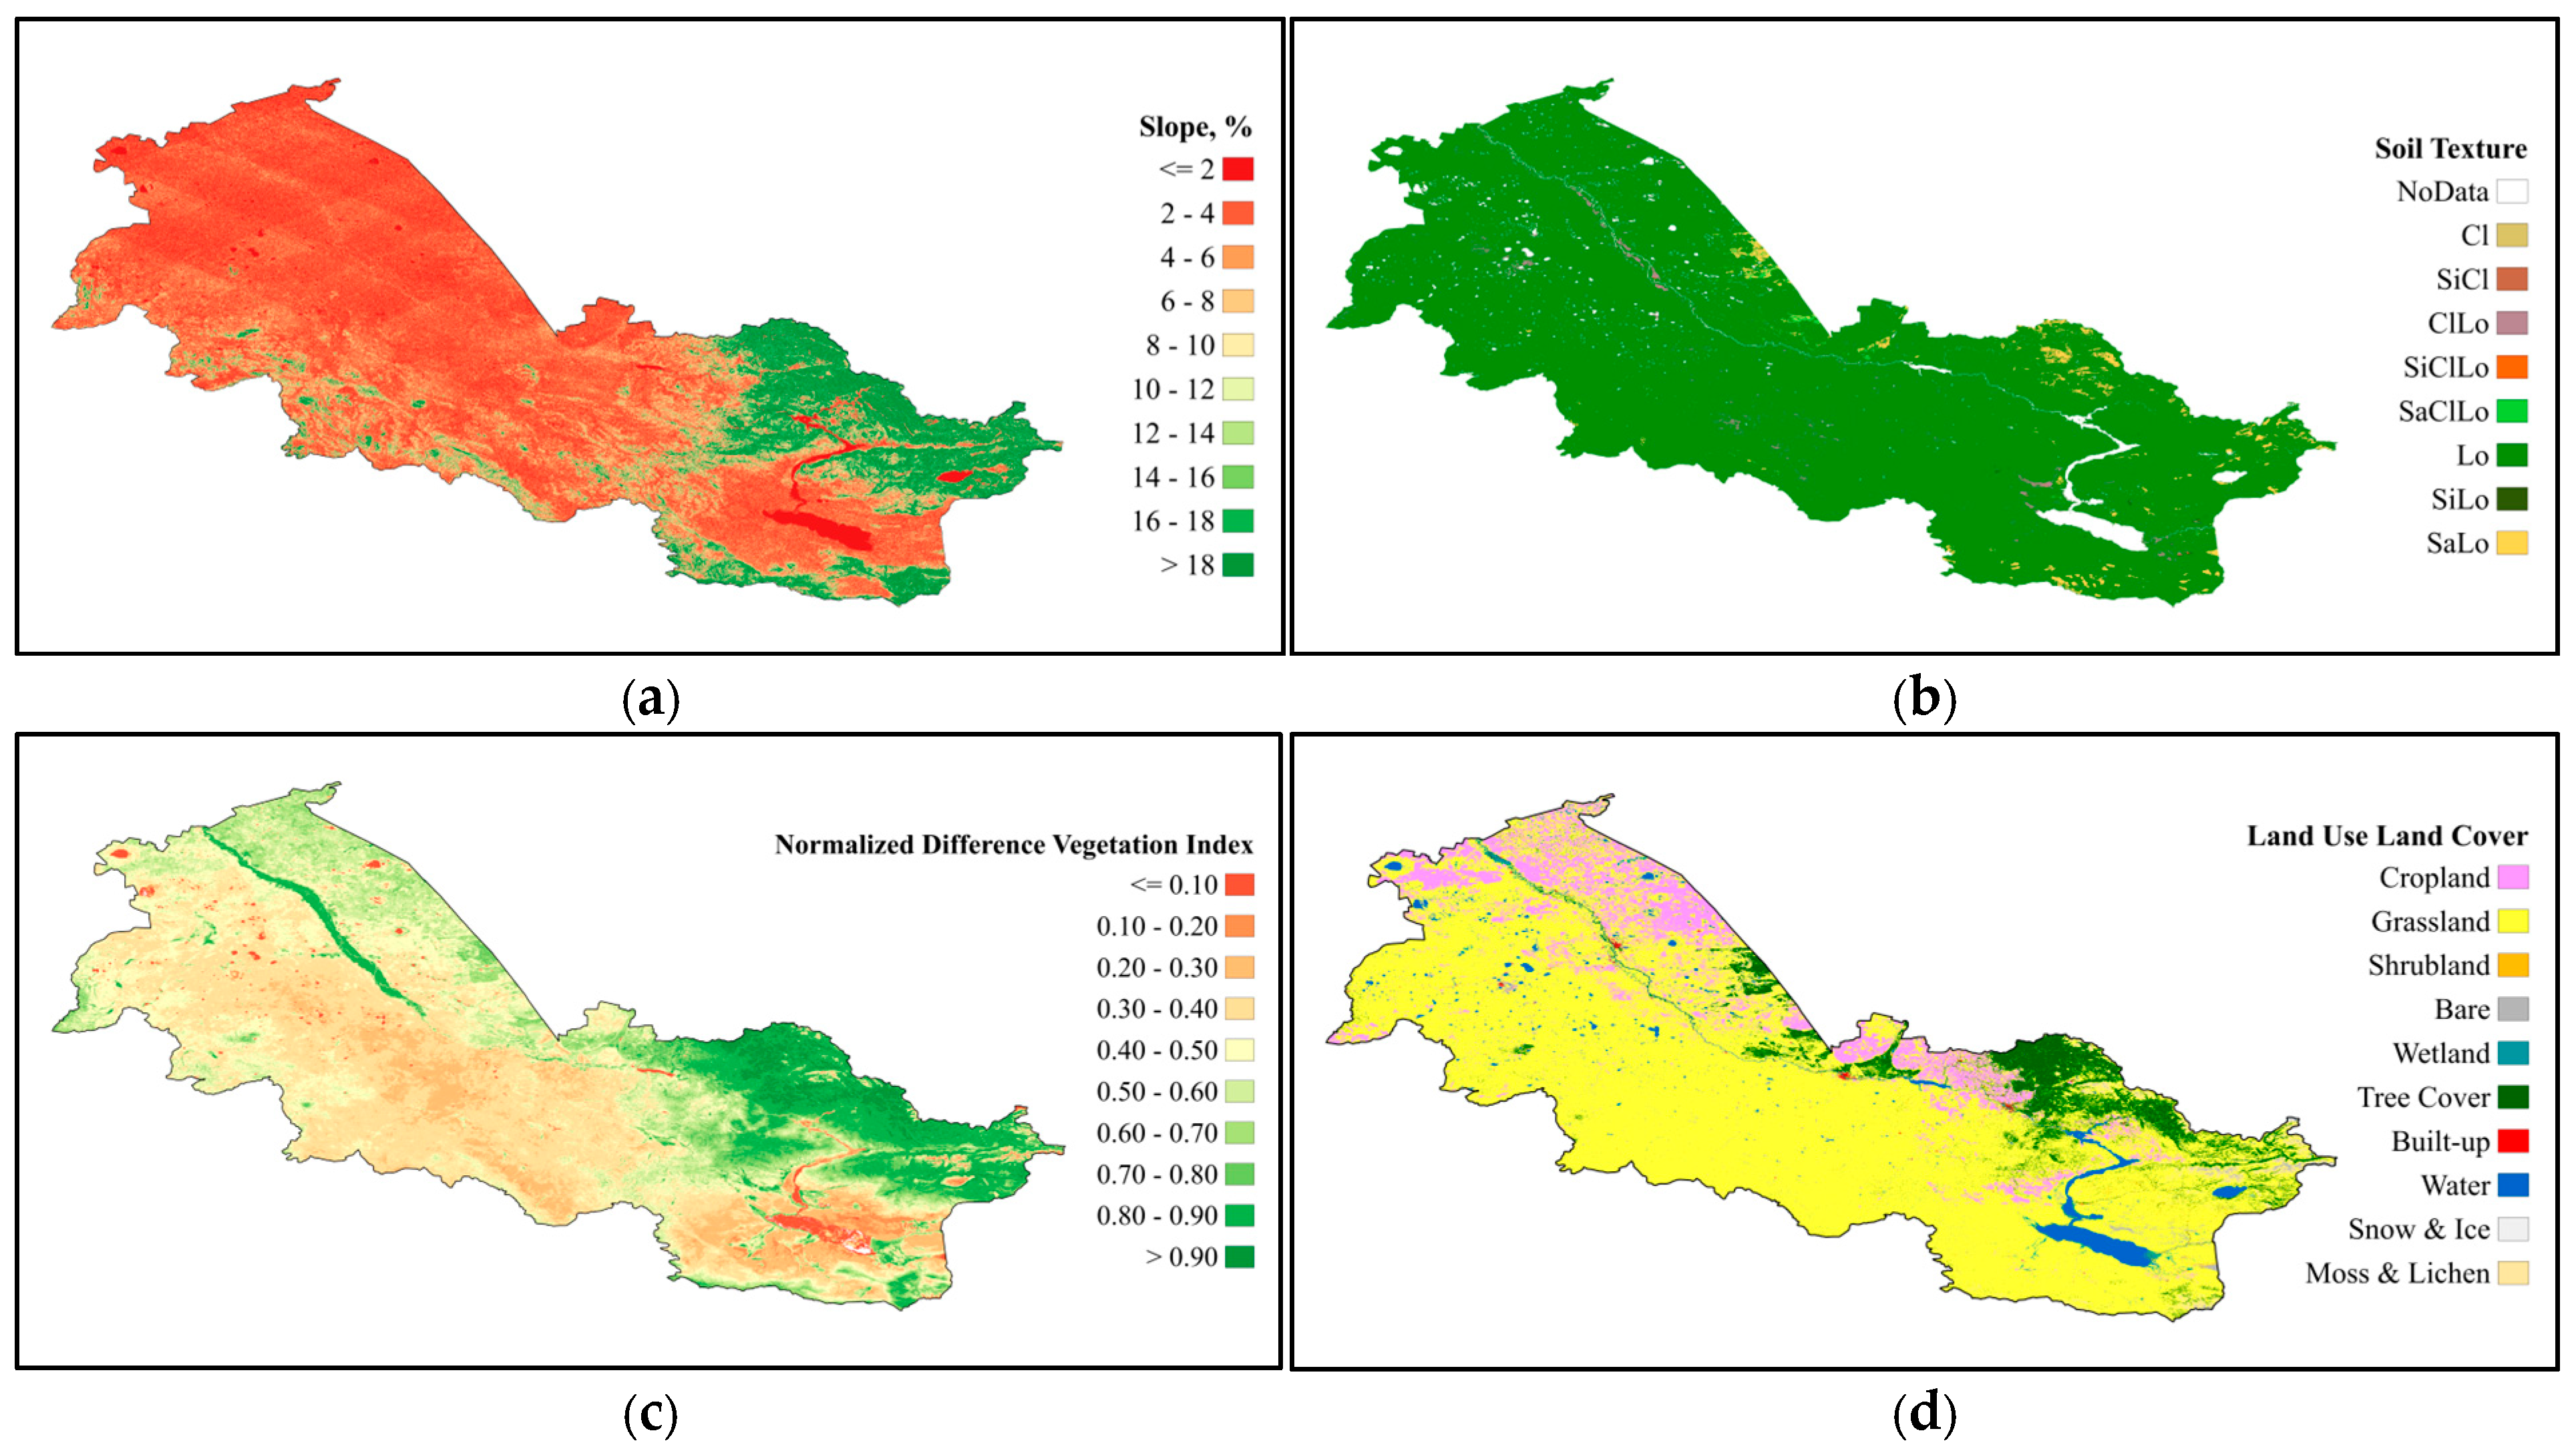
The thematic layers show distinct spatial patterns in the four criteria considered in the suitability assessment (Figure 2). Slope conditions are generally more favorable across the central and northern parts of the basin, while steeper terrain is concentrated mainly in the mountainous eastern areas. Soil texture shows comparatively limited spatial variation across much of the basin, whereas LULC is predominantly characterized by extensive grasslands. NDVI exhibits greater spatial variability, reflecting differences in vegetation conditions across the basin.
Figure 2.
Spatial distribution of the criteria used to assess biophysical suitability for potential irrigation development within the Ertis WMB: (a) slope, (b) soil texture, (c) NDVI, and (d) LULC.
The areal distribution of the selected criteria within the Ertis WMB is presented in Table 7. The basin is characterized predominantly by relatively gentle terrain, with 21% of the area having slopes below 2%, 30% between 2% and 4%, 19% between 4% and 6%, and 6% between 6% and 8%. Together, these classes account for 76% of the basin, while the remaining 24% has slopes greater than 8%. Soil texture shows comparatively limited variation, with loam accounting for approximately 95% of the basin area and the remaining soil-texture classes individually representing only small proportions. Land cover is dominated by grassland, which covers approximately 78% of the basin, followed by cropland (10%) and tree cover (6%); the remaining land-cover types each occupy relatively small proportions. NDVI shows greater variation across the basin, with the largest share of the area (31%) characterized by values between 0.3 and 0.4, while approximately 37% has NDVI values above 0.5.
Table 7.
Percentage area distribution of environmental factor classes within the Ertis WMB.
Following reclassification into the common suitability scale, the areal distribution of each criterion across the S1–NS classes is presented in Table 8. The resulting distributions reflect the different spatial characteristics of the individual criteria, with soil texture predominantly classified as S1 and LULC predominantly as S2, whereas NDVI and slope show a broader distribution across the suitability classes.
Table 8.
Percentage distribution of irrigation suitability classes for the selected assessment factors within the Ertis WMB.
3.2. AHP-Derived Criteria Weights and Consistency
The AHP analysis resulted in criterion weights of 0.51 for slope, 0.26 for NDVI, 0.14 for LULC, and 0.09 for soil texture. Slope therefore had the greatest contribution to the composite suitability score, followed by NDVI, LULC, and soil texture. The calculated consistency ratio was approximately 1%, well below the commonly accepted 10% threshold, indicating acceptable consistency of the pairwise judgments.
3.3. Final Land Suitability Assessment for Potential Irrigation Development
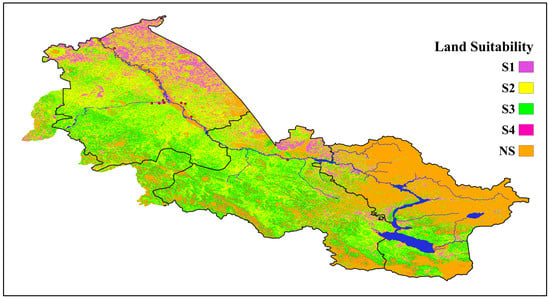
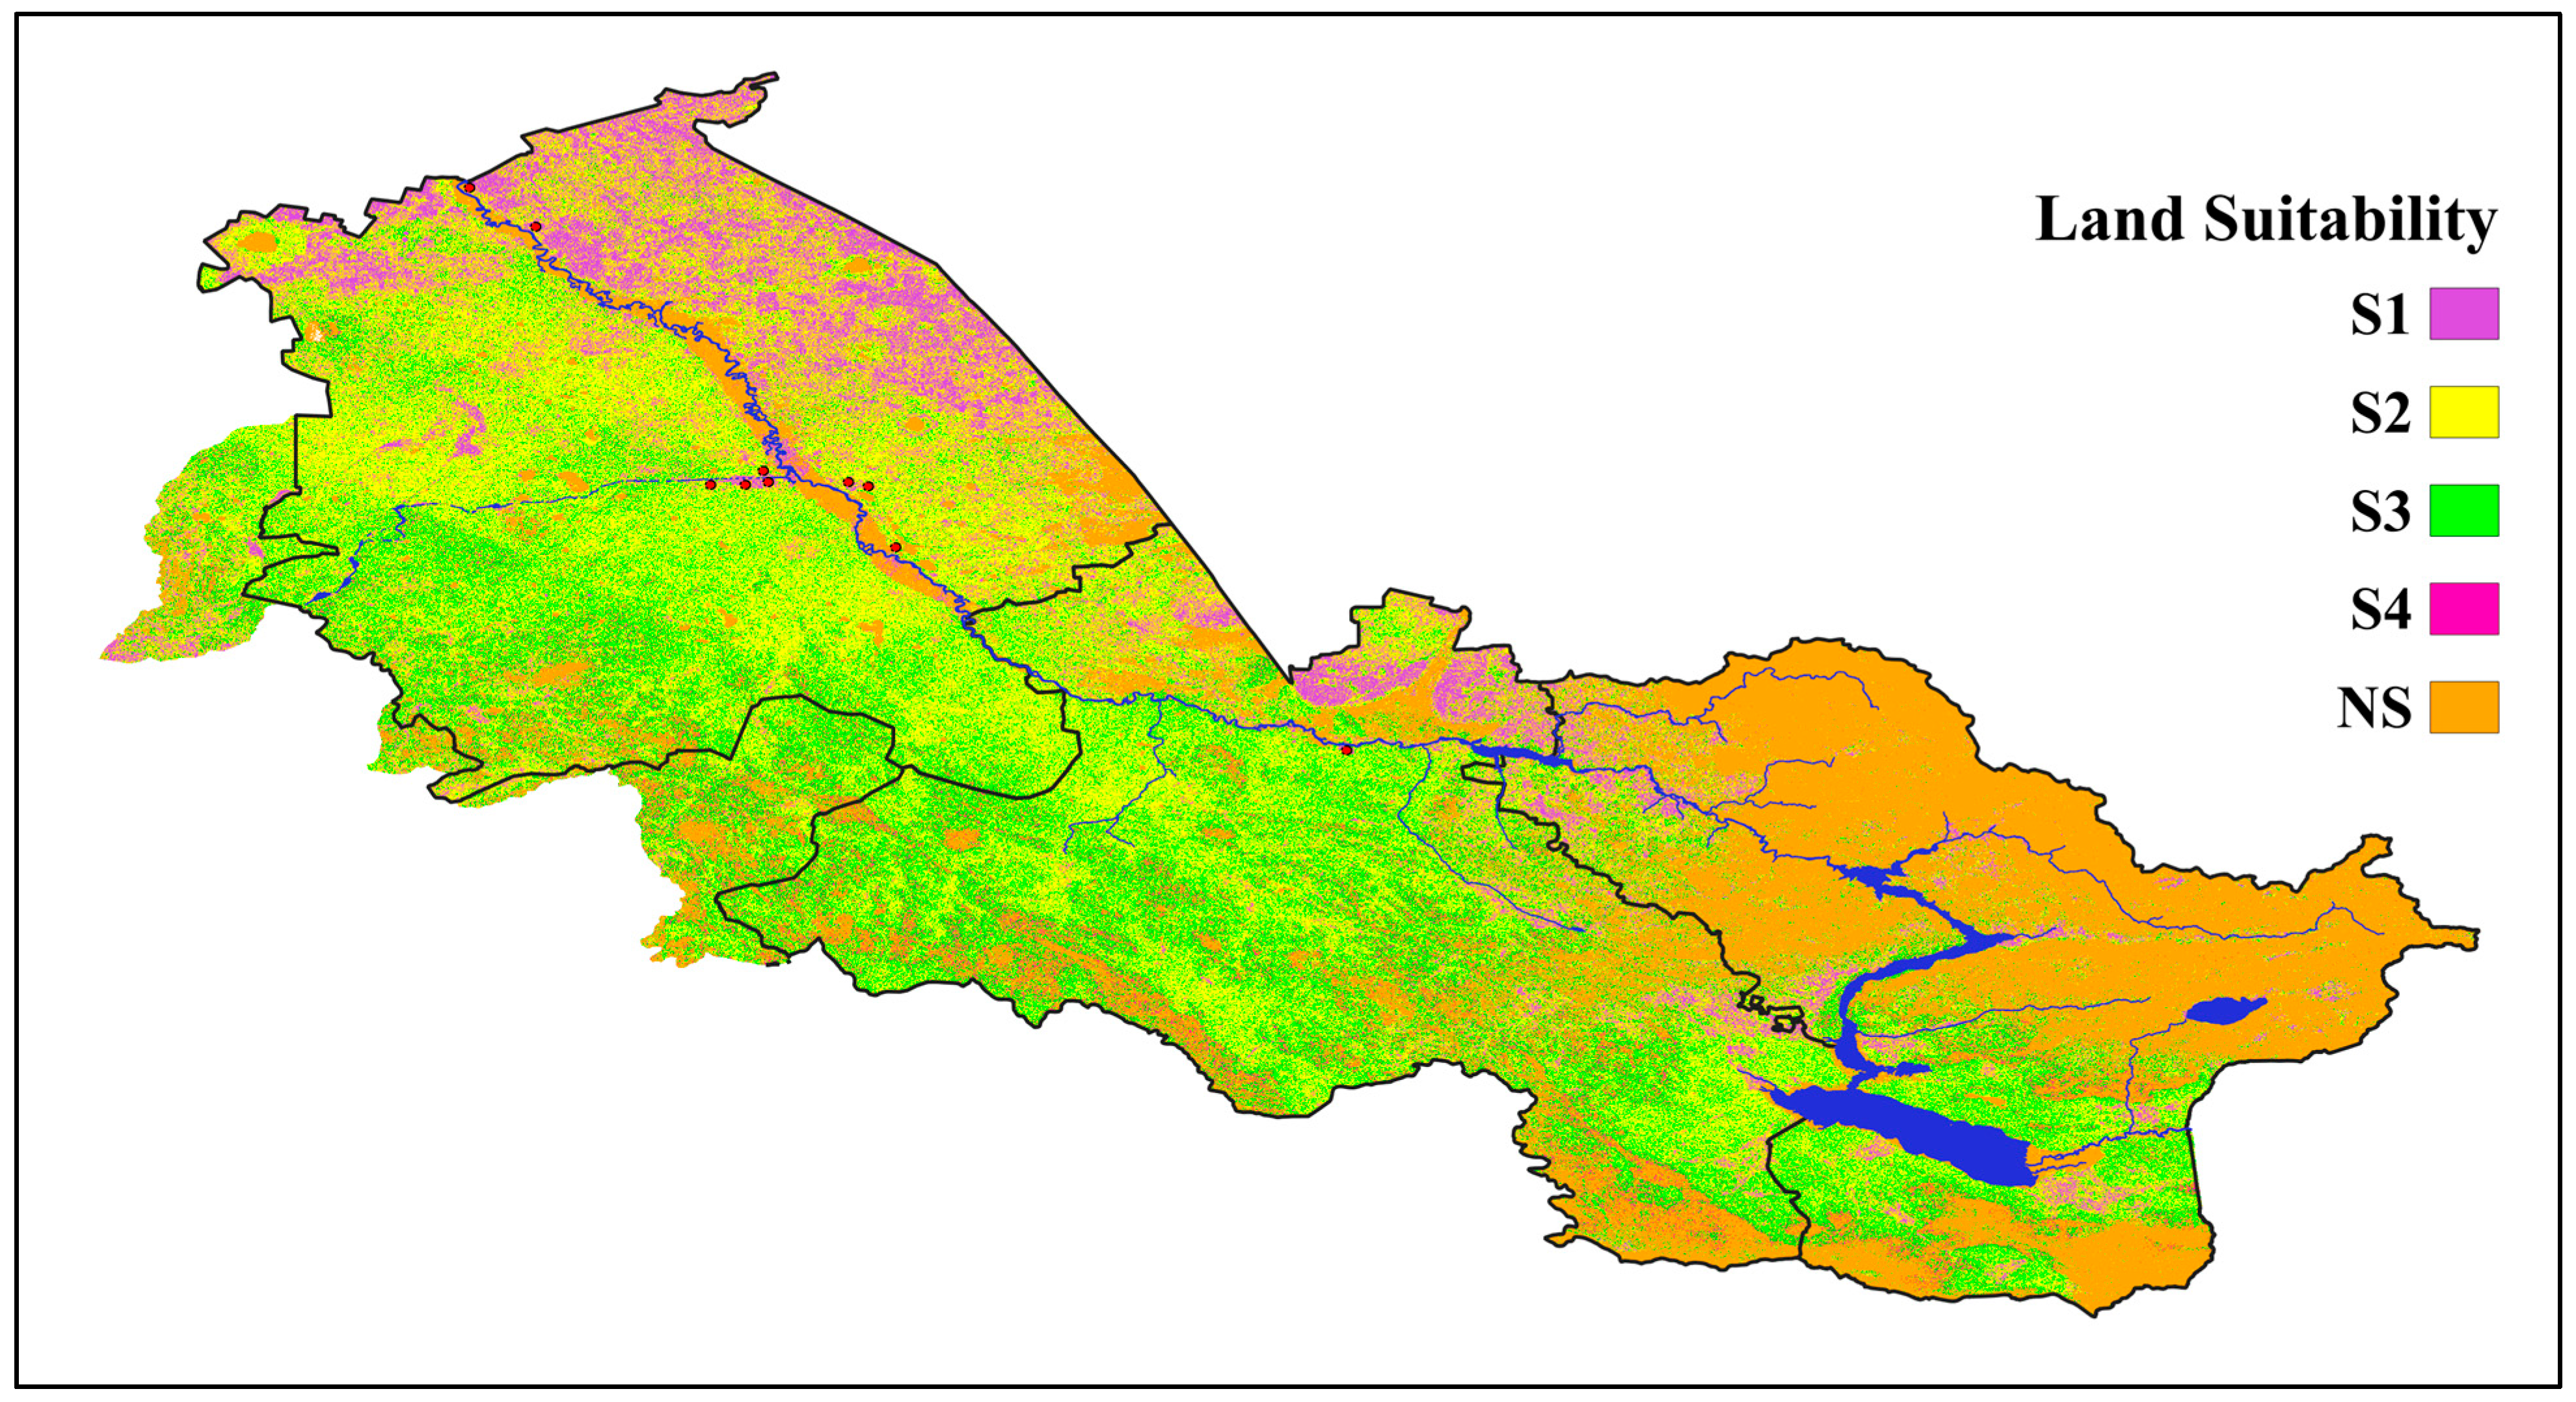
The final land suitability assessment showed substantial spatial variation in the potential for irrigation development across the Ertis WMB (Figure 3 and Table 9). Highly suitable land (S1) accounted for approximately 10% of the basin area, while suitable land (S2) represented the largest share at 43%. Moderately suitable land (S3) covered approximately 18% of the basin, and marginally suitable land (S4) accounted for 2%. The remaining 27% was classified as non-suitable (NS). Overall, the two highest suitability classes (S1 and S2) together covered approximately 53% of the Ertis WMB, indicating a substantial extent of land with favorable biophysical conditions for potential irrigation development.
Figure 3.
Final land suitability map for potential irrigation development within the Ertis WMB, with red dots indicating the locations of image-based validation areas.
Table 9.
Suitability area distribution.
The spatial distribution of the suitability classes shows that favorable areas are distributed across substantial parts of the basin rather than being concentrated in a single location (Figure 3). In contrast, NS areas are more extensive in the eastern part of the basin, where steep mountainous terrain represents an important biophysical constraint. Other NS areas are associated with the spatial constraints applied in the assessment, including potentially flood-prone areas and land-cover types excluded from potential irrigation development.
3.4. Sensitivity Analysis
The sensitivity analysis showed that the overall extent of the two highest suitability classes was relatively stable under moderate changes in the dominant criterion weights (Table 10).
Table 10.
Percentage of the Ertis WMB area within each suitability class under alternative criterion-weight scenarios.
In the baseline scenario, S1 and S2 accounted for 10% and 43% of the basin, respectively, corresponding to a combined S1 + S2 extent of 53%. Increasing or decreasing the slope weight by 20% resulted in the same combined S1 + S2 extent of 53%, although the distribution between S1 and S2 changed. Increasing the NDVI weight by 20% also resulted in 53% of the basin being classified as S1 + S2, whereas decreasing the NDVI weight by 20% increased their combined extent to 58%. Thus, across the ±20% scenarios, the combined S1 + S2 area ranged from 53% to 58%.
A greater change was observed under the equal-weight scenario, in which the combined S1 + S2 extent increased to 69%. This indicates that the overall suitability distribution was less affected by moderate weight perturbations than by removal of the original AHP weighting structure. The NS class remained constant at 27% in all scenarios because the same hard spatial constraints were applied in each case.
3.5. Validation of the Suitability Assessment
The image-based validation showed spatial correspondence between the independently identified validation areas and the higher suitability classes. Of the total area represented by the 10 validation polygons, 75% was classified as S1 and 24% as S2, resulting in 99% of the validation area occurring within the combined S1 + S2 classes. The remaining 1% corresponded to S3, while none of the validation area was classified as S4 or NS (Table 11). These results indicate that the agricultural areas interpreted as irrigated from high-resolution satellite imagery were predominantly located within areas classified by the model as having favorable biophysical conditions for potential irrigation development.
Table 11.
Distribution of the image-based validation area among the final suitability classes.
3.6. Spatial Distribution of Suitability Classes in Relation to the River Network
The distribution of suitability classes was further analyzed across distance zones from the river network to examine the spatial relationship between biophysically suitable land and surface-water sources (Table 12). Suitable land occurred across all analyzed distance zones, including areas located more than 100 km from the river network. The largest share of S2 land occurred within 20 km of the river network, accounting for 12% of the total basin area, followed by 9% at 20–40 km and 7% at 40–60 km. The corresponding shares decreased to 6% at 60–80 km and 4% at 80–100 km, while 5% occurred beyond 100 km. S1 land showed a similar pattern, with 3% of the total basin area occurring within 20 km of the river network and smaller shares distributed across the more distant zones.
Table 12.
Distribution of land suitability classes by distance from the river network in the Ertis WMB, %.
Non-suitable areas were also present across all distance zones, with the largest share occurring within 20 km of the river network. Overall, the occurrence of both suitable and non-suitable classes at different distances indicates that proximity to the river network alone does not determine the spatial pattern of biophysical land suitability.
3.7. Distribution of Suitability Classes by Administrative Region
The distribution of suitability classes was also assessed across the major administrative regions within the Ertis WMB (Table 13). Pavlodar Region contained the largest shares of the two highest suitability classes, with S1 and S2 accounting for approximately 6% and 20% of the total basin area, respectively, while S3 accounted for a further 5%. Abay Region accounted for 2% of the basin area classified as S1, 15% as S2, and 8% as S3. In East Kazakhstan Region, S1 and S2 represented 2% and 5% of the total basin area, respectively, while the NS class accounted for 18%. The parts of the Ertis WMB located within other administrative regions contributed relatively small shares to all suitability classes.
Table 13.
Distribution of irrigation suitability classes by administrative region within the Ertis WMB, %.
4. Discussion
The results of this study indicate substantial biophysical potential for irrigation development within the Ertis WMB, with 53% of the basin classified into the two highest suitability classes (S1 and S2). This pattern reflects the combined influence of generally favorable topographic and soil conditions, extensive grasslands and croplands, and spatial variation in vegetation conditions across the basin. At the same time, the suitability classes are not uniformly distributed, reflecting the influence of individual environmental criteria and the spatial constraints incorporated into the assessment. The comparatively large extent of S1 and S2 land is particularly relevant because the Ertis WMB accounts for approximately 45% of Kazakhstan’s agricultural production [8], while agricultural production within the basin remains predominantly rainfed [5] and is therefore vulnerable to climate variability and extreme weather events [28,29,30]. The substantial extent of land with favorable biophysical conditions for potential irrigation development suggests that, where sufficient water resources and appropriate infrastructure are available, irrigation expansion could provide opportunities to support increased and more stable agricultural production, with potential benefits for agricultural resilience and food security.
The sensitivity analysis provides additional evidence regarding the influence of the AHP weighting scheme on the suitability results. Under the ±20% changes applied independently to the slope and NDVI weights, the combined proportion of S1 and S2 land ranged from 53% to 58%, compared with 53% under the baseline weighting. Although some redistribution occurred between individual suitability classes, the overall extent of the two highest suitability classes remained relatively stable under these moderate changes in the dominant criterion weights. In contrast, assigning equal weights to all four criteria increased the combined S1 and S2 area to 69%, indicating that the suitability pattern was more sensitive to removal of the original AHP weighting structure than to moderate changes in the individual dominant weights. The constant proportion of the NS class (27%) across all scenarios reflects the application of the same hard spatial constraints after the weighted overlay. Overall, these results suggest that the conclusion regarding the substantial extent of biophysically suitable land is relatively robust to moderate changes in the assigned AHP weights, although the larger change under equal weighting demonstrates that criterion weighting remains an important source of uncertainty in the assessment.
The image-based validation provided further support for the spatial plausibility of the suitability assessment. Approximately 99% of the total area represented by the 10 independently identified validation polygons occurred within the two highest suitability classes, with 75% classified as S1 and 24% as S2. The validation areas included both circular fields with patterns consistent with center-pivot irrigation and non-circular agricultural fields interpreted as irrigated based on visible field characteristics and their spatial association with identifiable irrigation channels. Their strong correspondence with the higher suitability classes indicates that areas where irrigation is evident from high-resolution satellite imagery generally coincide with areas identified by the model as having favorable biophysical conditions for potential irrigation development. However, this validation should be interpreted as a spatial plausibility check rather than as a measure of classification accuracy. The 10 image-interpreted validation polygons were concentrated along the Ertis River and associated irrigation channels and therefore do not constitute a spatially representative, basin-wide sample of operational irrigated land.
The distance-based analysis further demonstrates the distinction between biophysical land suitability and proximity to surface-water sources. Suitable land occurred across all distance zones, including areas more than 100 km from the river network, indicating that favorable biophysical conditions are not restricted to areas close to rivers. However, distance from the river network does not directly represent water accessibility or irrigation feasibility, which also depend on water availability, terrain, pumping requirements, and conveyance infrastructure. Therefore, the practical feasibility of irrigation development in the identified suitable areas requires further assessment of water availability, allocation, infrastructure, and water conveyance requirements.
The administrative analysis provides an additional perspective on the spatial distribution of suitable land. Pavlodar Region contained the largest shares of S1 and S2 land within the basin, followed by Abay Region, whereas East Kazakhstan Region contained a comparatively large share of NS land. This pattern is consistent with the broader spatial distribution of suitability across the basin, particularly the greater topographic constraints in the mountainous eastern areas. However, because the reported regional values represent shares of the total basin area rather than proportions normalized by the area of each administrative region, they should not be interpreted as a direct comparison of the relative suitability of the regions.
Several limitations should be considered when interpreting the suitability assessment. First, the soil criterion represents soil texture only and does not account for other properties relevant to irrigation, such as soil salinity, drainage conditions, or groundwater depth. Second, the use of global land-cover data introduces uncertainty associated with possible misclassification among cropland, grassland, and other vegetation classes, and no independent regional accuracy assessment of the LULC dataset was performed. Similarly, although all criterion layers were processed on a common 30 m computational grid, this does not increase the intrinsic spatial resolution of the coarser input datasets, particularly the 250 m soil-texture and NDVI data. These factors mean that the resulting suitability map is most appropriately interpreted at the basin and regional scales rather than as a field-level assessment.
Additional uncertainty is associated with the interpretation of NDVI and the spatial constraints. NDVI represents observed vegetation condition and may therefore partly reflect existing land management and water availability rather than inherent land suitability alone. Because both NDVI and LULC contain information related to existing surface conditions, their inclusion may also favor areas that are already vegetated or agriculturally utilized; however, they were used for different purposes, with LULC representing land-cover compatibility and NDVI representing vegetation condition. The HAND-based exclusion identifies low-lying areas that are potentially susceptible to flooding but should be regarded as a terrain-based screening rather than a detailed flood-hazard assessment. The HAND ≤ 8 m threshold was not associated with a specific flood return period and was not independently validated against a regional flood-hazard product or systematic historical flood-extent dataset. In addition, built-up areas were excluded using the LULC dataset, but no additional buffer around settlements was applied. Legally protected natural areas were not included as a separate exclusion layer; consequently, areas identified as biophysically suitable may include land subject to legal or environmental restrictions and should not be interpreted as automatically available for irrigation development. These limitations should be considered when using the results to identify areas for more detailed investigation.
The practical development of the identified suitable areas must therefore be considered within the broader water-management context of the Ertis WMB. As the Ertis is a transboundary river shared by China, Kazakhstan, and Russia and supports multiple water uses, including municipal and industrial supply, energy production, agriculture, and environmental needs, the presence of biophysically suitable land does not itself imply that sufficient water is available for irrigation expansion. The suitability map should therefore be regarded as a first-stage spatial screening tool for identifying areas where more detailed assessments of water availability, irrigation infrastructure, environmental constraints, and economic feasibility can subsequently be undertaken.
5. Conclusions
This study identified substantial biophysical potential for irrigation development within the Ertis WMB, with 53% of the basin classified as highly suitable (S1) or suitable (S2). Suitable land was widely distributed across the basin, including areas both close to and distant from the river network. Sensitivity analysis and image-based validation provided additional support for the overall suitability pattern.
The resulting suitability map provides a spatial basis for identifying areas for further assessment rather than representing the actual extent of land that can be irrigated. Future planning should integrate water availability, irrigation infrastructure, and environmental and economic considerations to evaluate the feasibility of sustainable irrigation development in the identified areas.
Author Contributions
Conceptualization, N.A. and A.Y.; methodology, N.A.; software, K.K. (Kudaibergen Kyrgyzbay); validation, A.Y., N.Z. and K.K. (Kudaibergen Kyrgyzbay); formal analysis, N.A.; investigation, A.Y.; resources, N.Z.; data curation, N.Z.; writing—original draft preparation, N.A.; writing—review and editing, K.K. (Kristina Konstantinova).; visualization, K.K. (Kudaibergen Kyrgyzbay); supervision, N.B. (Nurlan Bekmukhamedov); project administration, N.B. (Nurlan Bekmukhamedov); funding acquisition, N.B. (Nurlan Balgabayev). All authors have read and agreed to the published version of the manuscript.
Funding
This research was funded by the Ministry of Water Resources and Irrigation of the Republic of Kazakhstan under Grant No. BR23791322 for the period 2024–2026.
Data Availability Statement
The primary datasets used in this study, including SRTM, ESA WorldCover, OpenLandMap, MODIS MOD13Q1, and MERIT Hydro, are publicly available from their respective repositories, with sources provided in Table 1. The derived suitability layers and intermediate outputs generated during the analysis are available from the corresponding author upon reasonable request.
Acknowledgments
During the preparation of this manuscript/study, the author(s) used ChatGPT (GPT-5.6 Luna) for the purposes of grammar checking and language polishing. The authors have reviewed and edited the output and take full responsibility for the content of this publication.
Conflicts of Interest
The authors declare no conflicts of interest.
Abbreviations
The following abbreviations are used in this manuscript:
| AHP | Analytic Hierarchy Process |
| CI | The Consistency Index |
| CR | Consistency Ratio |
| DEM | Digital Elevation Model |
| FAO | Food and Agriculture Organization |
| GIS | Geographic Information System |
| LULC | Land Use and Land Cover |
| MCDA | Multi-Criteria Decision Analysis |
| NDVI | Normalized Difference Vegetation Index |
| RI | Random Index |
| WMB | Water Management Basin |
References
- Yegizbayeva, A.; Koshim, A.G.; Bekmuhamedov, N.; Aliaskarov, D.T.; Alimzhanova, N.; Aitekeyeva, N. Satellite-Based Drought Assessment in the Endorheic Basin of Lake Balkhash. Front. Environ. Sci. 2024, 11, 1291993. [Google Scholar] [CrossRef] [Scilit]
- Aitekeyeva, N.; Li, X.; Guo, H.; Wu, W.; Shirazi, Z.; Ilyas, S.; Yegizbayeva, A.; Hategekimana, Y. Drought Risk Assessment in Cultivated Areas of Central Asia Using MODIS Time-Series Data. Water 2020, 12, 1738. [Google Scholar] [CrossRef] [Scilit]
- Yapiyev, V.; Ongdas, N.; Saidaliyeva, Z.; Zhiyenbek, A.; Smogulova, T.; Baigaliyeva, M.; Prikaziuk, E. Baseline Information and Regionalization of the Large River Basins of Kazakhstan. Front. Water 2025, 7, 1601671. [Google Scholar] [CrossRef] [Scilit]
- Ministry of Ecology and Natural Resources of the Republic of Kazakhstan; RSE “Kazhydromet”; Scientific Research Center. Annual Hydrological Bulletin 2023; Ministry of Ecology and Natural Resources of the Republic of Kazakhstan, RSE “Kazhydromet”, Scientific Research Center: Astana, Kazakhstan, 2024.
- Savin, T.; Morgounov, A. Organic Crop Production in Kazakhstan: Agronomic Solutions and Bioresources. Resources 2025, 14, 108. [Google Scholar] [CrossRef] [Scilit]
- Li, Z.; Fang, G.; Chen, Y.; Duan, W.; Mukanov, Y. Agricultural Water Demands in Central Asia under 1.5 °C and 2.0 °C Global Warming. Agric. Water Manag. 2020, 231, 106020. [Google Scholar] [CrossRef] [Scilit]
- Zanaga, D.; Van De Kerchove, R.; De Keersmaecker, W.; Souverijns, N.; Brockmann, C.; Quast, R.; Wevers, J.; Grosu, A.; Paccini, A.; Vergnaud, S.; et al. ESA WorldCover 10 m 2020 V100. 2021. Available online: https://zenodo.org/record/5571936 (accessed on 27 August 2026).
- Vinokurov, E.; Ahunbaev, A.; Chuyev, S.; Adakhayev, A.; Sarsembekov, T. The Irtysh River Basin: Transboundary Challenges and Practical Solutions; Report 25/2; Eurasian Development Bank: Almaty, Kazakhstan, 2025; Available online: https://www.cawater-info.net/library/eng/eabr-irtysh-report-en.pdf (accessed on 27 August 2026).
- Hengl, T. Soil Texture Classes (USDA System) for 6 Soil Depths (0, 10, 30, 60, 100 and 200 cm) at 250 m (Version V02) [Data Set]. 2018. Available online: https://zenodo.org/records/2525817 (accessed on 27 August 2026).
- Kumar, A.; Pant, S. Analytical Hierarchy Process for Sustainable Agriculture: An Overview. MethodsX 2023, 10, 101954. [Google Scholar] [CrossRef] [Scilit] [PubMed]
- Singha, C.; Swain, K.C. Land Suitability Evaluation Criteria for Agricultural Crop Selection: A Review. Agric. Rev. 2016, 37, 125–132. [Google Scholar] [CrossRef] [Scilit]
- Yegizbayeva, A.; Aitekeyeva, N.; Konstantinova, K.; Bekmukhamedov, N.; Zhumabay, N.; Balgabayev, N. Geospatial Technology Utilization for Evaluating Land Suitability for Irrigation. Sustainability 2025, 17, 10131. [Google Scholar] [CrossRef] [Scilit]
- Zhang, J.; Sun, H.; Jiang, X.; He, J. Evaluation of Development Potential of Cropland in Central Asia. Ecol. Indic. 2022, 142, 109250. [Google Scholar] [CrossRef] [Scilit]
- Mideksa, G.; Temesgen, T. Irrigation Water Potential and Land Suitability Assessment in Kurfa Chele-Girawa Watershed, Wabe Shebelle River Basin, Ethiopia. Turk. J. Agric. Food Sci. Technol. 2020, 8, 139–146. [Google Scholar] [CrossRef] [Scilit]
- Wubalem, A. Modeling of Land Suitability for Surface Irrigation Using Analytical Hierarchy Process Method in Belessa Districts, Northwestern Ethiopia. Heliyon 2023, 9, e13937. [Google Scholar] [CrossRef] [Scilit] [PubMed]
- Mandal, B.; Dolui, G.; Satpathy, S. Land Suitability Assessment for Potential Surface Irrigation of River Catchment for Irrigation Development in Kansai Watershed, Purulia, West Bengal, India. Sustain. Water Resour. Manag. 2018, 4, 699–714. [Google Scholar] [CrossRef] [Scilit]
- Yohannes, H.; Soromessa, T. Land Suitability Assessment for Major Crops by Using GIS-Based Multi-Criteria Approach in Andit Tid Watershed, Ethiopia. Cogent Food Agric. 2018, 4, 1470481. [Google Scholar] [CrossRef] [Scilit]
- Han, C.; Chen, S.; Yu, Y.; Xu, Z.; Zhu, B. Evaluation of Agricultural Land Suitability Based on RS, AHP, and MEA: A Case Study in Jilin Province, China. Agriculture 2021, 11, 370. [Google Scholar] [CrossRef] [Scilit]
- Beck, H.E.; McVicar, T.R.; Vergopolan, N.; Berg, A.; Lutsko, N.J.; Dufour, A.; Zeng, Z.; Jiang, X.; Van Dijk, A.I.J.M.; Miralles, D.G. Geiger Maps for 1901–2099 Based on Constrained CMIP6 Projections. Sci. Data 2023, 10, 724. [Google Scholar] [CrossRef] [Scilit] [PubMed]
- Muñoz Sabater, J. ERA5-Land Monthly Averaged Data from 1950 to Present; Copernicus Climate Change Service (C3S) Climate Data Store (CDS). 2019. Available online: https://cds.climate.copernicus.eu/datasets/reanalysis-era5-land-monthly-means (accessed on 27 August 2026).
- Farr, T.G.; Rosen, P.A.; Caro, E.; Crippen, R.; Duren, R.; Hensley, S.; Kobrick, M.; Paller, M.; Rodriguez, E.; Roth, L.; et al. The Shuttle Radar Topography Mission. Rev. Geophys. 2007, 45, RG2004. [Google Scholar] [CrossRef] [Scilit]
- Didan, K. MODIS/Terra Vegetation Indices 16-Day L3 Global 250m SIN Grid V061 [Data Set]; NASA Land Processes Distributed Active Archive Center: Sioux Falls, SD, USA, 2021. [CrossRef]
- Yamazaki, D.; Ikeshima, D.; Sosa, J.; Bates, P.D.; Allen, G.H.; Pavelsky, T.M. MERIT Hydro: A High-Resolution Global Hydrography Map Based on Latest Topography Datasets. Water Resour. Res. 2019, 55, 5053–5073. [Google Scholar] [CrossRef] [Scilit]
- FAO. A Framework for Land Evaluation; Food and Agriculture Organization of the United Nations: Rome, Italy, 1981; Available online: https://www.fao.org/4/x5310e/x5310e00.htm (accessed on 28 August 2026).
- Das, A.C.; Noguchi, R.; Ahamed, T. Integrating an Expert System, GIS, and Satellite Remote Sensing to Evaluate Land Suitability for Sustainable Tea Production in Bangladesh. Remote Sens. 2020, 12, 4136. [Google Scholar] [CrossRef] [Scilit]
- Saaty, T.L. Decision Making with the Analytic Hierarchy Process. Int. J. Serv. Sci. 2008, 1, 83–98. [Google Scholar] [CrossRef] [Scilit]
- Chen, Y.; Yu, J.; Khan, S. Spatial sensitivity analysis of multi-criteria weights in GIS-based land suitability evaluation. Environ. Model. Softw. 2010, 25, 1582–1591. [Google Scholar] [CrossRef] [Scilit]
- World Bank. Agricultural Insurance Feasibility Study, Kazakhstan; World Bank: Washington, DC, USA, 2011. [Google Scholar]
- Radelyuk, I.; Zhang, L.; Assanov, D.; Maratova, G. A State-of-the-Art and Future Perspectives of Transboundary Rivers in the Cold Climate—A Systematic Review of Irtysh River. J. Hydrol. Reg. Stud. 2022, 42, 101173. [Google Scholar] [CrossRef] [Scilit]
- Fugazza, D.; Shaw, T.E.; Mashtayeva, S.; Brock, B. Inter-Annual Variability in Snow Cover Depletion Patterns and Atmospheric Circulation Indices in the Upper Irtysh Basin, Central Asia. Hydrol. Process. 2020, 34, 3738–3757. [Google Scholar] [CrossRef] [Scilit]

Disclaimer/Publisher’s Note: The statements, opinions and data contained in all publications are solely those of the individual author(s) and contributor(s) and not of MDPI and/or the editor(s). MDPI and/or the editor(s) disclaim responsibility for any injury to people or property resulting from any ideas, methods, instructions or products referred to in the content. |
© 2026 by the authors. Licensee MDPI, Basel, Switzerland. This article is an open access article distributed under the terms and conditions of the Creative Commons Attribution (CC BY) license.