


Abstract
Accurate weather-regime classification is increasingly important for climate-sensitive decision-making in agriculture, aviation, disaster preparedness, and territorial planning, particularly in regions where strong climatic heterogeneity complicates conventional operational workflows. This study proposes a machine learning-based framework for broad-regime weather classification over Morocco using hourly METAR observations collected from 22 meteorological stations between July 2022 and February 2024. The proposed workflow integrates data cleaning, missing-value imputation, feature transformation, categorical encoding, class-imbalance handling, and model optimization under a leakage-safe experimental protocol. To preserve temporal integrity, observations were chronologically split into training, validation, and independent test subsets; SMOTE and random undersampling were applied exclusively to the training subset, whereas the validation and test subsets retained their original class distributions. Seven classifiers were evaluated, including XGBoost, LightGBM, CatBoost, Random Forest, Gradient Boosting, Support Vector Machine, and Logistic Regression, with hyperparameters optimized using Optuna. The results show that optimized boosting models are particularly effective for Moroccan station-based weather classification. XGBoost achieved the highest test-set accuracy of 95.1%, followed by LightGBM at 94.7% and CatBoost at 93.8%, with optimization improving accuracy by approximately 8–12 percentage points compared with baseline configurations. Because the dataset exhibits class imbalance, macro-averaged precision, recall, and F1-score were emphasized alongside accuracy to provide a more reliable assessment across weather classes. Confusion-matrix analysis indicates improved recognition of underrepresented regimes, especially Dust/Sand events, while residual confusion between Fog/Haze and Rain/Storm reflects both physical overlap and the limits of a four-class METAR taxonomy. Overall, the findings demonstrate that optimized ensemble learning can provide a robust, computationally efficient, and operationally relevant classification layer for regional meteorological decision support in Morocco, while future work should extend the framework to longer time series, finer weather taxonomies, and external regional validation.
1. Introduction
Weather classification plays a central role in meteorological analysis, with direct implications for agriculture, disaster risk management, transportation [1,2,3], energy-system operation, and renewable-energy planning [4,5,6,7,8]. Traditional weather forecasting approaches rely largely on numerical weather prediction (NWP) models, which simulate atmospheric processes using physically based equations. Although these models have improved substantially, they still generate high-dimensional outputs and may be less effective for localized classification, regional adaptation, and short-term operational decision-making [1].
Recent advancements in Artificial Intelligence (AI), particularly Machine Learning (ML), have opened new opportunities for automated weather classification, offering promising alternatives to traditional methods [2]. Machine learning models exploit historical meteorological observations to identify complex patterns and classify weather conditions with high accuracy. By utilizing various meteorological features such as temperature, humidity, wind speed, pressure, and visibility, these models can classify or detect weather conditions such as clear, foggy/hazy, rainy/stormy, or dusty/sandy [3].
This study focuses on machine learning-based classification using optimized ensemble models and baseline classifiers rather than deep learning architectures.
1.1. Literature Review and Challenges in Weather Classification
Weather classification is inherently complex because atmospheric processes evolve across interacting spatial and temporal scales and are influenced by multiple variables, including temperature, humidity, pressure, and solar radiation. In the pursuit of more accurate classification, researchers have progressively turned from purely physical models to data-driven ones, seeking to combine domain knowledge with statistical learning. Table 1 offers a comparative view of methods ranging from classical physical modeling to machine learning-based and AI-assisted techniques, highlighting their respective trade-offs.
Table 1.
Comparative Analysis of Traditional and Machine Learning-Based Weather Classification Methods.
Table 1 shows that each methodological family addresses a specific segment of the weather-classification problem. Traditional NWP models remain the scientific backbone of meteorology: they are grounded in first-principles physics, produce forecasts consistent with atmospheric dynamics, and offer high interpretability. However, their high computational demands and limited flexibility in real-time classification tasks may restrict their operational applicability [4,5].
By contrast, classical machine learning models, such as SVM, logistic regression, and decision trees, are easier to deploy and interpret but often struggle to capture nonlinear, high-dimensional interactions among meteorological variables such as wind, temperature, humidity, pressure, and solar radiation [8,9].
Ensemble and boosting frameworks (e.g., Random Forest, Gradient Boosting, XGBoost, LightGBM) provide an effective middle ground. By aggregating multiple base learners, these methods mitigate overfitting, reduce variance, and improve generalization across heterogeneous datasets [9,10]. In weather classification tasks, especially when input features are numerous and diverse, these approaches often outperform simpler machine learning baselines.
In this study, we adopt an optimized ensemble learning approach based on XGBoost, LightGBM, and CatBoost. These models are automatically tuned using Optuna and combined with resampling strategies to address class imbalance. Model interpretability was limited to tree-based feature-importance analysis.
A persistent and critical challenge in meteorological classification is class imbalance: rare yet impactful events such as storms, extreme temperatures, and heavy precipitation are often underrepresented in observational datasets. Techniques such as SMOTE and related over/under-sampling strategies can help rebalance the training distribution and enhance sensitivity to minority classes when applied only to the training subset after data splitting [13]. At the same time, systematic model optimization is essential for reliable performance. Frameworks such as Optuna and Bayesian optimization have become widely used tools, enabling robust and automated exploration of the hyperparameter space and frequently outperforming manual tuning or exhaustive grid search approaches [14].
Taken together, these observations confirm that no single approach provides a universal solution. The optimal method depends on data characteristics (station density, measurement frequency, feature diversity), computational constraints, and task objectives (e.g., detecting extreme versus “normal” regimes). In practice, machine learning and ensemble-based strategies that combine predictive accuracy, robustness, interpretability, and computational feasibility tend to deliver superior accuracy and stability, particularly in complex and heterogeneous meteorological environments.
This study adopts an optimized ensemble-learning approach based on XGBoost, LightGBM, and CatBoost. These models are automatically tuned using Optuna, combined with resampling techniques to address class imbalance, and interpreted through tree-based feature-importance metrics. By situating the Moroccan meteorological context within the broader literature on machine learning-based weather classification, this research demonstrates how regional constraints such as sparse station coverage and pronounced climatic heterogeneity can be effectively addressed without compromising either predictive accuracy or operational relevance.
1.2. Objectives and Contributions
This paper introduces a machine learning-based framework for weather classification using structured METAR observations collected from 22 stations across Morocco. While many existing studies emphasize satellite imagery or global numerical weather prediction outputs, this work focuses on ground-based station observations and optimized ensemble learning models. The objective is to train, compare, and optimize multiple machine learning classifiers for broad-regime weather classification in a regional Moroccan context.
The primary contributions of this work are as follows:
- Data Preprocessing and Class Balancing: The study addresses the inherent class imbalance in meteorological datasets by employing sampling strategies such as SMOTE and random undersampling applied only to the training subset after data splitting, thereby improving model learning while avoiding data leakage during validation and testing.
- Comparative Modeling and Optimization: A set of candidate classifiers, including Logistic Regression, SVM, Random Forest, Gradient Boosting, XGBoost, LightGBM, and CatBoost, is systematically evaluated. Their hyperparameters are optimized using Optuna-based Bayesian optimization to ensure a fair and reproducible comparison [14,15].
- Regional Focus on Moroccan Station Data: The study leverages a structured METAR dataset collected from 22 meteorological stations across Morocco between July 2022 and February 2024, highlighting region-specific challenges and offering insights into local weather classification dynamics.
- Comprehensive Evaluation and Diagnostic Analysis: All models are assessed using standard and macro-averaged classification metrics, including accuracy, precision, recall, F1-score, and confusion-matrix analysis, to identify frequent misclassification patterns between meteorologically similar classes and to characterize model behavior.
- Relevance to Operational Sectors: The findings have practical implications for agriculture (e.g., irrigation scheduling), aviation (classification of flight-relevant weather conditions), and disaster preparedness (storm, fog, and dust warning systems).
By implementing and fine-tuning machine learning-based classification models on Moroccan station data, this study contributes to the expanding field of localized machine learning applications in meteorology and helps fill a persistent research gap in weather classification for North Africa.
Unlike studies based primarily on satellite imagery or global NWP outputs, this work focuses on structured station-based METAR observations in Morocco, thereby addressing a regional gap in machine learning-based weather classification for North Africa.
1.3. Study Area and Station Network
Morocco is located between approximately 21° N and 36° N latitude and 17° W and 1° W longitude, encompassing a remarkable range of climatic and topographic conditions. The country spans Mediterranean climates in the north, mountainous and semi-arid environments in the interior, and Saharan desert conditions in the south. This climatic heterogeneity is shaped by the Atlantic Ocean, the Mediterranean Sea, continental influences, and the orographic barriers formed by the Rif and Atlas Mountain ranges [8].
The dataset used in this study provides a granular view of Morocco’s atmospheric diversity, covering arid, coastal, and mountainous environments. By integrating localized station-based observations, it supports fine-scale analysis of meteorological variability across the country’s climatic zones and improves the contextual relevance of weather-classification models tailored to Morocco.
Precipitation and temperature patterns vary considerably across the country: the northern and mountainous areas receive abundant rainfall, whereas the interior plains and southern regions remain arid to hyper-arid. This natural diversity provides a rich framework for assessing the performance of machine learning-based weather classification models across distinct climatic regimes.
For this study, 22 meteorological stations were selected to represent Morocco’s climatic and topographic diversity while ensuring sufficient data availability and reliability. The selection process was guided by three main criteria:
- Spatial representativeness: covering coastal, inland, mountainous, and desert zones to capture major climatic gradients;
- Data completeness and reliability: including stations with sufficient temporal coverage, minimal missing values and consistent instrumentation;
- Elevation and topographic diversity: including sites at low, mid, and high altitudes to capture various microclimatic conditions.
This multi-station network enables the models to learn from a broad spectrum of weather regimes and microclimates, thereby supporting robustness, adaptability, and generalization across Moroccan territory, as presented in Figure 1.
Figure 1.
Topographic map of Morocco showing the airport weather stations (METAR sites) used in this study.
2. Dataset and Preprocessing
This section presents the data sources and preprocessing steps used to build the weather-classification models. It first describes the METAR-based meteorological datasets collected across different Moroccan regions, followed by the main statistical characteristics of the meteorological variables. The subsequent subsections detail the preprocessing workflow and feature engineering operations applied prior to model training and evaluation.
2.1. Data Source and Collection
This study used a comprehensive dataset derived from Meteorological Aerodrome Reports (METAR) collected from 22 meteorological stations across Morocco. The dataset covers the period from 1 July 2022, at 00:00 to 17 February 2024, at 23:30, with hourly observations. These data were extracted from the Ogimet platform [16], a widely recognized provider of real-time and historical meteorological observations. Ogimet’s archival system provides access to consistent historical meteorological observations, making it a useful resource for analyzing temporal and spatial variations in weather conditions.
The METAR reports provide detailed measurements of several meteorological parameters, including:
- Temperature (°C);
- Relative humidity (%);
- Pressure, including altimeter setting and mean sea-level pressure (hPa);
- Visibility (km);
- Wind direction and speed expressed in degrees and knots, respectively;
- Cloud cover and sky condition codes;
- Precipitation type and intensity.
The dataset consists exclusively of meteorological observations and does not include personal, human-subject, or sensitive information. Therefore, no ethical approval was required for data collection or analysis.
2.2. Exploratory Data Analysis (EDA)
The exploratory data analysis (EDA) was conducted in Python 3.10, combining several libraries according to their analytical roles. Pandas and NumPy were used for data ingestion, cleaning, and statistical summarization; Matplotlib (3.8.4) and Seaborn (0.13.2) were used to visualize variable distributions and relationships, whereas SciPy supported hypothesis testing and correlation analysis. This combination of tools ensured an integrated workflow that linked descriptive statistics, anomaly detection, and visual inspection of meteorological trends.
The methodological steps of the EDA followed a structured and reproducible workflow. First, descriptive statistics (mean, median, standard deviation, and range) were computed for all numerical variables to establish reference baselines and detect potential inconsistencies. Second, missing values were detected by quantifying null entries and time gaps in each station’s dataset, followed by visual inspection using heatmaps to assess temporal patterns of missingness. Third, outliers and abnormal measurements were identified using boxplots, histograms, and z-score thresholds, allowing differentiation between sensor errors and genuine extreme events. Finally, pairwise correlations were examined through a heatmap to explore dependencies among key meteorological variables such as temperature, humidity, and pressure. These successive steps provided a comprehensive understanding of the dataset’s structure and variability, forming the diagnostic foundation for subsequent data preprocessing and modeling stages.
To formalize these operations, a structured preprocessing and exploratory workflow was developed, as summarized in Figure 2. Beginning with raw data ingestion, the pipeline sequentially includes cleaning, imputation, anomaly detection, and visualization of variable distributions to characterize the dataset’s statistical structure. Subsequent stages involve correlation testing and multicollinearity assessment to refine variable selection, followed by feature engineering and transformation steps to improve feature quality and model readiness. The final stage produces standardized datasets ready for machine-learning classification, while class balancing is applied only to the training subset after data splitting to avoid data leakage.
Figure 2.
Data processing pipeline from raw data loading to the final dataset.
To ensure methodological rigor and prevent data leakage, class-balancing procedures such as SMOTE and random undersampling were not applied before data splitting; they were applied only to the training subset used for model fitting.
This visual representation clarifies the logical progression of preprocessing and exploratory operations, reinforcing methodological transparency, analytical traceability, and the overall robustness of the study framework.
To gain deeper insights into the dataset, we conducted a comprehensive exploratory data analysis. Key findings include:
- Temperature Distribution: The temperature distribution is broadly bell-shaped, with most observations concentrated between 15.6 °C and 26.7 °C and some visible peaks likely related to repeated or rounded observations. Extreme values were observed in desert regions during the summer period (Figure 3).
Figure 3.
Histogram and density curve of temperatures across the full dataset.
Temperature Distribution across Weather Stations: Figure 4 presents a boxplot visualization of temperature distributions across multiple weather stations. The plot highlights variations in temperature measurements by showing median values, interquartile ranges, and outliers. The boxplots differentiate stations, facilitating the identification of trends such as consistently higher or lower temperature ranges. Notably, some stations exhibit greater variability, indicated by longer whiskers and a higher number of outliers. These observations provide valuable insight into spatial temperature variability and potential station-specific microclimatic effects.
Figure 4.
Boxplot of temperature distribution across the 22 weather stations.
- Temporal Evolution of Temperature at Station GMFF during Summer 2022: Figure 5 illustrates the temporal evolution of temperature recorded at station GMFF during the summer period of 2022. The time-series plot reveals distinct diurnal cycles, with temperature fluctuations following expected day-night patterns. Additionally, short-term variability is visible during the selected summer period, reflecting fluctuations associated with daily atmospheric conditions. High-frequency variations suggest dynamic temperature changes that may be influenced by atmospheric circulation, local surface conditions, and station-specific environmental factors. This temporal analysis is useful for understanding short-term temperature dynamics at a fine temporal scale.
Figure 5.
Daily temperature fluctuations at station GMFF during summer 2022.
- Figure 6 illustrates the long-term evolution of recorded temperatures at station GMFF from July 2022 to February 2024 and shows clear seasonal cycles characterized by alternating warm and cold phases. The highest temperatures are generally observed during the summer months, whereas the lowest values are mainly observed during the winter months. This periodic variation reflects the seasonal thermal regime of the station, influenced by regional atmospheric conditions and broader Atlantic and continental air masses, and supports the temporal consistency of the dataset, which is important for subsequent model training and validation.
Figure 6.
Seasonal temperature evolution at station GMFF from July 2022 to February 2024.
- Correlation Analysis: The correlation analysis was performed in Python using the Pandas (2.2.2) and SciPy (1.13.1) libraries. Pairwise correlations between meteorological variables were computed using the Pearson correlation coefficient (r), which measures the linear relationship between continuous variables. In addition, two-tailed significance tests (p-values) were calculated to assess the statistical strength of these relationships, where p < 0.05 indicates statistical significance. The resulting correlation matrix (Figure 7) shows a strong spatial association between longitude and latitude, reflecting the spatial alignment of meteorological stations. In contrast, elevation exhibits weak and statistically insignificant correlations with most other features, suggesting that its influence may be more localized and station-specific rather than strongly correlated with the other numerical variables.
Figure 7.
Correlation matrix of numerical meteorological variables.
- Imbalanced Weather Categories and Leakage Prevention: Class imbalance is a common challenge in real-world meteorological datasets, and the METAR observations used in this study are no exception. The initial distribution of weather categories was assessed using Python’s Pandas and Seaborn libraries to compute class frequencies and visualize category proportions (Figure 8). The analysis revealed a pronounced skew, with the “Fog/Haze” category representing a disproportionately high share of observations compared with “Rain/Storm,” “Dust/Sand,” and “Clear” conditions. This imbalance, illustrated in Figure 8, highlights the need for a dedicated resampling strategy to prevent model bias. The approach adopted to correct this distribution is described below.
Figure 8.
Initial distribution of weather categories before resampling.
Class imbalance was addressed within the training data. After the data split, SMOTE was used to generate synthetic examples for minority weather classes, while random undersampling was used to reduce the dominance of the majority class. The validation and test sets were not resampled, so that model behavior could be assessed on real meteorological observations that preserved the original class distribution. These methods were implemented using the imbalanced-learn library in Python. The balancing process generated synthetic samples for underrepresented weather types while slightly reducing the overrepresented majority class, leading to a more uniform class distribution within the training subset (Figure 9). This adjustment was intended to improve model learning and reduce bias toward overrepresented weather categories, while final performance was evaluated on the unchanged validation and test subsets.
Figure 9.
Balanced distribution of weather categories in the training subset after SMOTE and random undersampling.
Specifically, SMOTE generated synthetic samples for minority weather classes by interpolating feature vectors within the k-nearest neighbor space. This operation must be restricted to the training subset to avoid contaminating validation or test observations. Final evaluation was therefore conducted on non-resampled validation and test data. To prevent overfitting, the majority class was then slightly reduced through random undersampling.
After resampling, class frequencies were recomputed and visualized using Seaborn bar plots to confirm equal representation (Figure 9). This balanced dataset ensured that all weather categories contributed equally to model training, thereby minimizing class bias and improving generalization performance.
Because of this initial imbalance, macro-averaged precision, recall, and F1-score were emphasized during model evaluation in addition to overall accuracy.
2.3. Data Cleaning and Preprocessing
Data cleaning was implemented in Python 3.10 using Pandas, NumPy, and scikit-learn. The cleaning workflow was implemented as a reproducible pipeline that sequentially handled missing values, outliers, unit conversions, and categorical encodings. Each step was automated through Jupyter-based scripts to ensure consistency across all 22 meteorological stations. This structured approach minimized manual intervention and enabled both visual and statistical verification at every preprocessing stage. The same cleaning procedure was applied consistently across all stations to ensure reproducibility and comparability of the processed observations.
2.3.1. Handling and Imputation of Missing Values
Missing data were analyzed through a detailed variable-level completeness assessment using Pandas summary statistics and visualizations of null-value patterns. Variables with more than 90% missing values, such as peak wind gust or snow depth, were excluded from further analysis to prevent the introduction of artificial patterns unrelated to real meteorological behavior.
For key meteorological variables, including temperature, humidity, wind speed, and pressure, missing entries were imputed using the k-nearest neighbors (KNN) algorithm implemented via the KNNImputer class in Scikit-learn. This method estimates each missing value based on the mean of its k-nearest neighbors in the multidimensional feature space:
where represents the available non-missing values of the k nearest samples determined by Euclidean distance. A neighborhood size of k = 5 was adopted after sensitivity testing and common practice in KNN-based imputation [17].
This algorithm preserves inter-variable correlations by inferring plausible values from meteorologically similar observations rather than global averages. For short temporal gaps of less than 3 h, forward and backward interpolation was applied to maintain time-series continuity. All imputed values were validated through visual comparison with original distributions to ensure physical plausibility and to prevent the creation of artificial trends. The imputation process was applied independently to each station to account for regional variability.
All imputed values were validated by visually comparing them with the original distributions to ensure physical plausibility and prevent artificial trends.
2.3.2. Outlier Detection and Treatment
Outlier detection is a crucial step in ensuring the quality and reliability of meteorological datasets. Anomalies may result from sensor malfunctions or genuine extreme weather events. Distinguishing between these two sources is essential, as removing actual extreme values could compromise the model’s ability to recognize severe weather patterns accurately.
A hybrid approach combining statistical techniques and domain expertise was used to identify outliers. The implementation was performed in Python 3.10 using Pandas, NumPy, and Scikit-learn libraries. The primary statistical technique was the Interquartile Range (IQR) method [18,19], which defines an expected range for each numerical variable. Given a dataset with quartiles and , the interquartile range is defined as:
A data point is considered an outlier if it falls outside the acceptable interval defined by the following bounds [19]:
This method provides a robust mechanism for detecting statistical deviations from the central distribution. However, in meteorological datasets, extreme values may be legitimate, thus requiring additional validation steps.
Rather than automatically discarding all flagged points, we conducted a contextual analysis. For instance, an anomalously high wind speed recorded during a storm event was retained, whereas an isolated and unexplained spike was either removed or adjusted based on domain knowledge.
For more complex cases, machine learning-based anomaly detection techniques were used, particularly Isolation Forests, which are effective for identifying observations that differ substantially from the dominant data structure [20]. This method recursively partitions the data and measures the depth at which a given observation becomes isolated. The anomaly score is defined as:
where is the average path length of x in the isolation trees, and is the average path length of a binary search tree of size n. Higher anomaly scores indicate a higher likelihood of being anomalous.
By integrating statistical thresholds with machine learning-based anomaly detection and domain-driven verification, the dataset retained important meteorological patterns while filtering out erroneous readings that could mislead the classification models.
Flagged extreme values were therefore not removed systematically; they were reviewed in relation to station context, temporal consistency, and meteorological plausibility.
2.3.3. Standardization and Feature Transformation
Because the dataset was compiled from multiple sources and weather stations, uniform measurement units and scales were required to maintain consistency. All numerical variables were standardized to internationally accepted SI units:
- Temperature was converted from Fahrenheit to Celsius;
- Pressure values were standardized to hectopascals (hPa);
- Wind speed measurements, initially recorded in knots, were converted to meters per second (m/s).
Beyond standardization, some meteorological variables exhibited highly skewed distributions. For instance, visibility data often displayed a long-tailed distribution due to frequent reports of clear conditions interspersed with occasional extreme fog or haze. To address this, we applied a natural logarithmic transformation using NumPy’s log1p() function, defined as . This approach avoids undefined values for zero inputs and stabilizes variance across features. The transformation was implemented in Python 3.10 within the Pandas–NumPy environment and applied to variables such as visibility and precipitation intensity, which showed right-skewed distributions.
This transformation compressed the range of extreme values while preserving relative differences between observations. It was particularly effective in ensuring that models could capture meaningful variations without being overly influenced by rare outliers.
2.3.4. Encoding and Aggregation of Meteorological Categories
Meteorological datasets contain categorical variables that must be properly encoded before being processed by machine learning algorithms. Two key categorical variables in the dataset were station identifiers and weather condition codes.
An ordinal encoding scheme was applied to station identifiers by assigning each station a unique numerical value. Although one-hot encoding is often preferred for categorical variables, its use was avoided here because, given the number of stations in the dataset, it would have significantly increased the feature space. Moreover, since station location may influence local weather patterns, ordinal encoding helped retain station-level information without unnecessarily expanding the dimensionality of the dataset.
Weather-condition codes posed a greater challenge because of their high variability. METAR reports typically include fine-grained codes describing conditions such as light rain, moderate rain, heavy rain, thunderstorms, mist, fog, haze, dust, and sand events. While this level of detail is valuable for aviation and meteorological forecasting, it can introduce severe class fragmentation and class imbalance in machine learning models. To reduce category fragmentation while retaining the main operational distinctions, weather conditions were aggregated into four broad categories:
- Clear, including fair weather and non-significant weather conditions;
- Fog/Haze (including mist, fog, and other reduced-visibility conditions);
- Rain/Storm (including light, moderate, and heavy rain as well as thunderstorms);
- Dust/Sand, including dust storms and sandstorms relevant to arid and Saharan-influenced regions.
The aggregation of METAR weather codes into four broad categories was guided by both meteorological interpretation and data availability. Although METAR reports contain fine-grained descriptors, many individual weather codes occurred too rarely to support reliable supervised learning at a finer class level. Therefore, the four selected classes represent dominant operational weather regimes relevant to the Moroccan meteorological context. The “Clear” class groups fair-weather and non-significant weather conditions; “Fog/Haze” includes reduced-visibility phenomena such as mist, haze, and fog; “Rain/Storm” includes precipitation-related conditions, including drizzle, rain, showers, and thunderstorms; and “Dust/Sand” includes dust- and sand-related phenomena that are relevant to arid and Saharan-influenced regions.
The four-class taxonomy was selected as a compromise between meteorological relevance, statistical robustness, and operational usability. The purpose of this taxonomy is not to reproduce the full aviation-level METAR code granularity, but to construct a statistically learnable broad-regime classification task from limited class-specific samples. It reduces excessive class fragmentation and supports supervised learning under limited class-specific observations. However, the aggregation also reduces meteorological granularity. For example, light drizzle, heavy rain, and thunderstorms are grouped within Rain/Storm, although they correspond to different physical intensities and operational risks. Similarly, Fog/Haze combines visibility-reducing phenomena with different origins. Therefore, the proposed framework should be interpreted as a broad-regime classification system. Future work should evaluate finer METAR-based taxonomies using longer multi-year datasets and larger class-specific samples.
This table clarifies the rationale behind the four-class taxonomy and highlights the main operational limitations associated with this broad-regime aggregation.
2.3.5. Impact of Preprocessing on Data Quality
The effectiveness of any machine learning model is directly tied to the quality of its input data. Dataset quality and usability were improved through a systematic data-cleaning and preprocessing pipeline: removal of unreliable features, imputation of missing values, outlier management, standardization of numerical variables, and encoding of categorical features.
A comprehensive evaluation of the data-cleaning process demonstrated the tangible benefits of this approach, consistent with findings from previous studies on preprocessing and model performance [20]:
- Improved data consistency: Standardization eliminated discrepancies in measurement units, allowing models to interpret numerical relationships more effectively;
- Reduced noise: The careful treatment of outliers and missing values prevented erroneous readings from distorting classification patterns;
- Better class balance: Aggregating weather condition categories reduced excessive class fragmentation, while SMOTE and random undersampling improved class balance within the training subset;
- Enhanced model convergence: Using feature transformation techniques such as logarithmic scaling enabled faster and more stable convergence during model training.
By implementing this rigorous data-cleaning pipeline, the dataset retained its meteorological integrity and provided a reliable foundation for training robust machine learning-based weather classification models. This step minimized bias and enhanced classification reliability, supporting more effective applications in weather classification and climate-related decision-making.
3. Methodology
This section outlines the methodological framework used to develop and assess the proposed machine learning-based weather classification system. The approach integrates data preprocessing, feature engineering, model selection, and hyperparameter optimization into a unified pipeline designed for robustness and reproducibility. Each stage was carefully implemented to ensure that meteorological variability across the 22 Moroccan weather stations was properly captured and that the models could generalize effectively across heterogeneous climatic conditions. The workflow combines baseline and ensemble learning techniques with automated optimization using Optuna, providing a systematic foundation for comparative model evaluation. The following subsections describe the structure, configuration, and rationale behind each methodological component.
3.1. Data Splitting and Leakage Prevention
Because the dataset consists of hourly METAR observations collected from July 2022 to February 2024, the experimental design was structured to preserve temporal integrity and avoid information leakage between adjacent meteorological records. The full dataset was first sorted chronologically by observation timestamp and then divided into three temporally ordered subsets using an approximately 70/15/15 split. The training subset covered observations from 1 July 2022 at 00:00 to 22 August 2023 at 23:30. The validation subset covered observations from 23 August 2023 at 00:00 to 20 November 2023 at 23:30 and was used for Optuna-based hyperparameter optimization. The independent test subset covered observations from 21 November 2023 at 00:00 to 17 February 2024 at 23:30 and was reserved exclusively for final performance reporting. Figure 6 illustrates the long-term evolution of recorded temperatures at station GMFF from July 2022 to February 2024, which clearly shows seasonal cycles characterized by alternating warm and cold phases.
This chronological partition was adopted instead of a random split because hourly weather observations are temporally correlated. A random division of the dataset could place temporally adjacent observations in both training and test subsets, leading to overly optimistic performance estimates. By separating the data along the time axis, the evaluation procedure better reflects the model’s ability to generalize to future unseen meteorological conditions.
All preprocessing operations requiring parameter estimation were fitted exclusively on the training subset. This includes missing-value imputation, feature scaling, numerical transformations, and categorical encoding. The fitted preprocessing parameters were then applied unchanged to the validation and independent test subsets. This procedure ensured that no information from validation or test observations influenced the preprocessing stage.
Class-balancing procedures were also applied only after the temporal split. Specifically, SMOTE and random undersampling were performed exclusively on the training subset to improve the representation of minority weather regimes during model fitting. The validation and independent test subsets were not resampled and retained their original class distributions. This design prevents both temporal leakage and resampling-induced leakage, while allowing model performance to be assessed on realistic meteorological distributions.
The complete leakage-safe workflow therefore followed this sequence: chronological sorting of observations, temporal train/validation/test splitting, fitting of preprocessing parameters on the training subset only, transformation of validation and test subsets, training-only SMOTE and random undersampling, validation-based Optuna optimization, and final evaluation on the independent non-resampled test subset. This protocol provides a more rigorous basis for assessing the generalization capacity of the proposed machine learning framework under real-world operational conditions.
3.2. Overview of Machine Learning and Ensemble Models
Machine learning and ensemble models provide effective tools for weather classification because they can capture complex nonlinear relationships within structured meteorological datasets. Traditional linear models remain useful as baselines, but they are often insufficient for representing interactions among temperature, humidity, visibility, pressure, and wind variables. However, ensemble models such as XGBoost, LightGBM, CatBoost, Random Forest, and Gradient When properly tuned, these algorithms demonstrate strong scalability, high accuracy, and adaptability to varying data distributions (Ke et al., 2017 [10]).
This section details the model setup, hyperparameter optimization procedure, and the strengths and limitations of the selected models. Table 2 summarizes the hyperparameters explored during the experiments.
Table 2.
Aggregation of representative METAR weather codes into broad weather-regime classes.
To ensure a structured approach to weather classification, a systematic pipeline was developed encompassing data preprocessing, model selection, hyperparameter optimization, and evaluation. Figure 10 provides an overview of the complete methodology, outlining the step-by-step workflow from data acquisition to model evaluation.
Figure 10.
Workflow of the machine learning-based weather classification pipeline.
The pipeline begins with data collection and preprocessing, where raw meteorological data undergo cleaning, transformation, and feature engineering. The processed data are then used for model training through various machine learning algorithms, including boosting and ensemble methods. Hyperparameter optimization is subsequently applied to improve model performance, followed by evaluation using accuracy, macro-averaged precision, recall, F1-score, and confusion matrices.
This chronological design was adopted to preserve temporal integrity and reduce the risk of overly optimistic performance estimates caused by random splitting of hourly observations.
3.3. Selected Models and Their Characteristics
To address the challenges posed by the meteorological dataset, we selected a diverse set of models, each offering unique advantages in handling complex nonlinear data patterns. Ensemble methods such as Random Forest and Gradient Boosting help mitigate overfitting, while advanced boosting algorithms such as XGBoost, LightGBM, and CatBoost are well-suited for structured tabular datasets, with CatBoost offering specific advantages for categorical variables. Additionally, Support Vector Machines (SVM) and Logistic Regression were included as baseline models to provide a benchmark for performance comparison.
Three primary considerations guided the selection of machine learning models [20,21]:
- Handling of High-Dimensional and Nonlinear Data: Models such as XGBoost and LightGBM can handle high-dimensional and nonlinear meteorological datasets while maintaining strong computational performance.
- Interpretability and Robustness: Random Forest and Gradient Boosting provide useful feature importance indicators and stable predictive behavior, making them suitable for initial interpretation of variable contributions in weather classification.
- Optimization Potential: To maximize predictive performance, we prioritized models that benefit significantly from hyperparameter tuning (e.g., XGBoost, LightGBM, and CatBoost).
Baseline models such as Logistic Regression and Support Vector Machines (SVMs) were included as benchmark models. The comparative performance analysis provides insight into the effectiveness of ensemble learning compared with baseline classifiers. The configuration and main characteristics of the selected machine learning models, including their algorithmic type, tuned hyperparameters, strengths, and limitations, are summarized in Table 2.
This diverse selection enables a comprehensive evaluation of baseline and ensemble machine learning approaches. By tuning the hyperparameters for each model using Optuna, the study aims to optimize predictive performance and identify the most suitable algorithms for weather classification using Moroccan METAR observations.
Model suitability was assessed not only by accuracy but also by macro-averaged precision, recall, and F1-score to account for the initial imbalance among weather categories.
3.4. Hyperparameter Tuning and Optimization
Hyperparameter optimization is central to improving the predictive performance and robustness of machine learning models. It involves systematically searching for the optimal configuration of model parameters that govern learning dynamics, such as tree depth, learning rate, or regularization strength, to minimize loss and maximize generalization. In the context of this study, hyperparameter tuning directly influences the performance of ensemble models (XGBoost, LightGBM, CatBoost) in adapting to Morocco’s heterogeneous meteorological data. The following subsections describe the adopted optimization framework, its Bayesian formulation, and the implementation procedure using the Optuna library.
3.4.1. Optimization with Optuna
Hyperparameter tuning is a crucial step for improving the performance and generalization of machine learning models. Traditional methods, such as manual tuning and grid search, can be inefficient because they require the evaluation of many parameter combinations. Optuna is an advanced framework that streamlines this process using Bayesian optimization with a Tree-structured Parzen Estimator (TPE) [14] efficiently searches for the best hyperparameters by balancing exploration and exploitation, making the search process computationally efficient. The optimization experiments were conducted in Python 3.10 using Optuna v3.3.0 and executed in a Jupyter Notebook (4.2.5) environment under Windows 11. The framework was integrated with scikit-learn v1.3, LightGBM v4.0, and XGBoost v2.1 through Optuna’s native API interface. All experiments were conducted on a Windows 11 workstation equipped with an Intel Core i7 processor and 16 GB RAM, using CPU-based implementations of the machine learning algorithms. No dedicated GPU acceleration was used during model training or hyperparameter optimization.
During hyperparameter optimization, Optuna was coupled with a validation-based evaluation strategy applied only within the training and validation period. The objective function was designed to maximize the macro-averaged F1-score rather than accuracy alone, because the weather categories were initially imbalanced. This choice ensured that minority classes, such as Dust/Sand and Rain/Storm, contributed equally to the optimization process. The final model performance was then assessed on the independent test set, which was not used during model tuning.
Optuna automates hyperparameter search and improves computational efficiency. It includes a pruning mechanism that stops poorly performing trials early, saving time and computational resources. The framework adjusts its search based on previous results, facilitating a more intelligent exploration of potential values. It also supports parallel execution, allowing multiple trials to run simultaneously [22]. Furthermore, its compatibility with leading machine learning libraries such as XGBoost and LightGBM makes it a flexible and widely applicable tool for reproducible model optimization.
3.4.2. Mathematical Formulation
The objective of hyperparameter tuning is to identify the optimal set of parameters that minimize the model’s validation loss or maximize a target evaluation metric, such as the macro-averaged F1-score. This can be expressed as:
where represents the model’s loss function [23]. Optuna employs Bayesian optimization by modeling the probability distributions of promising and non-promising hyperparameters. This probability is given by:
where represents the likelihood of a hyperparameter producing a specific objective value, is the prior probability, and is the marginal likelihood. By continuously updating these distributions, Optuna improves search efficiency compared with traditional methods such as grid search. This formulation follows Bayes’ theorem and constitutes the probabilistic foundation of Bayesian optimization implemented in Optuna.
3.4.3. Implementation of Optuna for Each Model
The process of optimizing hyperparameters with Optuna follows several key steps [14]. First, an objective function is defined, which evaluates the model’s validation performance for a given set of hyperparameters. Then, an Optuna study is created to track and optimize these trials. The framework selects a sampling strategy, typically the TPE sampler, which helps quickly identify the best configurations. It then runs multiple trials, adjusting the search based on previous results. If a trial performs poorly, Optuna stops it early to save computational resources. After all trials, the best combination of hyperparameters is selected and analyzed. Figure 11 summarizes the main steps of the Optuna optimization process, from study creation and objective-function evaluation to trial storage and selection of the best hyperparameter configuration.
Figure 11.
Flowchart of the Optuna-based hyperparameter optimization process.
Optuna improves hyperparameter tuning efficiency through adaptive sampling and pruning techniques. Unlike grid search, which exhaustively tests all possible combinations, Optuna focuses on the most promising regions of the hyperparameter space. This speeds up the process while improving model performance. By dynamically adjusting its search based on prior results, it finds better solutions with fewer trials [14,22]. Optuna is a useful tool for machine learning optimization, improving model performance while reducing computational time and manual effort.
The hyperparameter optimization process was tailored to each model to ensure a fair exploration of the search space. The optimization objective was computed on the validation subset using macro-averaged F1-score as the primary criterion, in order to avoid overemphasizing global accuracy under class imbalance. The independent test subset was not used during tuning and was reserved exclusively for final performance reporting. Table 3 summarizes the tuned hyperparameters and their respective ranges.
Table 3.
Characteristics and Hyperparameters of Selected Models.
This configuration enabled Optuna to efficiently explore the hyperparameter space, dynamically adjusting trial priorities based on intermediate results. This approach enhanced computational efficiency and produced models with optimal parameter settings tailored to the dataset.
Integrating Optuna into the methodology ensured that each model was evaluated under ideal conditions. This enabled a fair comparison of the algorithms on Moroccan meteorological data and demonstrated the impact of automated hyperparameter optimization on model accuracy and robustness.
This methodological framework supports a rigorous evaluation of baseline classifiers and ensemble-based models for Moroccan weather classification by combining hyperparameter tuning, ensemble learning, and optimized boosting techniques.
The optimized models achieved an 8–12% accuracy improvement over baseline configurations, with a notable reduction in misclassification errors for underrepresented weather categories. Fine-tuning parameters such as learning_rate, tree_depth, and sampling strategies contributed to these improvements, demonstrating the important role of hyperparameter optimization in machine learning-based meteorological classification.
3.4.4. Additional Methodological Considerations
A detailed discussion of methodological choices further clarifies the rationale behind our approach. The selection of specific hyperparameter ranges (Table 4) was guided by prior literature and iterative experimentation, aiming to balance model complexity and computational efficiency [29]. Similarly, data preprocessing techniques, such as KNN imputation for missing values and logarithmic transformations for skewed distributions, were chosen to preserve the intrinsic meteorological relationships within the dataset. These decisions enhance model performance, reproducibility, and robustness, providing valuable insights for practitioners and researchers in the field.
Table 4.
Hyperparameter ranges explored using Optuna.
3.5. Evaluation Metrics
Multiple metrics (Table 5) were used to evaluate model performance comprehensively. These metrics capture complementary aspects of model performance, including overall accuracy, class-wise precision, recall, and the balance between false positives and false negatives [23,30]. Table 4 outlines the metrics, their mathematical formulations, and their relevance in the context of imbalanced weather classification.
Table 5.
Test-set performance of the classification models after Optuna-based hyperparameter optimization. Macro-averaged metrics are reported to account for class imbalance.
These metrics were selected to ensure a comprehensive and balanced evaluation of model performance, especially under class imbalance. They offer complementary insights into each classifier’s strengths and weaknesses, particularly in the presence of imbalanced weather classes.
Because the weather categories were initially imbalanced, macro-averaged precision, recall, and F1-score were emphasized in addition to overall accuracy. Macro-averaging gives equal weight to each class and therefore provides a more reliable assessment of model performance on minority categories such as Dust/Sand and Rain/Storm.
By integrating these metrics into the evaluation framework, this study provides a standardized assessment of classification performance, in line with best practices for imbalanced machine learning problems in meteorological applications.
The superiority of XGBoost is not limited to overall accuracy. Its macro-F1-score indicates that performance gains are distributed across classes rather than being driven only by the dominant Fog/Haze class. This is important because the original dataset is imbalanced and operationally relevant events such as Dust/Sand and Rain/Storm are less frequent. Therefore, macro-recall and macro-F1 provide a more appropriate basis for model comparison than accuracy alone.
4. Results and Discussion
This section presents and interprets the outcomes of the machine learning models applied to Moroccan METAR observations. The analysis focuses on evaluating model performance, robustness, and generalization across diverse climatic conditions. Beyond numerical performance, the discussion highlights the models’ ability to capture nonlinear relationships among meteorological variables, which is essential for reliable weather classification. The results are compared with recent studies in atmospheric and climate modeling, including machine learning, ensemble learning, and deep learning approaches for weather classification and forecasting, to clarify the strengths and limitations of the selected methods [31,32,33,34,35,36,37]. The section concludes by discussing the practical implications of these results for weather classification and decision-making in the Moroccan context. The following subsections detail the quantitative results, macro-averaged performance indicators, error analysis, and model comparisons across the defined weather categories.
4.1. Model Performance Evaluation
The results show that ensemble-based algorithms achieved the highest predictive performance across all evaluation metrics. XGBoost and LightGBM produced the best classification accuracy and macro-averaged F1-scores, followed by Random Forest, while Support Vector Machine (SVM) and Logistic Regression displayed comparatively lower performance. These results indicate that ensemble methods more effectively model the nonlinear dependencies inherent in meteorological data. This trend has been consistently supported by recent literature, including studies by [2,24].
4.1.1. Performance Metrics
Figure 12 presents the performance of each model after Optuna-based hyperparameter optimization. Because the initial dataset was imbalanced, macro-averaged precision, macro-averaged recall, and macro-averaged F1-score are emphasized alongside accuracy.
Figure 12.
Performance metrics of the classification models after Optuna optimization.
XGBoost achieved the highest overall performance, followed closely by LightGBM and CatBoost. However, model ranking should not rely on accuracy alone. Macro-averaged F1-score and per-class recall provide a more reliable view of performance across both frequent and minority weather regimes.
Baseline models such as SVM and Logistic Regression showed lower macro-recall, particularly for minority weather regimes such as Dust/Sand. This confirms that global accuracy alone is not sufficient for evaluating robustness in imbalanced meteorological classification.
The boosting-based models demonstrated more balanced precision and recall across the weather classes, underscoring their robustness to both noise and data imbalance.
This pattern suggests that tree-based ensemble methods capture complex nonlinear relationships between meteorological variables more effectively than linear or kernel-based methods.
4.1.2. Key Insights
The evaluation of classification models reveals several key findings, highlighting the strengths and limitations of different approaches.
- XGBoost: The Best Overall Performer
XGBoost achieved the highest overall accuracy, reaching 95.1%, making it the best performing model in the present experimental setting. Its success is attributed to its capacity to capture intricate nonlinear relationships and model complex patterns through iterative boosting, while class imbalance was addressed through training-set resampling. Hyperparameter optimization via Optuna further improved its performance by fine-tuning critical parameters such as max_depth and learning_rate, thereby reducing misclassification errors in minority weather categories.
- LightGBM: A Competitive and Efficient Alternative
LightGBM closely followed XGBoost, with an accuracy of 94.7%. It demonstrated similar predictive capabilities while offering lower computational costs due to its histogram-based algorithm. However, LightGBM required careful tuning of num_leaves and min_data_in_leaf to reduce overfitting risk and ensure generalization across all categories.
- CatBoost: Effective Handling of Categorical Variables
CatBoost delivered an accuracy of 93.8%, ranking third among the evaluated models. Its main advantage is its effective handling of categorical variables, minimizing the need for extensive preprocessing. However, its training time was longer than that of XGBoost and LightGBM, which could pose a limitation for real-time weather classification applications.
- Random Forest and Gradient Boosting: Reliable but Lower-Performing than Boosting Ensembles.
Random Forest achieved an accuracy of 92.5%, showing robustness and useful feature importance indicators. However, it struggled to accurately classify rare weather phenomena such as dust storms. Gradient Boosting, with an accuracy of 91.9%, also performed well but did not reach the efficiency of XGBoost and LightGBM due to the absence of advanced optimization mechanisms.
- SVM and Logistic Regression: Limited Performance for Complex Weather Data
Baseline models such as Support Vector Machines (SVM, 90.8%) and Logistic Regression (89.2%) exhibited the lowest performance. Their limitations stem from their inability to effectively capture complex interactions between meteorological variables. SVM showed limitations in separating overlapping classes in the high-dimensional feature space, while Logistic Regression, being a linear model, could not effectively model nonlinear dependencies.
Lack of temporal dependency modeling: The current models treat each hourly observation as an independent sample and do not explicitly learn transitions between weather regimes. Future work should explore time-series models such as LSTMs, GRUs, temporal convolutional networks, or walk-forward learning schemes to better capture short-term meteorological dynamics.
This analysis confirms that ensemble learning techniques, particularly XGBoost and LightGBM, significantly outperform baseline classification models for weather classification. Hyperparameter optimization played a pivotal role in enhancing performance, while future improvements could focus on integrating additional meteorological features, improving rare event classification, and incorporating time-series temporal modeling techniques.
4.1.3. Comparative Interpretation and Literature Context
These results are consistent with the robust performance of boosting-based ensembles reported by [24], who first emphasized XGBoost’s stability under noisy data conditions.
Similar conclusions were drawn by [8], who noted that linear models such as SVM and Logistic Regression often fail to capture nonlinear meteorological dependencies.
Our findings also align with [28], confirming the operational reliability of LightGBM and XGBoost in regional weather classification and forecasting contexts.
Conversely, ref. [2] demonstrated that CNN- and LSTM-based architectures can model fine-scale spatial dynamics but remain computationally intensive and less transferable to heterogeneous climates such as Morocco’s.
4.1.4. Main Findings
The overall findings highlight the superior performance of boosting-based algorithms, particularly XGBoost and LightGBM, which consistently outperformed all other models across accuracy, macro-recall, and macro-F1-score metrics.
Hyperparameter optimization through Optuna yielded additional improvements of approximately 8–12%, especially for minority weather classes such as Dust/Sand and Rain/Storm.
The most frequent misclassification occurred between Fog/Haze and Rain/Storm categories, reflecting the inherent overlap of meteorological features in these conditions.
Results further suggest that the selected models can generalize across multiple Moroccan weather stations while maintaining computational efficiency suitable for structured station-based datasets.
These consolidated outcomes form the basis for the detailed confusion analysis presented in the following section. Overall, the balance between interpretability, predictive performance, and robustness positions boosting ensembles as one of the most reliable frameworks for operational meteorological decision-support systems.
Although accuracy remains useful for overall comparison, macro-averaged indicators are particularly important in this study because they assign equal weight to each weather category, including minority classes.
4.2. Confusion Matrix Analysis
The confusion matrices for the top-performing models revealed the following insights:
- XGBoost and LightGBM: Accurately classified most weather categories, including minority categories such as “Dust/Sand.” However, some confusion was observed between “Rain/Storm” and “Fog/Haze” due to overlapping meteorological and visibility-related characteristics;
- Random Forest: Demonstrated robustness in detecting dominant classes but showed lower sensitivity to minority classes such as “Dust/Sand.”
The confusion matrices reveal specific inter-class ambiguities that align with known meteorological overlaps. The most frequent confusion occurred between Fog/Haze and Rain/Storm, which is consistent with the partial overlap between reduced visibility, humidity, and precipitation-related conditions. This result should also be interpreted in light of the adopted four-class taxonomy.
Similar patterns were observed between Dust/Sand and Clear, especially under low-intensity dust or sand conditions where visibility reduction is moderate and the meteorological signature may remain close to clear-weather observations.
These results are consistent with findings by [2], who discussed similar challenges in distinguishing visually or physically related atmospheric states using machine learning approaches.
Conversely, the relatively low confusion between Clear and Fog/Haze in our study, below 3%, suggests that the boosting-based classifiers learned relatively robust boundaries between distinct visibility conditions.
This outcome is also consistent with studies showing that gradient-boosting models can provide strong class-level discrimination when meteorological variables such as humidity, wind, and visibility vary across weather regimes [28].
Overall, these results highlight that misclassifications may partly stem from meteorological similarity and overlapping physical conditions, in addition to model-specific limitations.
The following section examines how hyperparameter optimization contributed to reducing such ambiguities and improving generalization. The strong performance observed for XGBoost can be attributed to its ability to model nonlinear interactions and learn complex decision boundaries through gradient boosting. LightGBM’s efficiency in handling large tabular datasets is related to its histogram-based learning strategy, which reduces memory usage and computational time while maintaining competitive accuracy levels [10,24].
4.3. Impact of Hyperparameter Optimization
The use of Optuna improved model performance across all metrics. Compared with baseline configurations, the optimized models achieved:
- 8–12% improvement in accuracy for XGBoost and LightGBM;
- Higher recall and macro-F1-scores, particularly for underrepresented classes.
The Optuna framework conducted 100 optimization trials using a Tree-structured Parzen Estimator sampler. Depending on the classifier, the search space included parameters such as learning_rate, max_depth, num_leaves, min_data_in_leaf, subsample, and n_estimators.
On average, this process improved XGBoost accuracy from 83.2% to 95.1% and LightGBM accuracy from 82.7% to 94.7%. These improvements are therefore reported together with macro-F1 and per-class recall to avoid overemphasizing global accuracy.
The largest gains were observed for minority categories such as Dust/Sand (+12% in F1-score) and Fog/Haze (+9% in recall), suggesting that automated tuning combined with training-set resampling improved class-level performance.
These findings are consistent with [15], who demonstrated that Bayesian optimization can yield systematic accuracy improvements under noisy or high-dimensional conditions.
Likewise, ref. [22] showed that adaptive hyperparameter search can stabilize model training and improve predictive performance.
In this study, the joint use of Optuna tuning and training-set resampling contributed to improved performance compared with baseline configurations.
Similar trends were also reported by [28] in tropical climate forecasting, where tuned LightGBM and XGBoost models achieved stronger generalization over default configurations.
Overall, these optimizations enhanced numerical performance and supported the robustness of the proposed workflow.
The next section analyzes the residual errors in more detail and discusses their possible meteorological origins.
Figure 13 illustrates the accuracy improvement achieved after hyperparameter optimization using Optuna. The comparison highlights a clear accuracy gain for XGBoost and LightGBM after tuning, supporting the quantitative impact discussed above.
Figure 13.
Accuracy improvement before and after Optuna hyperparameter optimization.
4.4. Error Analysis
This analysis connects model errors to the main findings discussed in the previous subsections and provides an interpretation of their possible causes and implications.
The error analysis identified several key patterns. These errors are consistent with the class-level confusion patterns previously observed in Section 4.2, particularly between Fog/Haze and Rain/Storm:
- Class Overlap: Confusion between “Fog/Haze” and “Rain/Storm” suggests that additional temporal information or complementary meteorological features could improve class separability. Variables such as wind direction, wind speed, pressure tendency, and visibility evolution could help distinguish between reduced-visibility and precipitation-related conditions.
- Minority Classes: Although SMOTE-based oversampling improved classification for “Dust/Sand,” higher error rates persisted because of limited sample diversity. Addressing this issue may require collecting more representative samples, extending the temporal coverage, or exploring data augmentation methods in future work.
The confusion observed between overlapping classes reflects the complexity of meteorological phenomena, where multiple factors simultaneously influence weather patterns. Future research could explore temporal modeling approaches, such as LSTM or GRU networks, and hybrid models combining station observations with additional spatial data sources to better capture temporal dependencies and spatial variations [38]. Similar error trends were documented by [2,36], who also noted classification difficulties between physically similar atmospheric states, suggesting that such overlaps may arise from both meteorological similarity and model-specific limitations.
The results highlight the effectiveness of ensemble models such as XGBoost and LightGBM for weather classification. Hyperparameter optimization via Optuna contributed substantially to these results, underscoring the importance of automated tuning frameworks. The strong performance of these models suggests their potential for deployment in real-world meteorological applications, where accurate weather classification is critical for sectors such as agriculture, disaster management, and energy planning. Future work could explore hybrid models combining temporal and spatial features to improve macro-averaged performance and minority-class detection.
Although accuracy and macro-averaged metrics provide quantitative validation, practical deployment requires further evaluation of machine learning-based weather classification under operational conditions. The robustness of XGBoost and LightGBM suggests potential applications in:
- Aviation Safety: Improved classification of visibility-related conditions, such as fog or haze, can support real-time flight decision-making;
- Agricultural Planning: Improved classification of weather regimes can support irrigation scheduling and crop-management decisions;
- Disaster Management: Earlier identification of hazardous weather categories, such as storms, fog, or dust events, can support emergency response planning.
These applications highlight the significance of machine learning-based weather classification beyond experimental evaluation, reinforcing the practical relevance of the proposed framework for operational meteorological decision-support systems and aligning with recent applied studies such as [7].
Overall, this analysis links quantitative results with operational applicability and provides the basis for the comparative discussion presented in Section 4.5.
4.5. In-Depth Discussion
The present study shows that ensemble-based machine learning models, particularly XGBoost and LightGBM, achieve strong performance for regional weather classification in Morocco, with both models exceeding 94% accuracy. When discussed in relation to previous machine learning and deep learning studies, the findings highlight the practical advantages of optimized boosting models for structured station-based observations.
For instance, ref. [2] discussed the potential of machine learning and deep learning approaches, including convolutional and recurrent neural networks, for improving the detection of complex weather events by capturing spatiotemporal dependencies, but at a high computational cost and with limited generalization across heterogeneous climates. In contrast, the boosting-based models trained on structured ground-station data achieved high accuracy while remaining computationally practical and offering greater interpretability.
Similarly, ref. [8] emphasized that baseline machine learning techniques such as SVM and logistic regression often fail to model the nonlinear interactions among meteorological variables. Our results are consistent with this observation: both SVM (90.8%) and logistic regression (89.2%) underperformed compared with boosting methods, reinforcing the idea that ensemble approaches are better suited to handling the complex, multidimensional nature of atmospheric data.
Beyond overall accuracy, the integration of Optuna-based hyperparameter optimization and training-set resampling contributed to the observed improvements. The 8–12% accuracy improvement relative to default configurations is consistent with [15,22], who showed that automated optimization frameworks can enhance model robustness under imbalanced or noisy conditions.
By fine-tuning critical parameters such as learning_rate, max_depth, num_leaves, and min_data_in_leaf, and by handling rare categories through a leakage-safe resampling strategy, the models achieved improved performance across Morocco’s diverse climatic zones.
Further domain-specific implications and potential operational applications of the proposed framework are discussed in Section 5.
Overall, the comparative analysis shows that boosting-based ensemble models offer a pragmatic balance between predictive performance, interpretability, and computational efficiency. While deep learning remains valuable for spatiotemporal pattern extraction, the current study highlights that well-optimized gradient-boosting frameworks can be competitive for structured station-based datasets when data volume is moderate and observations are collected from heterogeneous station networks, which are typical of regional meteorological systems such as Morocco’s.
Compared with previous international studies, our results suggest the particular relevance of optimized boosting models under Moroccan climatic and topographic variability.
Unlike some more homogeneous datasets used in other regional contexts, the Moroccan multi-station dataset introduces high inter-regional heterogeneity, spanning coastal, mountainous, and desert environments.
In this setting, LightGBM and XGBoost showed strong generalization and controlled overfitting risk after hyperparameter tuning, a result that reinforces their suitability for operational meteorological decision-support systems in North Africa.
This contrasts with deep-learning approaches such as CNNs and LSTMs, which, although powerful, require extensive homogeneous data and computational resources that may not always be available in operational regional settings.
4.6. Policy Implications, Limitations, and Future Work
Despite the strong performance obtained by the optimized ensemble models, several limitations should be noted. First, the study relies exclusively on station-based METAR observations, which means that areas with sparse observational coverage may not be represented with the same level of detail. Second, the temporal coverage from July 2022 to February 2024 remains relatively short for assessing long-term climatic variability. Third, the four-class weather taxonomy offers a stable classification framework, but it does not capture all fine-grained distinctions required in some operational contexts, especially in aviation. Finally, the models treat each hourly observation as an independent sample and therefore do not explicitly learn temporal transitions between weather regimes. Additionally, classifying rare events such as dust storms remains challenging even with training-only resampling techniques such as SMOTE. This limitation reflects the limited diversity of rare-event samples rather than a purely algorithmic weakness. Future research should explore integrating recurrent neural networks, such as LSTMs or GRUs, to capture temporal dynamics more effectively.
More specifically, three challenges should be highlighted:
- Confusion Between Similar Weather Classes: Instances of Fog/Haze being misclassified as Rain/Storm suggest that additional temporal features, pressure tendencies, wind-shift indicators, and precipitation-intensity descriptors may be needed to improve class separability;
- Rare Event Classification: Weather conditions such as dust storms remain underrepresented in the original observational data. Future research should explore larger multi-year datasets, additional stations, and controlled data augmentation strategies to improve predictive performance for rare events;
- Temporal Dependencies: Current models treat weather data as independent observations. Incorporating time-series models such as LSTMs could better capture sequential dependencies and improve short-term classification performance.
Addressing these challenges will enhance model reliability, paving the way for more precise and adaptable machine learning-based weather classification systems.
Beyond methodological insights, the outcomes of this study also bear significant policy relevance. Improved weather classification can directly support agricultural scheduling, enhance aviation safety by improving the classification of visibility-related and hazardous weather conditions, and strengthen disaster-response systems through early-warning alerts.
These operational benefits align with national priorities for climate-resilient infrastructure and sustainable energy planning in Morocco. Embedding such machine learning-based classification-support frameworks into decision-support systems could help local authorities mitigate socio-economic losses caused by extreme weather events. At the institutional level, standardized data-sharing agreements and sustained computational resources are essential to operationalize these models across Moroccan agencies.
5. Practical Implications
The proposed machine learning framework can serve as a complementary decision-support layer for broad-regime weather classification. In agriculture, improved identification of rain, fog, and clear conditions can support irrigation scheduling and field-operation planning. In aviation, the detection of reduced-visibility regimes such as fog, haze, dust, and sand can improve situational awareness and support operational risk assessment. In disaster risk management, early identification of storm- and dust-related conditions can contribute to preparedness and response planning. These applications should not be interpreted as a replacement for official meteorological forecasting systems. The proposed framework should be regarded as a classification-support layer rather than a forecasting system.
6. Conclusions and Perspectives
This study developed a machine learning-based framework for broad-regime weather classification over Morocco using hourly METAR observations collected from 22 stations between July 2022 and February 2024. The results indicate that optimized ensemble models, particularly XGBoost and LightGBM, provide strong performance on structured station-based meteorological data. XGBoost achieved the highest accuracy, followed closely by LightGBM and CatBoost, while macro-averaged metrics confirmed the relevance of boosting models under class imbalance. The study further demonstrates the importance of a leakage-safe workflow. Chronological data splitting, training-only resampling, validation-based Optuna optimization, and independent test-set evaluation improve the reliability of the reported results. The confusion analysis shows that most errors occur between meteorologically similar classes, especially Fog/Haze and Rain/Storm, which reflects both physical overlap and the limitations of the four-class taxonomy. Several limitations remain. The study relies exclusively on station-based METAR observations and does not include satellite, radar, or numerical weather prediction data. The temporal coverage remains limited to July 2022–February 2024, and the four-class taxonomy reduces the granularity of the original METAR codes. The reported performance should therefore be interpreted within the scope of broad-regime classification, not as evidence of fine-grained operational METAR-code prediction. Future work should evaluate longer multi-year datasets, finer weather-class taxonomies, temporal validation schemes, and external cross-regional datasets. Explainability tools such as SHAP may also be integrated in future work to provide local and per-class interpretability, but they are not part of the present experimental framework.
Author Contributions
Conceptualization, S.S. and L.H.; methodology, S.S. and L.H.; software, S.S.; validation, L.H., R.S. and H.K.A.; formal analysis, S.S. and H.K.A.; investigation, S.S.; data curation, S.S.; writing—original draft preparation, S.S.; writing—review and editing, L.H., R.S. and H.K.A.; supervision, L.H. All authors have read and agreed to the published version of the manuscript.
Funding
This research received no external funding.
Institutional Review Board Statement
Not applicable. This study relies exclusively on publicly available meteorological observations and does not involve human participants, personal data, private identifiers, or sensitive information.
Data Availability Statement
The dataset and scripts used for preprocessing, model training, hyperparameter optimization, and evaluation will be made available in a public GitHub repository upon publication. The repository will include the data-processing pipeline, model-configuration files, and instructions required to reproduce the reported experiments.
Conflicts of Interest
The authors declare no conflict of interest.
References
- Chantry, M.; Christensen, H.; Dueben, P.; Palmer, T. Opportunities and challenges for machine learning in weather and climate modelling: Hard, medium and soft AI. Philos. Trans. R. Soc. A Math. Phys. Eng. Sci. 2021, 379, 20200083. [Google Scholar] [CrossRef] [Scilit] [PubMed]
- Bochenek, B.; Ustrnul, Z. Machine learning in weather prediction and climate analyses—Applications and perspectives. Atmosphere 2022, 13, 180. [Google Scholar] [CrossRef] [Scilit]
- Li, Z.; Li, Y.; Zhong, J.; Chen, Y. Multi-class weather classification based on multi-feature weighted fusion method. In IOP Conference Series: Earth and Environmental Science; IOP Publishing: Bristol, UK, 2020; p. 042038. Available online: https://iopscience.iop.org/article/10.1088/1755-1315/558/4/042038/meta (accessed on 21 May 2026).
- Johnson, A.; Wang, X. Impact of NWP Model Configuration and Training Sample Characteristics on Random Forest-Based Day-1 Convective Outlook Guidance. Earth Space Sci. 2025, 12, e2024EA003822. [Google Scholar] [CrossRef] [Scilit]
- Monteiro, M.J.; Carvalho, D.; Martins, J.P.; Nogueira, M.; Gomes, L. A review on the current status of numerical weather prediction in Portugal 2021: Surface–atmosphere interactions. Atmosphere 2022, 13, 1356. [Google Scholar] [CrossRef] [Scilit]
- Allen, A.; Biard, J.; Bouallegue, Z.B.; Chantry, M.; Clare, M.C.; Dramsch, J.; Düben, P.; Dueben, P.; Gagné, D.J., II; Gans, F.; et al. End-to-end data-driven weather prediction. Nature 2025, 641, 1172–1179. [Google Scholar] [PubMed]
- Waqas, M.; Humphries, U.W.; Chueasa, B.; Wangwongchai, A. Artificial intelligence and numerical weather prediction models: A technical survey. Nat. Hazards Res. 2025, 5, 306–320. [Google Scholar] [CrossRef] [Scilit]
- Salcedo-Sanz, S.; Pérez-Aracil, J.; Ascenso, G.; Del Ser, J.; Casillas-Pérez, D.; Kadow, C.; Fister, D.; Barriopedro, D.; García-Herrera, R.; Restelli, M.; et al. Analysis, characterization, prediction, and attribution of extreme atmospheric events with machine learning and deep learning techniques: A review. Theor. Appl. Climatol. 2024, 155, 1–44. [Google Scholar] [CrossRef] [Scilit]
- Johnvictor, A.C. Comparative analysis of machine learning approaches for heatwave event prediction in India. Sci. Rep. 2025, 15, 22431. [Google Scholar] [CrossRef] [Scilit] [PubMed]
- Ke, G.; Meng, Q.; Finley, T.; Wang, T.; Chen, W.; Ma, W.; Ye, Q.; Liu, T.-Y. LightGBM: A Highly Efficient Gradient Boosting Decision Tree. Adv. Neural Inf. Process. Syst. 2017, 30, 3146–3154. [Google Scholar]
- Verma, S.; Srivastava, K.; Tiwari, A.; Verma, S. Deep Learning Techniques in Extreme Weather Events: A Review. arXiv 2023, arXiv:2308.10995. [Google Scholar] [CrossRef] [Scilit]
- Pasche, O.C.; Wider, J.; Zhang, Z.; Zscheischler, J.; Engelke, S. Validating deep learning weather forecast models on recent High-Impact extreme events. Artif. Intell. Earth Syst. 2025, 4, e240033. [Google Scholar] [CrossRef] [Scilit]
- Tourt, D.; Booker, Q.E.; Rebman, C.M., Jr. Strategic application of SMOTE and its variants to enhance AI-driven healthcare classification in imbalanced datasets. Issues Inf. Syst. 2025, 26, 70–85. [Google Scholar]
- Akiba, T.; Sano, S.; Yanase, T.; Ohta, T.; Koyama, M. Optuna: A Next-generation Hyperparameter Optimization Framework. In Proceedings of the 25th ACM SIGKDD International Conference on Knowledge Discovery & Data Mining; Association for Computing Machinery: New York, NY, USA; pp. 2623–2631. [CrossRef] [Scilit]
- Feurer, M.; Hutter, F. Hyperparameter Optimization. In Automated Machine Learning: Methods, Systems, Challenges; Springer: Berlin/Heidelberg, Germany, 2019; pp. 3–33. Available online: https://books.google.com/books?hl=fr&lr=&id=zQiZDwAAQBAJ&oi=fnd&pg=PA113&dq=Feurer,+M.,+%26+Hutter,+F.+(2019).+Hyperparameter+Optimization.+In+Automated+Machine+Learning:+Methods,+Systems,+Challenges+(pp.+3%E2%80%9333).+Springer&ots=9v22P1cw4k&sig=2lvREJ8slgKQlFlH8xxUPDKWIEE (accessed on 21 May 2026).
- Couto, F.T.; Campos, C.; Purificação, C.; Santos, F.L.M.; Andrade, H.N.; Andrade, N.; Nunes, A.B.; Guiomar, N.; Salgado, R. Synoptic and Regional Meteorological Drivers of a Wildfire in the Wildland–Urban Interface of Faro (Portugal). Fire 2025, 8, 362. [Google Scholar] [CrossRef] [Scilit]
- Bohmrah, M.K.; Kaur, H. Advanced Hybridization and Optimization of DNNs for Medical Imaging: A Survey on Disease Detection Techniques. Artif. Intell. Rev. 2025, 58, 122. [Google Scholar] [CrossRef] [Scilit]
- Pedregosa, F.; Varoquaux, G.; Gramfort, A.; Michel, V.; Thirion, B.; Grisel, O.; Blondel, M.; Prettenhofer, P.; Weiss, R.; Dubourg, V.; et al. Scikit-learn: Machine learning in Python. J. Mach. Learn. Res. 2011, 12, 2825–2830. [Google Scholar]
- Páez, A.; Boisjoly, G. Exploratory Data Analysis. In Discrete Choice Analysis with R; Springer International Publishing: Cham, Switzerland, 2022; pp. 25–64. [Google Scholar] [CrossRef] [Scilit]
- Liu, F.T.; Ting, K.M.; Zhou, Z.-H. Isolation forest. In 2008 Eighth IEEE International Conference on Data Mining; IEEE: New York, NY, USA, 2008; pp. 413–422. Available online: https://ieeexplore.ieee.org/abstract/document/4781136/ (accessed on 21 May 2026).
- Kotsiantis, S.B.; Kanellopoulos, D.; Pintelas, P.E. Data preprocessing for supervised leaning. Int. J. Comput. Sci. 2006, 1, 111–117. [Google Scholar]
- Zhao, Y.; Zhang, W.; Liu, X. Grid search with a weighted error function: Hyper-parameter optimization for financial time series forecasting. Appl. Soft Comput. 2024, 154, 111362. [Google Scholar] [CrossRef] [Scilit]
- Bergstra, J.; Bardenet, R.; Bengio, Y.; Kégl, B. Algorithms for hyper-parameter optimization. Adv. Neural Inf. Process. Syst. 2011, 24, 2546–2554. [Google Scholar]
- Chen, T.; Guestrin, C. XGBoost: A Scalable Tree Boosting System. In Proceedings of the 22nd ACM SIGKDD International Conference on Knowledge Discovery and Data Mining; Association for Computing Machinery: New York, NY, USA, 2016; pp. 785–794. [Google Scholar] [CrossRef] [Scilit]
- Breiman, L. Random Forests. Mach. Learn. 2001, 45, 5–32. [Google Scholar] [CrossRef] [Scilit]
- Ghimire, S.; Nguyen-Huy, T.; Deo, R.C.; Casillas-Perez, D.; Salcedo-Sanz, S. Efficient daily solar radiation prediction with deep learning 4-phase convolutional neural network, dual stage stacked regression and support vector machine CNN-REGST hybrid model. Sustain. Mater. Technol. 2022, 32, e00429. [Google Scholar] [CrossRef] [Scilit]
- Duan, S.-B.; Lian, Y.; Zhao, E.; Chen, H.; Han, W.; Wu, Z. A Novel Approach to All-Weather LST Estimation using XGBoost Model and Multi-Source Data. IEEE Trans. Geosci. Remote Sens. 2023, 61, 1–14. [Google Scholar]
- Maharina, M.; Kurniawan, R.; Sutoyo, E.; Saputra, M.H. Machine Learning Models for Predicting Flood Events Using Weather Data: An Evaluation of Logistic Regression, LightGBM, and XGBoost. J. Appl. Data Sci. 2025, 6, 496–507. [Google Scholar]
- Probst, P.; Wright, M.N.; Boulesteix, A.-L. Hyperparameters and tuning strategies for random forest. WIREs Data Min. Knowl. Discov. 2019, 9, e1301. [Google Scholar] [CrossRef] [Scilit]
- Snoek, J.; Larochelle, H.; Adams, R.P. Practical bayesian optimization of machine learning algorithms. Adv. Neural Inf. Process. Syst. 2012, 25, 2951–2959. [Google Scholar]
- Rasp, S.; Dueben, P.D.; Scher, S.; Weyn, J.A.; Mouatadid, S.; Thuerey, N. WeatherBench: A Benchmark Data Set for Data-Driven Weather Forecasting. J. Adv. Model. Earth Syst. 2020, 12, e2020MS002203. [Google Scholar] [CrossRef] [Scilit]
- Ham, Y.-G.; Kim, J.-H.; Luo, J.-J. Deep learning for multi-year ENSO forecasts. Nature 2019, 573, 568–572. [Google Scholar] [CrossRef] [Scilit] [PubMed]
- Kong, W.; Li, H.; Yu, C.; Xia, J.; Kang, Y.; Zhang, P. A deep spatio-temporal forecasting model for multi-site weather prediction post-processing. Commun. Comput. Phys. 2022, 31, 131–153. [Google Scholar] [CrossRef] [Scilit]
- Sham, F.A.F.; El-Shafie, A.; Jaafar, W.Z.B.W.; Adarsh, S.; Sherif, M.; Ahmed, A.N. Improving rainfall forecasting using deep learning data fusing model approach for observed and climate change data. Sci. Rep. 2025, 15, 27872. [Google Scholar] [CrossRef] [Scilit] [PubMed]
- Weyn, J.A.; Durran, D.R.; Caruana, R. Improving Data-Driven Global Weather Prediction Using Deep Convolutional Neural Networks on a Cubed Sphere. J. Adv. Model. Earth Syst. 2020, 12, e2020MS002109. [Google Scholar] [CrossRef] [Scilit]
- Peng, K.; Wang, Z.; Zhu, Z.; Wang, Y.; Yang, Y.; Chen, J.; Yang, T. Machine learning model to accurately estimate the planetary boundary layer height of Beijing urban area with ERA5 data. Atmos. Res. 2023, 293, 106925. [Google Scholar] [CrossRef] [Scilit]
- Abbot, J.; Marohasy, J. Application of artificial neural networks to rainfall forecasting in Queensland, Australia. Adv. Atmos. Sci. 2012, 29, 717–730. [Google Scholar] [CrossRef] [Scilit]
- Bai, S.; Kolter, J.Z.; Koltun, V. An Empirical Evaluation of Generic Convolutional and Recurrent Networks for Sequence Modeling. arXiv 2018, arXiv:1803.01271. [Google Scholar] [CrossRef] [Scilit]
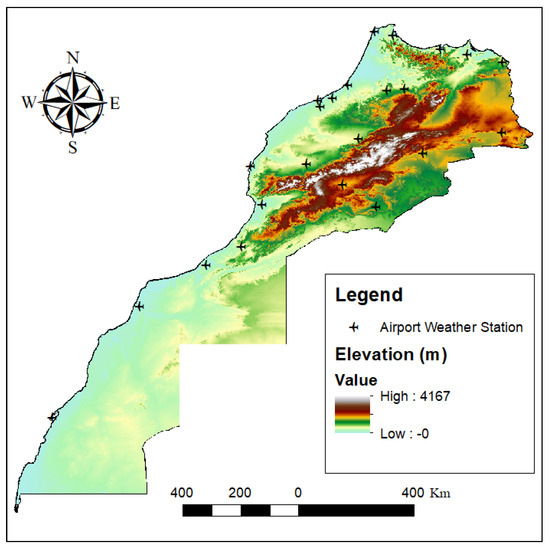
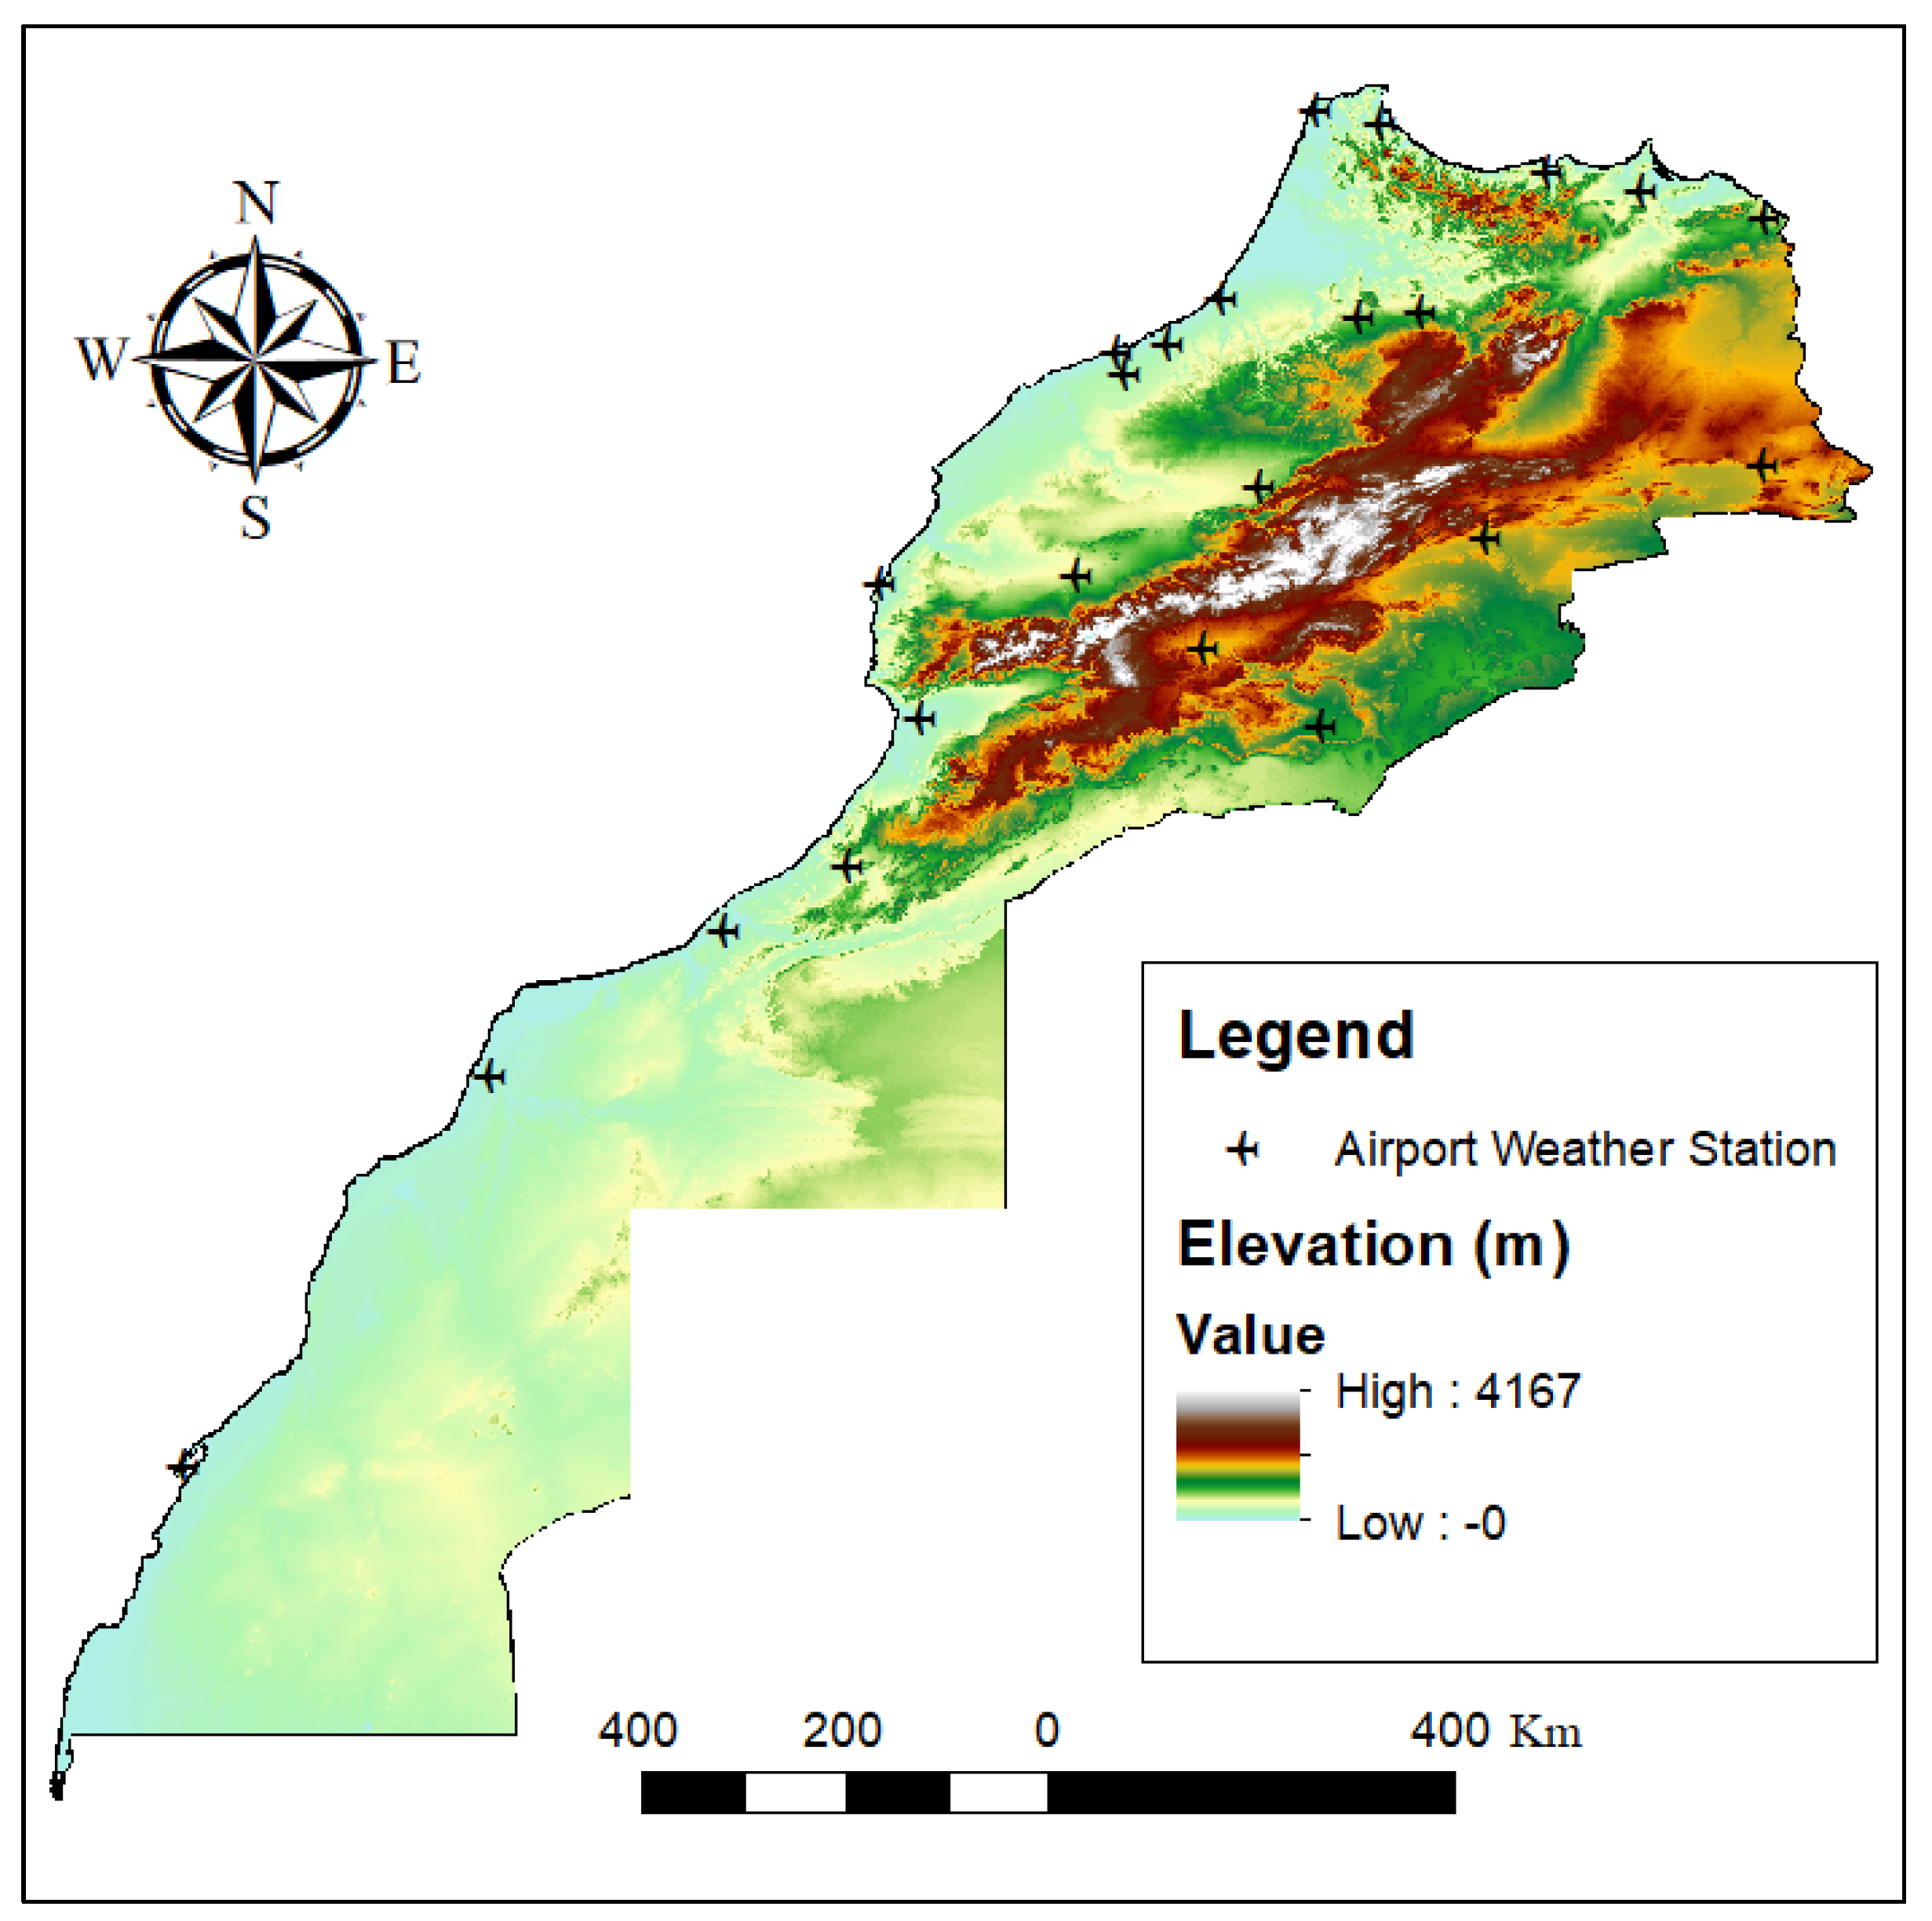
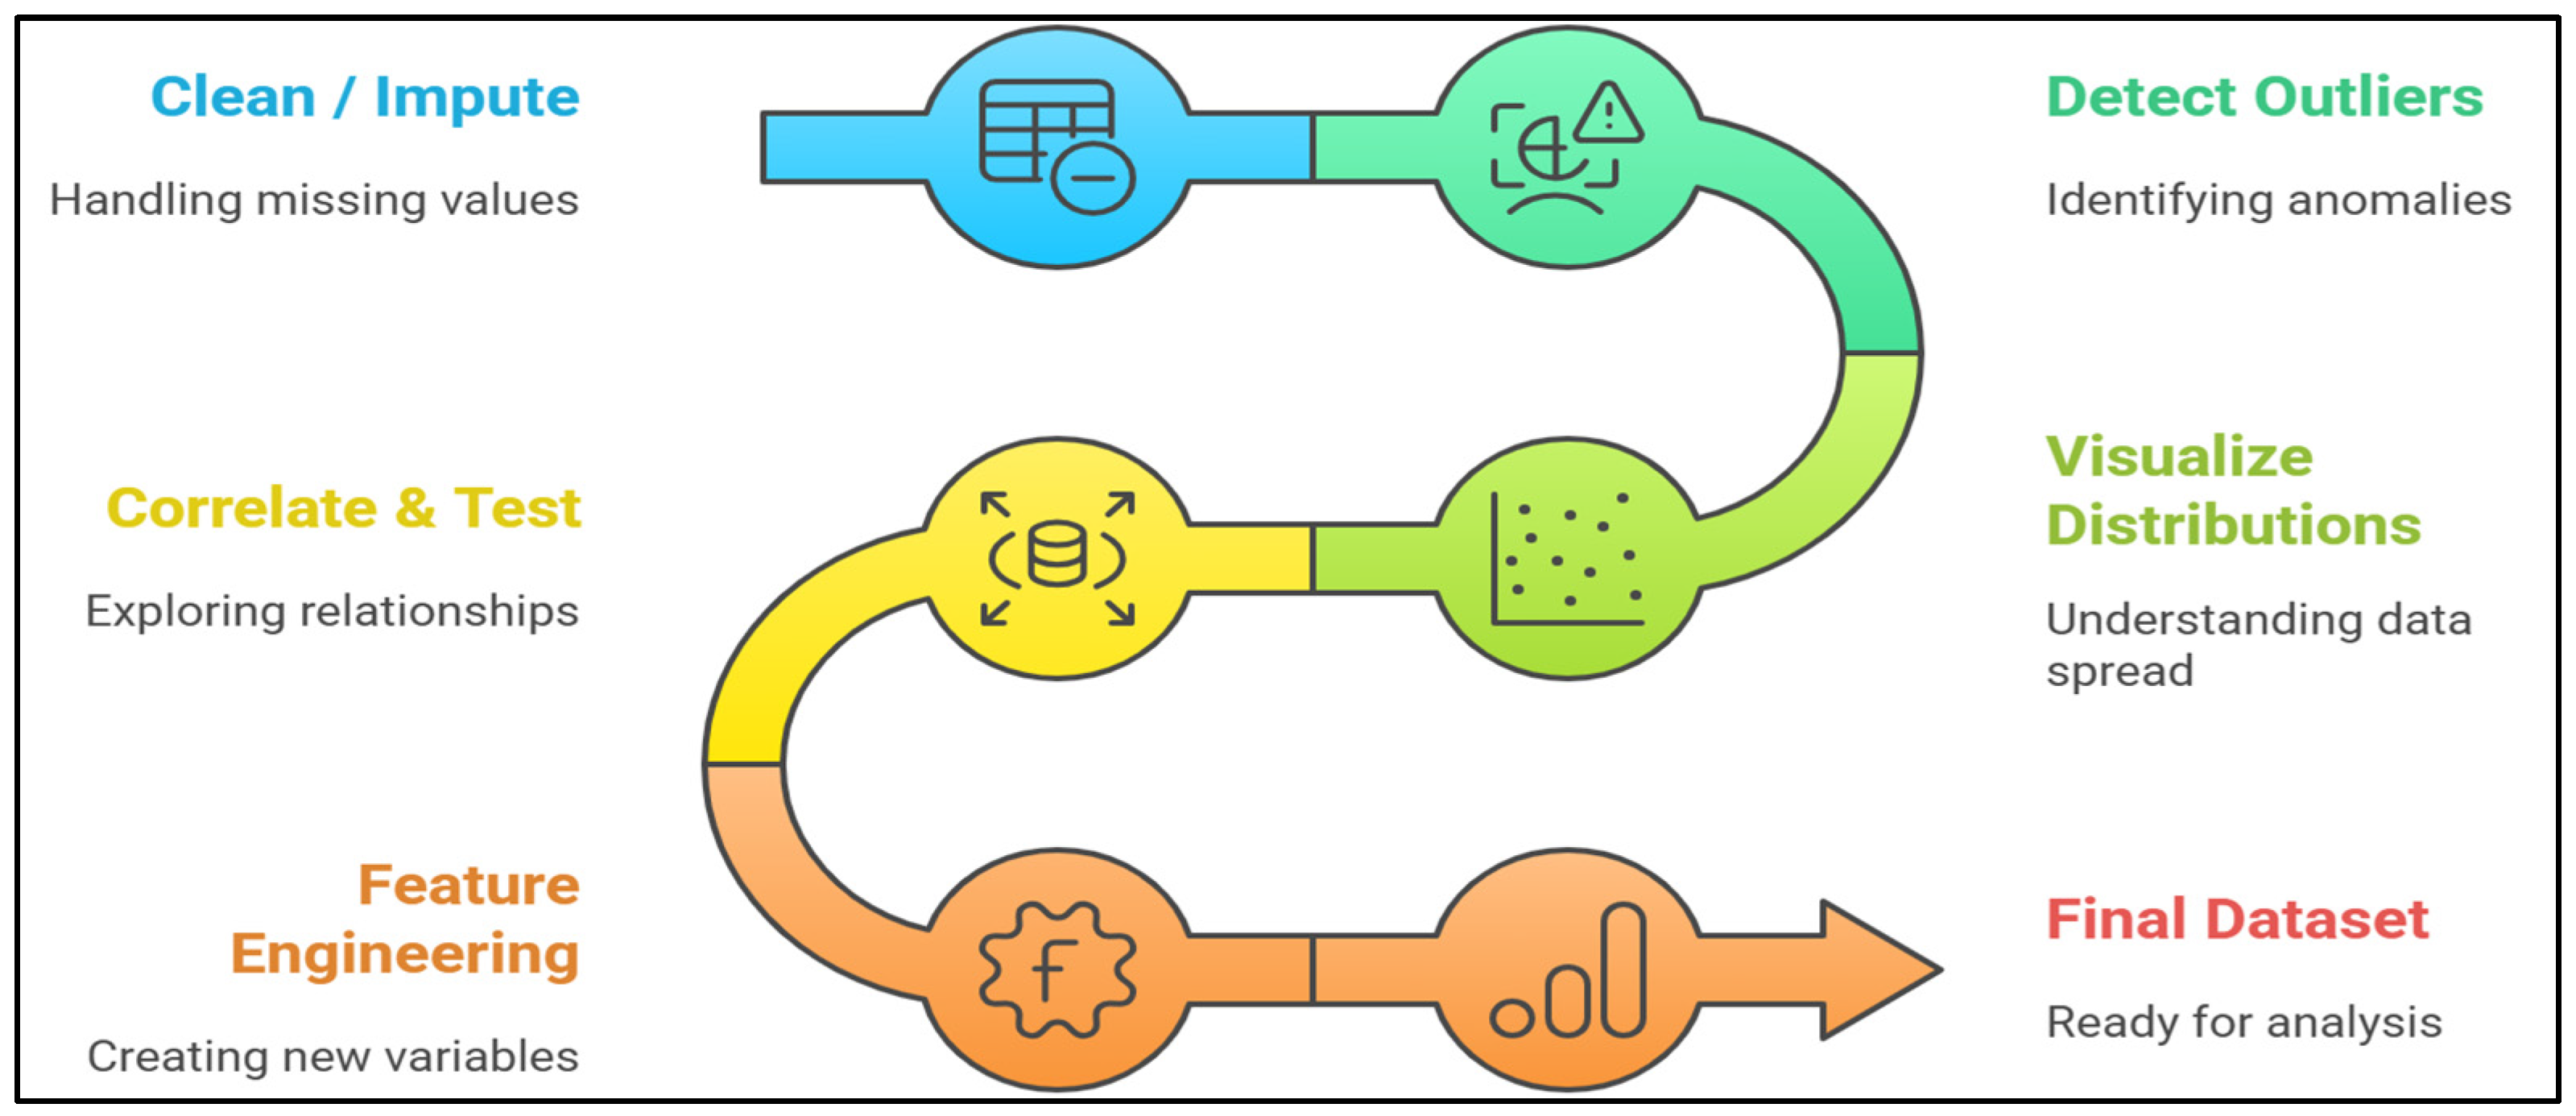
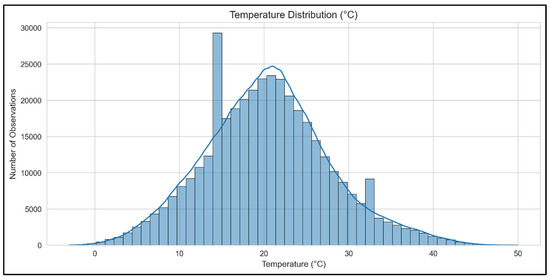
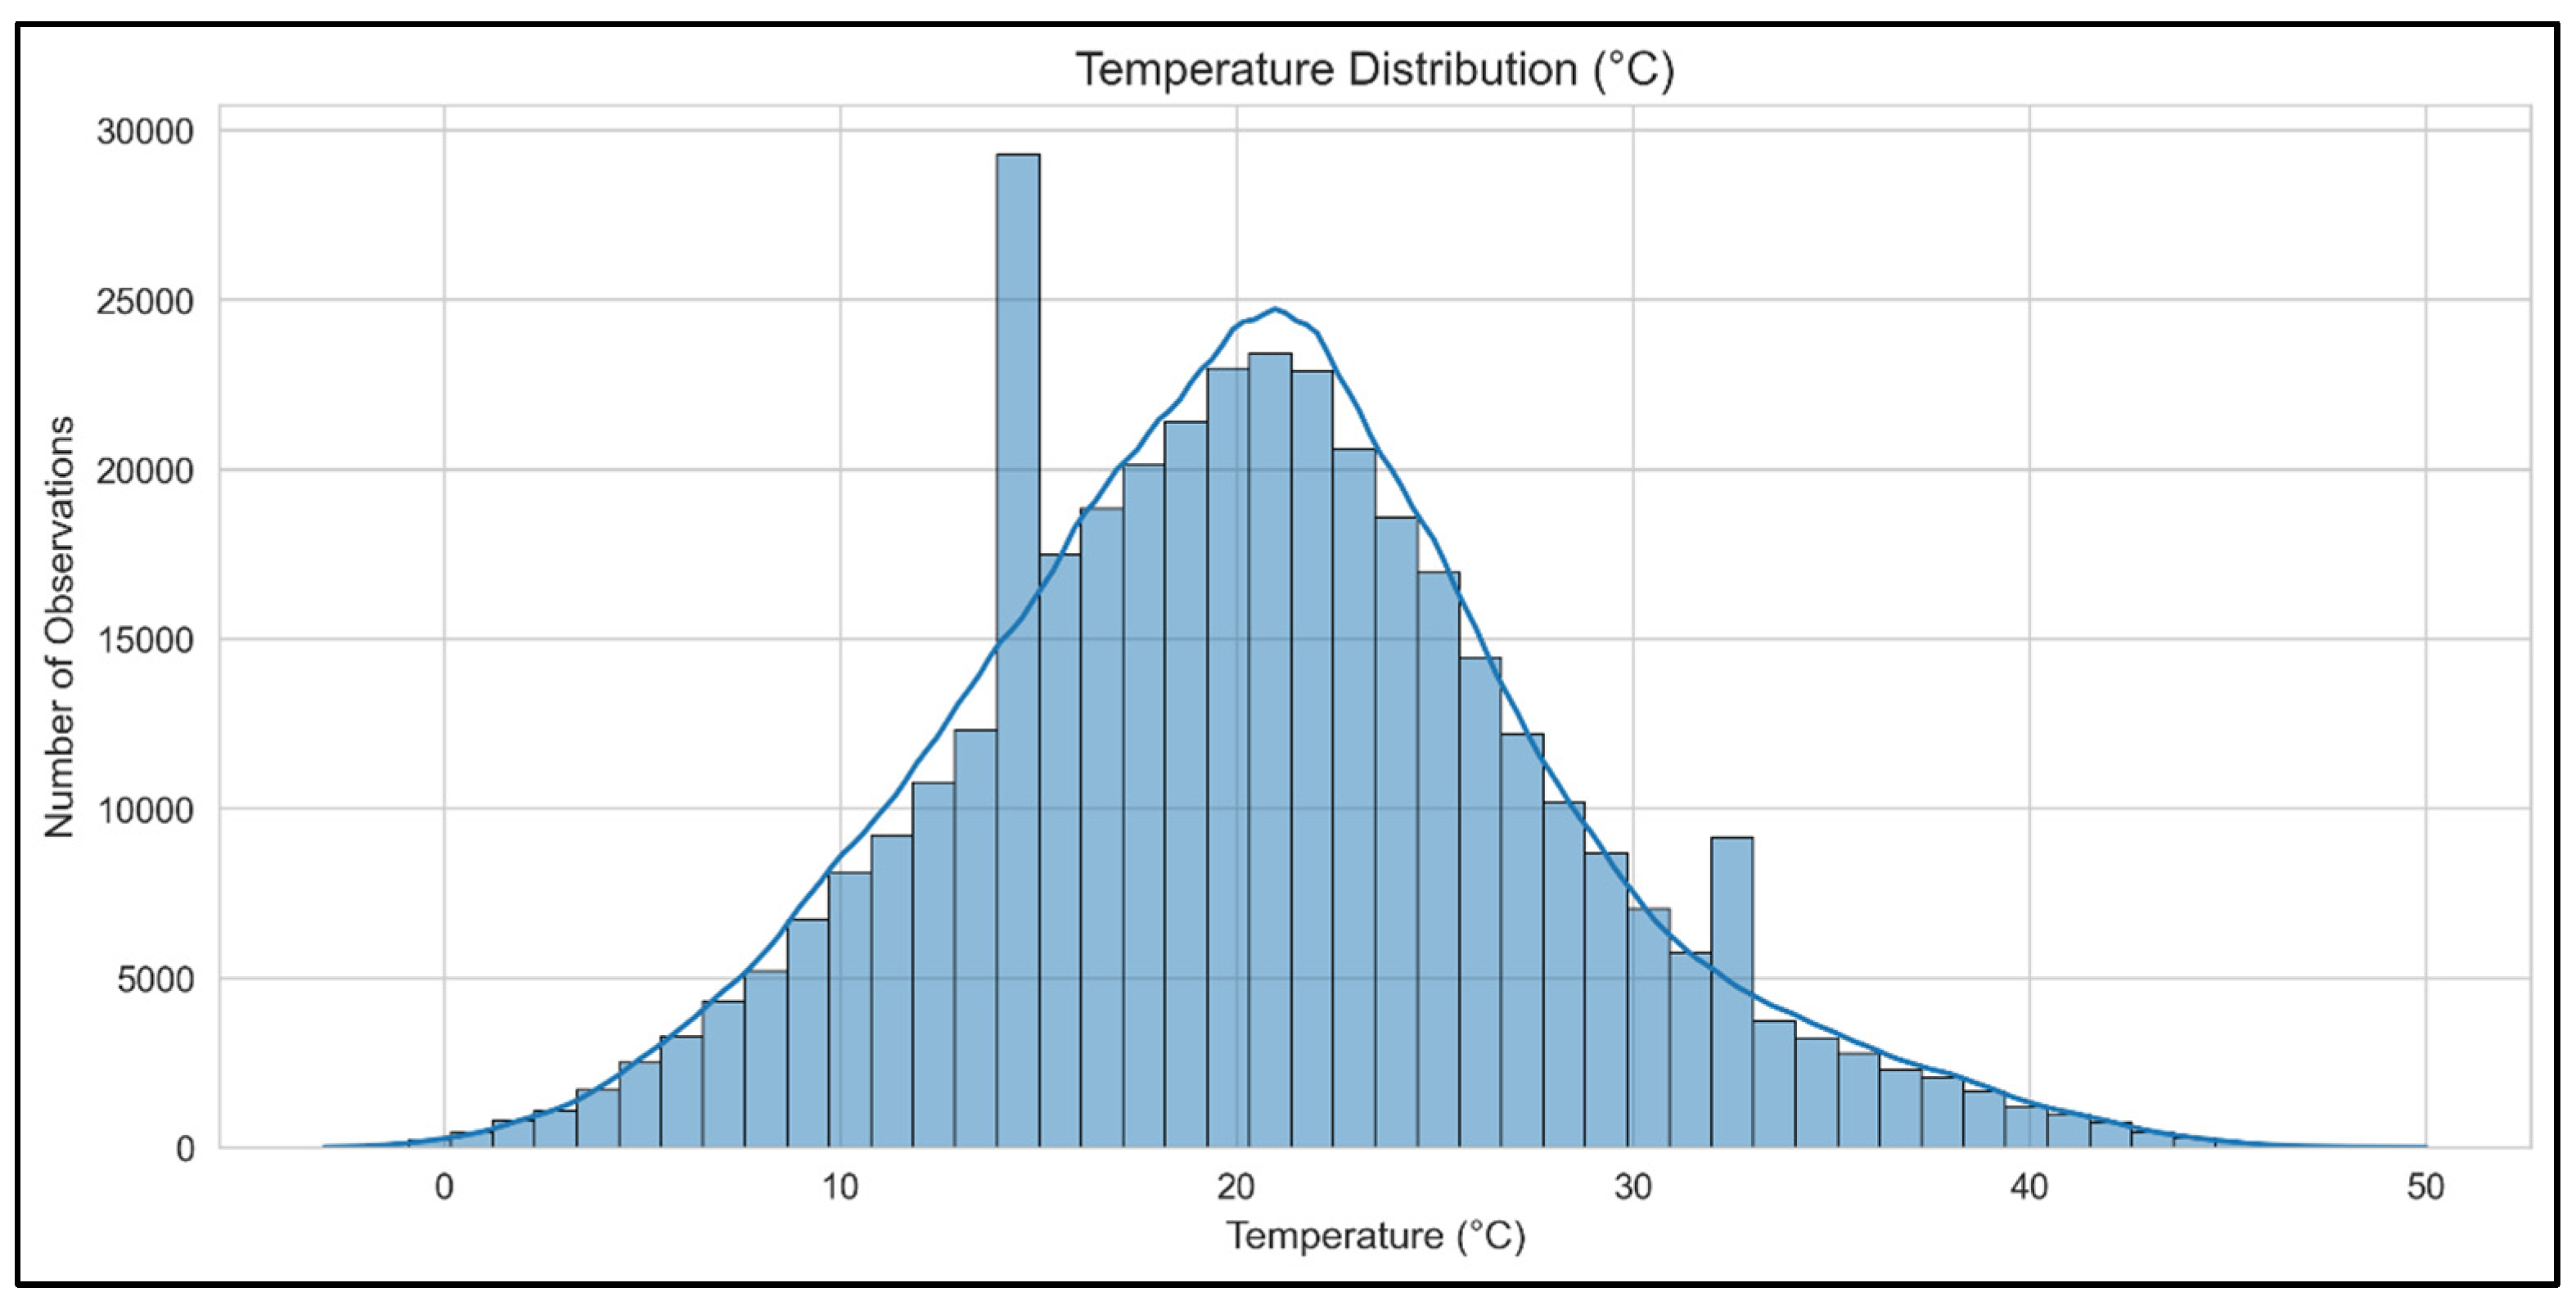
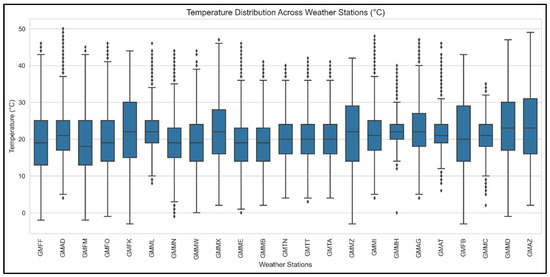
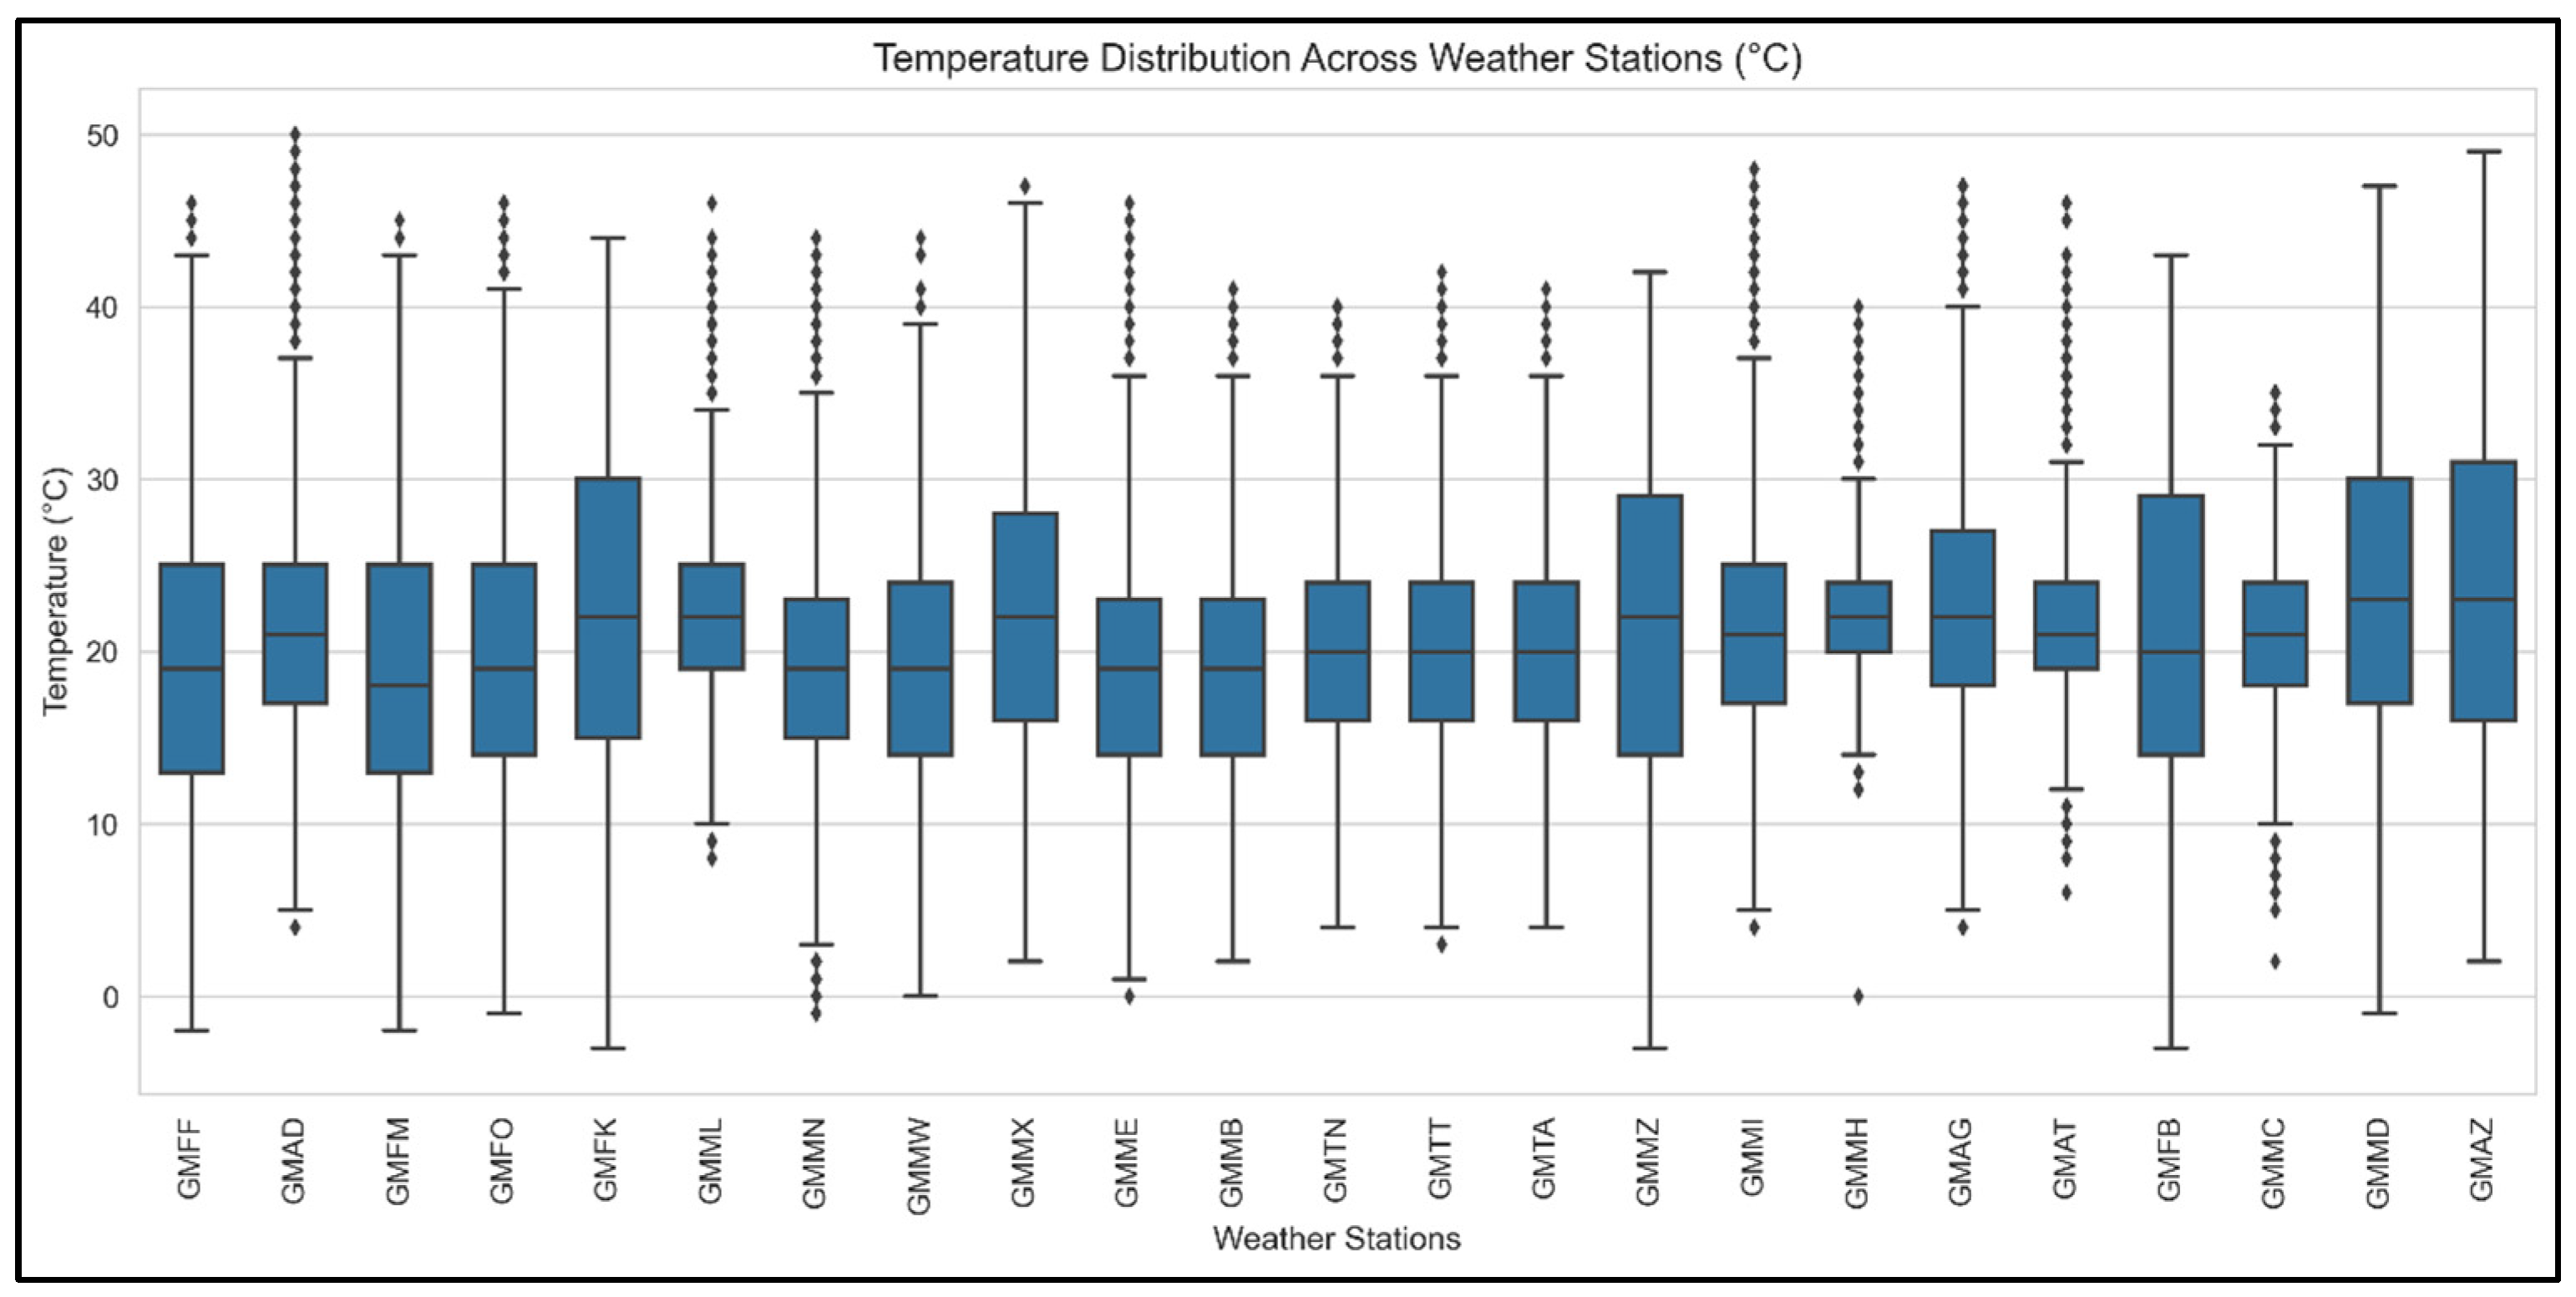
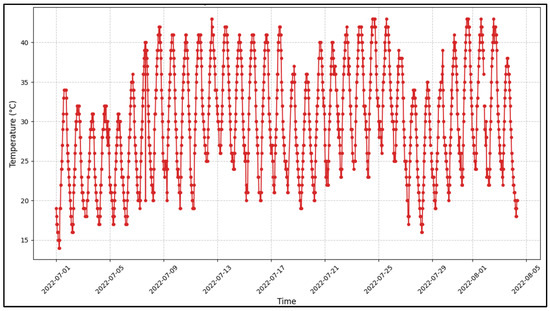
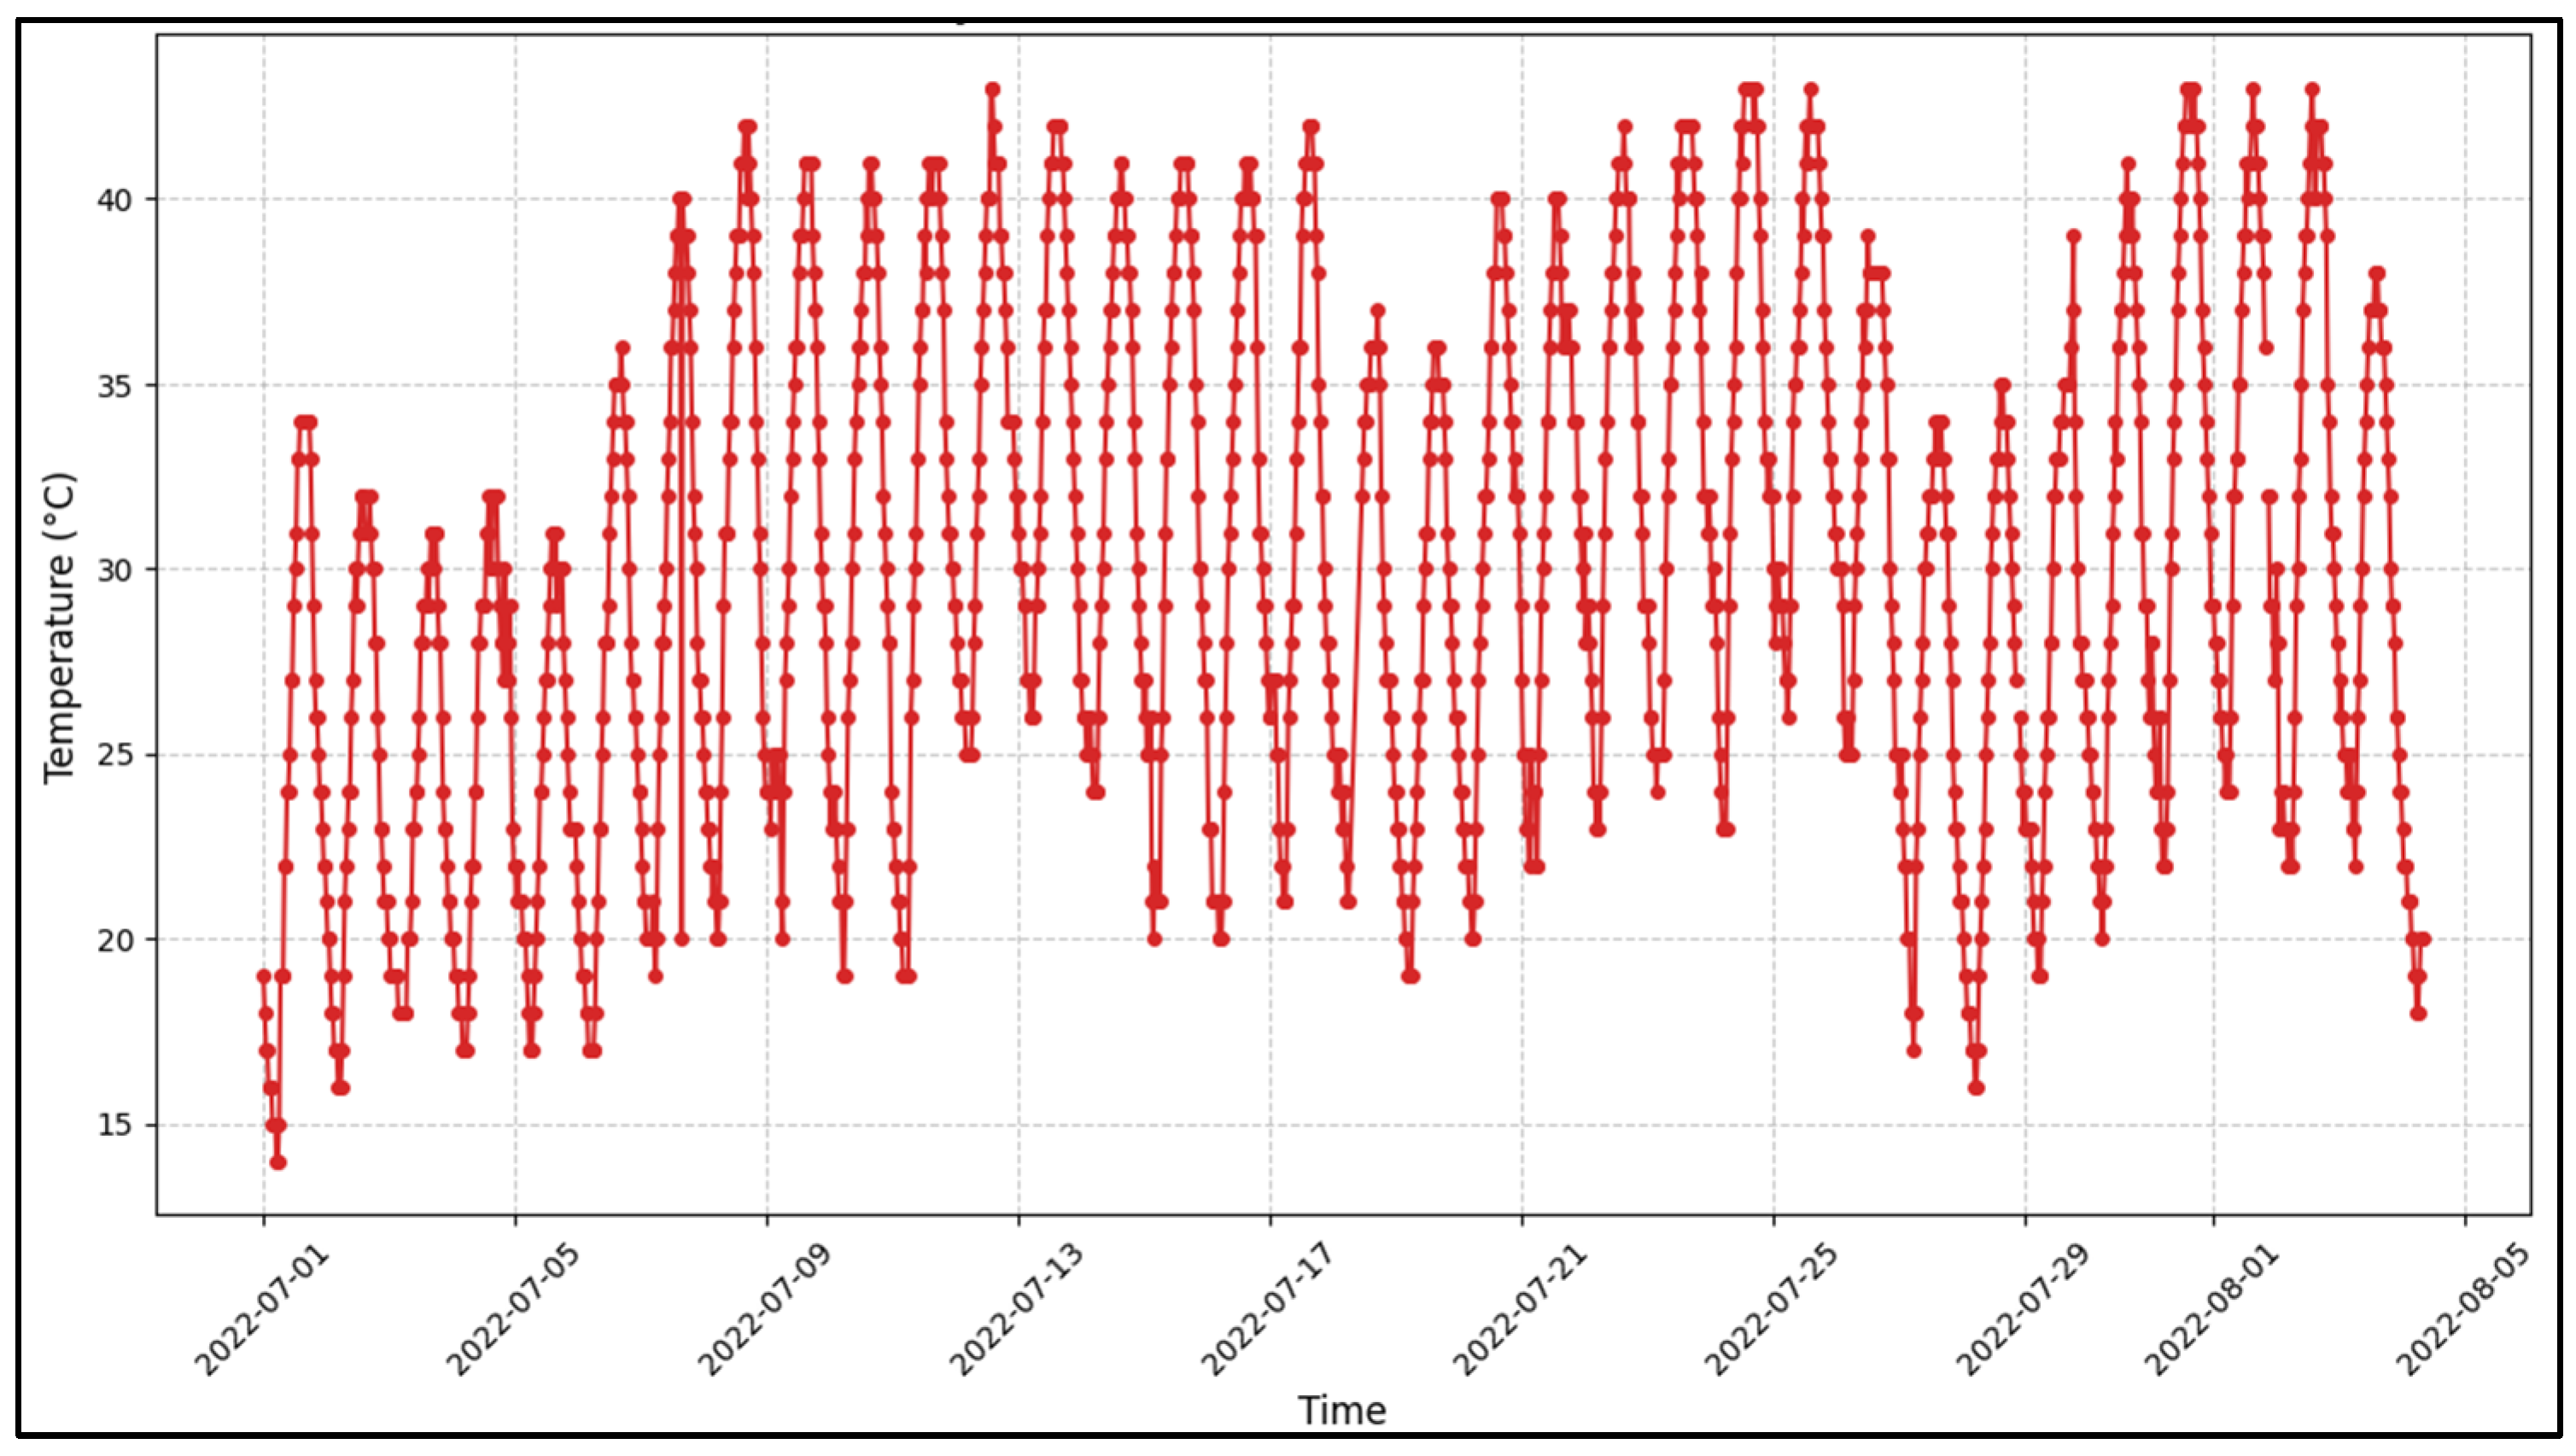
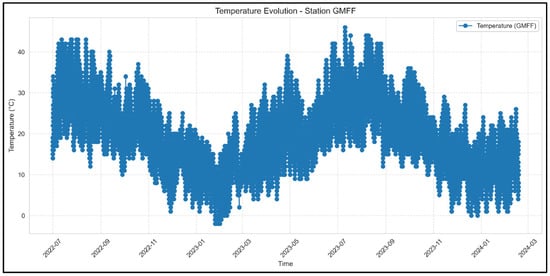
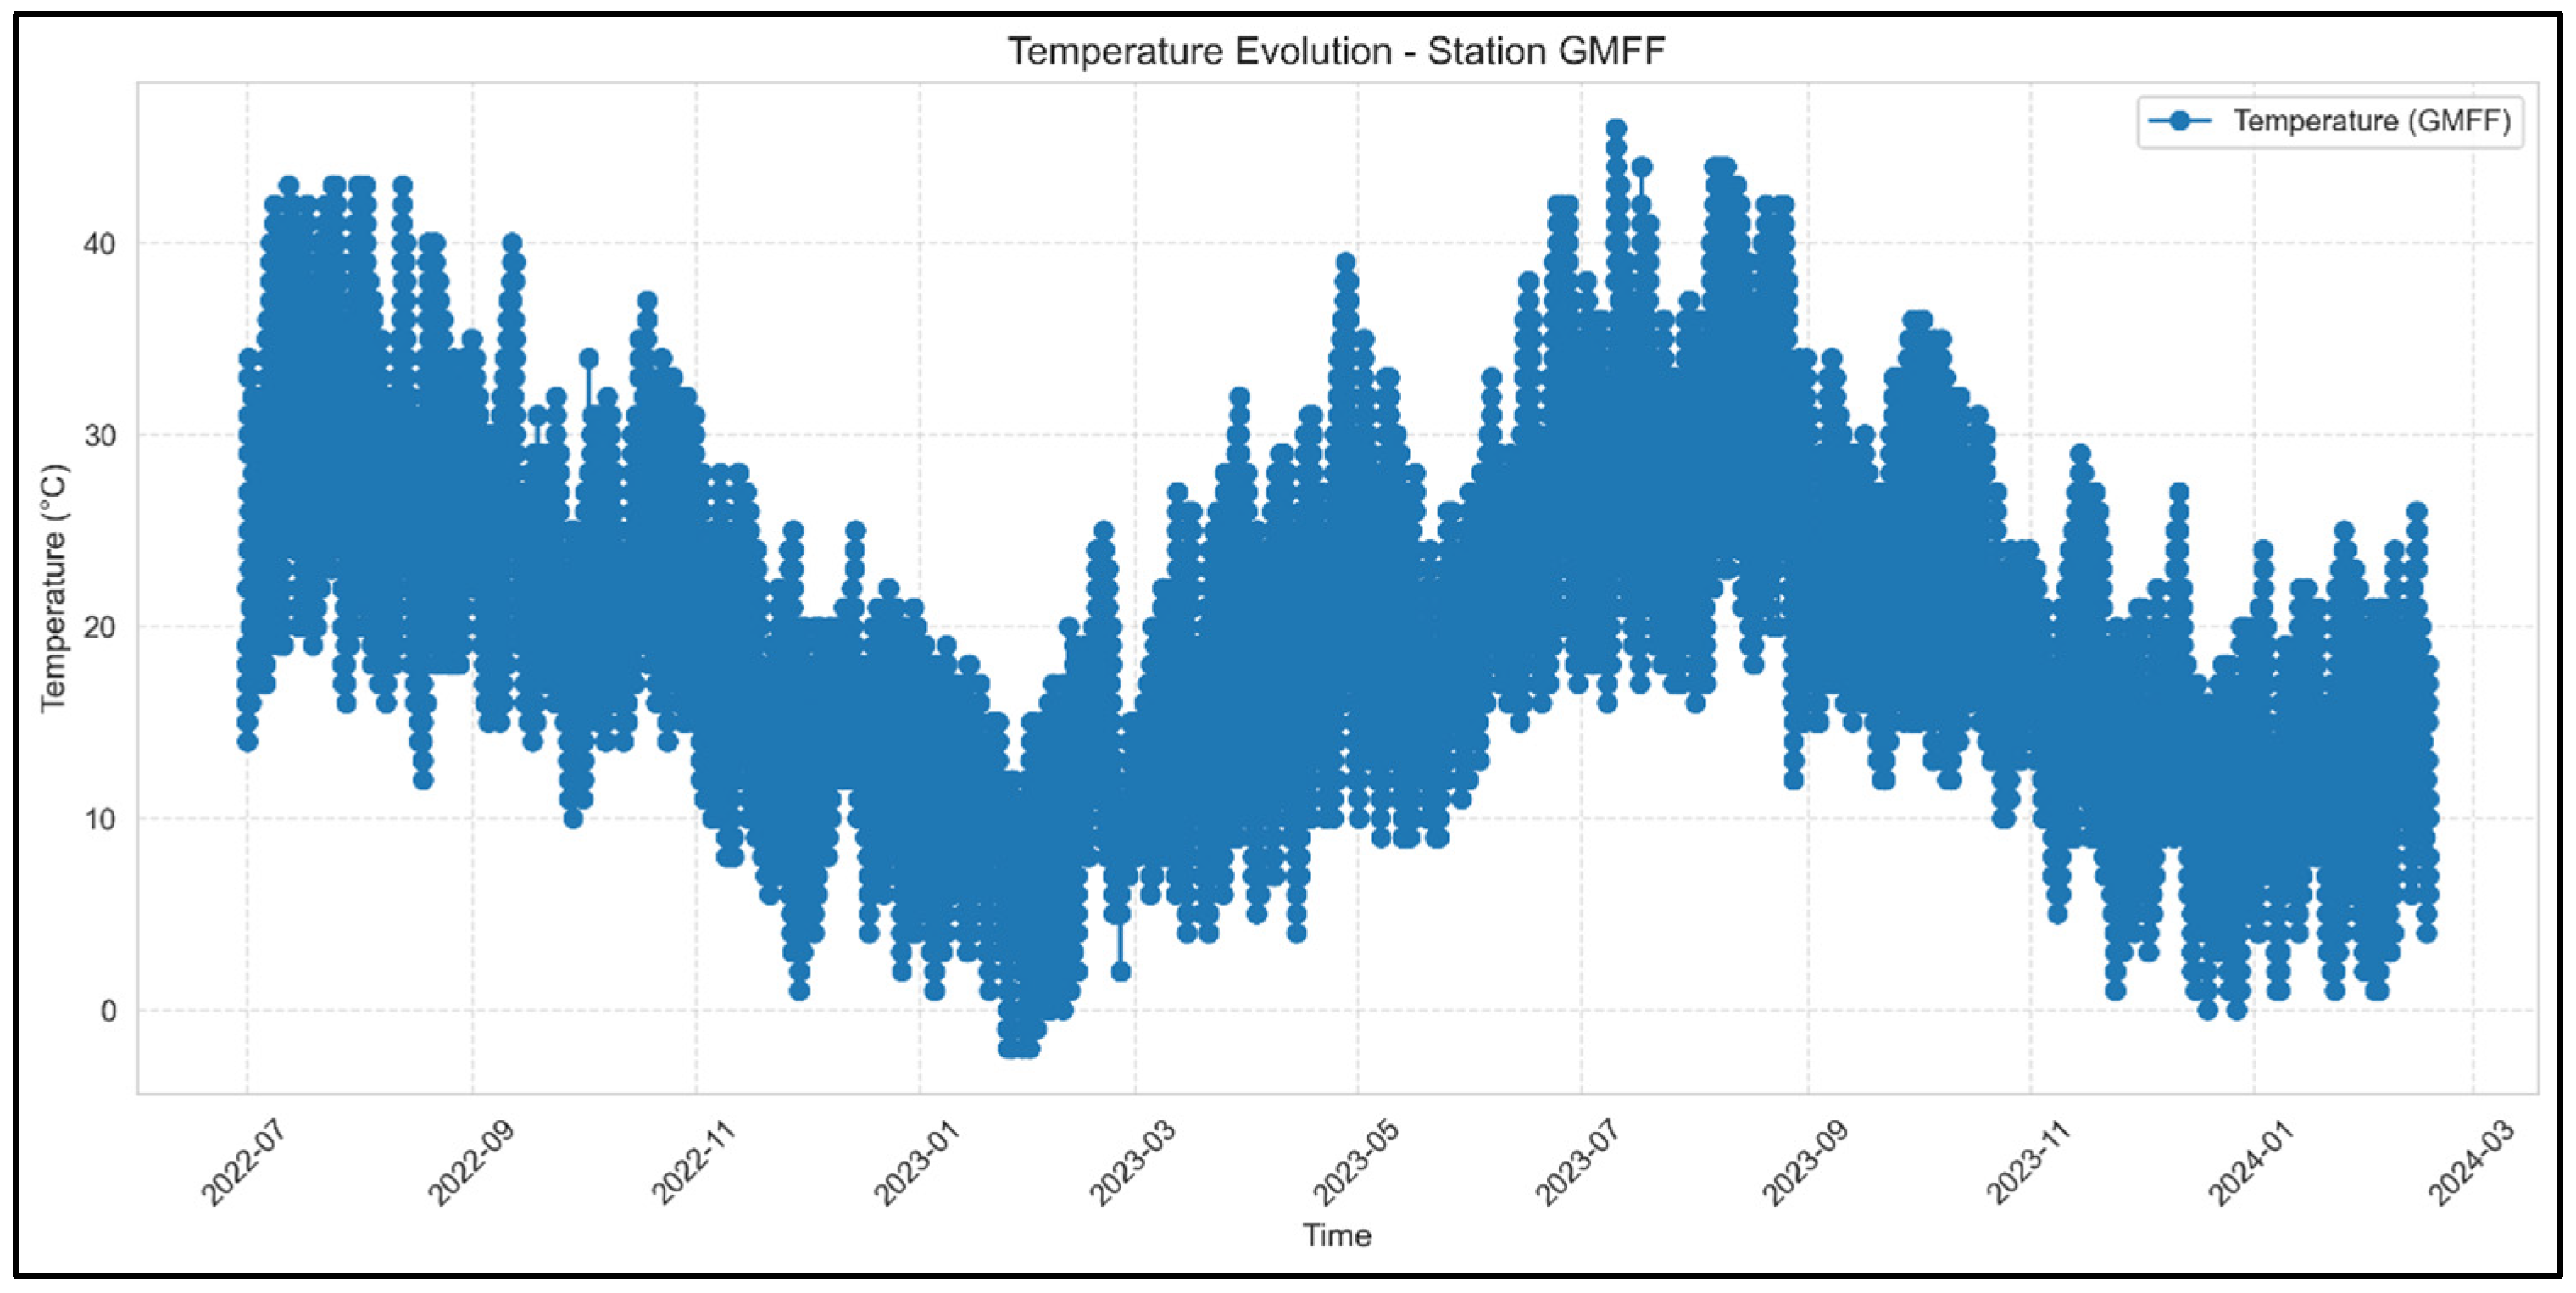
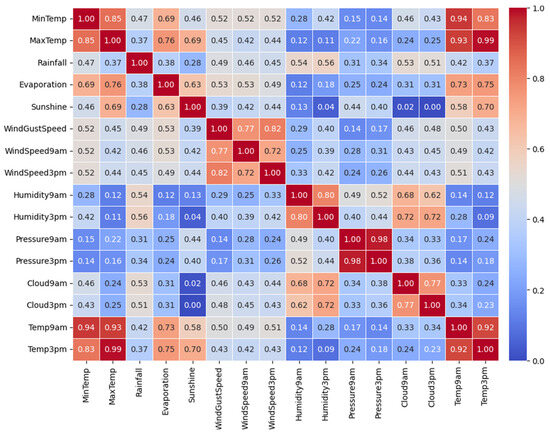
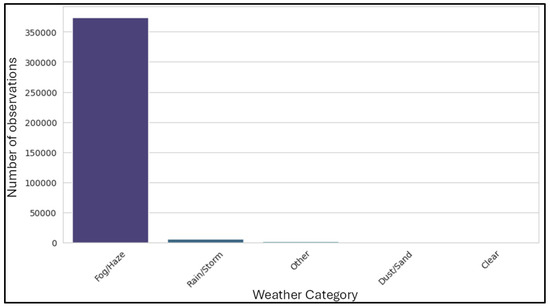
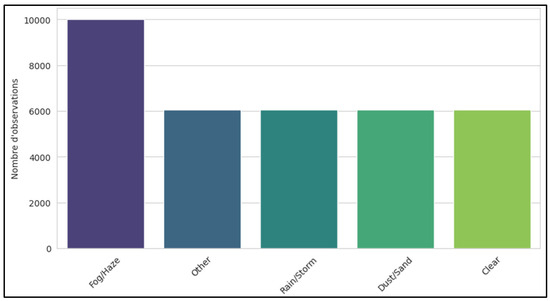
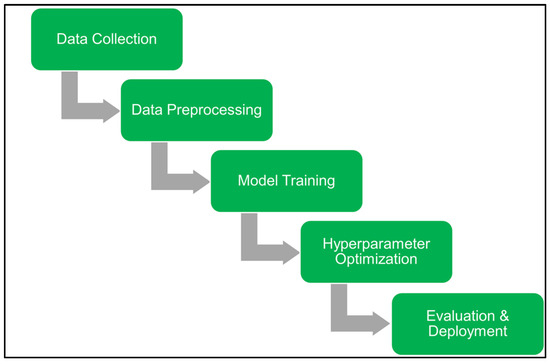
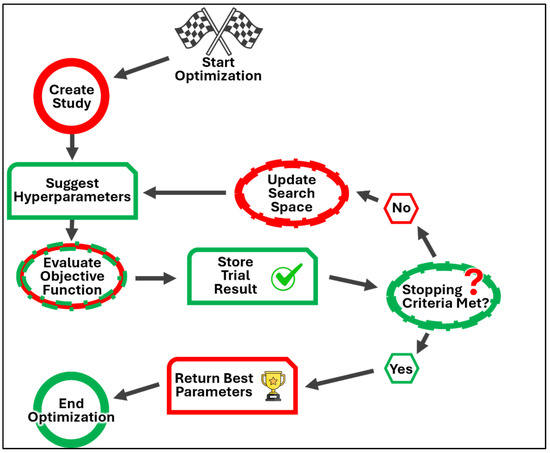
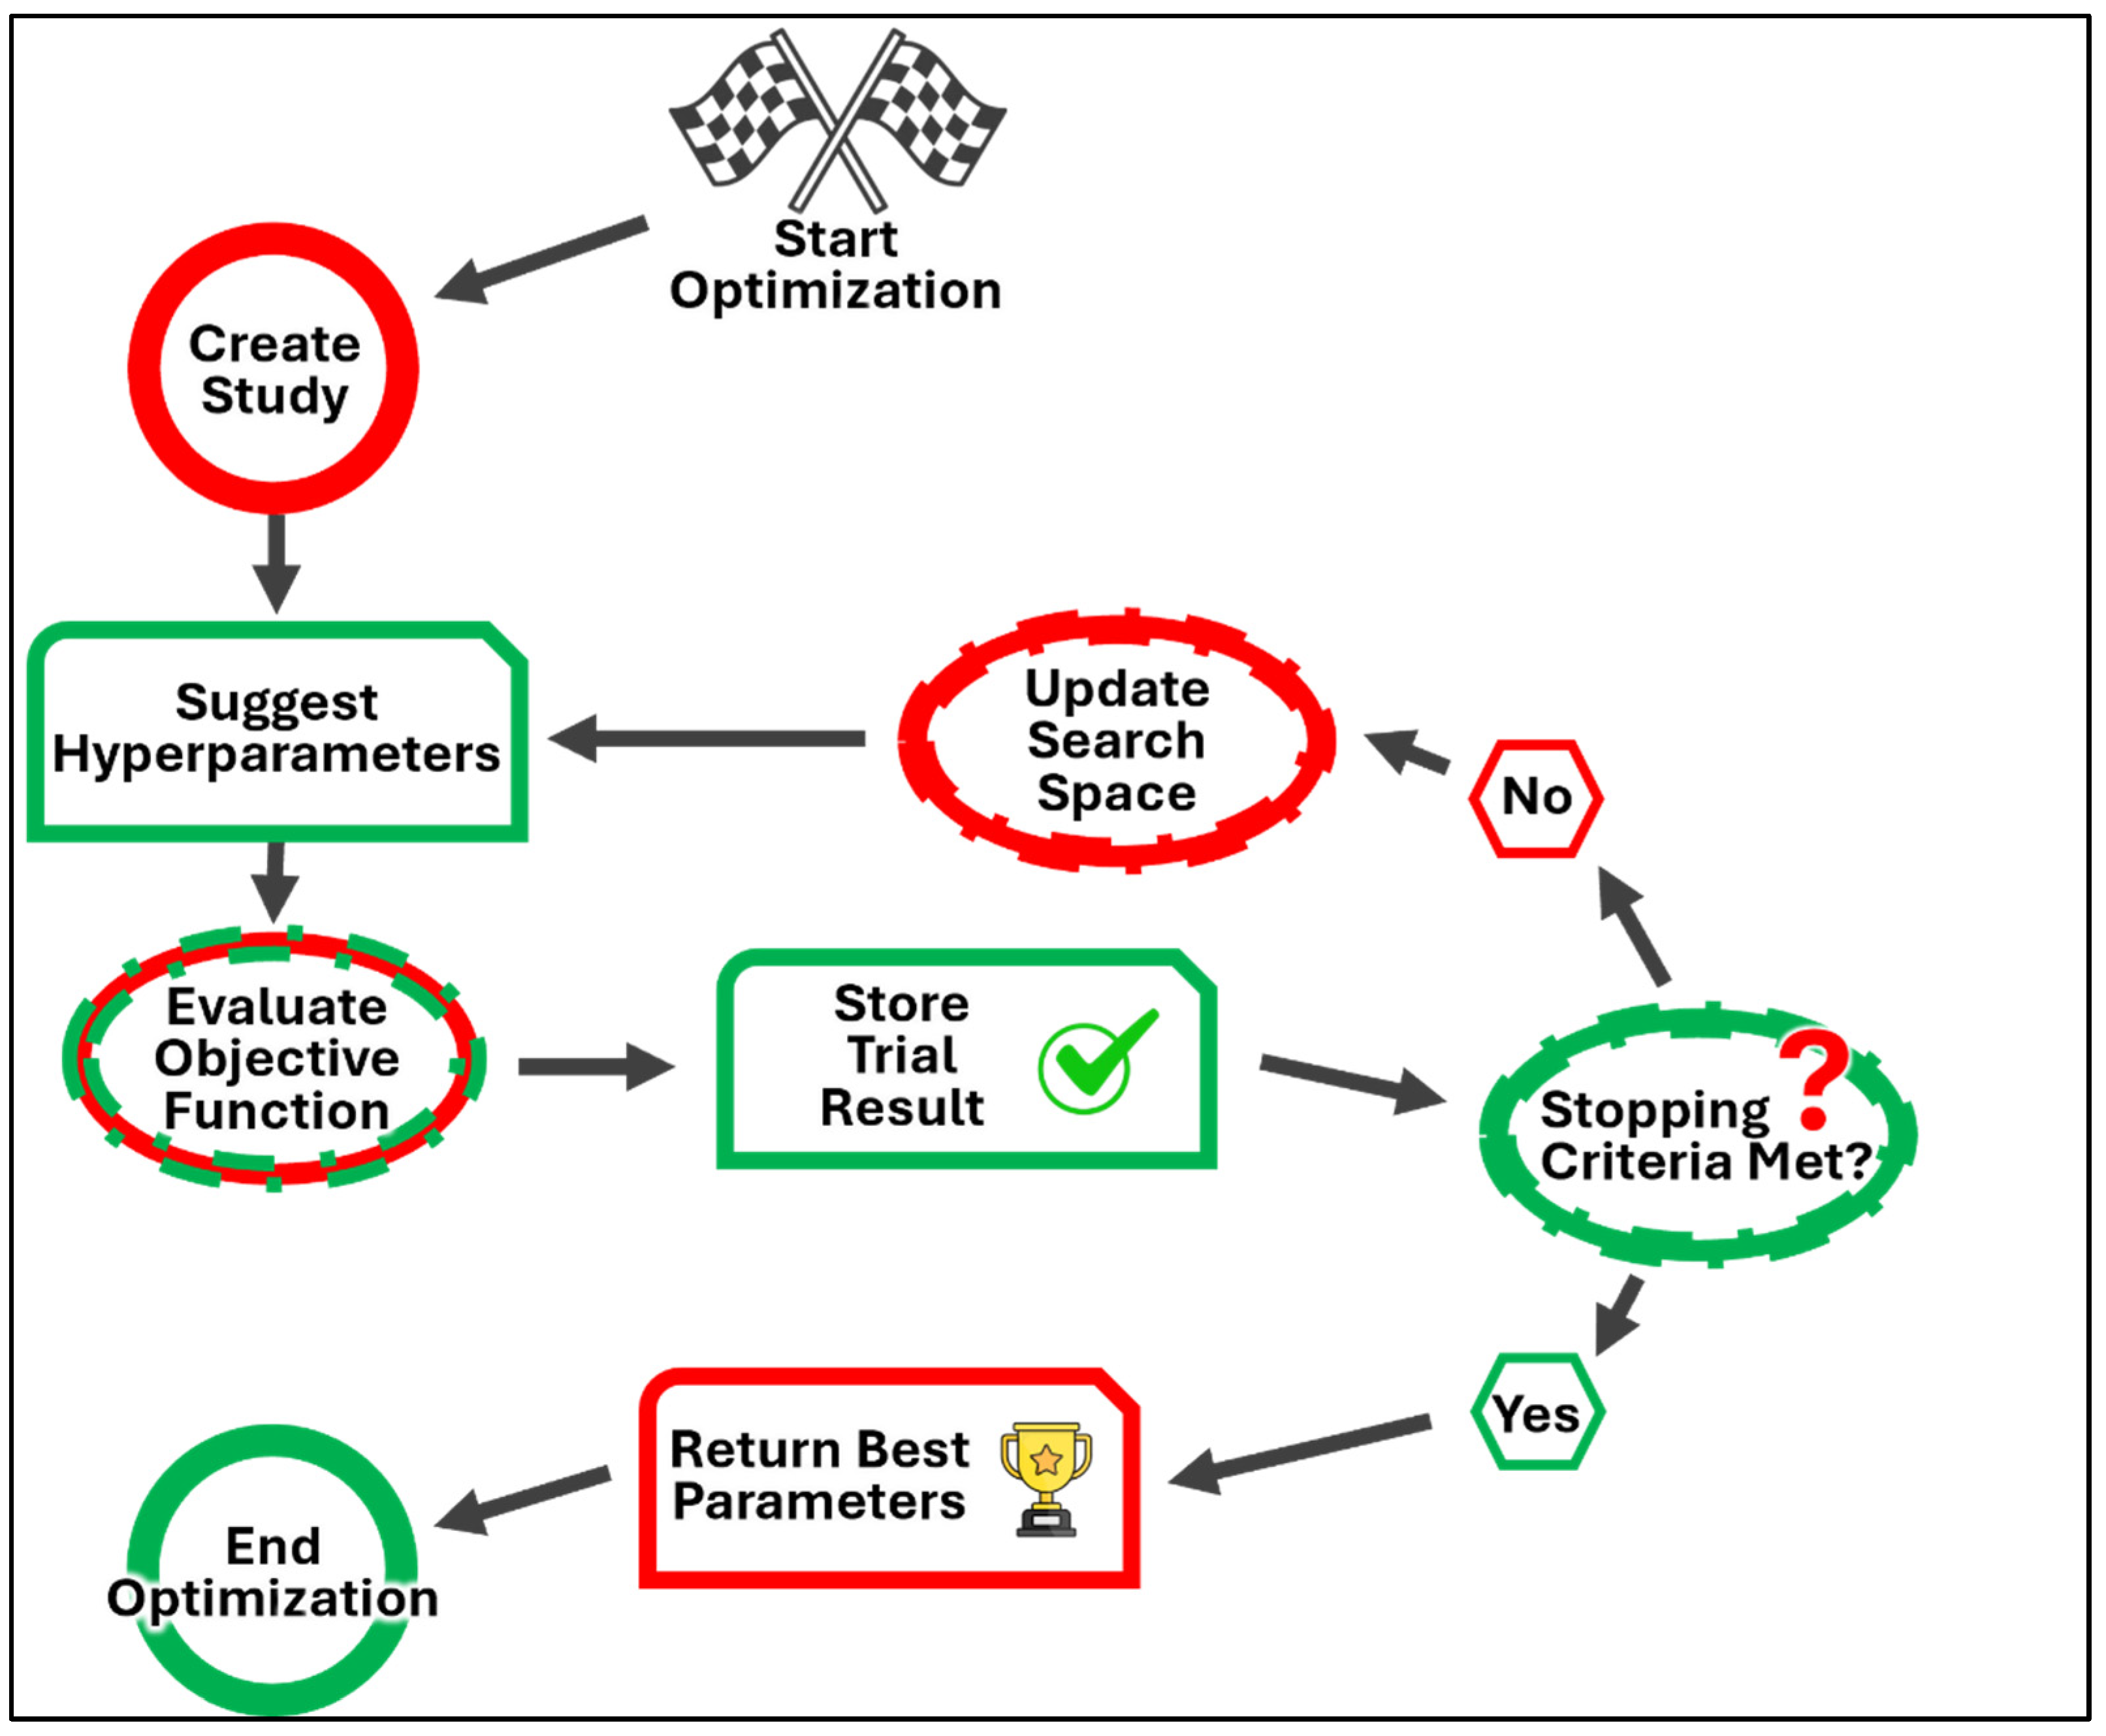
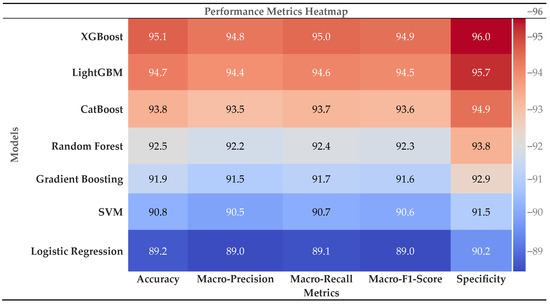
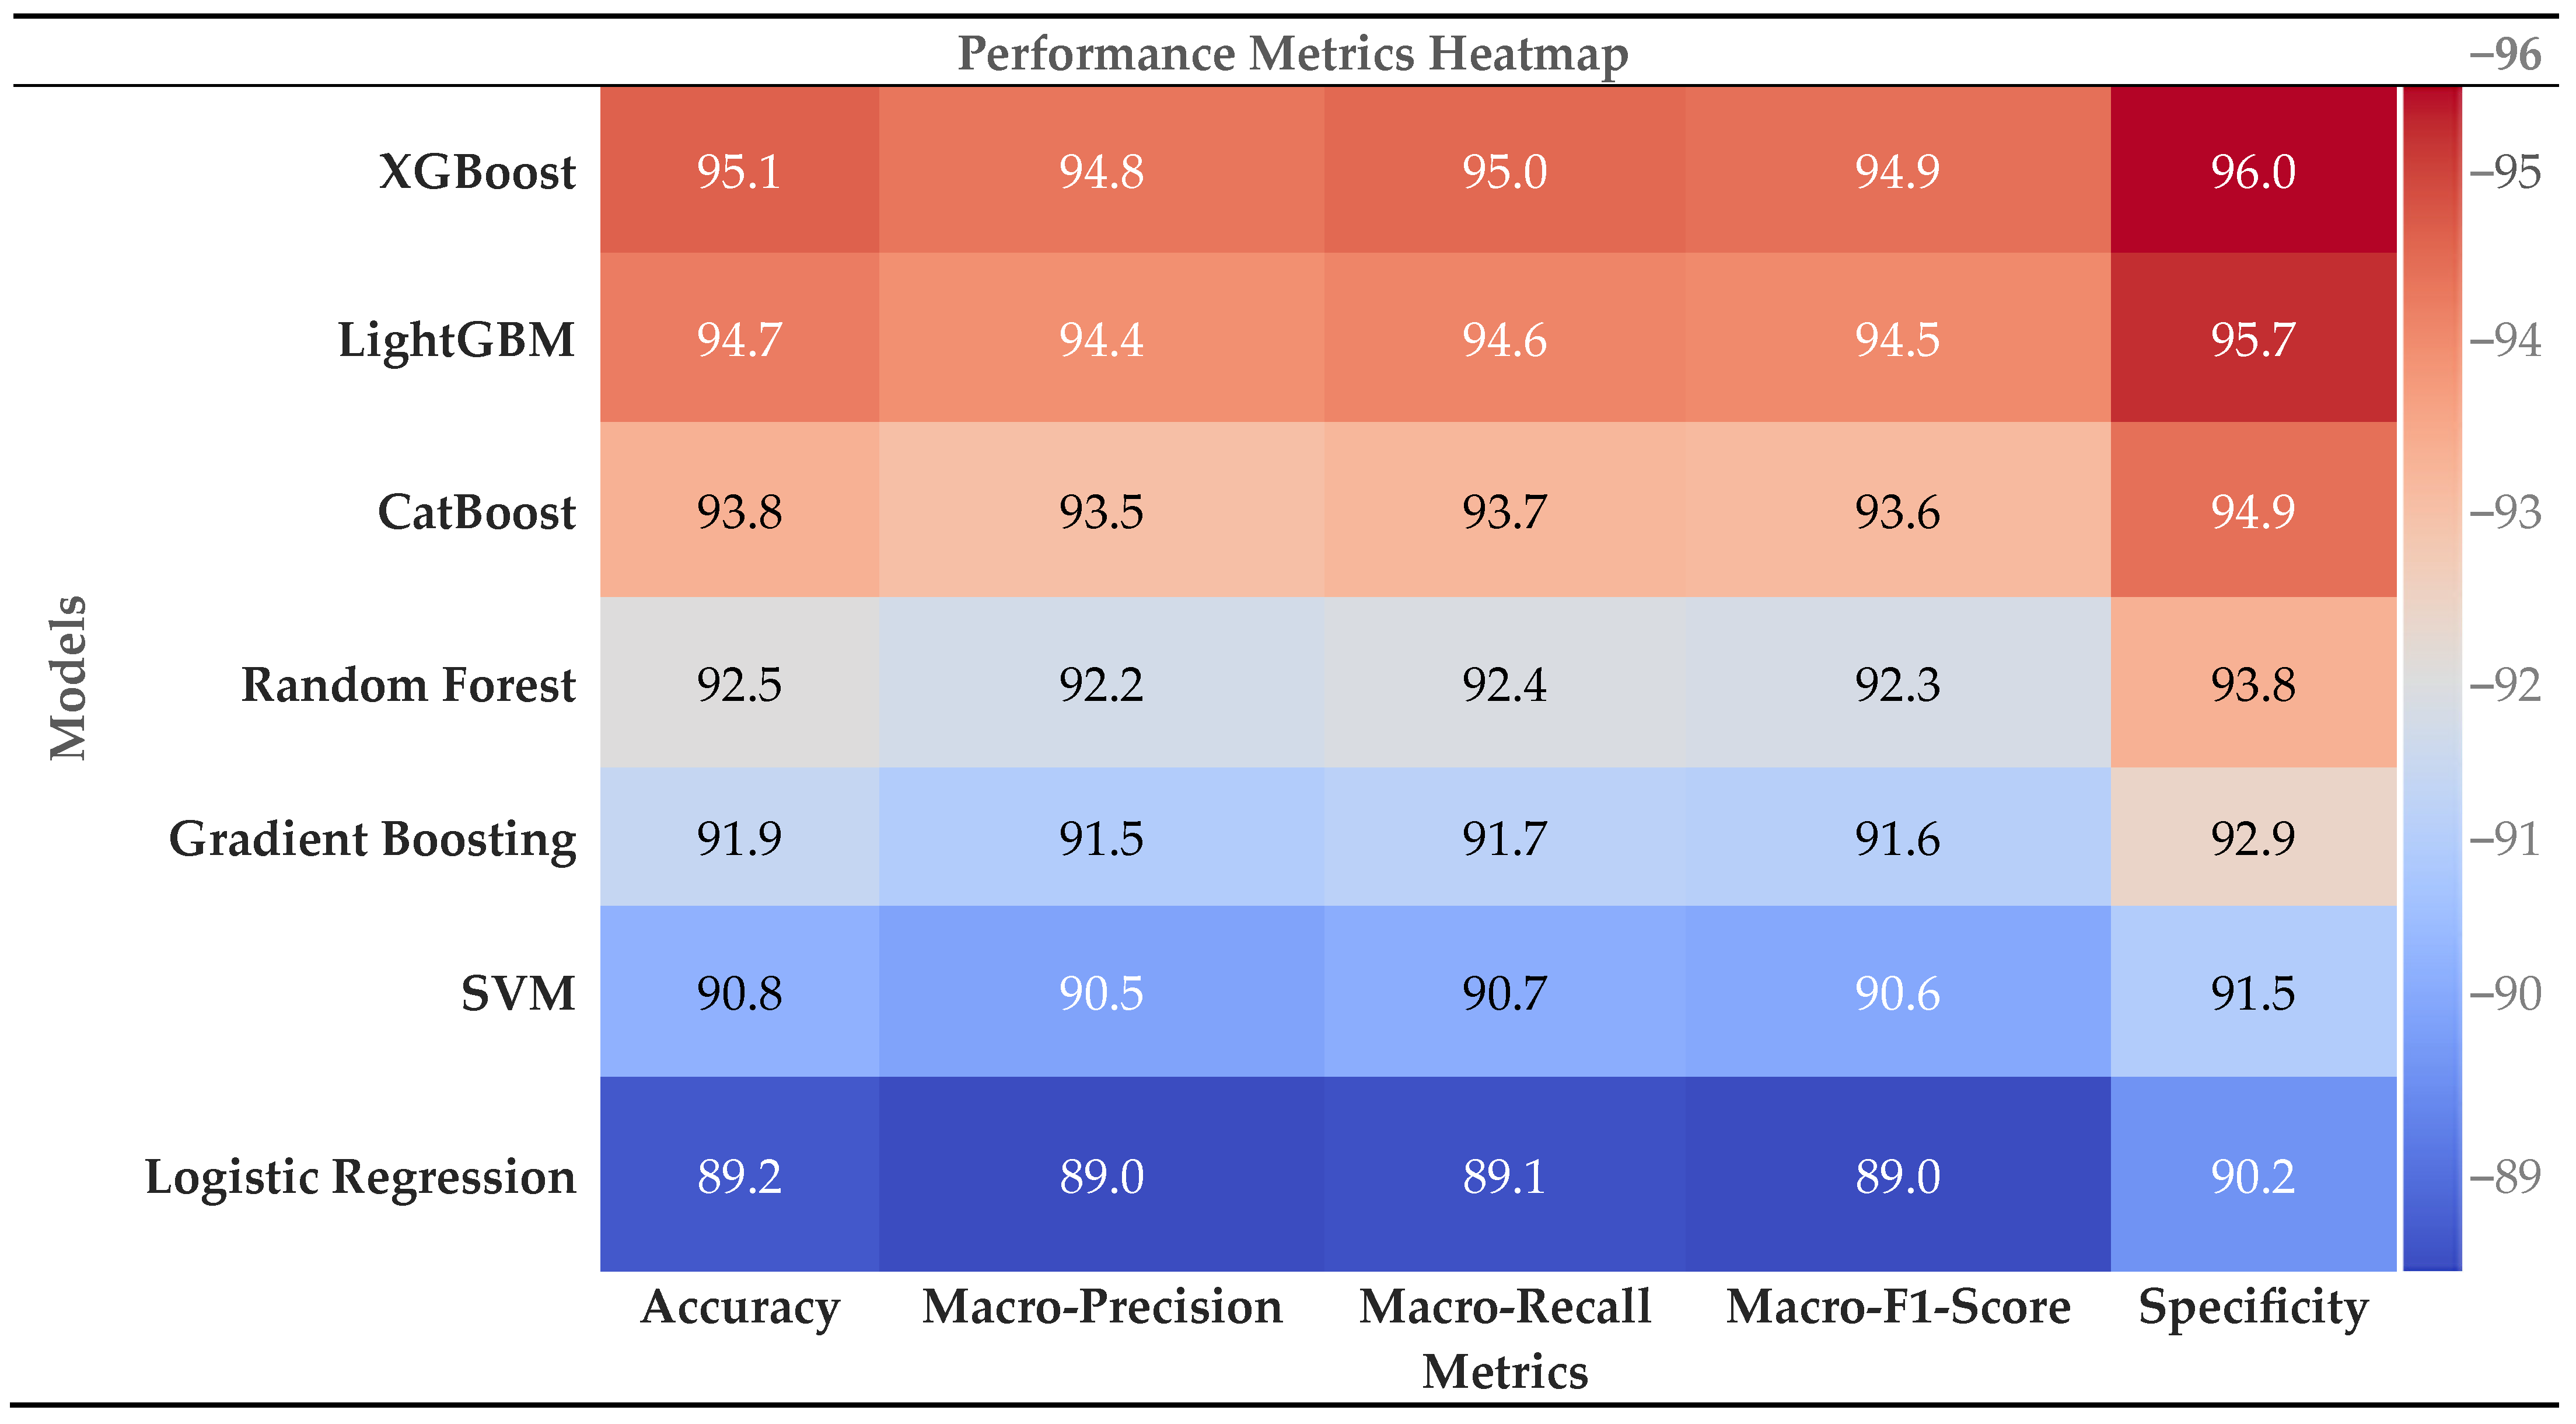
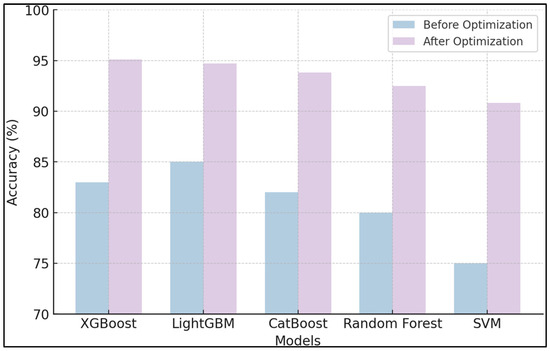

Disclaimer/Publisher’s Note: The statements, opinions and data contained in all publications are solely those of the individual author(s) and contributor(s) and not of MDPI and/or the editor(s). MDPI and/or the editor(s) disclaim responsibility for any injury to people or property resulting from any ideas, methods, instructions or products referred to in the content. |
© 2026 by the authors. Licensee MDPI, Basel, Switzerland. This article is an open access article distributed under the terms and conditions of the Creative Commons Attribution (CC BY) license.