


Abstract
In this study, a soil erosion intensity map for the territory of Serbia was produced using the Modernized Erosion Intensity Coefficient (MEIC-Z), combined with remote sensing data (Sentinel-2) and Geographic Information Systems (GIS). The analysis was based on contemporary geospatial data on lithology, land use, and terrain slope, with a spatial resolution of 30 m. Particular emphasis was placed on modifying the φ coefficient, which significantly improved estimates of erosion intensity. The average erosion intensity at the national level is 0.239, corresponding to the weak erosion class. Multivariate analysis of geographical conditions showed that the highest values of the erosion coefficient (Z) were determined by agricultural land (r = 0.826), while the lowest values were associated with terrain slope (r = −0.805) and forest cover (r = −0.767). In addition to the national-scale assessment, spatial differentiation of the results was performed at the local (municipal) level. Municipalities were differentiated into four clusters using Agglomerative Hierarchical Clustering. The advantage of the modified φ coefficient lies in the integration of land use and terrain slope, enabling a more realistic assessment of the intensity of erosion processes. Validation results demonstrated strong agreement between the modernized Z-derived erosion coefficient and the expert-defined erosion inventory, supporting the internal consistency of the model-derived erosion susceptibility patterns. This study significantly contributes to decision-making at both national and local levels by providing a scientific basis for developing strategies for sustainable forest management and soil conservation.
1. Introduction
Soil erosion represents one of the most important forms of land degradation and a significant challenge to sustainable natural resource management. Although it is a natural geomorphological process, its intensity has been substantially enhanced by human activities, including deforestation, intensive agriculture, urbanization, and inappropriate land use practices [1]. The magnitude of erosion is determined by the interaction of relief characteristics, lithology, climatic conditions, soil properties, and land use [2].
Current assessments indicate that a considerable proportion of agricultural land in Europe is affected by erosion rates exceeding sustainable thresholds, resulting in environmental degradation and reduced agricultural productivity [3]. Future projections suggest that climate change, particularly increasing rainfall erosivity, together with land use change, may further intensify erosion processes during the twenty-first century [4]. Consequently, understanding the spatial and temporal dynamics of soil erosion has become an important prerequisite for sustainable land management and effective soil conservation planning.
There are many soil erosion models and model applications. In many cases, erosion models are used to make scenario-based quantitative predictions as an aid to making land management decisions [5]. A wide range of empirical, conceptual, and physically based models has been developed for the assessment of soil erosion processes worldwide. The most commonly applied approaches include the USLE, RUSLE, RUSLE2, MUSLE, WEPP, EUROSEM, ANSWERS, and SWAT models [6,7,8,9]. Recent advances in Geographic Information Systems (GIS), remote sensing, and spatial modelling have considerably improved the spatial representation of erosion processes. The RUSLE model remains the most widely adopted method for estimating soil erosion intensity at regional and global scales [10]. The model faces ongoing limitations in regional applicability, uncertainties associated with the model, input data, and validation, and the representation of other types of erosion [11]. To address these limitations, RUSLE has been adapted to different local conditions in different countries and regions, such as the United States, China, India, Europe, and Australia [12,13,14,15,16,17,18,19]. However, the application of most of the mentioned models requires extensive and detailed input data on precipitation, runoff, soil characteristics, land use, and sediment transport, which are not available at the necessary spatial and temporal resolutions for most of the territory of Serbia.
The long-term applicability of the EPM across different spatial and temporal scales [20,21,22], both in Serbia and at the international level [23,24,25,26], its demonstrated satisfactory accuracy in previous studies [27,28,29], the availability of contemporary input data, and its high compatibility with the GIS environment [30,31,32] together constitute the main reasons for the selection of this model in this study. Considering this, and given the limited spatial and temporal availability of data, the EPM was selected as the most suitable approach for erosion assessment in Serbia. In this study, its modernized form (MEIC-Z) is applied, which incorporates the erosion intensity coefficient through the modification of the φ parameter. An algorithm that combines contemporary land use with slope in a GIS environment, using high-resolution data, enables more precise quantification of the φ coefficient. By reducing subjectivity in this parameter, higher accuracy in soil erosion assessment is achieved.
Based on the identified methodological and research needs, the main objectives of this study are:
- The development of a national-scale map of soil erosion intensity, including the modernization of the erosion intensity coefficient (MEIC-Z) through the modification of the φ coefficient.
- The quantitative validation of the consistency and reliability of the modified MEIC-Z coefficient.
- The analysis of the spatial distribution of erosion processes at the municipal level through the identification of the most susceptible areas and their geospatial classification based on dominant erosion factors.
In accordance with the established research objectives, this study improves the spatial accuracy of soil erosion intensity assessment in Serbia through the application of a consistent and scientifically validated methodological framework. The combination of the MEIC-Z model and cluster analysis enables the objective spatial classification of areas based on similar physical-geographical, agricultural, and erosion-related characteristics. Such a holistic approach contributes to a more reliable identification of areas with different levels of erosion susceptibility and ensures the operational applicability of the results at national, regional, and local levels.
2. Materials and Methods
2.1. Study Area
Serbia is positioned in the northern temperate light-heat zone between 41°51′ and 46°11′ north latitude. It is a continental country whose territory is 84 km from the Adriatic, 202 km from the Aegean, and 405 km from the Black Sea. In terms of relief, three macromorphological units stand out in Serbia: plains, hilly areas, and mountainous regions [33]. The plains (Pannonian and Moesian) are flat areas formed by block subsidence and sediment accumulation, with active fluvial and aeolian processes (dominated by Quaternary sediments). The Pannonian Plain covers northern Serbia, while the Moesian Plain extends to the far northeast. The hilly areas (peri-Pannonian and peri-Moesian) represent transitional zones between plains and mountains, with rougher relief and dominant slope processes and erosion [34]. Lithologically, they consist of Neogene sediments (gravels, sands, clays, marls). The mountainous regions include the Dinarides, the mountains of the Vardar Zone, the Serbo-Macedonian Massif, and the Carpatho-Balkanides. Often, tectonic depressions (basins) with flat bottoms are found between mountains, formed by block subsidence and sediment accumulation. Together, these three units form the basic morphostructural division of Serbia. The territory lies within an elevation range between 28 m and 2660 m (Velika Rudoka) [35].
Depending on altitude, annual precipitation in Serbia ranges from 500–600 mm to over 1100 mm. June precipitation averages between 60 and 140 mm, while February precipitation ranges from 30 to 100 mm [36]. Above 1800 m, the mean annual air temperature is around 3 °C. In southern Serbia and Belgrade, it exceeds 12 °C [37]. A statistically significant increase in temperature has been recorded in most of the country, with only a slight decrease observed in the far southeast. These results indicate a clear warming trend across almost the entire territory of Serbia [38].
The most widespread climate type in Serbia is the temperate continental climate, characterized by warm summers and evenly distributed precipitation throughout the year. The least represented climate type is the alpine climate, characterized by cool summers and high precipitation amounts, occurring exclusively in the highest parts of the Prokletije and Šar Mountains. The continental climate is characteristic of the lowland regions of central and northern Serbia (Vojvodina), generally below 120–140 m a.s.l. It is characterized by relatively low precipitation amounts and large annual temperature amplitudes [39].
Under the influence of numerous climatic, geological, geomorphological, biological, and anthropogenic factors, Serbia’s hydrographic network has been formed. The average river network density is 323 m/km2 [40].
In areas where annual precipitation exceeds 1000 mm (Prokletije, Šar Mountains), river network density goes beyond 2000 m/km2. Conversely, the eastern and northeastern parts of the country receive less than 600 mm of precipitation, resulting in sparser, often intermittent watercourses [41]. This is especially true for karst areas (about 10% of the territory). Hydrological regimes differ: in the Black Sea basin, the continental regime dominates with maximum flow in spring, while in the Adriatic basin, a modified maritime regime is expressed, with peak precipitation in late autumn and early winter [40]. The largest amounts of water are formed on magmatic and metamorphic rocks. Altitude and slope also influence the number of watercourses, while water quality improves with elevation due to reduced anthropogenic pressure. In terms of vegetation zones, northern Serbia belongs to the steppe zone, while the central and southern parts are predominantly covered by deciduous forests (oak and beech) [42,43]. In the far south, within smaller areas, Mediterranean forests are also present.
2.2. Data Set
To calculate erosion intensity and related natural and anthropogenic factors, numerous spatial datasets were used. The vector state border of Serbia used for the preparation of Figure 1 was obtained from the GeoSerbia geoportal [44]. The Digital Elevation Model (DEM) with a 30 m spatial resolution was generated from the Copernicus Global Digital Elevation Model platform [45]. Larger cities and major rivers were digitized using data from OpenStreetMap [46].
Figure 1.
Geographical location of Serbia.
For obtaining land use information, spatial data from two European geospatial databases were used. The base layer was derived from Sentinel-2 imagery from 2024 obtained from the Environmental Systems Research Institute (ESRI) database, while data from the Copernicus Land Monitoring Service were integrated to extract open forests and closed (dense) forests [47,48]. Using this approach, seven land use classes were obtained: water bodies, open forests, closed (dense) forests, agricultural plots, settlements, bare land, and rangeland (grasslands and pastures). The land use dataset was resampled from 10 m to 30 m to ensure consistency with the other input parameters used in the analysis. The resampling was performed using the nearest-neighbor method, which preserves the original categorical values of land use classes and prevents the creation of mixed or interpolated class values that may occur with other resampling techniques.
Data on geology, i.e., rock types covering the surface of Serbia, were obtained by digitizing the lithological data from the Geological Map at a scale of 1:300,000 [49]. The rocks were classified according to their resistance to soil erosion (Table 1). Subsequently, the data were converted from vector to raster format in QGIS v3.40.9, with a pixel resolution of 30 m [50]. The terrain slope was derived from the Copernicus Global Digital Elevation Model geoportal, with a spatial resolution of 30 m [45]. For the coefficient of erosion type and extent, land use and terrain slope data were integrated to provide a more objective representation. Both parameters were calibrated into a single layer, using data from 2024. The spatial resolution of all input parameters was standardized to 30 m in QGIS software.
Table 1.
Overview of input data used in the study.
2.3. Methodology
For the purposes of this study, the intensity of the erosion process was calculated using the Modernized Erosion Intensity Coefficient (MEIC-Z), which is fundamentally based on the Gavrilović method [20]. Results of relevant research in the field of erosion modeling have shown that, among 11 analyzed semi-quantitative methods, the EPM was rated the most quantitative [27]. The chosen research approach is aligned with the key geographical (spatial) dimension of the problem, as the application of the erosion model provides the most reliable results under the conditions for which it was developed. Validation of the model based on sediment yield data from over 100 watersheds worldwide has shown that the best agreement of results is observed in continental and temperate regions [26]. Furthermore, its application in combination with other models has provided a satisfactory level of accuracy and reliability of results [28,29,51]. Intensive application of the model at the local, national, and regional levels in recent decades has confirmed its scientific and practical value [23,24,30,52]. The simple structure of the model and its low input data requirements make the EPM suitable for regional analyses and planning of soil conservation measures [53,54,55]. The use of modern remote sensing methods and good integration with GIS tools has allowed the previous shortcomings of the model to be overcome [56,57]. This has significantly reduced the subjectivity in the assessment of individual parameters [32]. The erosion coefficient (Z) is calculated as follows:
where: Y—coefficient of soil and rock resistance; X—soil protection coefficient; φ—erosion type and extent coefficient, and I—average slope (%) (Figure 2).
Figure 2.
Thematic maps of the applied parameters: (a) soil and rock resistance coefficient, (b) vegetation protection coefficient, (c) erosion type and extent coefficient, and (d) terrain slope coefficient.
The classification of values for the soil and rock resistance coefficient (Y) is presented in Table 2. The resistance of rocks to erosion intensity depends on their fabric (structure and texture), cementation, degree of consolidation, porosity, and mineralogical composition. Also, subsequent alterations can affect rock resistance. The most resistant rocks are acidic and intermediate igneous rocks. Within sedimentary rocks, well-cemented quartz sandstones are most resistant to erosion. The most resistant metamorphic rocks are quartzites, due to their massive structure and high quartz content. Schistose rocks, ultramafic rocks (frequently serpentinized), red Permian sandstones, loess, flysch and tufa are moderately resistant. Neogene sediments, as well as unconsolidated sediments (alluvium, sand, gravel), display very weak resistance to soil erosion.
Table 2.
Classification of soil and rock resistance and vegetation protection coefficients (Y).
The soil protection coefficient (X) is defined to reflect the ability of different land cover types to protect the surface, with higher values indicating lower resistance and lower values indicating greater protection and weaker erosion (Table 3). On bare land, there is no protection, whereas agricultural areas provide limited protection due to the absence of seasonal vegetation and soil tillage. Meadows and pastures ensure continuous vegetation cover that enhances infiltration, thereby reducing erosion, while open forests further mitigate erosion processes due to the presence of woody vegetation. The most effective natural protection is provided by dense (closed) forests, where the canopy, humus layer, and well-developed root system significantly reduce surface runoff and stabilize the soil. The lowest values are observed in built-up areas, where classical soil erosion is almost negligible because of the very limited exposure of soil. Water surfaces were not evaluated due to material accumulation processes.
Table 3.
Classification of vegetation protection coefficients (X).
The classification of values for the erosion type and extent coefficient (φ) is presented in Table 4. The classification is based on the combination of land cover type and terrain slope, with higher φ values indicating extremely unfavorable conditions and excessive erosion intensity. In comparison, lower values correspond to areas with minimal erosion. The highest φ values are characteristic of bare land and agricultural areas on steep slopes (>20°), where the lack of vegetation and high terrain energy lead to intense erosion processes. Agricultural areas have a slightly lower φ coefficient than bare land because they typically provide a certain degree of vegetation cover during parts of the year, which helps reduce the intensity of erosion processes compared with permanently bare surfaces. Most of the slope interval thresholds were defined in accordance with the existing literature [21,58]. As slope decreases and vegetation cover increases (meadows, pastures, forests), φ values gradually decline, reflecting improved soil protection due to enhanced infiltration, reduced surface runoff, and soil stabilization by dense root systems. The lowest φ values are associated with dense forests on gentle slopes (<3°), where erosion is minimal due to a thick layer of organic matter that increases infiltration and reduces surface runoff.
Table 4.
Classification of erosion coefficient types and extent (φ).
The average terrain slope (√I) is expressed as a percentage in decimal form. High values of the I coefficient indicate very steep terrains where significant erosion of the surface soil layer occurs due to intensified runoff and reduced infiltration. The MEIC-Z categorization is shown in Table 5. According to the research objectives set in this paper, the intensity of erosion will be considered using the Z coefficient [58].
Table 5.
Classification of soil erosivity categories and erosion coefficient (Z).
In the first segment of the research, the territory of Serbia was differentiated into zones with varying degrees of soil erosion susceptibility. However, to achieve more detailed spatial differentiation and identify spatial patterns of soil erosion, a cluster analysis method was applied. The municipality was selected as the basic spatial unit. Of the 197 municipalities in Serbia, 181 were included in the cluster classification. In contrast, the urban municipalities of Belgrade (10) and Niš (5), as well as the City of Novi Sad, were excluded from the analysis.
The selected municipalities were characterized using a set of six indicators. The mean erosion coefficient (Zav) was chosen as the primary indicator of soil erosion. The second indicator was the coefficient of variation of the erosion process (CVz), which enabled the assessment of the variability of erosion intensity within each municipality. In this study, the coefficient of variation proved to be a highly significant statistical measure of landscape spatial homogeneity or heterogeneity. The influence of land use was quantified using the proportions of forest (F) and agricultural land (AgL). Morphometric characteristics of each municipality were defined by the mean slope angle (S) and the mean elevation (E).
Cluster analysis is a statistical method for obtaining optimal groupings based on the similarity or distance between sample characteristics [59]. Its primary objective is to achieve maximum similarity within clusters while ensuring high heterogeneity between clusters, as well as to identify hidden correlations within the data [60,61,62,63]. Cluster analysis has proven to be an appropriate method for differentiating soil erosion intensity across various spatial units in Serbia [52].
In this study, Agglomerative Hierarchical Clustering (AHC) was applied. The purpose of AHC is not the identification of new physical-geographical regions, but rather the grouping of municipalities based on similarities in geoecological conditions (topographic, soil-related, and anthropogenic characteristics of the area). In this way, it is examined to what extent municipalities within the same cluster exhibit similar geoecological conditions and, indirectly, a similar predisposition to soil erosion. This approach enables the identification of spatial patterns of soil erosion intensity.
The AHC algorithm begins by treating each data point as an individual cluster and progressively merging the most similar pairs into larger clusters. Clusters are merged based on the similarity of their centroids, determined by their proximity in the feature space. Thus, clusters with the highest similarity according to the selected linkage criterion are combined. Similarity between data points is quantified using distance measures, and in this study, the Euclidean distance was employed [62].
Different linkage criteria influence the shape and size of clusters, thereby significantly affecting the resulting dendrogram. In this research, Ward’s linkage method was used, which merges clusters by minimizing the increase in total within-cluster variance at each step. As a result, this method produces clusters that are approximately equal in size, highly compact, and characterized by a relatively uniform distribution of data within each cluster [64].
2.4. Soil Erosion Inventory and Validation Method
For validation purposes, an initial soil erosion inventory consisting of 102 erosion and 109 non-erosion samples was compiled through the integration of historical records, comparative analysis with recent conditions, and the interpretation of GIS-based datasets and satellite imagery [65] (Figure 3). Locations classified as erosion-prone correspond to clearly exposed (bare) surfaces occurring on steep slopes and underlain by highly erodible geological materials. In contrast, non-erosion locations represent stable environments, predominantly characterized by dense forest cover on gentle or flat terrain, developed over resistant geological substrates.
Figure 3.
Soil erosion inventory.
The inventory captures representative examples of both erosion-prone and stable conditions across the study area and serves as a reference dataset for the quantitative consistency assessment of the modernized Z-derived erosion coefficient. All procedures and approaches employed in this research are outlined in the flow chart provided in Figure 4.
Figure 4.
Flow chart with all the procedures and methods used in this research.
3. Results
3.1. National-Scale Spatial Mapping of Erosion Intensity
On the territory of Serbia, very weak erosion prevails (53.8%). It is found in mountainous and hilly areas covered with forest vegetation. In mountainous regions, under conditions of extensive agriculture with meadows and pastures and thin soil layers, slightly higher erosion occurs. In lowland areas such as the Pannonian and Moesian plains and the alluvial plains of major rivers, erosion is weak, occurring only in narrow zones around tributary streams where the banks descend toward the riverbed. Beyond these zones, erosion shifts to moderate or intensive.
Medium erosion is characteristic of hilly areas built of clastic sediments, where surfaces are predominantly covered with orchards. This intensity of erosion is also present in the zone of the Pannonian Plain due to the dune relief (Deliblato Sands) (Figure 5).
Figure 5.
Spatial distribution of the erosion coefficient (Z).
In the hilly zone, on slopes below 20°, under conditions of cultivated land (arable fields and orchards), intensive and excessive erosion is present. These areas are located on the edges of basins and in the immediate surroundings of larger urban centers. Altogether, they cover 8.3% of the territory, of which 7.6% falls into the intensive class and 0.7% into the excessive class (Table 6).
Table 6.
Distribution of erosion intensity coefficient (Z) in the Republic of Serbia.
3.2. Spatial Differentiation of Municipalities Based on Erosion Indicators
The results of the Agglomerative Hierarchical Clustering (AHC) indicate that municipalities in Serbia are grouped into four distinct clusters. The spatial distribution of these municipalities is presented in Figure 6, while the main characteristics of each cluster are summarized in Table 7.
Figure 6.
Spatial cluster differentiation of municipalities in Serbia.
Table 7.
Controlling variables used in the AHC.
The number of clusters was determined by a combination of multiple criteria. The Bayesian Information Criterion (BIC) indicated the optimal solution with 4 clusters. The clustering showed moderate separation of clusters, since the Silhouette Score was 0.40 [66]. However, in the context of geospatial data, such values are not unusual due to spatial heterogeneity and overlapping patterns. Most goodness-of-fit measures (including Silhouette) capture only attribute coherence, reflecting the internal consistency of clusters based on data characteristics without taking the spatial component into account. Therefore, in geospatial analyses, even a somewhat lower Silhouette score can be acceptable, as clusters also need to be spatially meaningful and internally connected units [67]. A good cluster definition was confirmed by the Calinski–Harabasz index (CH = 211) and a high proportion of between-cluster variance (78.2%) relative to within-cluster variance (21.8%). Such a relationship between between-cluster and within-cluster variance indicates the presence of statistically coherent groups of municipalities with similar environmental and erosion-related characteristics. Cluster stability is also supported by balanced cluster sizes. Based on all the mentioned criteria, further geospatial analysis with 4 clusters was selected as the most suitable solution. All the analyses were conducted using JASP version 0.96.0.0. The clustering of municipalities was further assessed using the Kruskal–Wallis test [68,69], which confirmed that the differences among the identified clusters are statistically significant for all analyzed indicators (p < 0.001).
Cluster I covers 19,311 km2, representing approximately one-fifth of Serbia’s territory. It forms the most homogeneous continuous area in northern Serbia and includes 39 municipalities (Figure 6). This spatial unit falls into the weak erosion category, with an average erosion coefficient Zav = 0.245 (Figure 7a). The erosion coefficient varies from Zav = 0.225 to Zav = 0.282. The lowest coefficient of variation (CVz = 41%) indicates minimal spatial variability of the erosion process (Figure 7b), reflecting the high uniformity of geographical conditions in this intensively used agricultural region. Despite a very high proportion of agricultural land (AgL = 83%) and a low share of forest cover (F = 7%), this cluster is not predisposed to higher erosion rates (Figure 7c,d). The key controlling factor is terrain morphometry, particularly low elevation (A < 100 m.a.s.l.) and very gentle slopes (S < 1°) (Figure 7e,f).
Figure 7.
Box plots of selected indicators across four clusters: (a) average erosion coefficient (Zav); (b) coefficient of variation (CVz); (c) presence of forest cover (%); (d) share of agricultural land (%); (e) altitude (m); (f) terrain slope (°).
Cluster II is the most numerous and spatially extensive cluster, comprising 53 municipalities located in the western, central, and eastern mountainous regions of Serbia (Figure 6), including parts of the Dinaric Mountains, the Šar Mountains, the Carpathian–Balkan Mountains and the Serbo–Macedonian Massif. It is most widely distributed in Eastern Serbia, within the West Morava and Kosovo and Metohija basins (Figure 6). This cluster covers 29,060 km2, corresponding to 33% of Serbia’s territory. It is characterized by a weak erosion category, with an average erosion coefficient, Zav of 0.237. The lowest erosion coefficient was recorded in Western Serbia (Zav = 0.191), while the highest was observed in Kosovo and Metohija (Zav = 0.345) (Figure 7a). The variability of the erosion process is somewhat higher than in the previous cluster (CVz = 74%). The highest homogeneity of the erosion coefficient was CVz = 51%, while the lowest was CVz = 84% (Figure 7b). A high proportion of forest cover (F = 58%) and a low share of agricultural land (AgL = 18%) are the main land use characteristics of this spatial unit (Figure 7c,d). Municipalities within this cluster exhibit the highest average elevation (A > 600 m.a.s.l.), The cluster is distinguished by the widest elevation range, indicating significant internal morphometric heterogeneity (Figure 7e). The mean slope angle is S = 10° (Figure 7f).
Cluster III covers 16,302 km2, accounting for 18.5% of Serbia’s total area, and includes 49 municipalities. The largest continuous area of this cluster is located south of the Sava and Danube rivers, as well as within the immediate basin of the Velika Morava. Smaller areas are found on the southern slopes of Fruška Gora. At the same time, the southernmost extent reaches the valleys of the Južna Morava and Nišava rivers, including the peri-urban zone of Niš and encompassing areas within Kosovo and Metohija (Figure 6). The average erosion coefficient is Zav = 0.303. The lowest erosion coefficient was Zav = 0.229, while the highest was Zav = 0.413 (Figure 7a). The average coefficient of variation is CVz = 75%. High values in certain municipalities (CVz > 80%) indicate not only internal heterogeneity of erosion processes but also diverse geographical conditions (Figure 7b). This specific combination of factors has resulted in a higher level of erosion susceptibility. Nearly half of the available land in this cluster is used for agriculture (AgL = 49%) (Figure 7d), while forest cover is considerably lower compared to previous clusters (F = 36%) (Figure 7c). Lower elevations (A = 245 m.a.s.l.) and gentle slopes (S < 5°) are the main characteristics of this predominantly agrarian landscape (Figure 7e,f).
Cluster IV predominantly comprises the peripheral and border areas of Serbia and includes 40 municipalities (Figure 6). This spatial unit encompasses the highest parts of the Dinaric Mountains in the west, the Šar Mountains in the south, the Serbo–Macedonian Massif in the southeast, and sections of the Carpathian–Balkan Mountains in the east. It covers approximately 25% of Serbia’s territory, i.e., 21,494 km2. This cluster is characterized by the lowest erosion intensity (Zav = 0.190). The erosion coefficient varies from Zav = 0.145 to Zav = 0.245 (Figure 7a). In terms of the uniformity of soil erosion intensity, this is one of the most homogeneous clusters (CVz = 58%) (Figure 7b). Within this predominantly mountainous region, with a mean elevation of A = 808 m.a.s.l., one-fifth of the municipalities have an average elevation exceeding 1000 m.a.s.l. (Figure 7e). All municipalities exhibit an average slope greater than 10°, with a cluster mean of S = 14.8° (Figure 7f). These morphometric characteristics have resulted in very limited agricultural land use. Agricultural land is nearly absent (AgL = 2.8%) (Figure 7d), whereas forests cover as much as 76.5% of the cluster area (Figure 7c).
3.3. Interpretation of the Modernized Erosion Intensity Coefficient (MEIC-Z) Through Clusters
Based on the final MEIC-Z values and the clustering performed at the municipal level, four representative municipalities were selected from each cluster for a comparative analysis of the MEIC-Z coefficient with that calculated using BSI as the φ coefficient.
The first example is the City of Kikinda, located in northeastern Serbia (45°49′37″ N, 20°27′58″ E), which belongs to the first cluster class. The city lies at an average elevation of 77.7 m, with an average terrain slope of 0.4°. In terms of land use, agricultural areas are dominant (88.8%), while meadows and pastures are less represented (5%), and forests occur only in traces (0.7%). The remaining area consists of urbanized surfaces (Figure 8).
Figure 8.
Comparative analysis of the Z coefficient with the BSI component (a) and the improved φ coefficient (b) in Kikinda.
The mean Z value, i.e., the MEIC-Z value, differs significantly between the two approaches. For the Z coefficient, where BSI was used as the φ coefficient, very high values are observed, with an average of 0.608. Such a scenario would classify the flat terrain of Kikinda as moderate erosion. In contrast, the Z coefficient calculated using the improved φ provides a more realistic representation of the erosion process in Kikinda, with an average Z value of 0.232.
From a geological perspective, 86.6% of the surface is composed of organogenic and clayey rocks that are susceptible to moderate to strong erosion. The remaining 13.4% of the area is covered by unconsolidated sediments (sand and gravel), which are the most susceptible to soil erosion. The dominant presence of arable land further increases erosion susceptibility, although terrain slope is the key factor in this case. Flat terrain is generally unfavorable for erosion because extremely low slopes do not allow the development of significant surface runoff and sediment transport under the influence of gravity.
The second example is the Municipality of Krupanj, located in central Serbia (44°21′56″ N, 19°21′43″ E), which belongs to the second cluster. The average elevation of the municipality is 439 m, while the mean terrain slope is significantly higher than in Kikinda, reaching 13.2°. In terms of land use, forests are dominant, covering 80.8% of the territory. Arable land occupies 8.7% of the area, while meadows and pastures are present on 8.3% of the territory. Settlements represent the remaining area.
In municipalities such as Krupanj, differences in Z values are not as pronounced as in lowland areas, though they remain noticeable. The mean erosion intensity value obtained using the BSI component is 0.116, whereas the mean erosion value calculated with the improved φ coefficient is 0.191 (Figure 9). In this case, the Z coefficient based on BSI yields lower values due to the significant forest cover and the relatively steep terrain.
Figure 9.
Comparative analysis of the Z coefficient with the BSI component (a) and the improved φ coefficient (b) in Krupanj.
From a geological perspective, Krupanj is predominantly covered by limestones with a clay component (37.1%), consolidated sediments represented by siltstones and conglomerates (27.2%), and pure limestones (13.4%), which are relatively resistant to soil erosion. Although Krupanj is characterized by steeper terrain slopes, the dominant forest cover and compact geological composition contribute to the municipality being predominantly affected by very weak erosion.
The third municipality is Smederevska Palanka, located in central Serbia (44°21′57″ N, 20°57′34″ E) and belonging to Cluster III. The average elevation is 159.2 m, while the mean terrain slope is 3.2°. In terms of land use, the territory is dominated by arable land, accounting for 70% of the area, while forests cover 21.5% and meadows 0.4%. The remaining area consists of urbanized surfaces. The mean Z value obtained using the BSI is 0.481, whereas the average Z value calculated with the improved φ coefficient is 0.396 (Figure 10). Both approaches classify Smederevska Palanka as one of the municipalities most threatened by erosion in Serbia.
Figure 10.
Comparative analysis of the Z coefficient with the BSI component (a) and the improved φ coefficient (b) in Smederevska Palanka.
Although the terrain slope is relatively low, soil erosion in this area is further exacerbated by the specific geological substrate. As much as 61.5% of the municipality is covered by unconsolidated sediments (sand and gravel), which are highly susceptible to soil erosion. The remaining territory consists of clastic formations, which are also characterized by low resistance to erosion. In this case, the Z values obtained using BSI are above the expected range due to the dominant presence of arable land.
The fourth analyzed municipality is Crna Trava, located in southeastern Serbia (42°48′32″ N, 22°17′57″ E) and belonging to Cluster IV. The average elevation is 1166 m, while the mean terrain slope reaches 16.8°. Crna Trava is the municipality with the highest forest cover in Serbia, with forests covering 95.6% of the territory. Meadows and pastures account for 4.3% of the municipality, while only 0.1% belongs to arable land and settlements. The mean erosion intensity value (Z) obtained using the BSI is 0.095, whereas the average erosion value calculated with the improved φ coefficient is 0.141. In this case, the EPM using BSI produces lower values due to the dominant forest cover and the absence of agricultural parcels (Figure 11).
Figure 11.
Comparative analysis of the Z coefficient with the BSI component (a) and the improved φ coefficient (b) in Crna Trava.
From a geological perspective, 60.6% of the territory is covered by metasediments and metavolcanites, which are moderately resistant to erosion processes. In addition, a significant proportion of the area consists of gneiss and mica schist (14.8%), as well as green rocks and green schists (13.1%), which are partially resistant to soil erosion.
The main differences between the classical Z coefficient and the MEIC-Z are:
- A more detailed and clearer evaluation of the Y coefficient, in accordance with contemporary literature;
- The application of open satellite data for large areas, with a spatial resolution of 30 m, for the evaluation of the X, I, and φ coefficients;
- A significant modification of the φ coefficient through the integrated representation of terrain slope and land use.
3.4. Validation Results
To assess the consistency of the Modernized Erosion Potential Model with the erosion inventory (Figure 12). The initial inventory consisted of 211 georeferenced locations, including 102 erosion and 109 non-erosion samples. After extracting valid MEIC-Z-derived values at the sample locations, 210 samples were retained for quantitative validation, comprising 101 erosion and 109 non-erosion samples. The validation was performed by assessing the ability of the model to discriminate between erosion-prone and stable environments. A binary classification was applied using a threshold value, which was determined through systematic evaluation and identified at Z = 0.11. This threshold was used only for the binary validation procedure and should not be interpreted as a general boundary between erosion intensity classes; it represents a data-driven separation point for the selected validation inventory.
Figure 12.
Distribution of MEIC-Z -derived values for stable/non-erosion and erosion validation samples. Individual points represent validation locations, while boxplots summarize the median, interquartile range, and dispersion of Z values within each class.
The distribution of the extracted Z values is shown in Figure 12. Stable/non-erosion samples were consistently associated with low Z values, whereas erosion samples showed substantially higher Z values. No overlap was observed between the two groups, indicating a clear separation between stable and erosion-prone validation locations. Using the selected threshold of Z = 0.11, all 210 retained validation samples were correctly classified. The resulting confusion matrix included 109 true negatives, 101 true positives, and no false-positive or false-negative cases. Consequently, accuracy, precision, recall, specificity, F1-score, and ROC-AUC were all equal to 1.000.
However, these results should be interpreted with caution. Because the validation inventory was designed to represent clearly defined erosion-prone and stable environmental conditions, the complete separation between the two sample groups primarily confirms strong consistency between the MEIC-Z-derived and the expert-defined validation inventory, rather than fully independent predictive generalization across all possible intermediate erosion conditions.
4. Discussion
4.1. Comparative Analysis with Soil Erosion Studies
The diversity of geographical conditions did not limit the application of the EPM beyond the territories where it was developed. Apart from the territory of the Balkans, numerous studies prove the possibility of applying this model in arid areas [70], tropical areas [71], and in the high mountain areas of the Alps [72] and the Himalayas [73].
Most of the knowledge about spatio-temporal variability, dynamics, and factors that influence the intensity of erosion processes in Serbia is based on the application of the Erosion Potential Method (EPM). In this context, EPM is the most widely used and longest-standing model for erosion assessment in Serbia [74]. In recent years, modern approaches have focused on improving the model’s input parameters, especially the coefficients X and φ [75]. The combination of vegetation indices, such as Normalized Difference Vegetation Index (NDVI) and Bare Soil Index (BSI), with geospatial databases, such as CORINE Land Cover, made it possible to overcome certain limitations of the traditional application of EPM and increase objectivity in determining model parameters [31,52,76]. Thanks to these improvements, the number of studies applying EPM at the regional and national level has been increasing in recent years.
The latest research in the Balkans indicates significant similarity in the spatial patterns of soil erosion. The findings of this study agree with those of Milevski et al. (2024), who, using the EPM in the territory of North Macedonia, determined the dominant representation of low- and moderate-erosion categories [25]. Similarly, the weak and very weak erosion categories dominate in Bosnia and Herzegovina [23]. At the same time, Stefanidis et al. (2025) showed that most mountain basins in Greece belong to the categories of weak and moderate erosion [24]. This coincidence of results indicates the existence of similar spatial patterns of erosion processes in the countries of the Balkan Peninsula, despite the differences in physical-geographical characteristics and the spatial scope of the research.
Also, it is consistently emphasized here that land use/land cover is the dominant factor in controlling erosion processes, with vegetation cover and land degradation standing out as key drivers of their spatial and temporal variability [26,51]. One of the most important findings is that the average value of Z can mask local erosion hotspots. Even watersheds with a low average erosion coefficient may contain foci that function as local “hot spots” of erosion. In this context, the planning of measures must not be based solely on average values but also on the identification of critical zones within spatial units [24,77]. Nevertheless, field observations and model validation remain important steps towards reducing uncertainty and precisely identifying erosion zones [32]. This significantly improves the reliability of the output results.
4.2. Improvement of the φ Coefficient
Gavrilović (1972) evaluated the factors influencing the value of the φ coefficient through the degree of surface and deep erosion within catchments [20]. Such an approach requires detailed field investigations of both surface and subsurface erosion processes. However, in practice, systematic and spatially continuous datasets are often unavailable, making extensive field mapping necessary, which is both time-consuming and financially demanding. Consequently, this method of determining the φ coefficient is difficult to apply for prediction and modeling at the national scale, where uniform, remotely accessible, and automated data sources are required.
Lazarević (1984) modified the φ coefficient to represent soil bareness in relation to terrain slope, primarily by considering visible traces of erosion on agricultural land [58]. This approach is also supported by authors investigating contemporary methodological frameworks for the EPM, such as Tošić and Dragićević (2024) [78]. However, in this case, slope classes are defined only for specific land use categories and are not fully consistent with modern remote sensing datasets.
In recent years (2024–2026), researchers have increasingly relied on the Bare Soil Index (BSI) to calculate the φ coefficient, which represents the degree of soil exposure, particularly in recent studies conducted in North Macedonia, Bosnia and Herzegovina, Greece, and Serbia [24,25,31,32,79,80].
Although the BSI is a good indicator of soil bareness intensity and can be used as an alternative for the φ coefficient, it has several important limitations:
- It does not account for terrain slope, which, along with land use, is a key factor in determining the φ coefficient;
- It requires a large cloud-free dataset derived from long-term observations within the same seasonal period;
- BSI values range from −1 to +1, and for the purpose of deriving the φ coefficient, negative values must be excluded, which reduces the precision for pixels that already have positive values.
For comparative analysis, the BSI was generated from Sentinel-2 satellite imagery for the period 2015–2025 under cloud-free conditions [81]. The images were averaged for September, as this period is ideal for BSI analysis due to the dominance of bare, dry soil following harvest, reduced vegetation cover, and stable atmospheric conditions, which together provide the clearest spectral contrast between soil and vegetation.
To use it as a φ coefficient, the BSI is often modified by adding a constant (e.g., 1 or a smaller value) to eliminate negative values. In our case, a value of 0.75 was added to each initial BSI pixel to avoid negative values and approximate the modified BSI as a φ coefficient.
Furthermore, to obtain more realistic values of the φ coefficient, an improved φ was developed, whose methodological framework is presented in the methodology section (Table 4).
The advantages of the modified φ coefficient are:
- Integration of land use with terrain slope, providing improved insight into the intensity of erosion processes;
- Use of open-access, high-resolution satellite data, enabling soil erosion modeling at national, regional, and global scales;
- Significant improvement in the φ coefficient results, which subsequently influence the final outputs of the EPM.
A comparative analysis between the initial BSI, modified BSI, and the improved φ coefficient is presented below.
The main limitation of the modified BSI when used as a proxy for the φ coefficient is most evident on flat arable land. Northern Serbia, characterized by relatively flat terrain and a dominant share of croplands, represents a typical and ideal case for comparative analysis. In the following (Figure 13), an example of different values over an almost completely flat arable surface (0.38°) is shown.
Figure 13.
Comparative analysis of the φ coefficient for flat arable land surfaces: (a) agriculture plot; (b) initial BSI; (c) modified BSI; (d) improved φ [50].
The initial BSI ranges from 0.05 to 0.10, which is lower than those reported in previous studies and commonly used practices for the φ coefficient [58]. The modified BSI shows values between 0.80 and 0.85, which are significantly higher than the actual conditions. In contrast, the improved φ coefficient yields a value of 0.20, indicating weak erosion processes. These are not intensive due to the flat terrain, but are still present as a result of the relatively bare surface layer. In the case of flat arable land, the improved φ coefficient shows results that are approximately four times more reliable than the modified BSI and about two times more accurate than the initial BSI.
The second example refers to the Special Nature Reserve Titelski breg. This is a loess plateau characterized by one of the highest numbers of fossil soil layers and loess horizons in Serbia. The margins of Titelski breg are clearly elevated relative to the surrounding terrain and are characterized by exposed soil and a steep slope of 22.2° (Figure 14).
Figure 14.
Comparative analysis of the φ coefficient for bare soil on steep slopes on Titelski breg (a–c): initial BSI (d); modified BSI (e); improved φ (f) [50,82,83].
The initial BSI produces very low values, ranging from −0.02 to 0.08, while the modified BSI for this area shows pixel values of 0.73 to 0.78. In contrast, the improved φ coefficient yields high values between 0.9 and 1.0 due to the combination of bare soil and steep terrain slope. In this area, erosion is intensive because steep slopes significantly increase surface runoff velocity. At the same time, the absence of vegetation and root systems facilitates particle detachment and the development of rills and gullies. Moreover, the improved φ coefficient is the only approach that clearly delineates the margins of Titelski breg, unlike the BSI, which tends to generalize and merge this area with the surrounding terrain.
The third example refers to dense forest areas on steep slopes. For the purposes of this comparative analysis, a dense forest was digitized in southern Serbia, within the municipality of Gora, on a slope of 21.3° (Figure 15).
Figure 15.
Comparative analysis of the φ coefficient within dense forest on steep slopes: dense forest (a); initial BSI (b); modified BSI (c); improved φ (d) [82].
The initial BSI pixels produced negative values (ranging from −0.17 to −0.20), while the modified BSI yielded values between 0.52 and 0.55, which are significantly higher than the actual erosion conditions. The improved φ coefficient provided values from 0.24 to 0.27, corresponding to weak erosion intensity. Within dense forests, even on steep slopes, erosion remains low because the canopy reduces rainfall impact, the thick humus layer enhances infiltration, and the well-developed root system stabilizes the soil and prevents its removal.
Considering all of the above, the improved φ coefficient provides much more realistic results across both lowland and mountainous terrains with different vegetation types, which ultimately has a significant impact on the final outputs of the EPM.
4.3. Spatial Differentiation of Soil Erosion Intensity According to Clustering Municipality
Although the overall erosion intensity classification indicates that erosion processes in Serbia are predominantly very weak and weak, areas affected by moderate and intensive erosion are also present. The spatial distribution of erosion intensity, differentiated through cluster analysis of dominant indicators at the municipal level, offers a new perspective on the spatial analysis of this fundamentally geomorphological process. The results obtained using the iEPM method and GIS-based modelling highlight the significant roles of terrain morphometric parameters and anthropogenic pressure in shaping the spatial distribution of erosion risk [84].
In this context, the influence of key controlling indicators was examined. In addition to forest and agricultural land, areas covered by meadows and pastures were included in the analysis as transitional forms between these two land use types. The quantitative relationships among the selected indicators were assessed using Pearson’s correlation coefficient within a correlation matrix (Table 8). The results indicate a high level of correlation among the indicators at a significance level of α < 0.0001.
Table 8.
Correlation matrix (Pearson’s r) of analyzed variables.
The results of the quantitative analysis of controlling factors of soil erosion indicate a strong relationship between elevation and a decrease in erosion intensity in Serbia. The erosion coefficient (Z) shows a high negative correlation with morphometric indicators, namely slope angle S (r = −0.805) and elevation E (r = −0.624), while these two variables are strongly positively correlated with each other (r = 0.860). For example, in some border municipalities in eastern Serbia, the correlation for the function Z = f(E) indicates an even stronger dependence of decreasing erosion intensity with increasing elevation (r = −0.98) [22].
The spatial variation of the erosion coefficient Z, differentiated according to relief conditions, shows that areas affected by higher erosion intensity increase from mountainous border municipalities (cluster IV) toward municipalities predominantly located in hilly zones characterized by weakly dissected and gently undulating terrain (cluster III).
Areas with preserved forest cover, particularly in mountainous regions (represented by clusters II and IV), exhibit significantly lower Z coefficient values compared to degraded pastures and open cropland. Forest cover shows a strong negative correlation with the erosion coefficient (Z = f(F), r = −0.767). Forested areas are predominantly located on steeper slopes (r = 0.919) and at higher elevations (r = 0.684). These strong positive relationships between forests and morphometric indicators explain their anti-erosion effect in parts of Serbia that are naturally predisposed to higher erosion categories (greater relief dissection and steeper slopes), yet still record low erosion rates. Slopes exceeding 20° are characteristic of mountainous areas (cluster IV), which are lithologically composed of hard and compact rocks. Due to subaerial processes, a weathering crust develops on the surface, which is susceptible to intensive washing. However, erosion potential does not increase linearly with slope. On slopes steeper than 40°, the weathering crust is largely removed, resulting in a significantly reduced erosion potential.
Grasslands and pastures are also negatively correlated with the erosion coefficient Z (r = −0.435). These land use types are predominantly located at higher elevations, as indicated by the positive correlation in the function Gr = f(E) (r = 0.741), and often co-occur with forest cover (r = 0.395). Higher elevation and a greater proportion of forest cover contribute to a reduction in erosion intensity. However, demographic characteristics of border municipalities have also influenced the relatively low erosion rates. Serbia is characterized by highly differentiated rural areas with pronounced processes of regional demographic differentiation [85,86]. A large number of settlements with weak demographic potential indicates a decline in agricultural activity. Under the influence of various socio-economic factors (industrialization, agrarian reform, and rural–urban migration) during the second half of the 20th century, sparsely populated and underdeveloped rural settlements in mountainous peripheral and border regions experienced strong processes of depopulation and deagrarization [87,88]. The abandonment of agricultural land has consequently contributed to a reduction in erosion intensity in these municipalities.
On the other hand, agricultural land (AgL) has the strongest influence on erosion intensity (Z = f(AgL), r = 0.826). Agricultural areas are primarily located at lower elevations (r = −0.728) and on terrains with lower slope angles (r = −0.882). This indicates that the most intensively cultivated parts of municipalities in Serbia are also the most susceptible to erosion processes. The spatial differentiation of municipalities at risk of erosion, determined through cluster analysis, reveals a general gradient: peripheral border municipalities (cluster IV), municipalities in the transitional zone between hilly and mountainous terrain (cluster II), municipalities predominantly located in hilly and partly lowland areas (cluster III), as well as the lowland zone of the Pannonian Plain (cluster I). Areas in Cluster I have the highest demographic and agricultural potential and are characterized by intensive agricultural production, which leads to stronger anthropogenic pressure on land resources and intensification of erosion processes (Table 9) [52,77].
Table 9.
Geographical characteristics of clusters.
The MEIC-Z with the modified φ coefficient may support broader application in regions where comparable geospatial datasets and environmental conditions are available.
The external validity of the proposed MEIC-Z approach should be interpreted with caution. The model is most directly transferable to regions with comparable geomorphological, lithological, land-cover, and climatic conditions, as well as with access to similar high-resolution GIS and satellite datasets. Although the use of open geospatial data improves its applicability beyond Serbia, additional testing with independent field observations, sediment-yield measurements, or catchment-scale validation would be required before broader generalization to other environmental settings.
Although the proposed approach provides a comprehensive national-scale assessment of soil erosion susceptibility, future studies could further enhance the framework by incorporating sensitivity analyses and evaluating the influence of selected input parameters [89,90,91,92,93,94,95,96,97,98,99,100,101].
5. Conclusions
In this study, geospatial data (lithology, land use, terrain slope, and erosion coefficient) with a 30 m spatial resolution were analyzed to produce a high-resolution national-scale map of soil erosion intensity. Using the MEIC-Z, the results indicate that the mean erosion coefficient (Zav) for Serbia is 0.239. The findings clearly demonstrate that areas most affected by intensive erosion are agricultural lands located on steeper slopes (>20°) and under specific geological conditions (sand, gravel, organogenic, and clay-rich sediments). Overall, 7.6% of the territory is exposed to intensive erosion, while 0.7% of the study area is affected by excessive erosion.
To enable a more detailed understanding of erosion processes at the local level, spatial differentiation was performed through cluster analysis of the final dataset at the municipal scale. Four clusters were identified based on six indicators: mean erosion coefficient, coefficient of variation of the erosion process, the influence of forest cover, agricultural land, and morphometric characteristics (elevation and slope). The results clearly indicate that morphometric conditions and land use play a key role in controlling erosion dynamics in Serbia. The highest susceptibility to erosion was identified in agriculturally dominated areas with moderate slopes (Cluster III), where the combination of steeper terrain and intensive land use significantly enhances erosion processes. In contrast, the lowland regions of northern Serbia (Cluster I), although predominantly agricultural, exhibit low erosion potential due to minimal terrain slope. Forest-covered areas proved highly effective at mitigating soil erosion.
Future research in Serbia should focus on integrating existing erosion data with high-resolution climatic datasets to improve current results and support the development of a national sediment yield map as a key component of the MEIC-Z. More efficient land management could be achieved through detailed analyses at finer spatial scales. In this context, the application of the MEIC-Z at the level of rural settlements or torrential catchments is recommended. Such an approach would enable the identification of areas with the highest erosion risk and allow for field-based validation of the empirical model and remote sensing methods. Due to its comprehensive spatial coverage, the results of this study are highly relevant for decision-makers at both local and national levels. In addition to local authorities and governmental institutions, these findings may also support various environmental sectors, including emergency management services, forestry, water management, spatial planning, and nature conservation. An effective approach to land management must be multidisciplinary, taking into account natural conditions alongside contemporary demographic and socio-economic processes.
Author Contributions
Conceptualization, U.D. and T.S.; methodology, S.M.; software, U.D. and M.V.M.; validation, S.M., V.I., T.S. and J.S.; formal analysis, U.D.; investigation, N.B. and M.D.; resources, N.B. and V.I.; data curation, U.D.; writing—original draft preparation, T.S., S.M. and U.D.; writing—review and editing, M.V.M.; visualization, N.B.; supervision, S.M.; project administration, U.D.; funding acquisition, U.D. All authors have read and agreed to the published version of the manuscript.
Funding
This research was funded by the Ministry of Science, Technological Development and Innovation of the Republic of Serbia (Contract numbers 451-03-33/2026-03/200172 and 451-03-33/2026-03/200091).
Data Availability Statement
The data supporting the conclusions of this article will be made available by the authors on request.
Conflicts of Interest
The authors declare no conflicts of interest.
References
- Panagos, P.; Ballabio, C.; Poesen, J.; Lugato, E.; Scarpa, S.; Montanarella, L.; Borrelli, P. A Soil Erosion Indicator for Supporting Agricultural, Environmental and Climate Policies in the European Union. Remote Sens. 2020, 12, 1365. [Google Scholar] [CrossRef] [Scilit]
- Alewell, C.; Borrelli, P.; Meusburger, K.; Panagos, P. Using the USLE: Chances, Challenges and Limitations of Soil Erosion Modelling. Int. Soil Water Conserv. Res. 2019, 7, 203–225. [Google Scholar] [CrossRef] [Scilit]
- Borrelli, P.; Robinson, D.A.; Fleischer, L.R.; Lugato, E.; Ballabio, C.; Alewell, C.; Meusburger, K.; Modugno, S.; Schütt, B.; Ferro, V.; et al. An assessment of the global impact of 21st century land use change on soil erosion. Nat. Commun. 2017, 8, 2013. [Google Scholar] [CrossRef] [Scilit]
- Panagos, P.; Borrelli, P.; Matthews, F.; Liakos, L.; Bezak, N.; Diodato, N.; Ballabio, C. Global Rainfall Erosivity Projections for 2050 and 2070. J. Hydrol. 2022, 610, 127865. [Google Scholar] [CrossRef] [Scilit]
- Kinnell, P.I.A. A review of the science and logic associated with replacing RUSLE2 by WEPP as an aid to making land management decisions to conserve soil in the USA. Catena 2025, 252, 108888. [Google Scholar] [CrossRef] [Scilit]
- Williams, J.R.; Berndt, H.D. Sediment yield prediction based on watershed hydrology. Trans. ASAE 1977, 20, 1100–1104. [Google Scholar] [CrossRef] [Scilit]
- Wischmeier, W.H.; Smith, D.D. Predicting Rainfall Erosion Losses: A Guide to Conservation Planning; U.S. Department of Agriculture: Washington, DC, USA, 1978.
- Merritt, W.S.; Letcher, R.A.; Jakeman, A.J. A review of erosion and sediment transport models. Environ. Model. Softw. 2003, 18, 761–799. [Google Scholar] [CrossRef] [Scilit]
- Dabney, S.M.; Yoder, D.C. History and future of the Water Erosion Prediction Project (WEPP) model. In Proceedings of the International Soil Conservation Organization Conference; CIRAD: Paris, France, 2012. [Google Scholar]
- Karydas, C.G.; Panagos, P.; Gitas, I.Z. A classification of water erosion models according to their geospatial characteristics. Int. J. Digit. Earth 2014, 7, 229–250. [Google Scholar] [CrossRef] [Scilit]
- Benavidez, R.; Jackson, B.; Maxwell, D.; Norton, K. A review of the (revised) Universal Soil Loss Equation ((R)USLE): With a view to increasing its global applicability and improving soil loss estimates. Hydrol. Earth Syst. Sci. 2018, 22, 6059–6086. [Google Scholar] [CrossRef] [Scilit]
- Shojaeezadeh, S.A.; Al-Wardy, M.; Nikoo, M.R.; Mooselu, M.G.; Alizadeh, M.R.; Adamowski, J.F.; Moradkhani, H.; Alamdari, N.; Gandomi, A.H. Soil erosion in the United States: Present and future (2020–2050). Catena 2024, 242, 108074. [Google Scholar] [CrossRef] [Scilit]
- Liu, B.Y.; Nearing, M.A.; Risse, L.M.; Zhang, X.C. Slope length effects on soil loss for steep slopes. Soil Sci. Soc. Am. J. 2002, 66, 1030–1036. [Google Scholar] [CrossRef] [Scilit]
- Yan, J.; Wang, S.; Feng, J.; He, H.; Wang, L.; Sun, Z.; Zheng, C. New 30-m resolution dataset reveals declining soil erosion with regional increases across Chinese mainland (1990–2022). Remote Sens. Environ. 2025, 323, 114681. [Google Scholar] [CrossRef] [Scilit]
- Majhi, A.; Shaw, R.; Mallick, K.; Patel, P.P. Towards improved USLE-based soil erosion modelling in India: A review of prevalent pitfalls and implementation of exemplar methods. Environ. Sci. Pollut. Res. 2021, 28, 40574–40596. [Google Scholar] [CrossRef] [Scilit]
- Raj, R.; Saharia, M.; Chakma, S. Geospatial modeling and mapping of soil erosion in India. Catena 2024, 239, 107836. [Google Scholar] [CrossRef] [Scilit]
- Panagos, P.; Borrelli, P.; Poesen, J.; Ballabio, C.; Lugato, E.; Meusburger, K.; Montanarella, L.; Alewell, C. The New Assessment of Soil Loss by Water Erosion in Europe. Environ. Sci. Policy 2015, 54, 438–447. [Google Scholar] [CrossRef] [Scilit]
- Zhang, X.; Song, J.; Wang, Y.; Deng, W.; Liu, Y. Effects of land use on slope runoff and soil loss in the Loess Plateau of China: A meta-analysis. Sci. Total Environ. 2021, 829, 154604. [Google Scholar] [CrossRef] [Scilit]
- Liao, J.; Wang, J.; Jiao, J.; Yan, Z.; Li, J.; Zhang, Z.; Li, M.; Xu, Q.; Jiang, X.; Zhao, W.; et al. RUSLE tends to overestimate soil erosion in revegetated conditions: Evidence from long-term runoff plots monitoring on China’s Loess Plateau. Catena 2025, 252, 108888. [Google Scholar] [CrossRef] [Scilit]
- Gavrilović, S. Inženjering o bujičnim tokovima i eroziji [Engineering of torrents and erosion]. J. Constr. 1972, 104–112. (In Serbian) [Google Scholar]
- Lazarević, R. Soil Erosion Map of SR Serbia 1:500,000-Interpretation; Institute for Forestry and Wood Industry: Belgrade, Serbia, 1983. (In Serbian) [Google Scholar]
- Manojlović, S.; Antić, M.; Šantić, D.; Sibinović, M.; Carević, I.; Srejić, T. Anthropogenic Impact on Erosion Intensity: Case Study of Rural Areas of Pirot and Dimitrovgrad Municipalities, Serbia. Sustainability 2018, 10, 826. [Google Scholar] [CrossRef] [Scilit]
- Tošić, R.; Dragićević, S.; Lovrić, N.; Langović, M. Mapping Soil Erosion Intensity Using Erosion Potential Method (EPM): Case Study—Bosnia and Herzegovina. Carpathian J. Earth Environ. Sci. 2025, 58, 413–426. [Google Scholar] [CrossRef] [Scilit]
- Stefanidis, S.P.; Proutsos, N.D.; Tigkas, D.; Chatzichristaki, C. Erosion-Based Classification of Mountainous Watersheds in Greece: A Geospatial Approach. Sustainability 2025, 17, 8710. [Google Scholar] [CrossRef] [Scilit]
- Milevski, I.; Aleksova, B.; Lukić, T.; Dragićević, S.; Valjarević, A. Multi-Hazard Modeling of Erosion and Landslide Susceptibility at the National Scale in the Example of North Macedonia. Open Geosci. 2024, 16, 20220718. [Google Scholar] [CrossRef] [Scilit]
- Bezak, N.; Borrelli, P.; Mikoš, M.; Jemec Auflič, M.; Panagos, P. Towards Multi-Model Soil Erosion Modelling: An Evaluation of the Erosion Potential Method (EPM) for Global Soil Erosion Assessments. Catena 2024, 234, 107596. [Google Scholar] [CrossRef] [Scilit]
- De Vente, J.; Poesen, J. Predicting Soil Erosion and Sediment Yield at the Basin Scale: Scale Issues and Semi-Quantitative Models. Earth-Sci. Rev. 2005, 71, 95–125. [Google Scholar] [CrossRef] [Scilit]
- Efthimiou, N.; Lykoudi, E.; Panagoulia, D.; Karavitis, C. Assessment of Soil Susceptibility to Erosion Using the EPM and RUSLE Models: The Case of Venetikos River Catchment. Glob. Netw. Environ. Sci. Technol. J. 2016, 18, 164–179. [Google Scholar] [CrossRef] [Scilit]
- Raza, A.; Ahrends, H.; Habib-Ur-Rahman, M.; Gaiser, T. Modeling Approaches to Assess Soil Erosion by Water at the Field Scale with Special Emphasis on Heterogeneity of Soils and Crops. Land 2021, 10, 422. [Google Scholar] [CrossRef] [Scilit]
- Aleksova, B.; Lukić, T.; Milevski, I.; Spalević, V.; Marković, S.B. Modelling Water Erosion and Mass Movements (Wet) by Using GIS-Based Multi-Hazard Susceptibility Assessment Approaches: A Case Study—Kratovska Reka Catchment (North Macedonia). Atmosphere 2023, 14, 1139. [Google Scholar] [CrossRef] [Scilit]
- Durlević, U.; Srejić, T.; Valjarević, A.; Aleksova, B.; Deđanski, V.; Vujović, F.; Lukić, T. GIS-Based Spatial Modeling of Soil Erosion and Wildfire Susceptibility Using VIIRS and Sentinel-2 Data: A Case Study of Šar Mountains National Park, Serbia. Forests 2025, 16, 484. [Google Scholar] [CrossRef] [Scilit]
- Polovina, S.; Radić, B.; Milčanović, V.; Ristić, R.; Malušević, I.; Hadžialić, A.; Imširović, Š. Regional Soil Erosion Assessment Using Remote Sensing and Field Validation: Enhancing the Erosion Potential Model. Remote Sens. 2026, 18, 1227. [Google Scholar] [CrossRef] [Scilit]
- Ćalić, J.; Milošević, M.V.; Milivojević, M.; Gaudenji, T. Relief of Serbia. In Relief of Serbia; Radovanović, M., Ed.; Geographical Institute “Jovan Cvijić” SASA: Belgrade, Serbia, 2017; pp. 23–92. (In Serbian) [Google Scholar]
- Oro, V.; Stanisavljevic, R.; Nikolic, B.; Tabakovic, M.; Secanski, M.; Tosi, S. Diversity of Mycobiota Associated with the Cereal Cyst Nematode Heterodera filipjevi Originating from Some Localities of the Pannonian Plain in Serbia. Biology 2021, 10, 283. [Google Scholar] [CrossRef] [Scilit]
- Durlević, U.; Valjarević, A.; Novković, I.; Vujović, F.; Josifov, N.; Krušić, J.; Komac, B.; Djekić, T.; Singh, S.K.; Jović, G.; et al. Universal Snow Avalanche Modeling Index Based on SAFI–Flow-R Approach in Poorly-Gauged Regions. ISPRS Int. J. Geo-Inf. 2024, 13, 315. [Google Scholar] [CrossRef] [Scilit]
- Stanišić, M.; Lovrić, M.; Nedeljković, J.; Nonić, D.; Pezdevšek Malovrh, Š. Climate Change Governance in Forestry and Nature Conservation in Selected Forest Regions in Serbia: Stakeholders Classification and Collaboration. Forests 2021, 12, 709. [Google Scholar] [CrossRef] [Scilit]
- Pantić, M.; Maričić, T.; Milijić, S. Visualising the Relevance of Climate Change for Spatial Planning by the Example of Serbia. Appl. Sci. 2024, 14, 1530. [Google Scholar] [CrossRef] [Scilit]
- Milovanović, B.; Ducić, V.; Radovanović, M.; Milivojević, M. Climate regionalization of Serbia according to the Köppen climate classification. J. Geogr. Inst. “Jovan Cvijić” SASA 2017, 67, 103–114. [Google Scholar] [CrossRef] [Scilit]
- Milovanović, B.; Schuster, P.; Radovanović, M.; Ristić Vakanjac, V.; Schneider, C.; Milivojević, M. Spatial–temporal variability of air temperatures in Serbia in the period 1961–2010. J. Geogr. Inst. “Jovan Cvijić” SASA 2018, 68, 157–175. [Google Scholar] [CrossRef] [Scilit]
- Urošev, M.; Kovačević-Majkić, Š.; Štrbac, D.; Milanović Pešić, A.; Milijašević, D.; Jakovljević, D.; Petrović, A. Waters of Serbia. In Relief of Serbia; Radovanović, M., Ed.; Geographical Institute “Jovan Cvijić” SASA: Belgrade, Serbia, 2017; pp. 161–234. (In Serbian) [Google Scholar]
- Tošić, I.; da Silva, A.S.A.; Filipović, L.; Tošić, M.; Lazić, I.; Putniković, S.; Stosic, T.; Stosic, B.; Djurdjević, V. Trends of Extreme Precipitation Events in Serbia Under the Global Warming. Atmosphere 2025, 16, 436. [Google Scholar] [CrossRef] [Scilit]
- Maruna, M.; Crnčević, T.; Milojević, M.P. The Institutional Structure of Land Use Planning for Urban Forest Protection in the Post-Socialist Transition Environment: Serbian Experiences. Forests 2019, 10, 560. [Google Scholar] [CrossRef] [Scilit]
- Kovačević, J.; Cvijetinović, Ž.; Lakušić, D.; Kuzmanović, N.; Šinžar-Sekulić, J.; Mitrović, M.; Stančić, N.; Brodić, N.; Mihajlović, D. Spatio-Temporal Classification Framework for Mapping Woody Vegetation from Multi-Temporal Sentinel-2 Imagery. Remote Sens. 2020, 12, 2845. [Google Scholar] [CrossRef] [Scilit]
- GeoSrbija. Geoportal of Serbia—Cartographic Data Viewer. 2026. Available online: https://a3.geosrbija.rs (accessed on 9 March 2026).
- European Space Agency. Copernicus Global Digital Elevation Model. Distributed by OpenTopography. 2024. Available online: https://portal.opentopography.org/datasetMetadata?otCollectionID=OT.032021.4326.1 (accessed on 2 March 2026). [CrossRef]
- OpenStreetMap Team. OpenStreetMap Export. 2026. Available online: https://www.openstreetmap.org/#map=7/44.226/15.562 (accessed on 13 February 2026).
- Environmental Systems Research Institute (ESRI). Sentinel-2 10 m Land Use/Land Cover Time Series (2024). Esri Living Atlas. 2024. Available online: https://livingatlas.arcgis.com/landcoverexplorer/ (accessed on 9 March 2026).
- Copernicus Land Monitoring Service. High Resolution Layer: Tree Cover and Forests. 2023. Available online: https://land.copernicus.eu/en/products/high-resolution-layer-forests-and-tree-cover (accessed on 7 March 2026).
- Ministry of Mining and Energy of the Republic of Serbia. GeoLISS: Geological Information System of Serbia—Geological Map Viewer; 2026. Available online: https://geoliss.mre.gov.rs/vebkarte/geo300.html (accessed on 8 March 2026).
- QGIS Development Team. QGIS Geographic Information System v3.40.09 with GRASS. Open Source Geospatial Foundation Project. 2026. Available online: https://qgis.org/download/ (accessed on 30 June 2025).
- Trendafilov, B.; Minchev, I.; Trendafilov, A.; Blinkov, I. Comparison of EPM with RUSLE for Soil Erosion Modeling in the Strumica River Basin. Geogr. Environ. Sustain. 2024, 17, 44–49. [Google Scholar] [CrossRef] [Scilit]
- Srejić, T.; Manojlović, S.; Sibinović, M.; Lukić, T.; Kričković, E.; Durlević, U. Impact of the Agri-Geographical Transformation of Rural Settlements on the Geospatial Dynamics of Soil Erosion Intensity in Municipalities of Central Serbia. Open Geosci. 2025, 17, 20250857. [Google Scholar] [CrossRef] [Scilit]
- Dildabek, D.; Aliaskarov, D.; Kaimuldinova, K.; Bakanov, N.; Yegizbayeva, A.; Shuangjie, Z. Projected Land Use Land Cover Dynamics and Tourism Suitability Assessment in the Selected Kazakhstan Area. J. Geogr. Inst. “Jovan Cvijić” SASA 2025, 75, 461–469. [Google Scholar] [CrossRef] [Scilit]
- Smanov, Z.; Duisenbayev, S.; Zulpykharov, K.; Laiskhanov, S.; Turymtayev, Z.; Kozhayev, Z.; Taukebayev, O. Soil Salinization and Its Impact on the Degradation of Agricultural Landscapes of the Talas District, Kazakhstan. J. Geogr. Inst. “Jovan Cvijić” SASA 2025, 75, 233–250. [Google Scholar] [CrossRef] [Scilit]
- Akhmetova, D. Anthropogenic Impact on Soil and Vegetation in Turkistan Region: Chemical Composition and Heavy Metal Contamination. J. Geogr. Inst. “Jovan Cvijić” SASA 2025, 75, 1–15. [Google Scholar] [CrossRef] [Scilit]
- Dominici, R.; Larosa, S.; Viscomi, A.; Mao, L.; De Rosa, R.; Cianflone, G. Yield Erosion Sediment (YES): A PyQGIS Plug-In for the Sediments Production Calculation Based on the Erosion Potential Method. Geosciences 2020, 10, 324. [Google Scholar] [CrossRef] [Scilit]
- Polovina, S.; Radić, B.; Ristić, R.; Milčanović, V. Application of Remote Sensing for Identifying Soil Erosion Processes on a Regional Scale: An Innovative Approach to Enhance the Erosion Potential Model. Remote Sens. 2024, 16, 2390. [Google Scholar] [CrossRef] [Scilit]
- Lazarević, R. A New Method for Determining the Erosion Coefficient (Z). Erozija–Stručno-Inf. Bilt. 1985, 13, 53–61. (In Serbian) [Google Scholar]
- Xu, D.; Tian, Y. A Comprehensive Survey of Clustering Algorithms. Ann. Data Sci. 2015, 2, 165–193. [Google Scholar] [CrossRef] [Scilit]
- Andrade, E.M.; Palácio, H.A.Q.; Souza, I.H.; Leão, R.A.O.; Guerreiro, M.J. Land Use Effects in Groundwater Composition of an Alluvial Aquifer (Trussu River, Brazil) by Multivariate Techniques. Environ. Res. 2008, 106, 170–177. [Google Scholar] [CrossRef] [Scilit]
- Chen, J.; Li, F.; Fan, Z.; Wang, Y. Integrated Application of Multivariate Statistical Methods to Source Apportionment of Watercourses in the Liao River Basin, Northeast China. Int. J. Environ. Res. Public Health 2016, 13, 1035. [Google Scholar] [CrossRef] [Scilit]
- Raux, J.; Copard, Y.; Laignel, B.; Fournier, M.; Massei, N. Classification of Worldwide Drainage Basins through the Multivariate Analysis of Variables Controlling Their Hydrosedimentary Response. Glob. Planet. Change 2011, 76, 117–127. [Google Scholar] [CrossRef] [Scilit]
- Yang, A.; Zhang, L.; Zhang, S.; Zhan, Z.; Shi, J. Research on the temporal and spatial characteristics, spatial clustering and governance strategies of carbon emissions in cities of Shandong. Front. Environ. Sci. 2022, 10, 1024122. [Google Scholar] [CrossRef] [Scilit]
- Wani, A.A. Comprehensive Analysis of Clustering Algorithms: Exploring Limitations and Innovative Solutions. PeerJ Comput. Sci. 2024, 10, e2286. [Google Scholar] [CrossRef] [Scilit]
- Durlević, U.; Ilić, V.; Valjarević, A. Wildfire Susceptibility Mapping Using Deep Learning and Machine Learning Models Based on Multi-Sensor Satellite Data Fusion: A Case Study of Serbia. Fire 2025, 8, 407. [Google Scholar] [CrossRef] [Scilit]
- Pedersen, K.; Jensen, R.R.; Hall, L.K.; Cutler, M.C.; Transtrum, M.K.; Gee, K.L.; Lympany, S.V. K-Means Clustering of 51 Geospatial Layers Identified for Use in Continental-Scale Modeling of Outdoor Acoustic Environments. Appl. Sci. 2023, 13, 8123. [Google Scholar] [CrossRef] [Scilit]
- Wolf, L.J.; Knaap, E.; Rey, S. Geosilhouettes: Geographical Measures of Cluster Fit. Environ. Plan. B Urban Anal. City Sci. 2021, 48, 521–539. [Google Scholar] [CrossRef] [Scilit]
- Pinto, C.C.; Calazans, G.M.; Oliveira, S.C. Assessment of spatial variations in the surface water quality of the Velhas River Basin, Brazil, using multivariate statistical analysis and nonparametric statistics. Environ. Monit. Assess. 2019, 191, 164. [Google Scholar] [CrossRef] [Scilit]
- Tölgyesi, C.; Bátori, Z.; Erdős, L. Using statistical tests on relative ecological indicator values to compare vegetation units—Different approaches and weighting methods. Ecol. Indic. 2014, 36, 441–446. [Google Scholar] [CrossRef] [Scilit]
- Ouallali, A.; Aassoumi, H.; Moukhchane, M.; Moumou, A.; Houssni, M.; Spalevic, V.; Keesstra, S. Sediment mobilization study on Cretaceous, Tertiary and Quaternary lithological formations of an external Rif catchment, Morocco. Hydrol. Sci. J. 2020, 65, 1568–1582. [Google Scholar] [CrossRef] [Scilit]
- Tavares, A.S.; Spalevic, V.; Avanzi, J.C.; Alves, D. Modeling of water erosion by the erosion potential method in a pilot subbasin in southern Minas Gerais. Semin. Ciênc. Agrár. 2019, 40, 555–572. [Google Scholar] [CrossRef] [Scilit]
- Milanesi, L.; Pilotti, M.; Clerici, A.; Gavrilović, Z. Application of an improved version of the erosion potential method in alpine areas. Ital. J. Eng. Geol. Environ. 2015, 1, 17–30. [Google Scholar] [CrossRef]
- Chalise, D.; Kumar, L.; Spalevic, V.; Skataric, G. Estimation of sediment yield and maximum outflow using the IntErO model in the Sarada River Basin of Nepal. Water 2019, 11, 952. [Google Scholar] [CrossRef] [Scilit]
- Malušević, I.; Ristić, R.; Radić, B.; Polovina, S.; Milčanović, V.; Nešković, P. A Historical Overview of Methods for the Estimation of Erosion Processes on the Territory of the Republic of Serbia. Land 2025, 14, 405. [Google Scholar] [CrossRef] [Scilit]
- Dragičević, N.; Karleuša, B.; Ožanić, N. Modification of erosion potential method using climate and land cover parameters. Geomat. Nat. Hazards Risk 2018, 9, 1085–1105. [Google Scholar] [CrossRef] [Scilit]
- Moujane, S.; Algouti, A.; Algouti, A.; Aboulfaraj, A.; Agli, S.; Farah, A.; Aadaj, J.; Ghachoui, H. Mapping of water erosion risk by the erosion potential method (EPM) using Sentinel-2A data: The case of Dades Basin, Central High Atlas, Morocco. J. Eng. Appl. Sci. 2025, 72, 246. [Google Scholar] [CrossRef] [Scilit]
- Srejić, T.; Manojlović, S.; Kričković, E.; Kovjanić, A. Influence of dominant geographical factors on the geospatial differentiation of soil erosion intensity in the Velika Morava Basin. Bull. Serb. Geogr. Soc. 2025, 105, 659–686. [Google Scholar] [CrossRef] [Scilit]
- Tošić, R.; Dragićević, S. Chronological Development of the Erosion Potential Method; Serbian Geographical Society: Belgrade, Serbia, 2024. [Google Scholar]
- Petrović, A.M.; Manojlović, S.; Srejić, T.; Zlatanović, N. Insights into Land-Use and Demographical Changes: Runoff and Erosion Modifications in the Highlands of Serbia. Land 2024, 13, 1342. [Google Scholar] [CrossRef] [Scilit]
- Petrović, A.M.; Guerit, L.; Nikolova, V.; Novković, I.; Filipov, D.; Jakubínský, J. Quantifying Torrential Watershed Behavior over Time: A Synergistic Approach Using Classical and Modern Techniques. Earth 2026, 7, 1. [Google Scholar] [CrossRef] [Scilit]
- Copernicus Programme. Copernicus Browser. Available online: https://browser.dataspace.copernicus.eu/ (accessed on 6 May 2026).
- Film in Serbia. Titelski Breg and Veliki Surduk. Available online: https://filminserbia.com/location/titelski-breg-i-veliki-surduk/?lang=sr (accessed on 6 May 2026).
- Vojvodina Uživo. Unreal Places: Titel Hill (Video). Available online: https://vojvodinauzivo.rs/nestvarna-mesta-titelski-breg-video/ (accessed on 6 May 2026).
- Đorđević, M.; Đokić, M.; Manić, M.; Vesković, J.; Dragović, R.; Smičiklas, I.; Dragović, S.; Onjia, A. Advanced GIS-Based RUSLE Modeling for Soil Erosion Estimation in the Toplica River Basin, Serbia. Geosciences 2026, 16, 83. [Google Scholar] [CrossRef] [Scilit]
- Gajić Protić, A.; Krunić, N.; Protić, B. Detecting Serbia’s Settlement Patterns: A Fuzzy Logic-Based Approach to Rural–Urban Area Delimitation for Spatial Planning. Land 2024, 13, 1981. [Google Scholar] [CrossRef] [Scilit]
- Gajić, A.; Krunić, N.; Protić, B. Classification of Rural Areas in Serbia: Framework and Implications for Spatial Planning. Sustainability 2021, 13, 1596. [Google Scholar] [CrossRef] [Scilit]
- Grčić, M.; Sibinović, M.; Ratkaj, I. The entropy as a parameter of demographic dynamics: Case study of the population of Serbia. Acta Geogr. Slov. 2024, 64, 23–39. [Google Scholar] [CrossRef] [Scilit]
- Martinović, M.; Ratkaj, I. Sustainable Rural Development in Serbia: Towards a Quantitative Typology of Rural Areas. Carpathian J. Earth Environ. Sci. 2015, 10, 37–48. [Google Scholar]
- Deđanski, V.; Durlević, U.; Kovjanić, A.; Lukić, T. GIS-based spatial modeling of landslide susceptibility using BWM-LSI: A case study—City of Smederevo (Serbia). Open Geosci. 2024, 16, 20220688. [Google Scholar] [CrossRef] [Scilit]
- Durlević, U.; Momčilović, A.; Ćurić, V.; Dragojević, M. GIS Application in Analysis of Erosion Intensity in the Vlasina River Basin. Glas. Srp. Geogr. Društva 2019, 99, 17–36. [Google Scholar] [CrossRef] [Scilit]
- Golijanin, J.; Nikolić, G.; Valjarević, A.; Ivanović, R.; Tunguz, V.; Bojić, S.; Grmuša, M.; Lukić Tanović, M.; Perić, M.; Hrelja, E.; et al. Estimation of Potential Soil Erosion Reduction Using GIS-Based RUSLE under Different Land Cover Management Models: A Case Study of Pale Municipality, B&H. Front. Environ. Sci. 2022, 10, 945789. [Google Scholar] [CrossRef] [Scilit]
- Lukić, S.; Baumgertel, A.; Obradović, S.; Kadović, R.; Beloica, J.; Pantić, D.; Belanović Simić, S. Assessment of Land Sensitivity to Degradation Using the MEDALUS Model—A Case Study of Grdelica Gorge and Vranjska Valley (Southeastern Serbia). iForest—Biogeosci. For. 2022, 15, 163–170. [Google Scholar] [CrossRef] [Scilit]
- Dalir, P.; Naghdi, R.; Jafari, S.; Tsioras, P.A. Comparative Assessment of Woody Species for Runoff and Soil Erosion Control on Forest Road Slopes in Harvested Sites of the Hyrcanian Forests, Northern Iran. Forests 2025, 16, 1013. [Google Scholar] [CrossRef] [Scilit]
- Braunović, S.; Cvetković, J.; Jovanović, F.; Polovina, S.; Šurjanac, N.; Stojanović, V.; Momirović, N. Assessment of Soil Erosion Intensity Using the Erosion Potential Method: A Case Study of the Grdelica Gorge, Serbia. Sustain. For. 2025, 91, 37–53. [Google Scholar] [CrossRef] [Scilit]
- Bezbradica, L.; Josimović, B.; Milijić, S. Impact of Repurposing Forest Land on Erosion and Sediment Production—Case Study: Krupanj Municipality—Serbia. Forests 2023, 14, 1127. [Google Scholar] [CrossRef] [Scilit]
- Birhanu, L.; Mekonen, Y.; Tilahun, A.; Amsalu, N.; Balzter, H. Impact of Land Use and Land Cover Change on Soil Erosion in Dondor Watershed, Blue Nile Basin, Northwestern Ethiopia. Sustainability 2024, 16, 10421. [Google Scholar] [CrossRef] [Scilit]
- Xie, Z.; Liu, G.; Wang, X.; Liu, J. A Data-Driven Analysis of Soil Erosion Assessment and Driving Forces in the Henan Section of the Yellow River Basin. Sustainability 2026, 18, 1520. [Google Scholar] [CrossRef] [Scilit]
- Kabili, S.; Algouti, A.; Algouti, A.; Ezzahzi, S. Estimation and Mapping of Water Erosion and Soil Loss: Application of Gavrilovic Erosion Potential Model (EPM) Using GIS and Remote Sensing in the Assif El Mal Watershed, Western High Atlas. China Geol. 2024, 7, 672–685. [Google Scholar] [CrossRef] [Scilit]
- Guo, Z.; Yan, Z.; He, R.; Yang, H.; Ci, H.; Wang, R. Impacts of Land Use Conversion on Soil Erosion in the Urban Agglomeration on the Northern Slopes of the Tianshan Mountains. Land 2024, 13, 550. [Google Scholar] [CrossRef] [Scilit]
- Min, J.; Liu, X.; Li, H.; Wang, R.; Luo, X. Spatio-Temporal Variations in Soil Erosion and Its Driving Forces in the Loess Plateau from 2000 to 2050 Based on the RUSLE Model. Appl. Sci. 2024, 14, 5945. [Google Scholar] [CrossRef] [Scilit]
- Gu, Z.; Ji, K.; Yi, Q.; Cao, S.; Li, P.; Feng, D. Quantitative Evaluation of Soil Erosion in Loess Hilly Area of Western Henan Based on Sampling Approach. Water 2024, 16, 2895. [Google Scholar] [CrossRef] [Scilit]
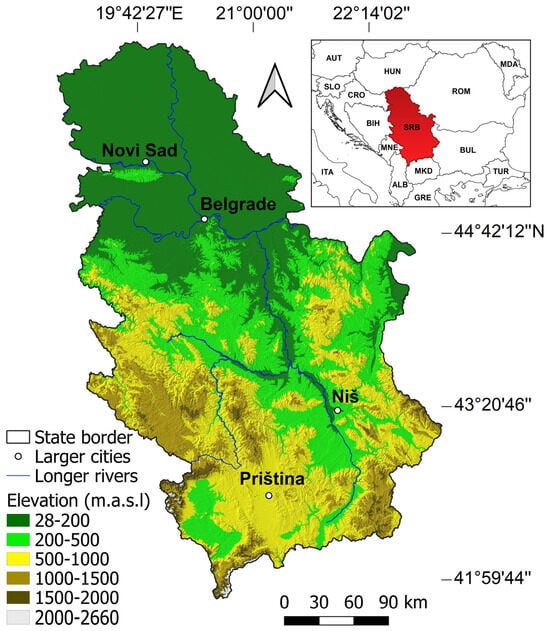
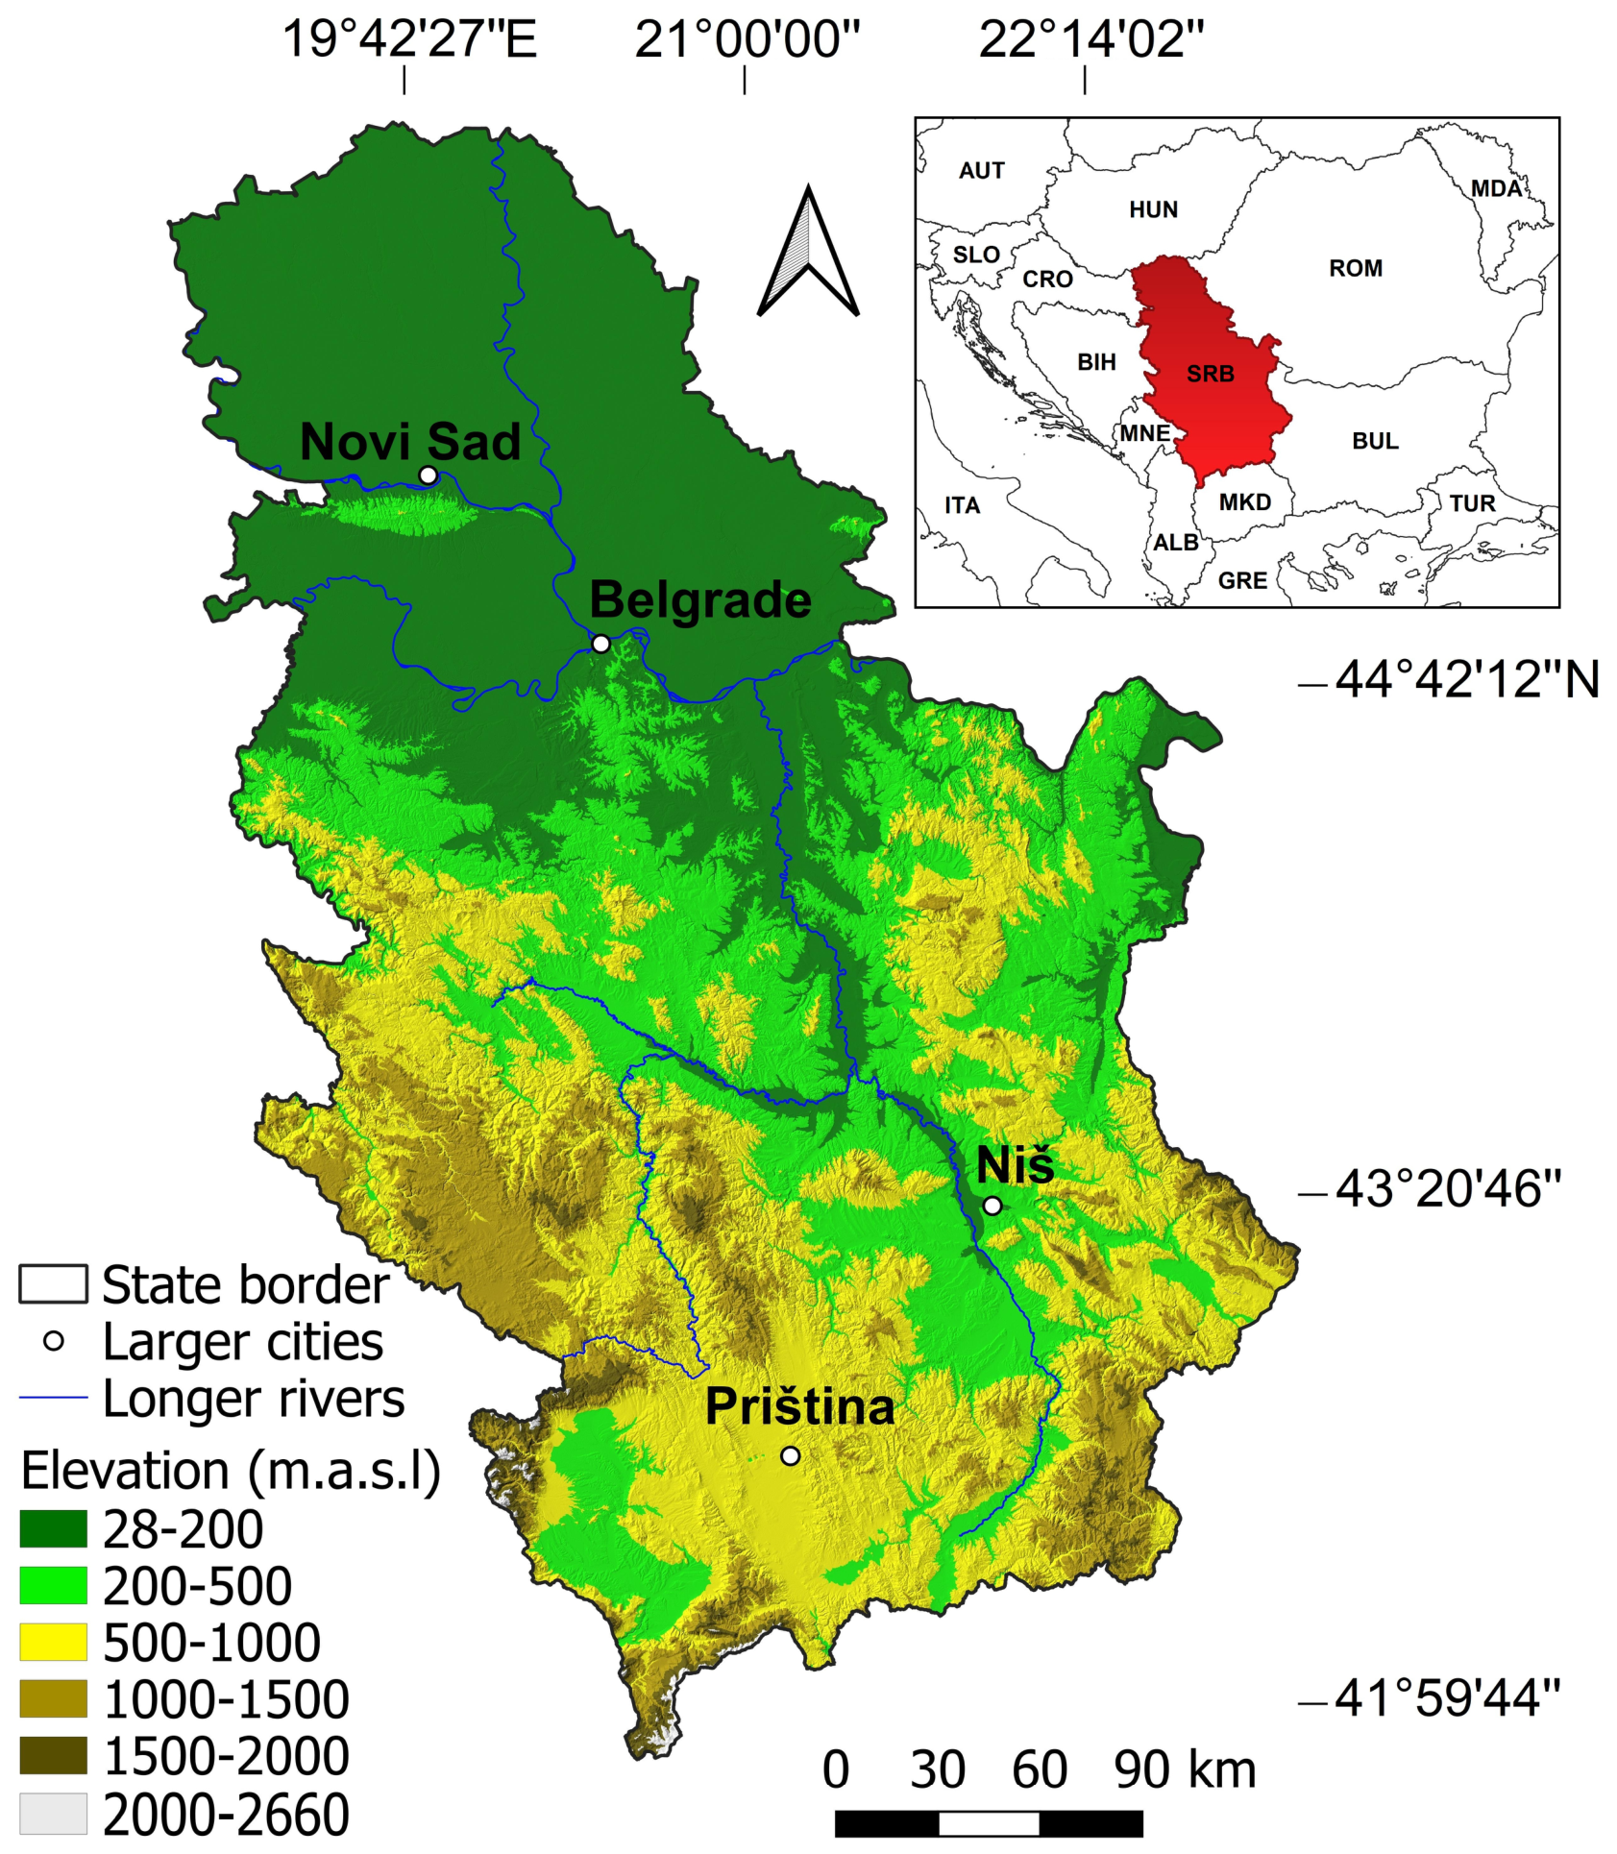
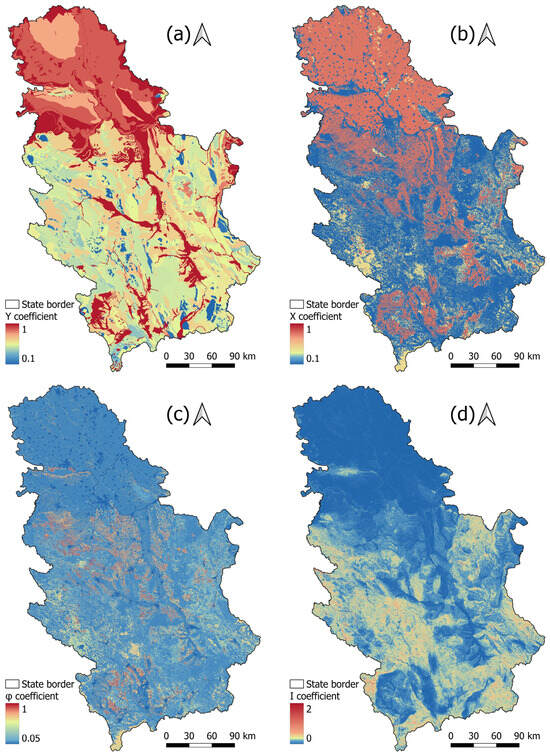
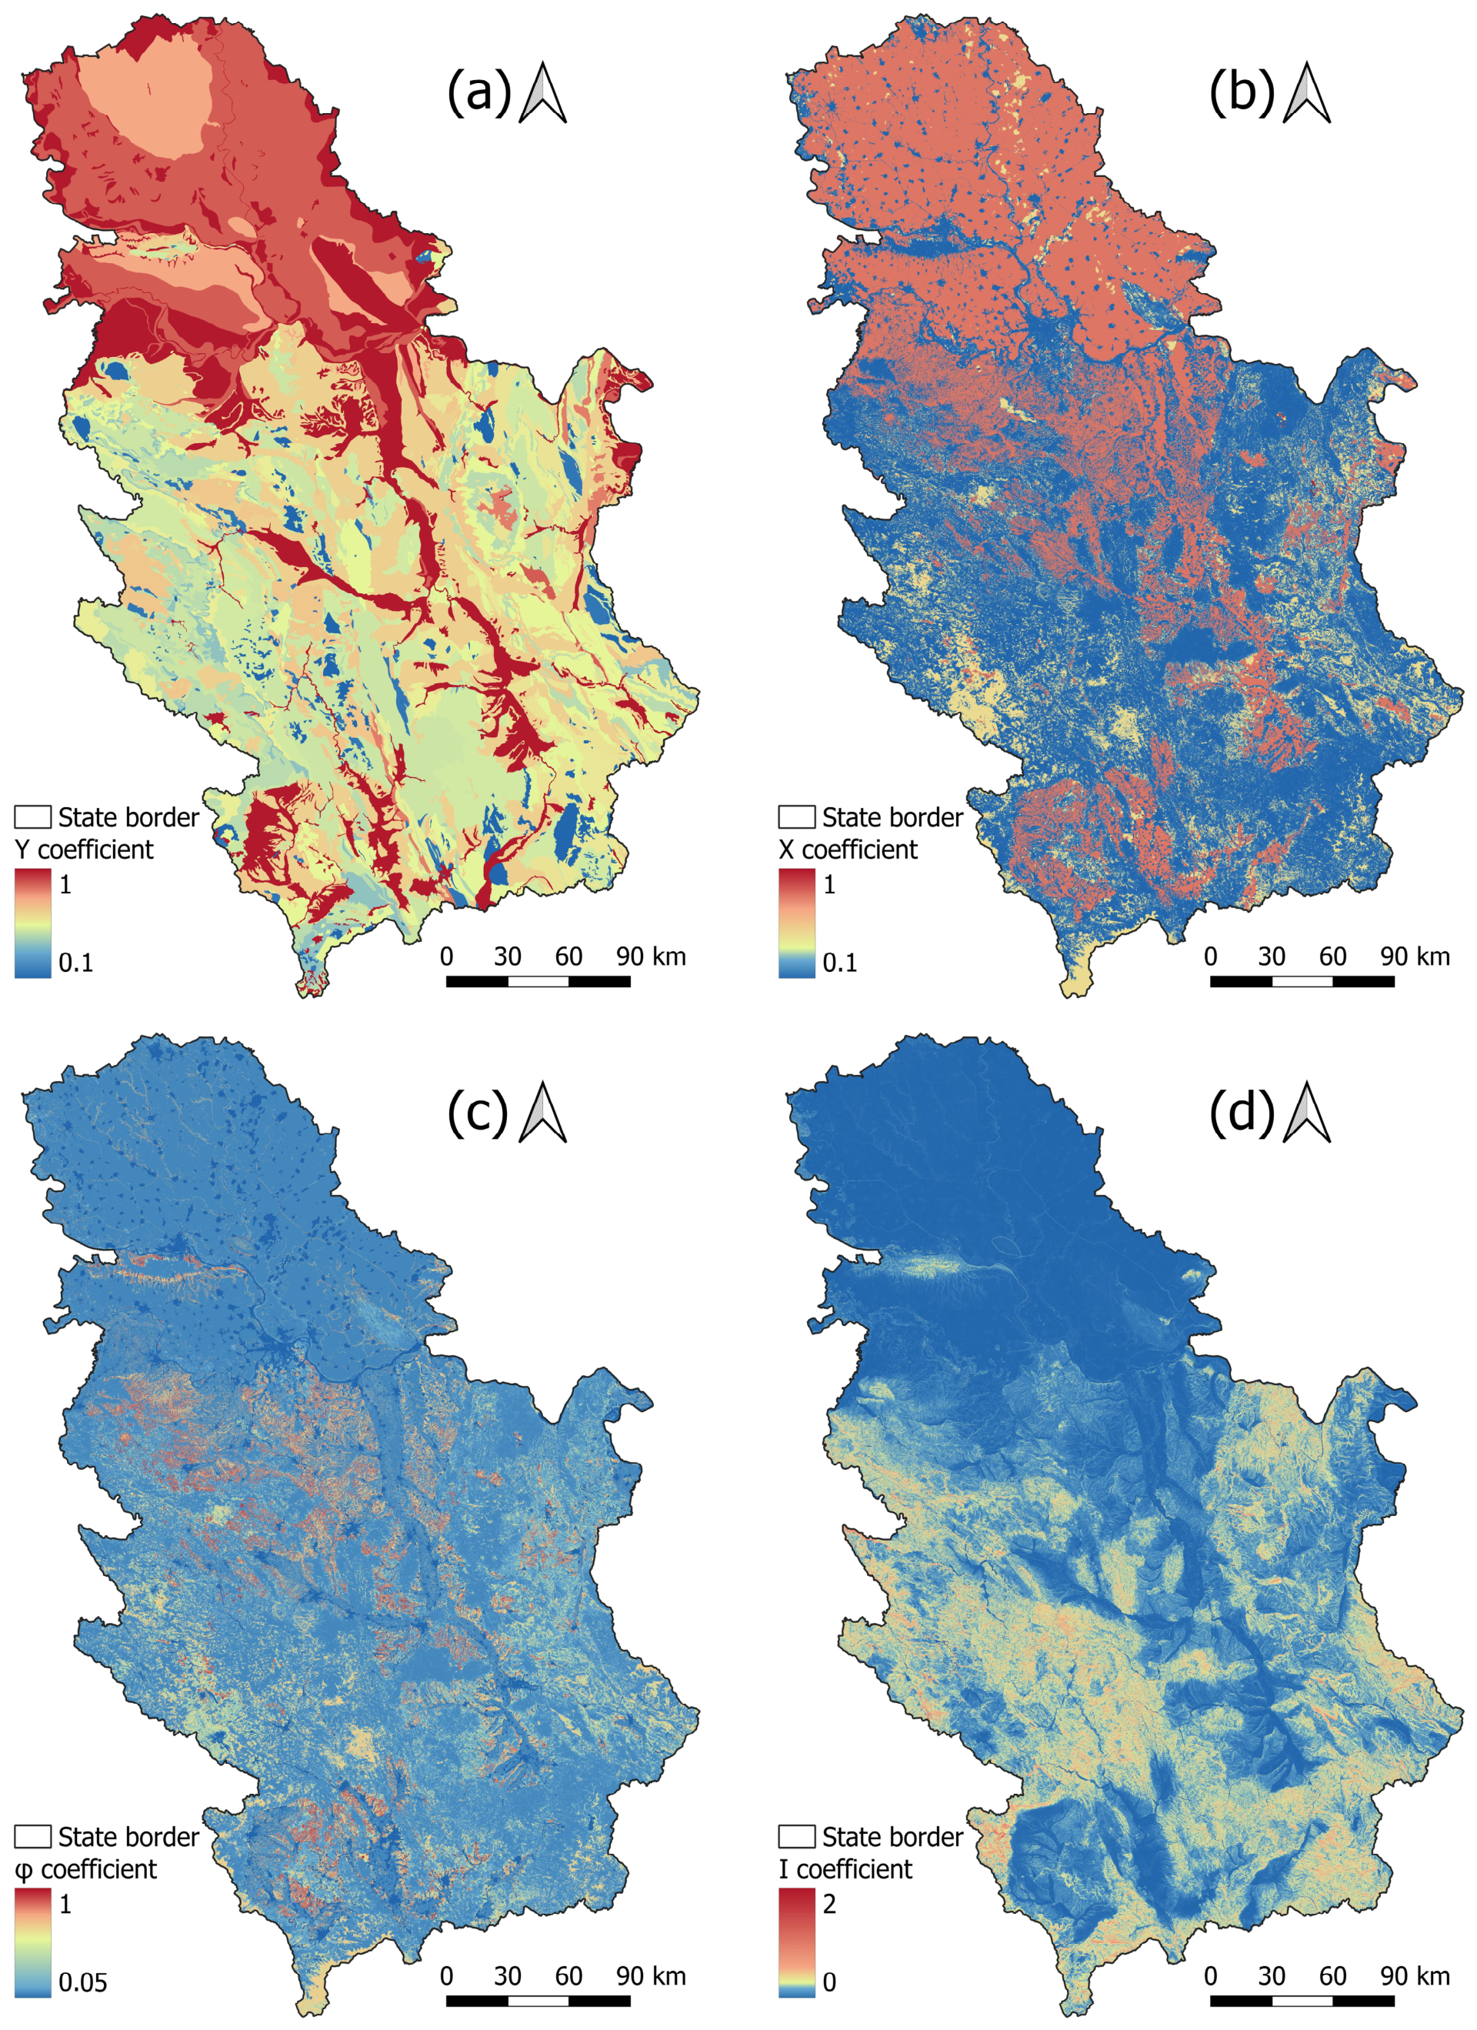
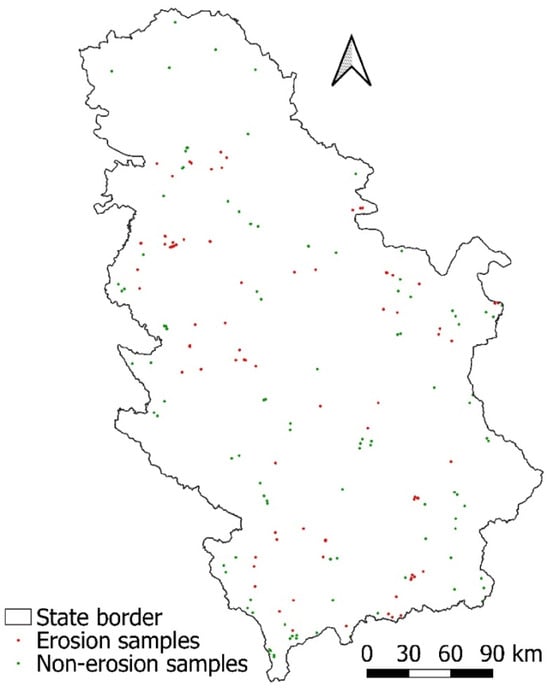
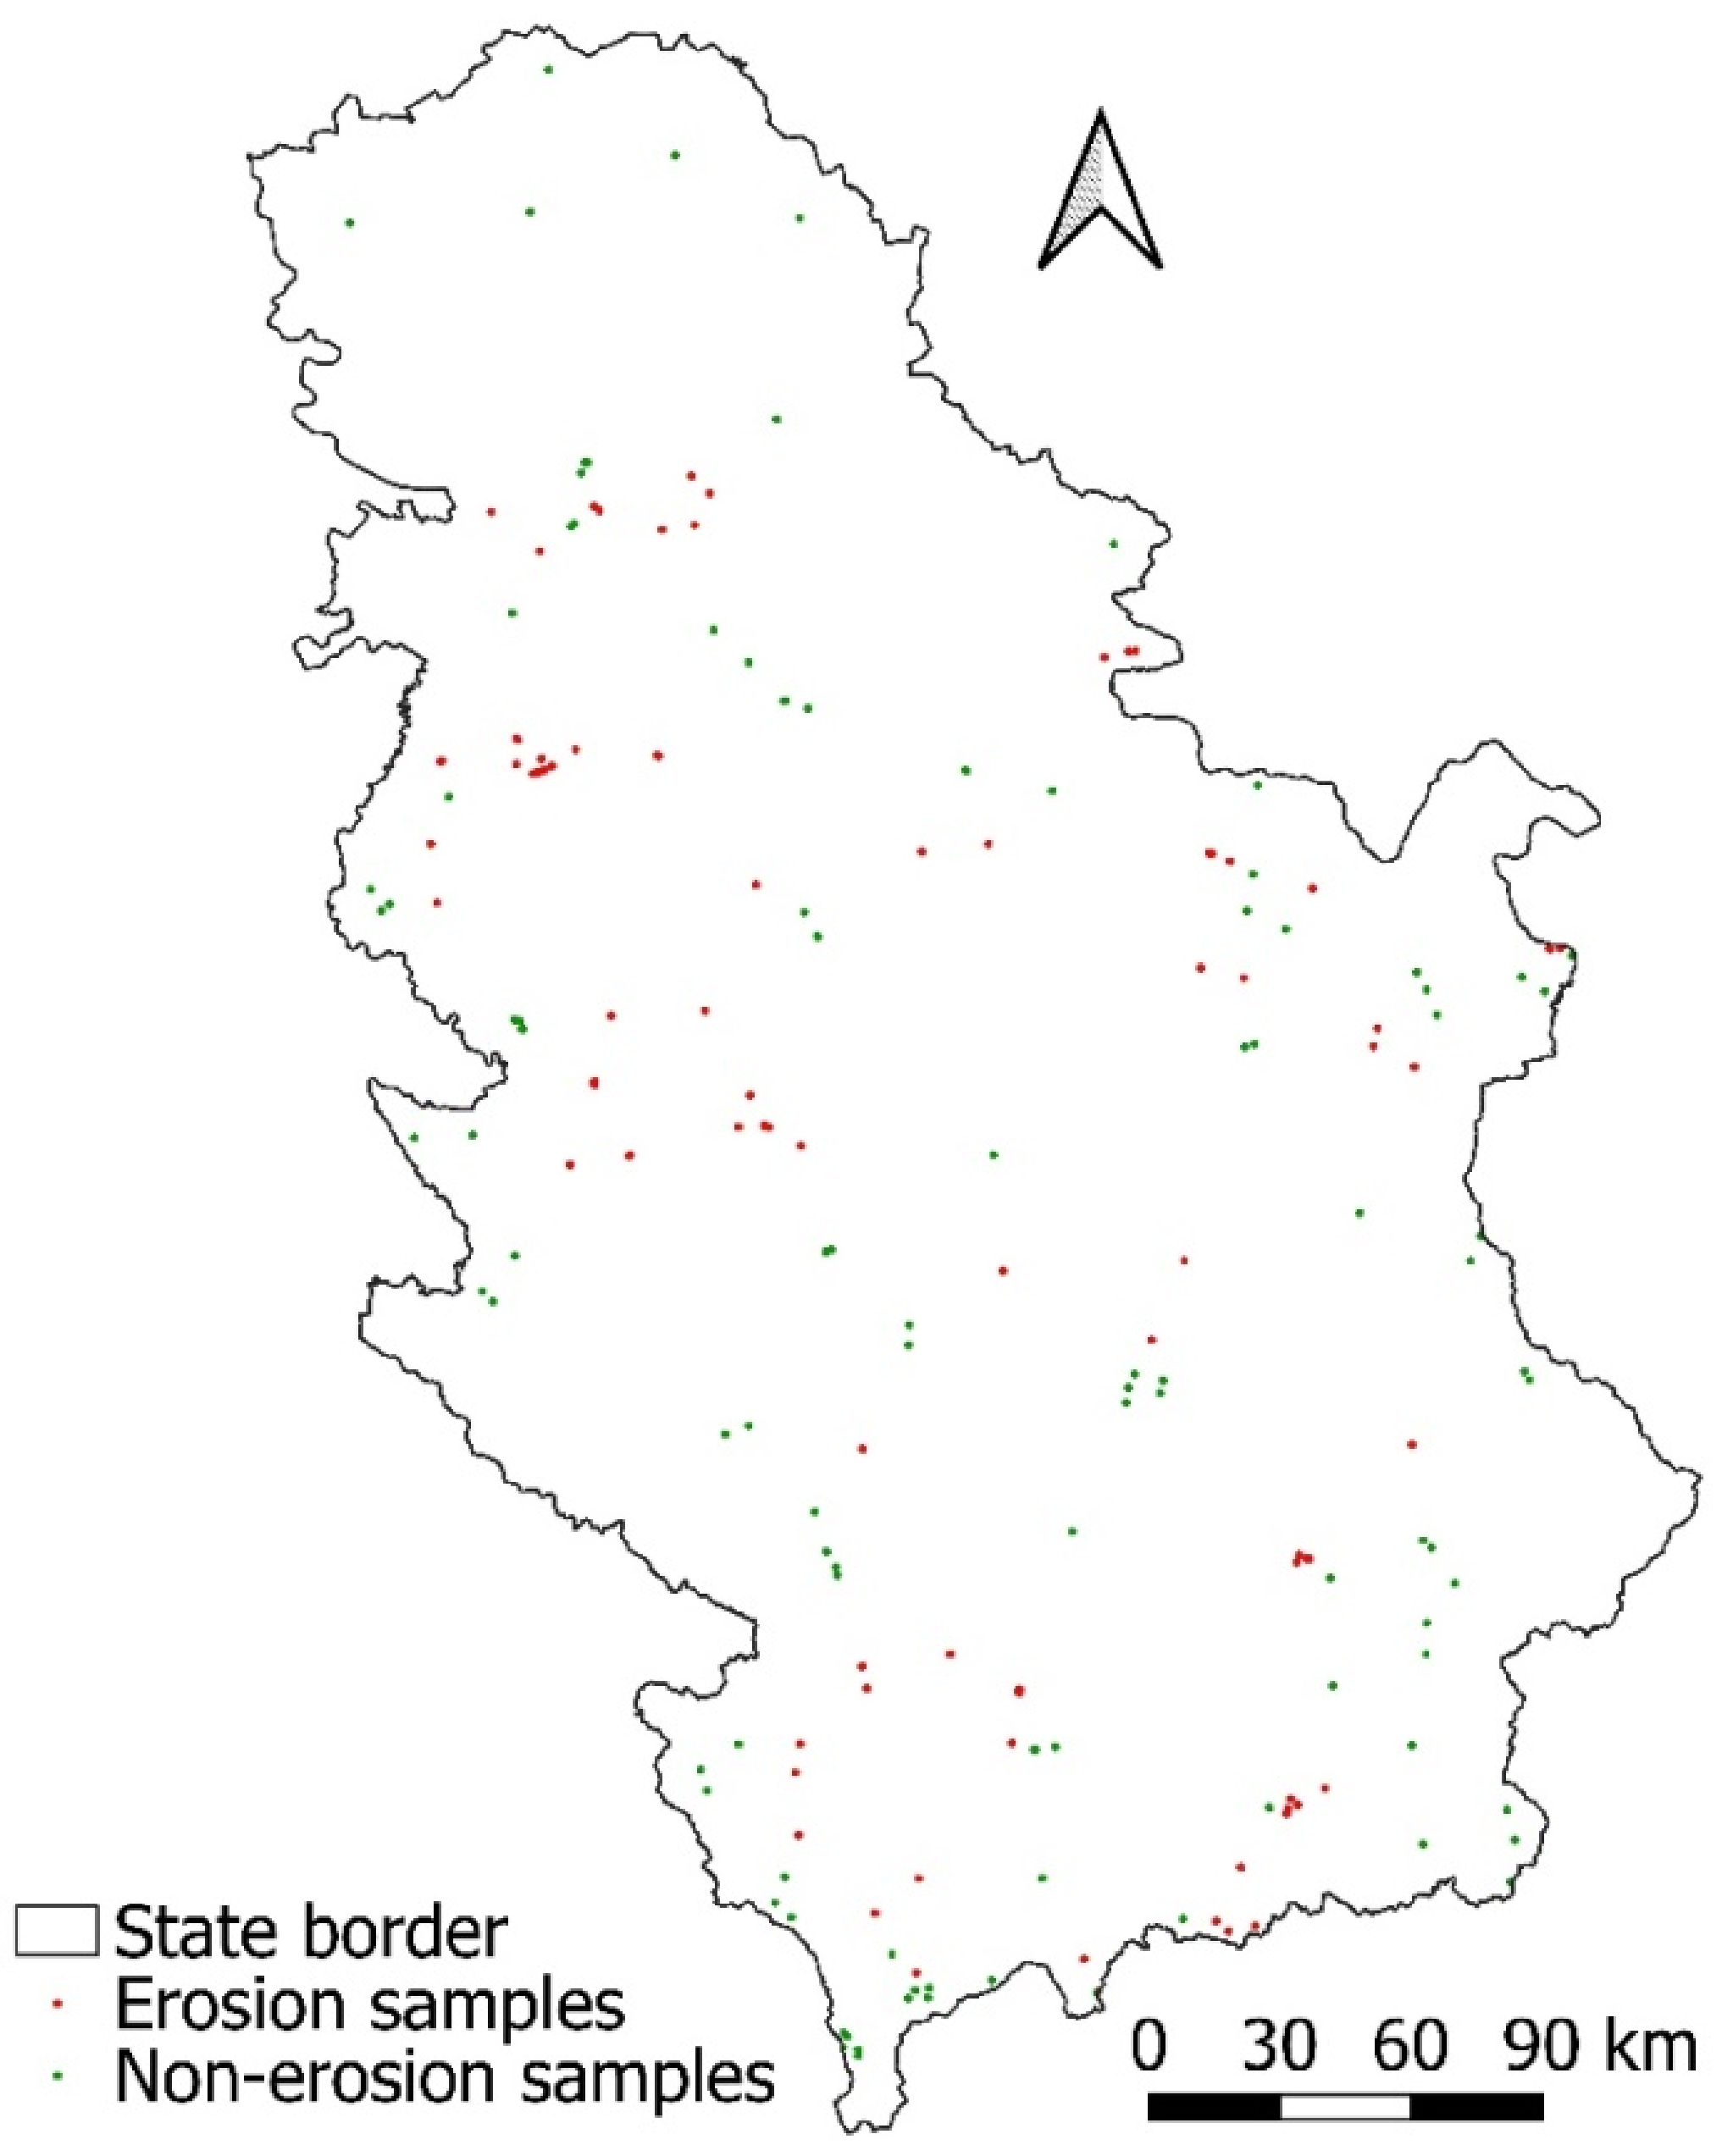
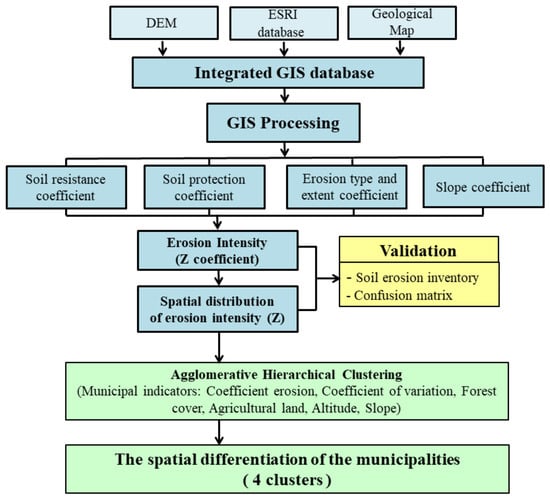
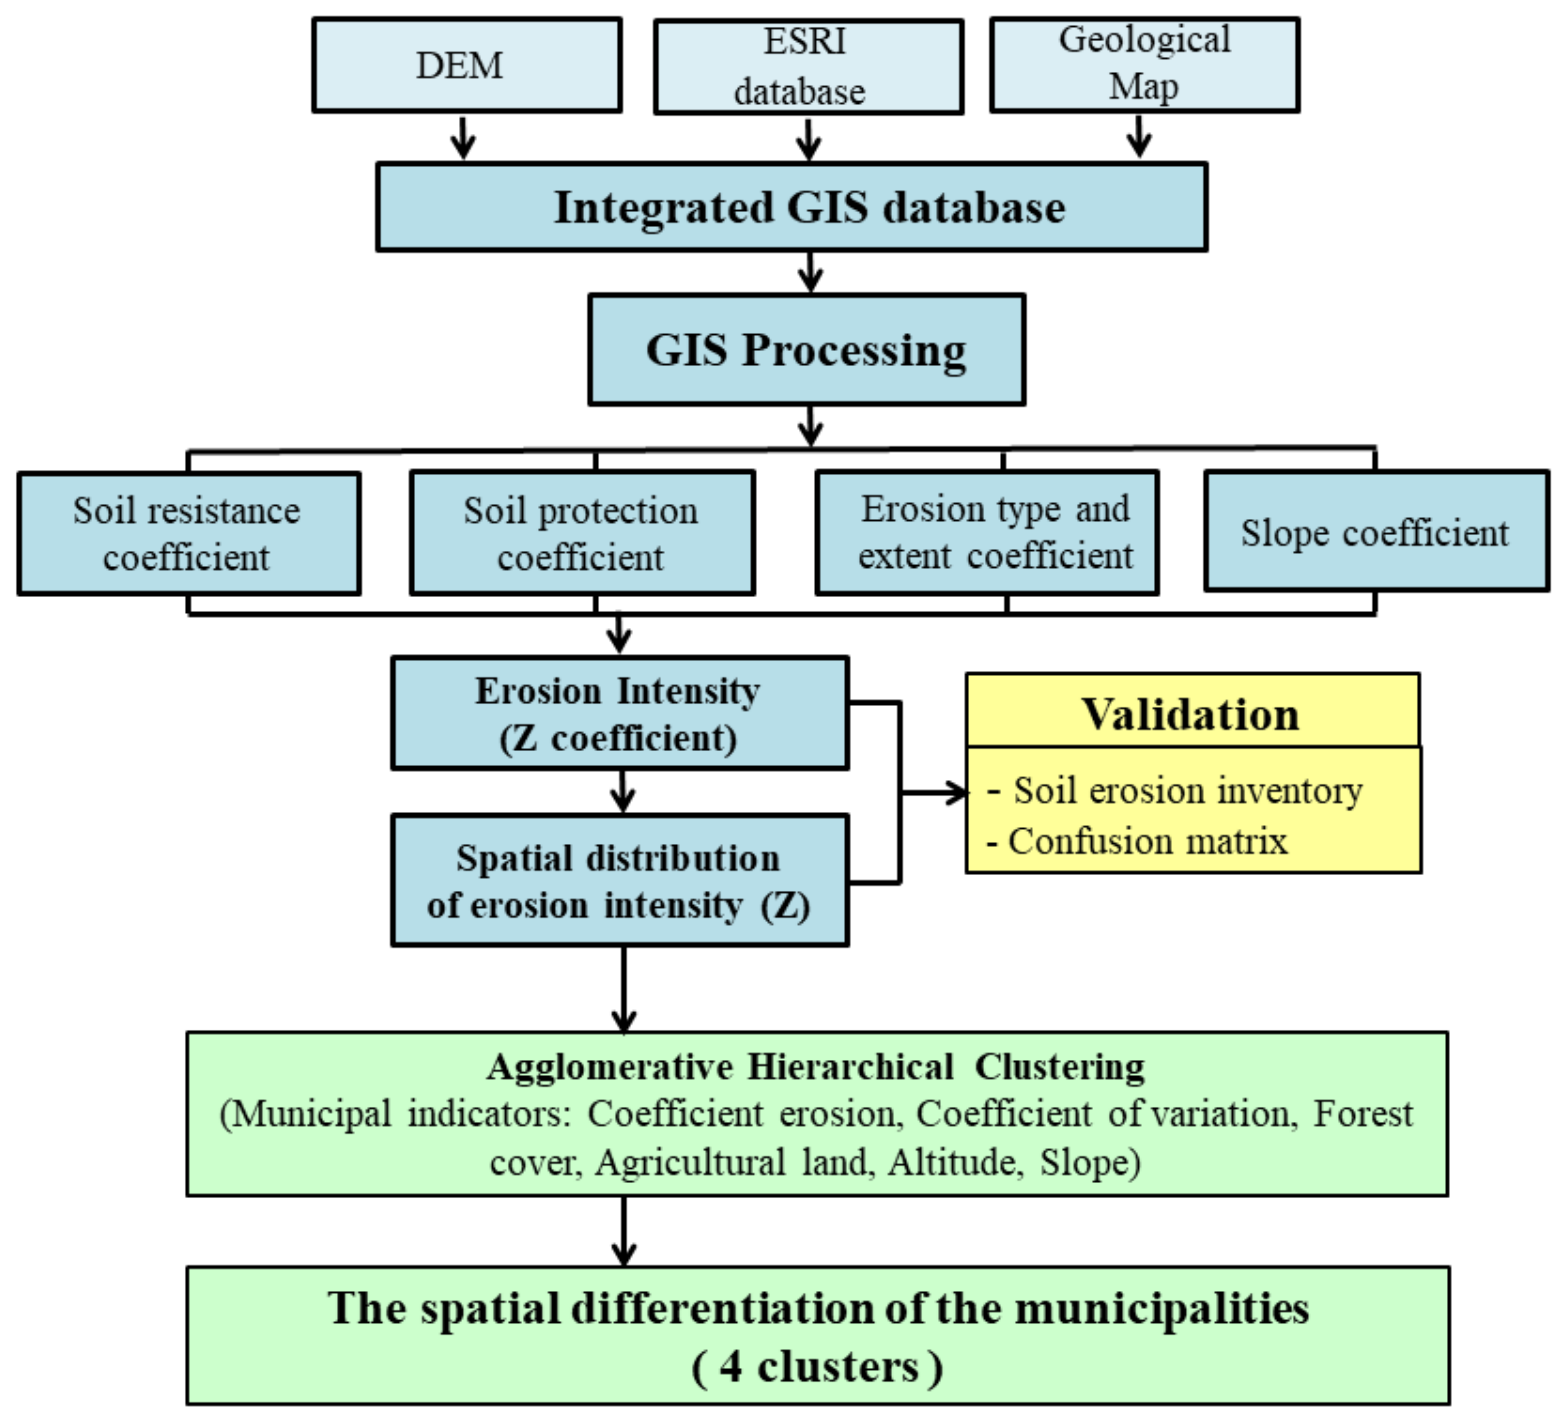
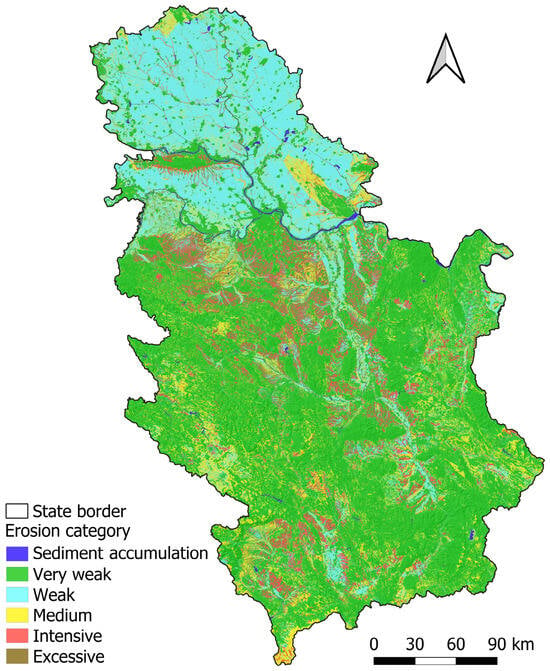
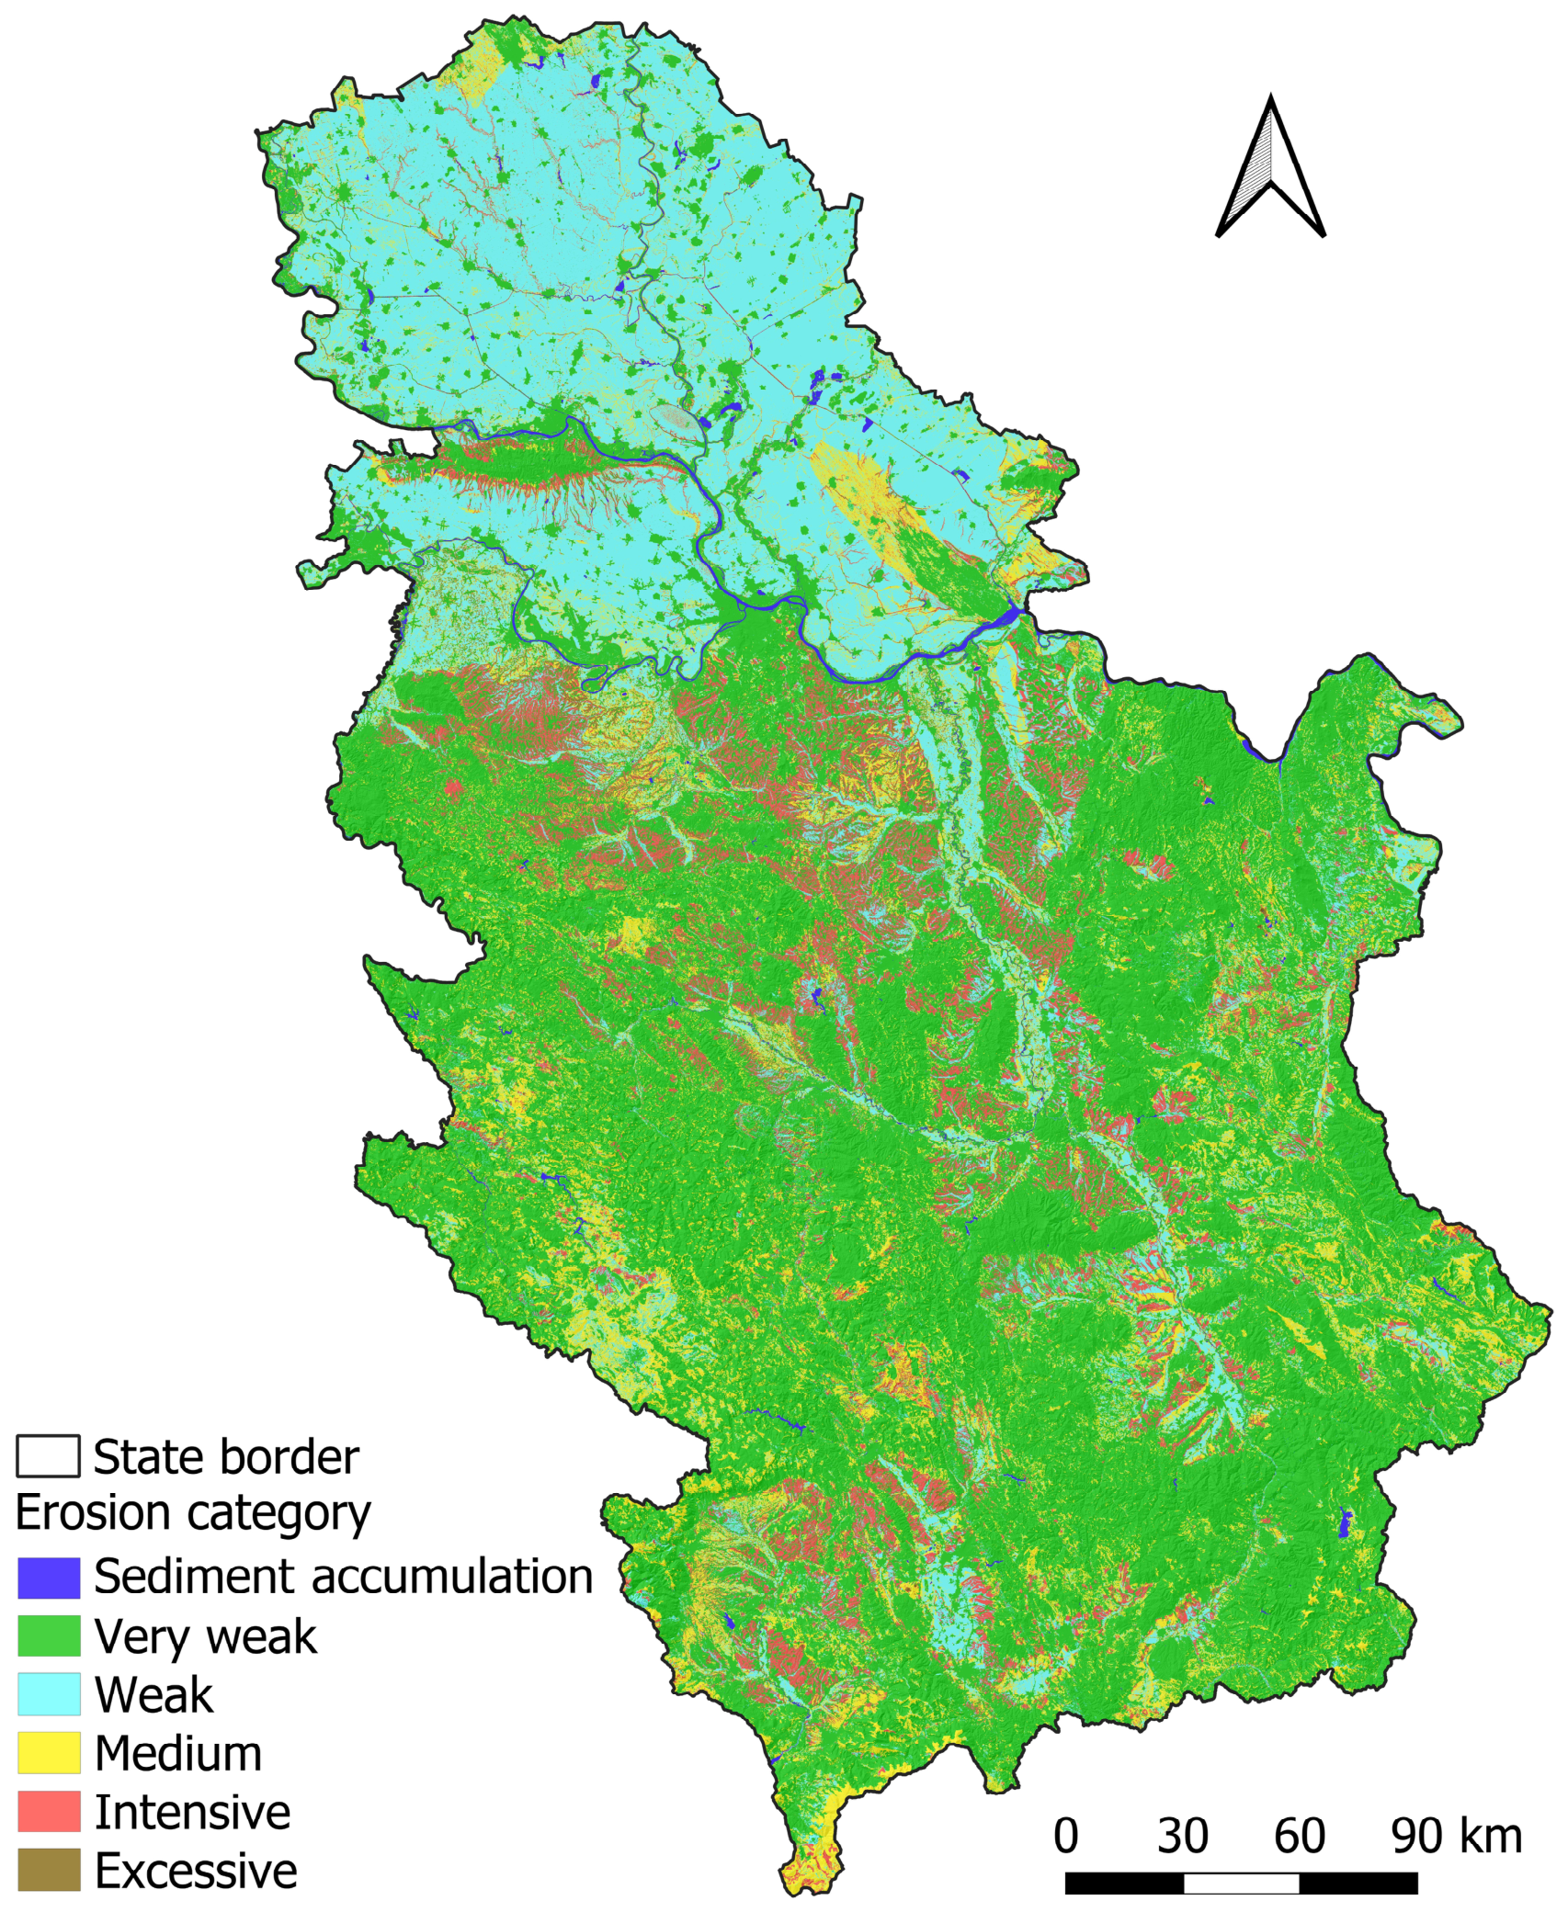
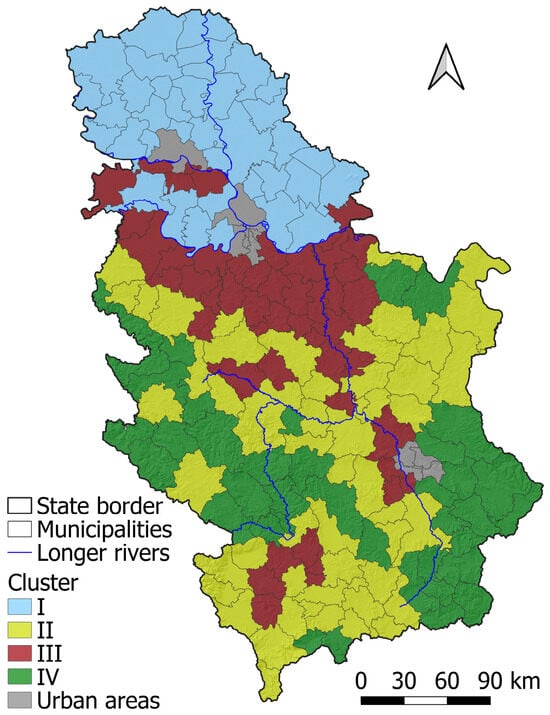
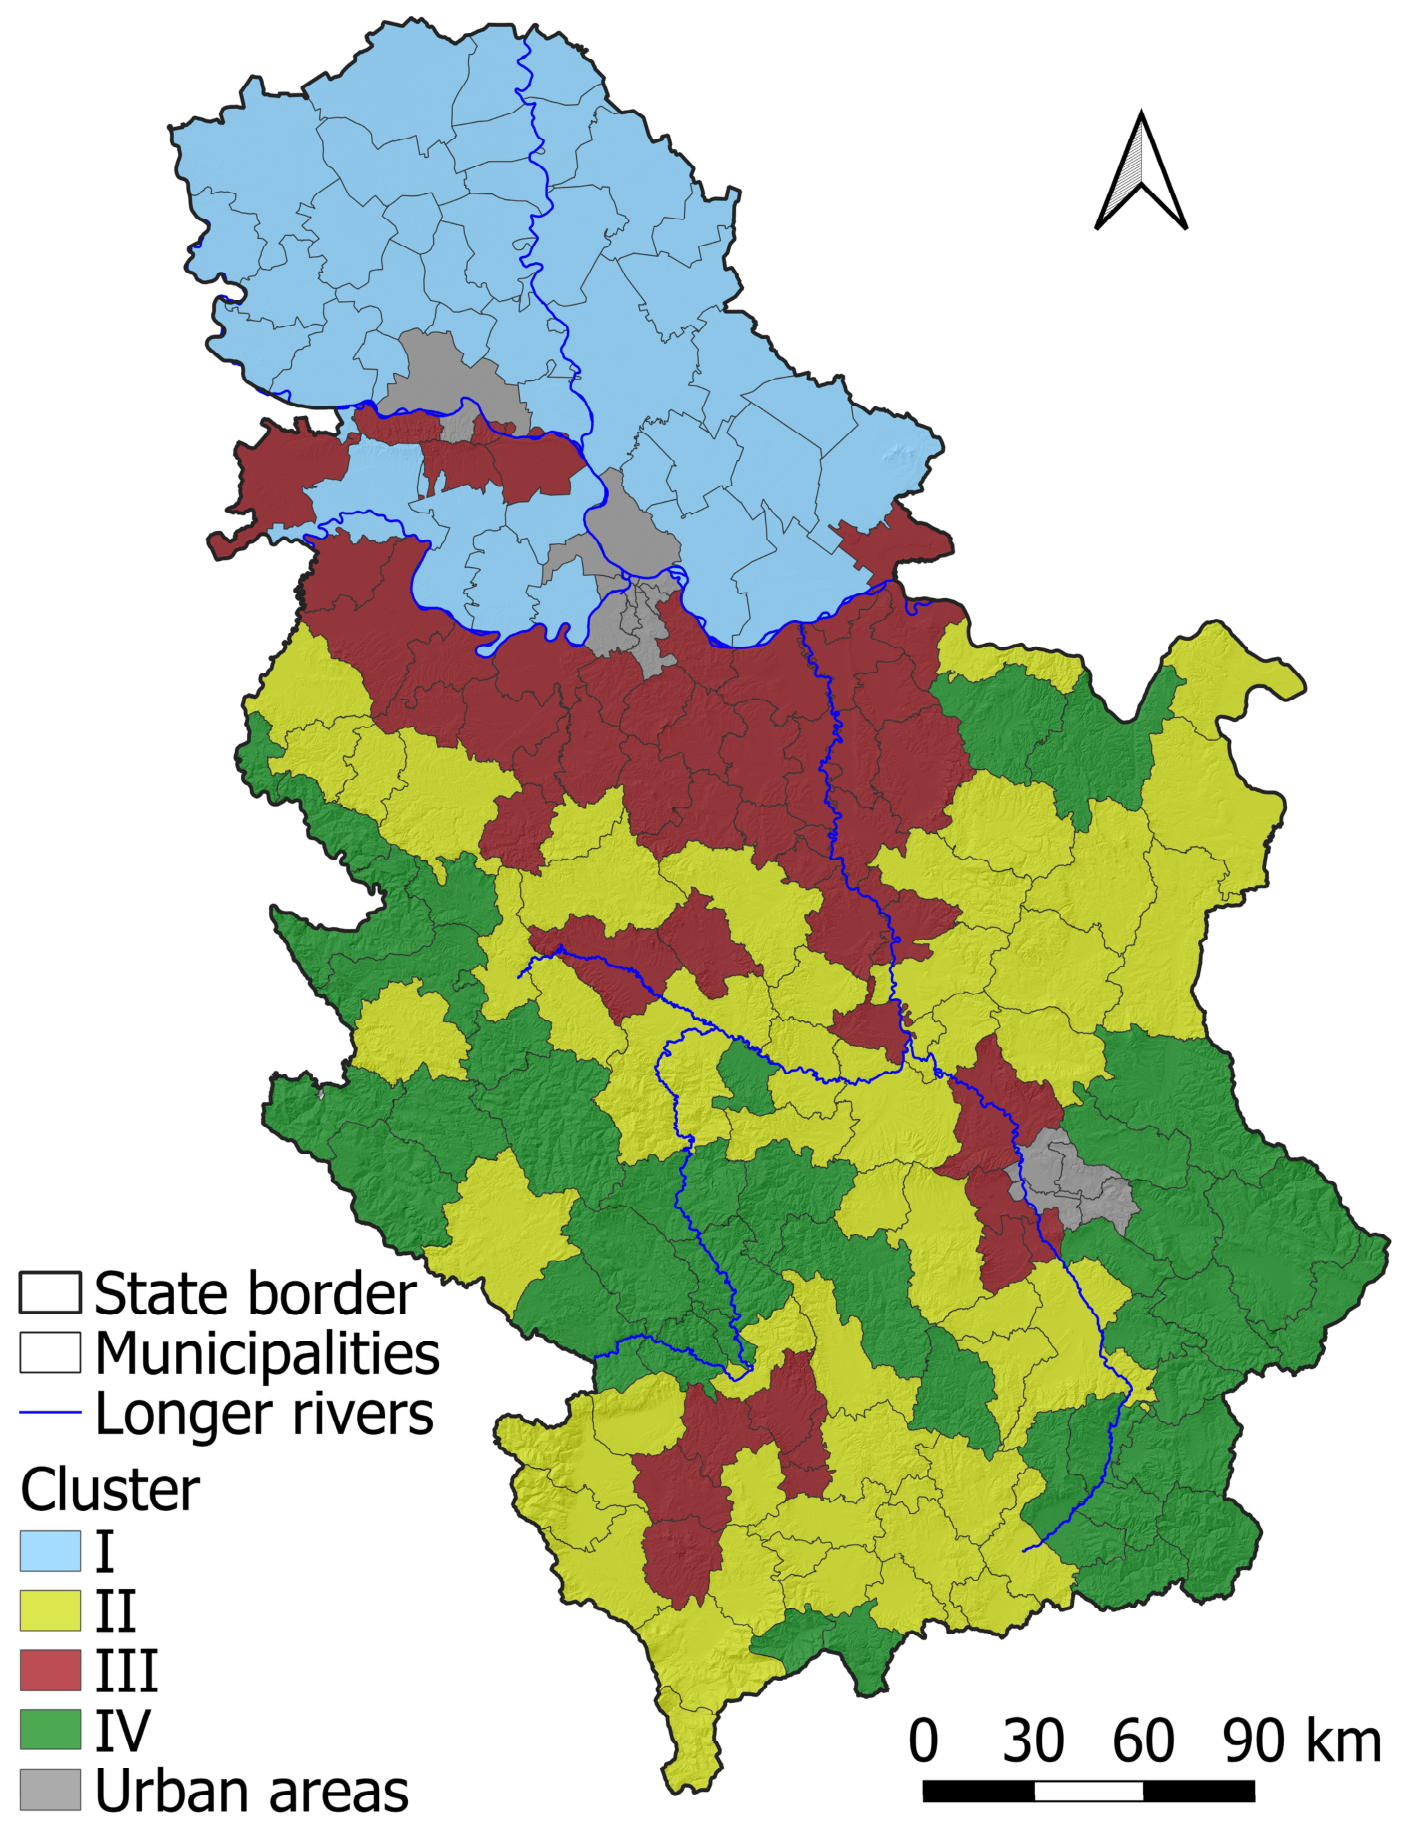
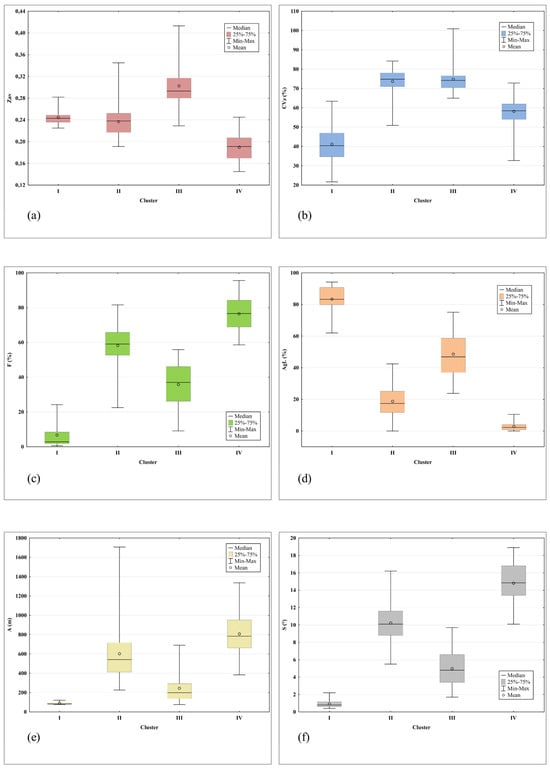
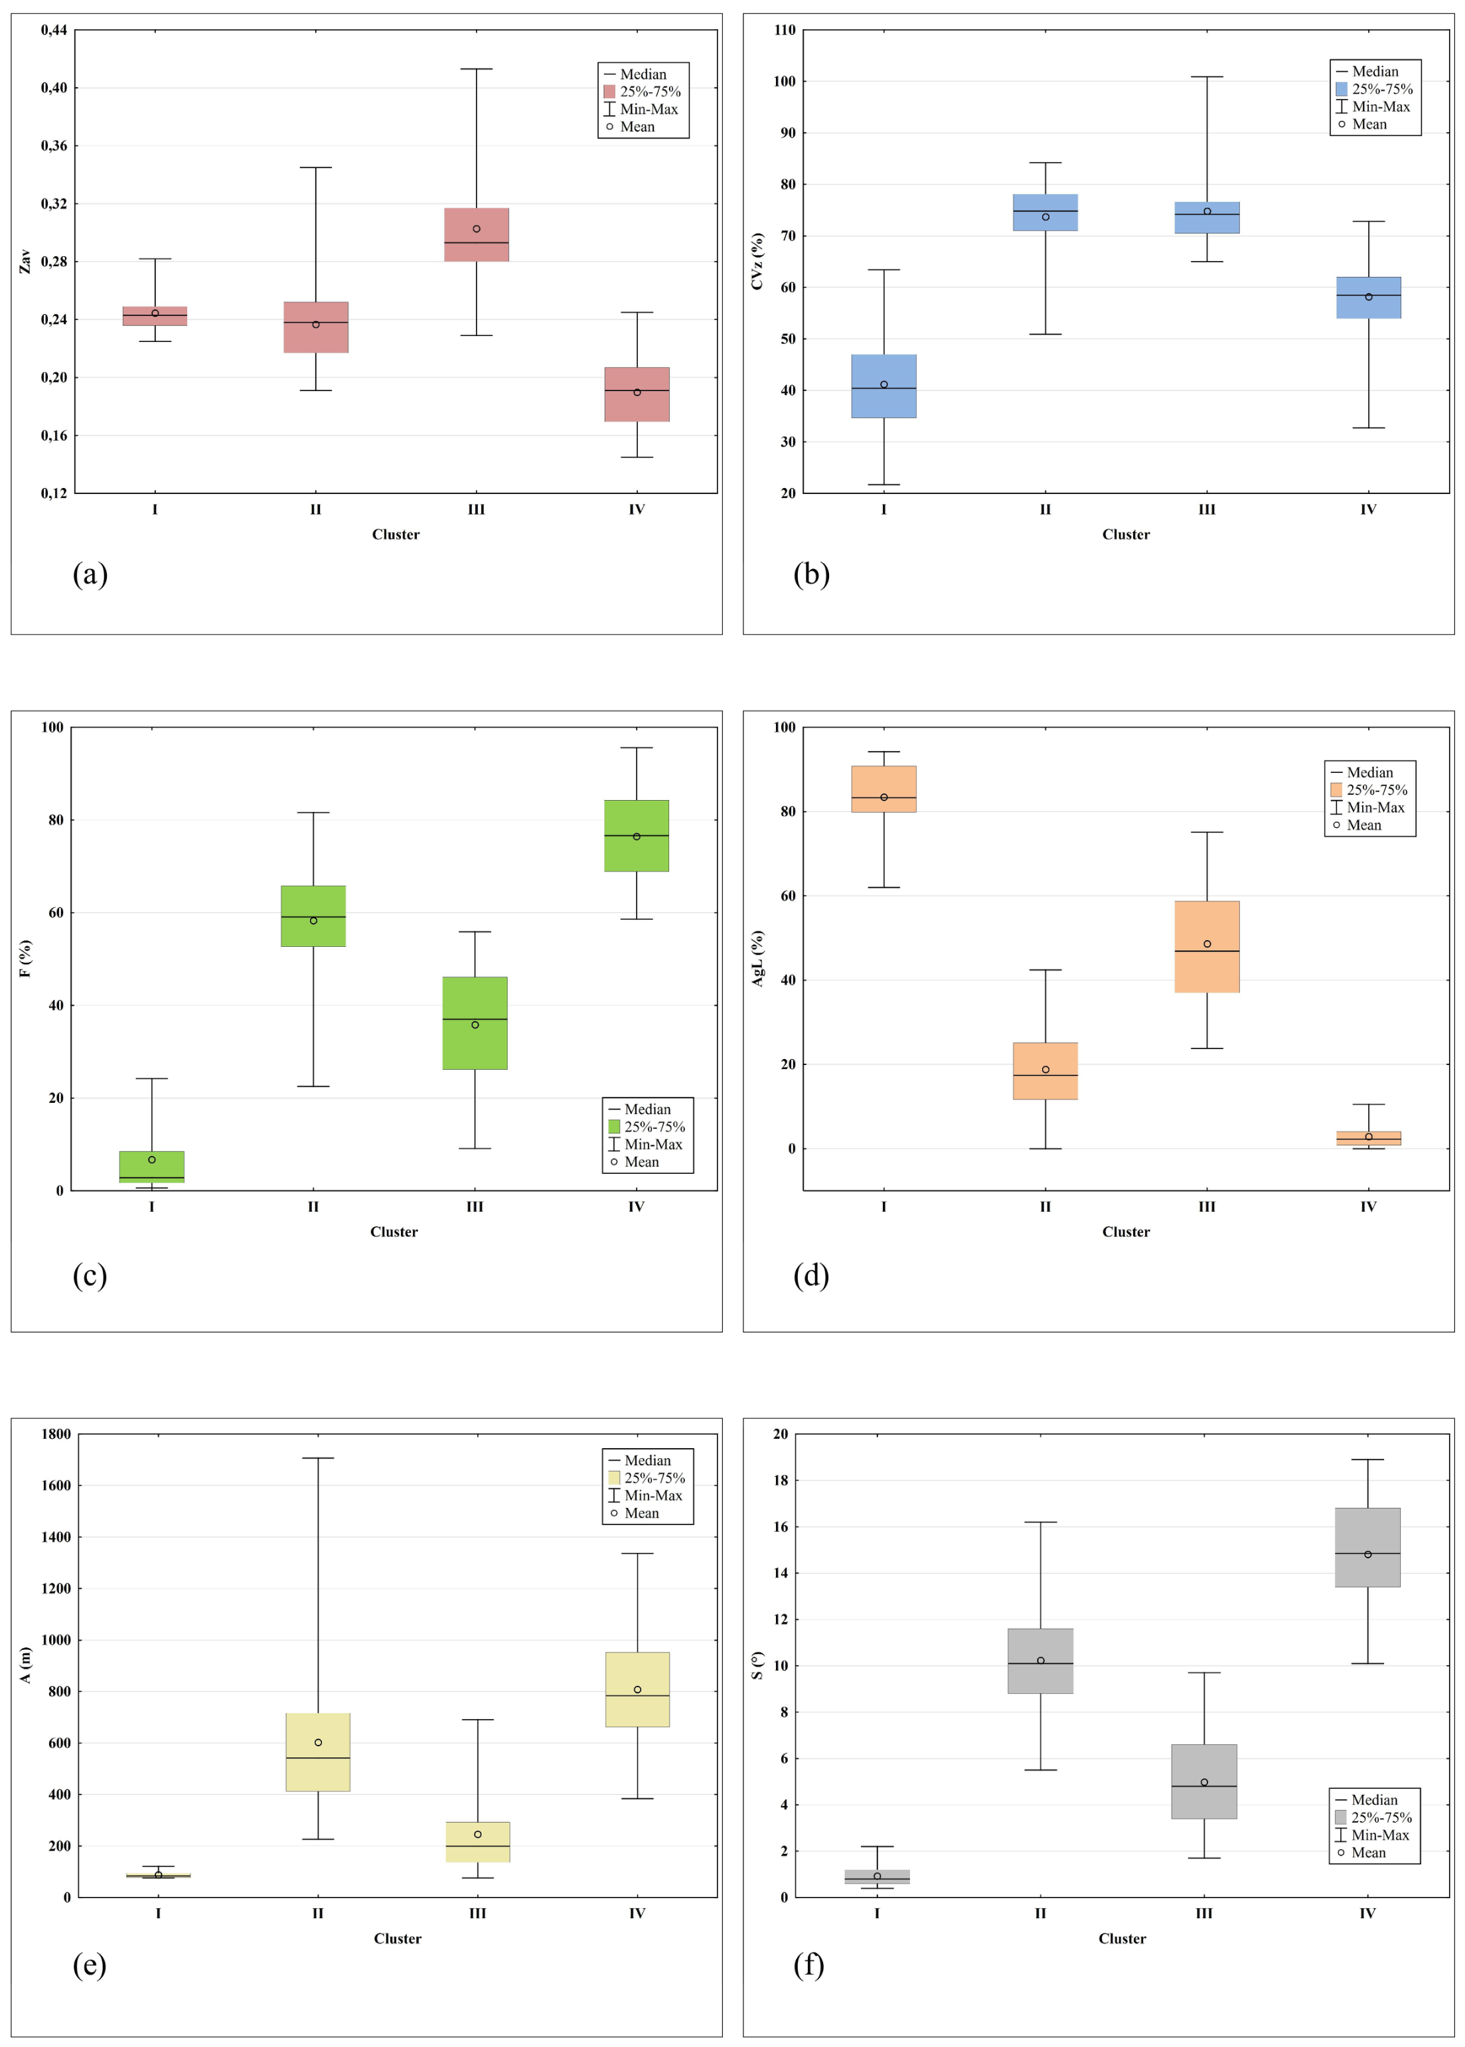
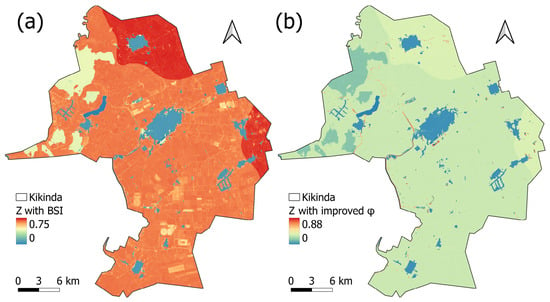
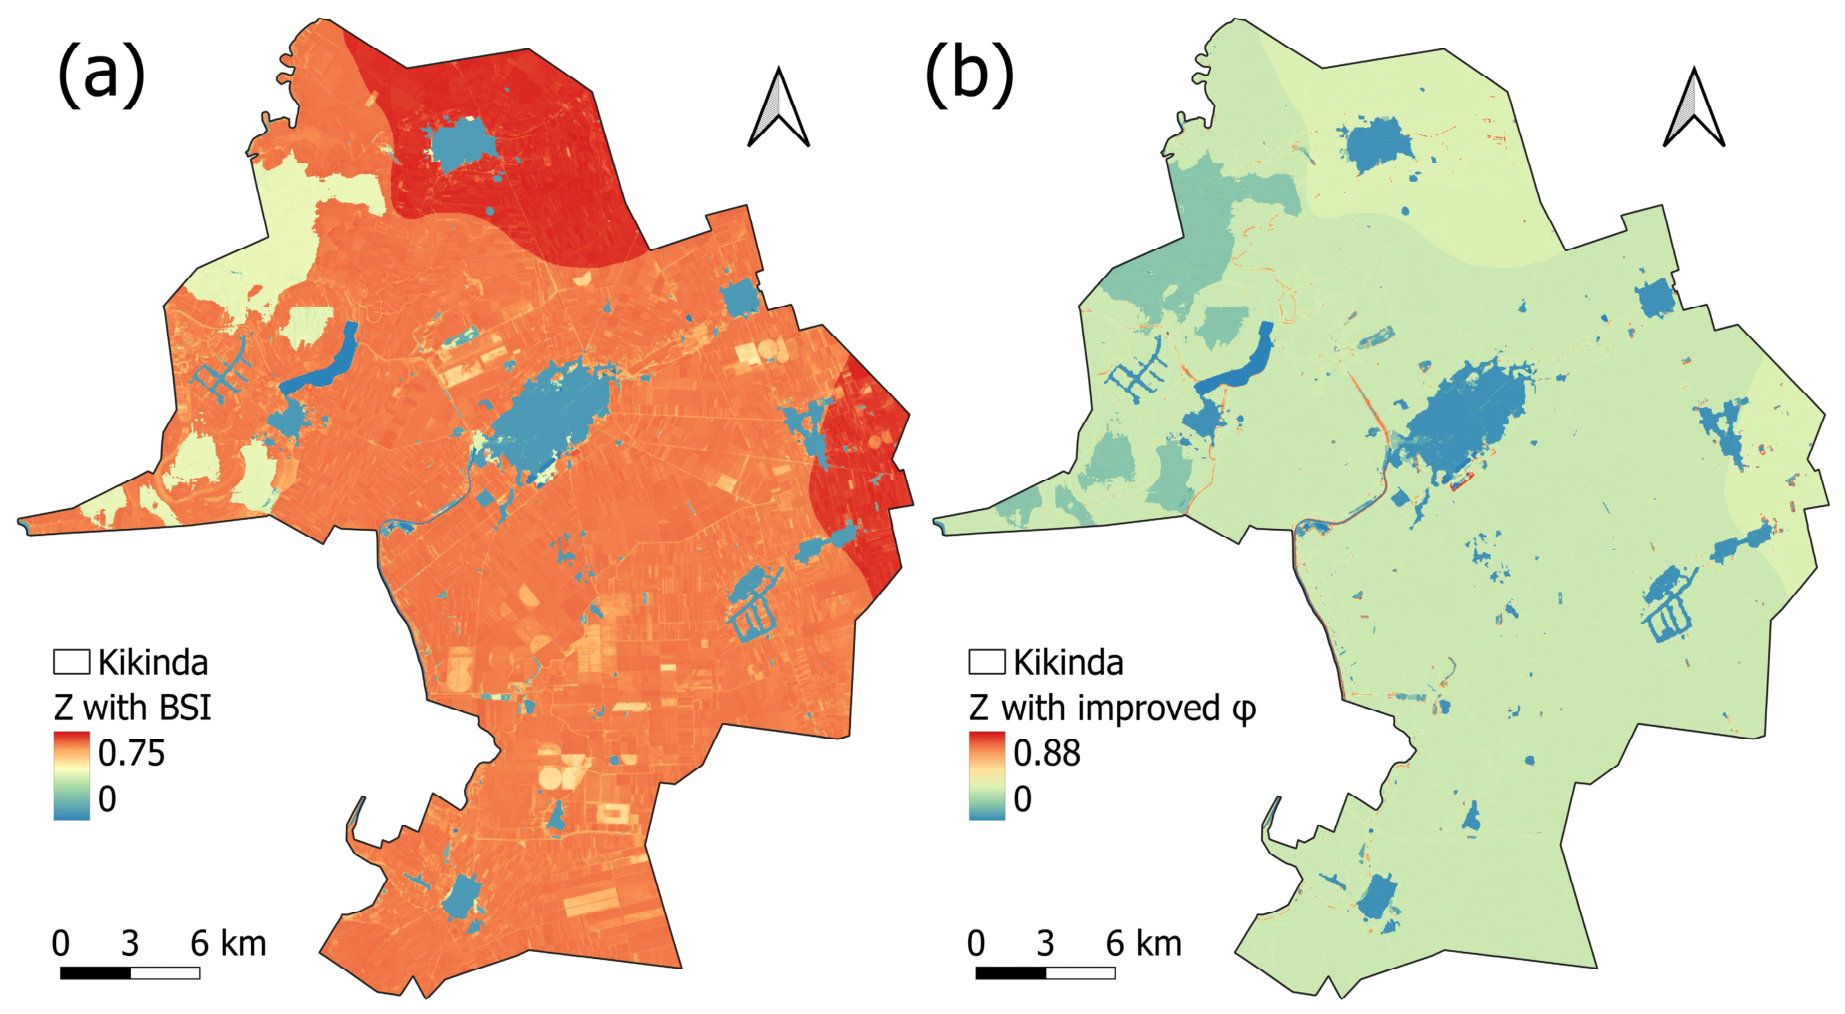
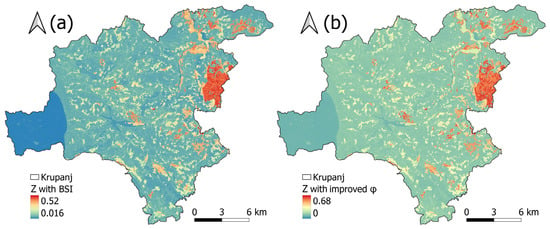
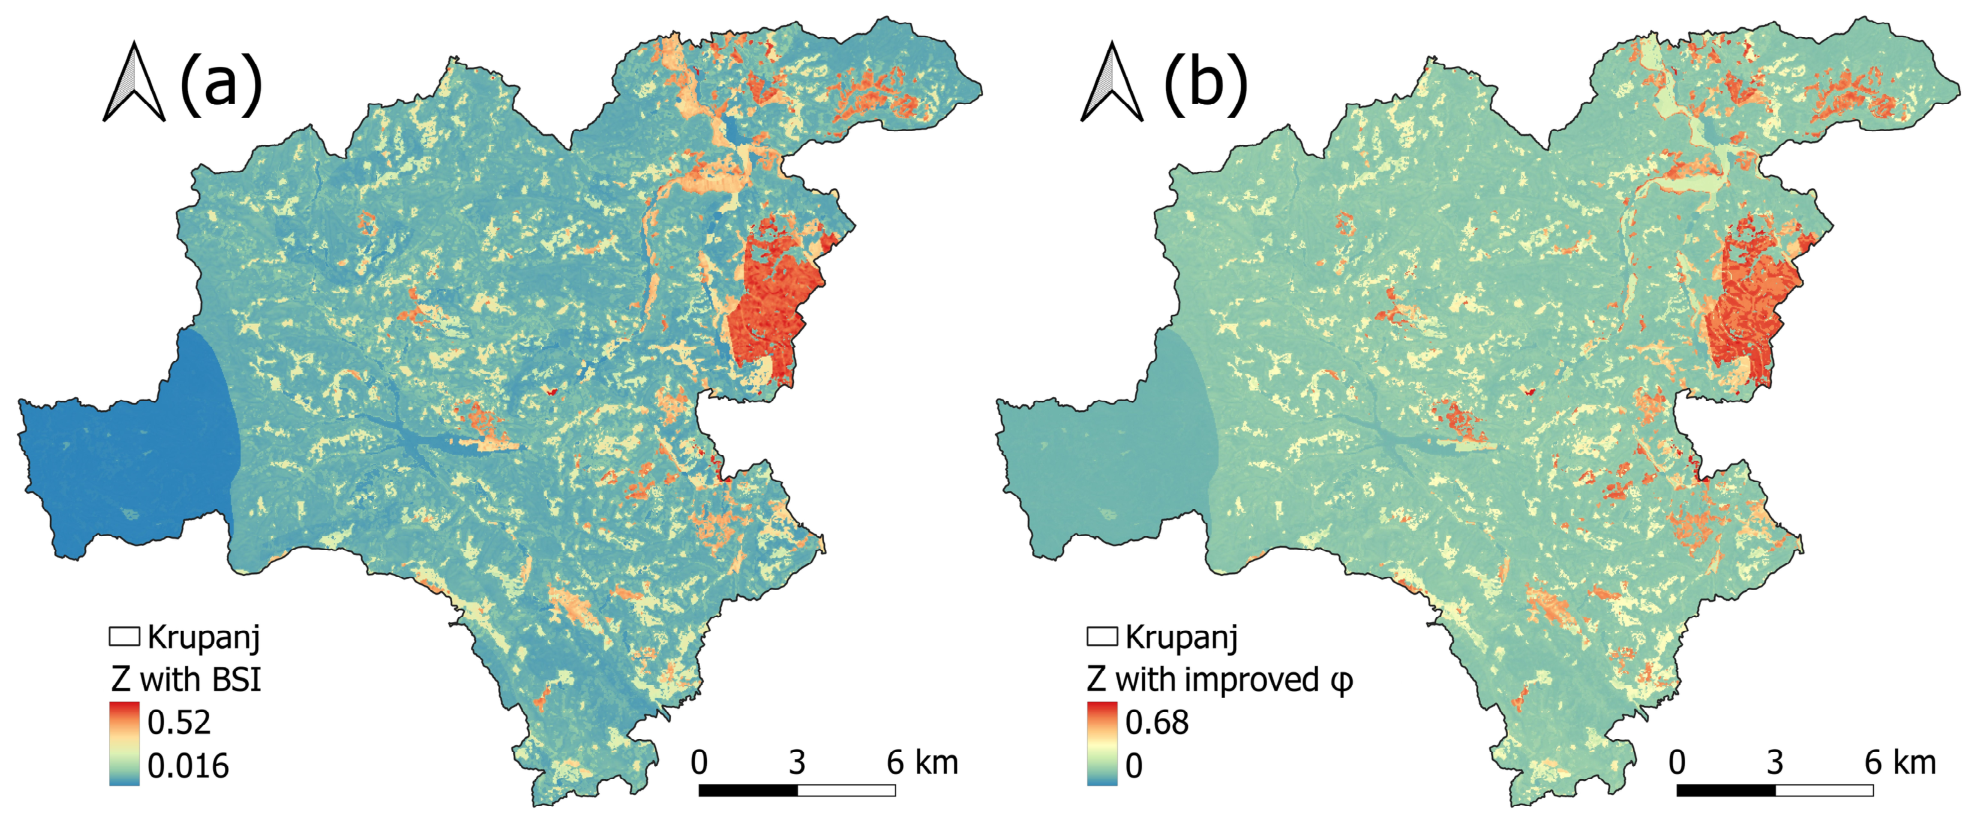
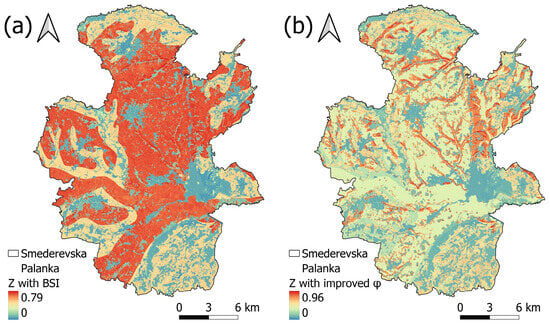
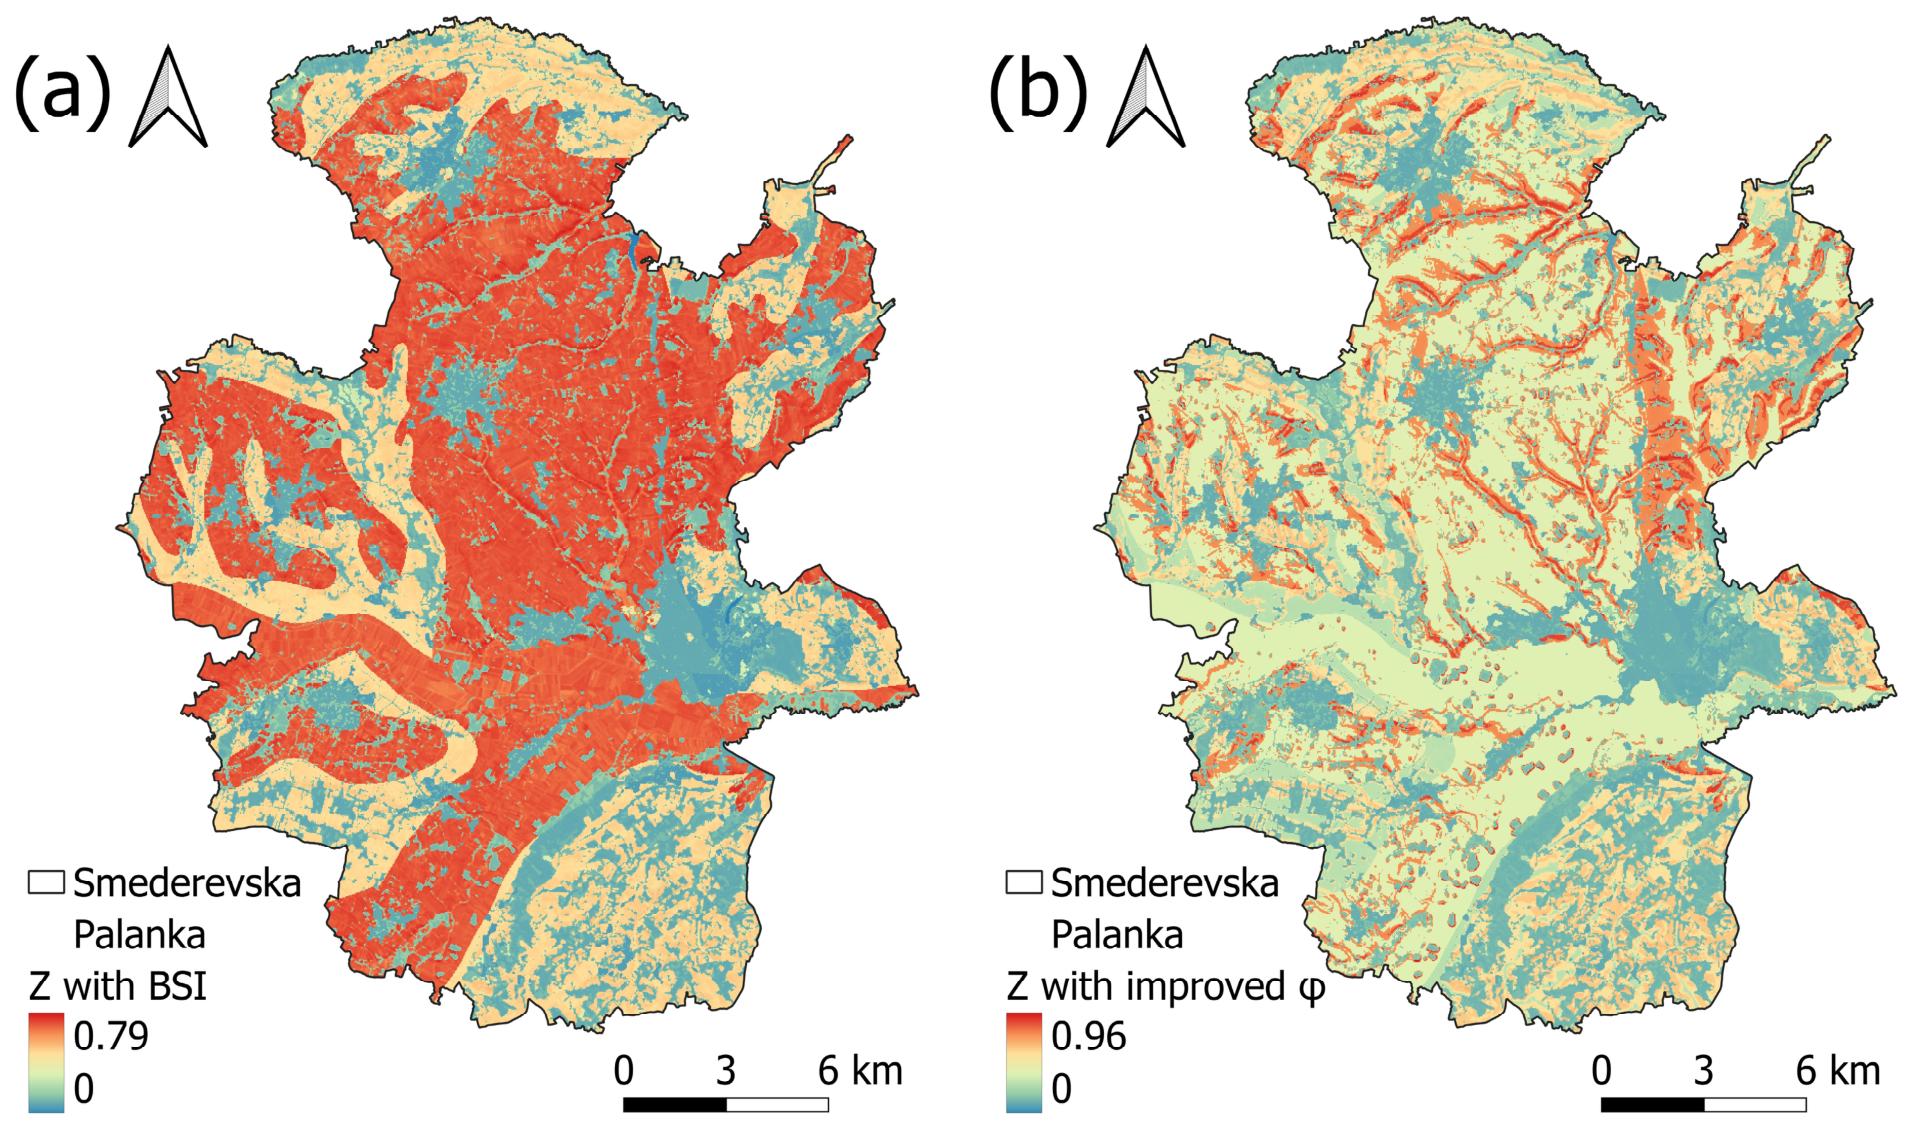
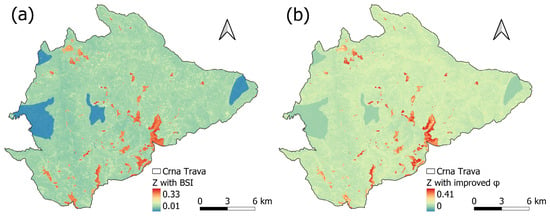
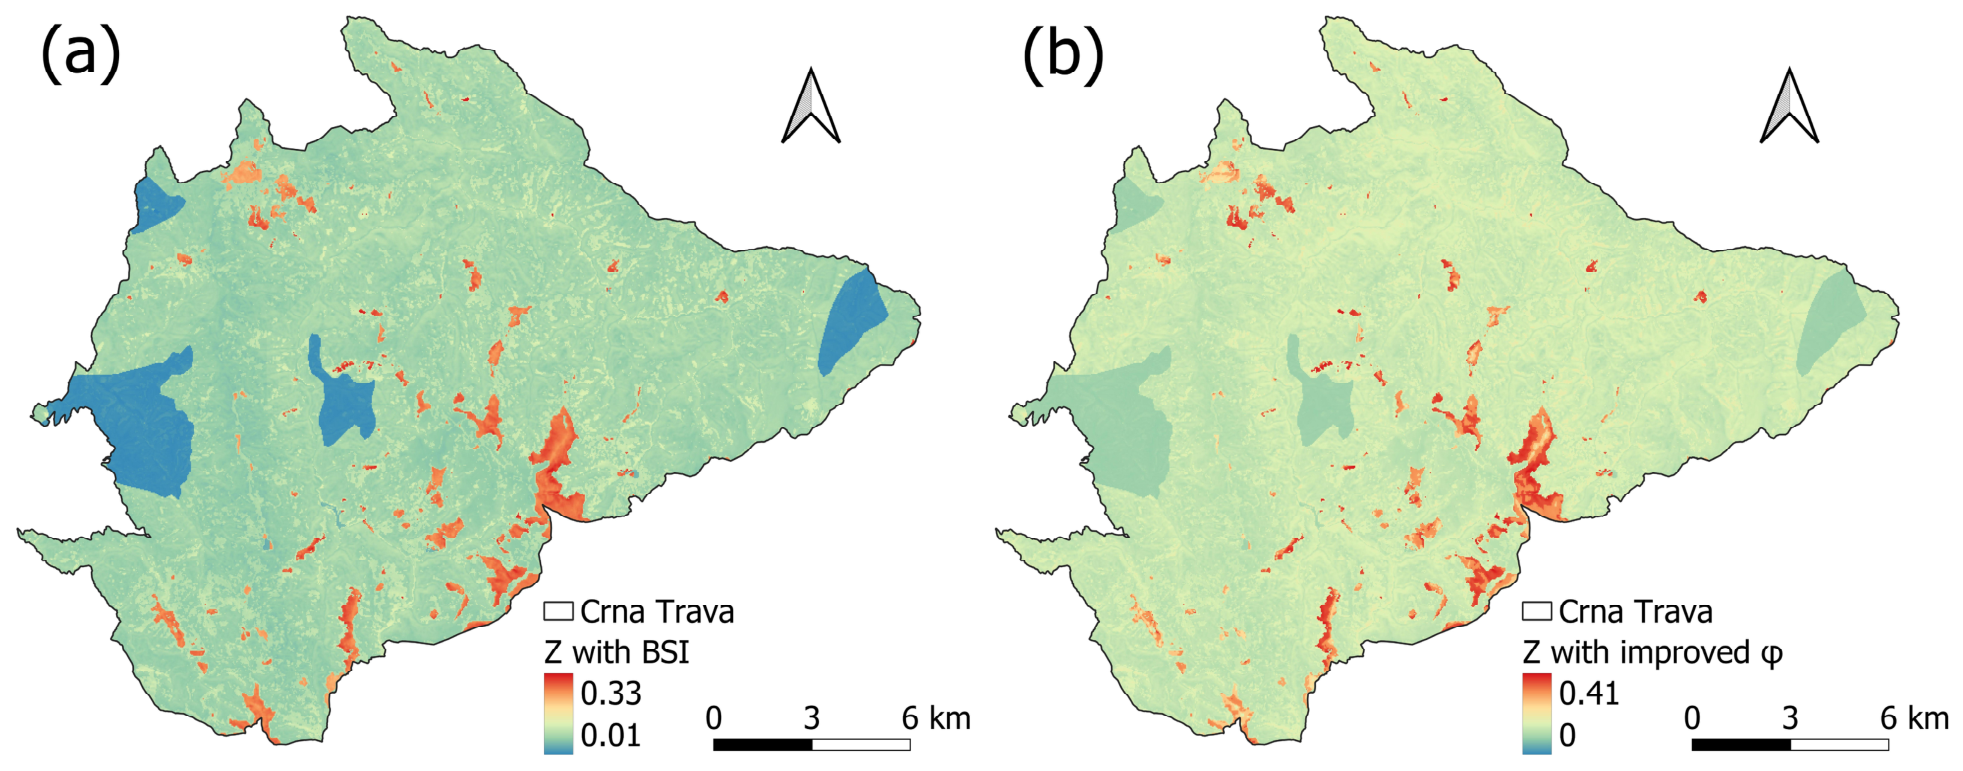
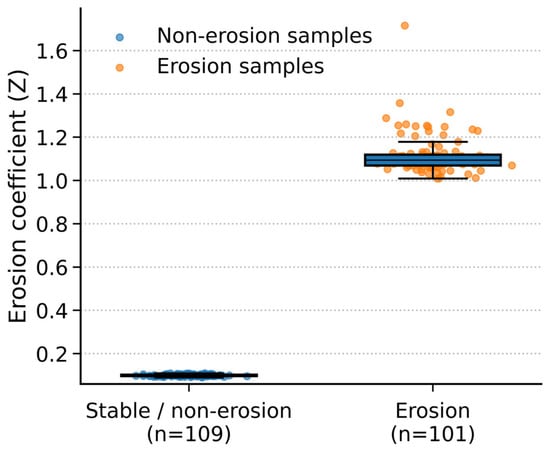
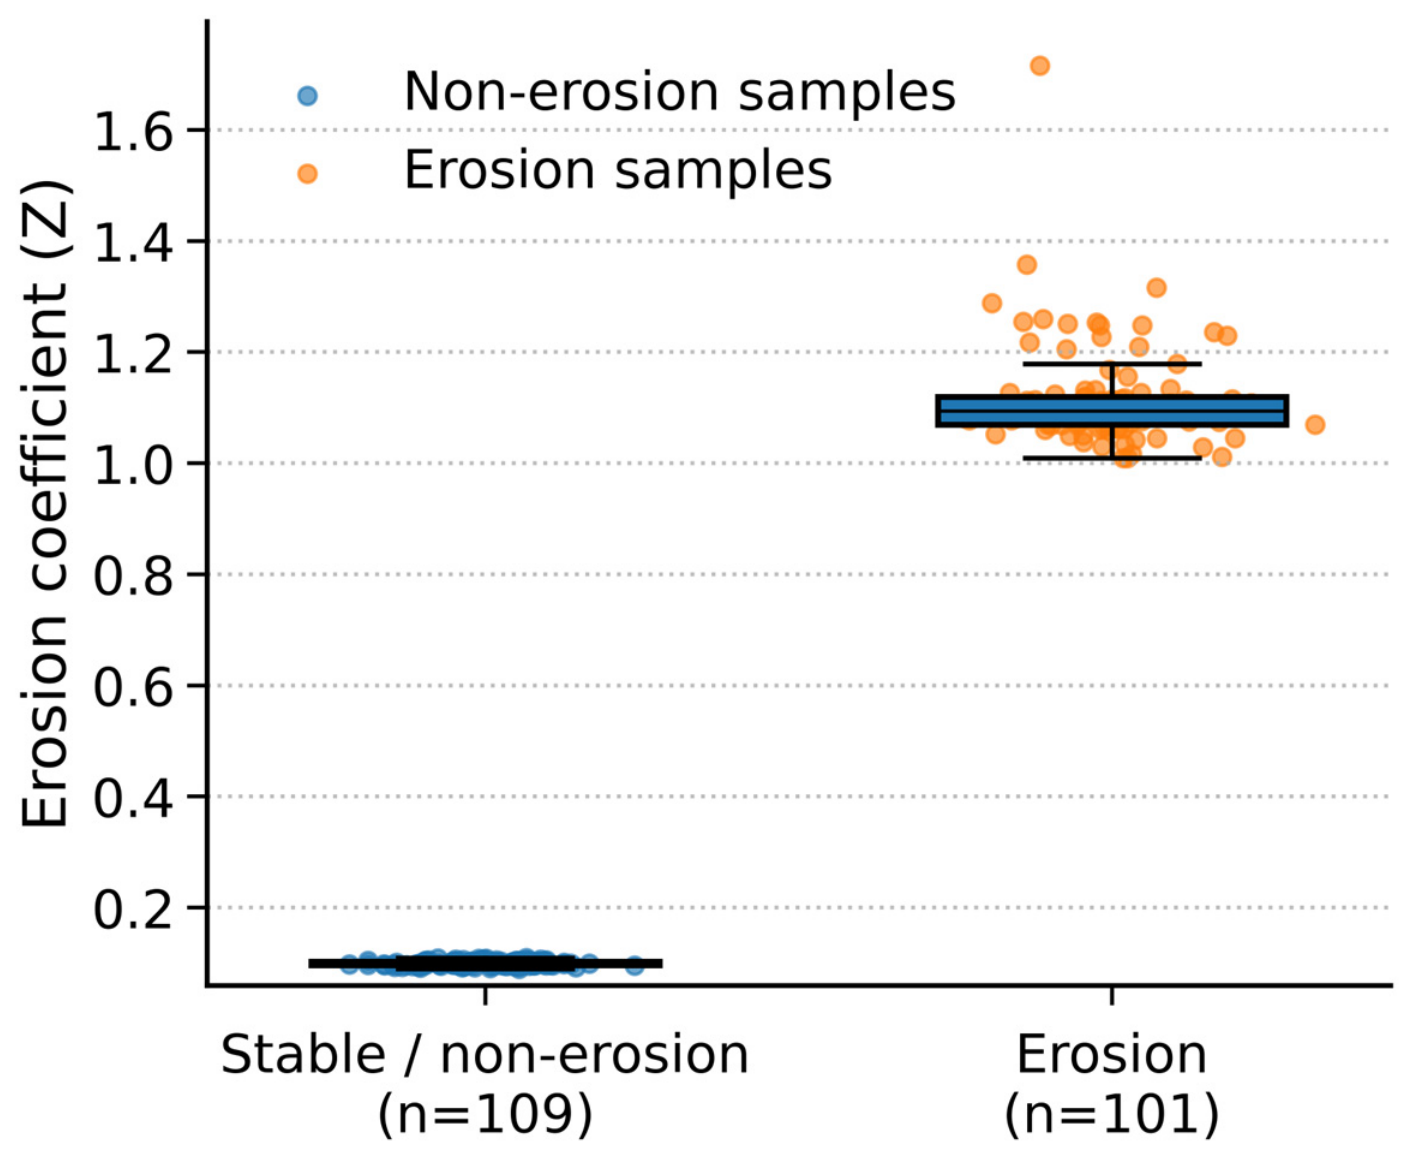
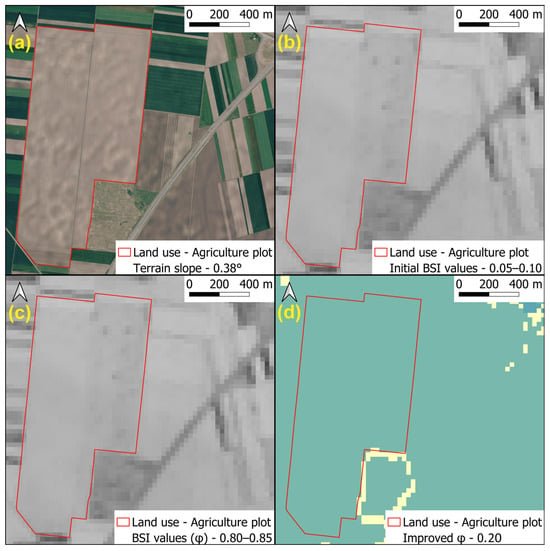
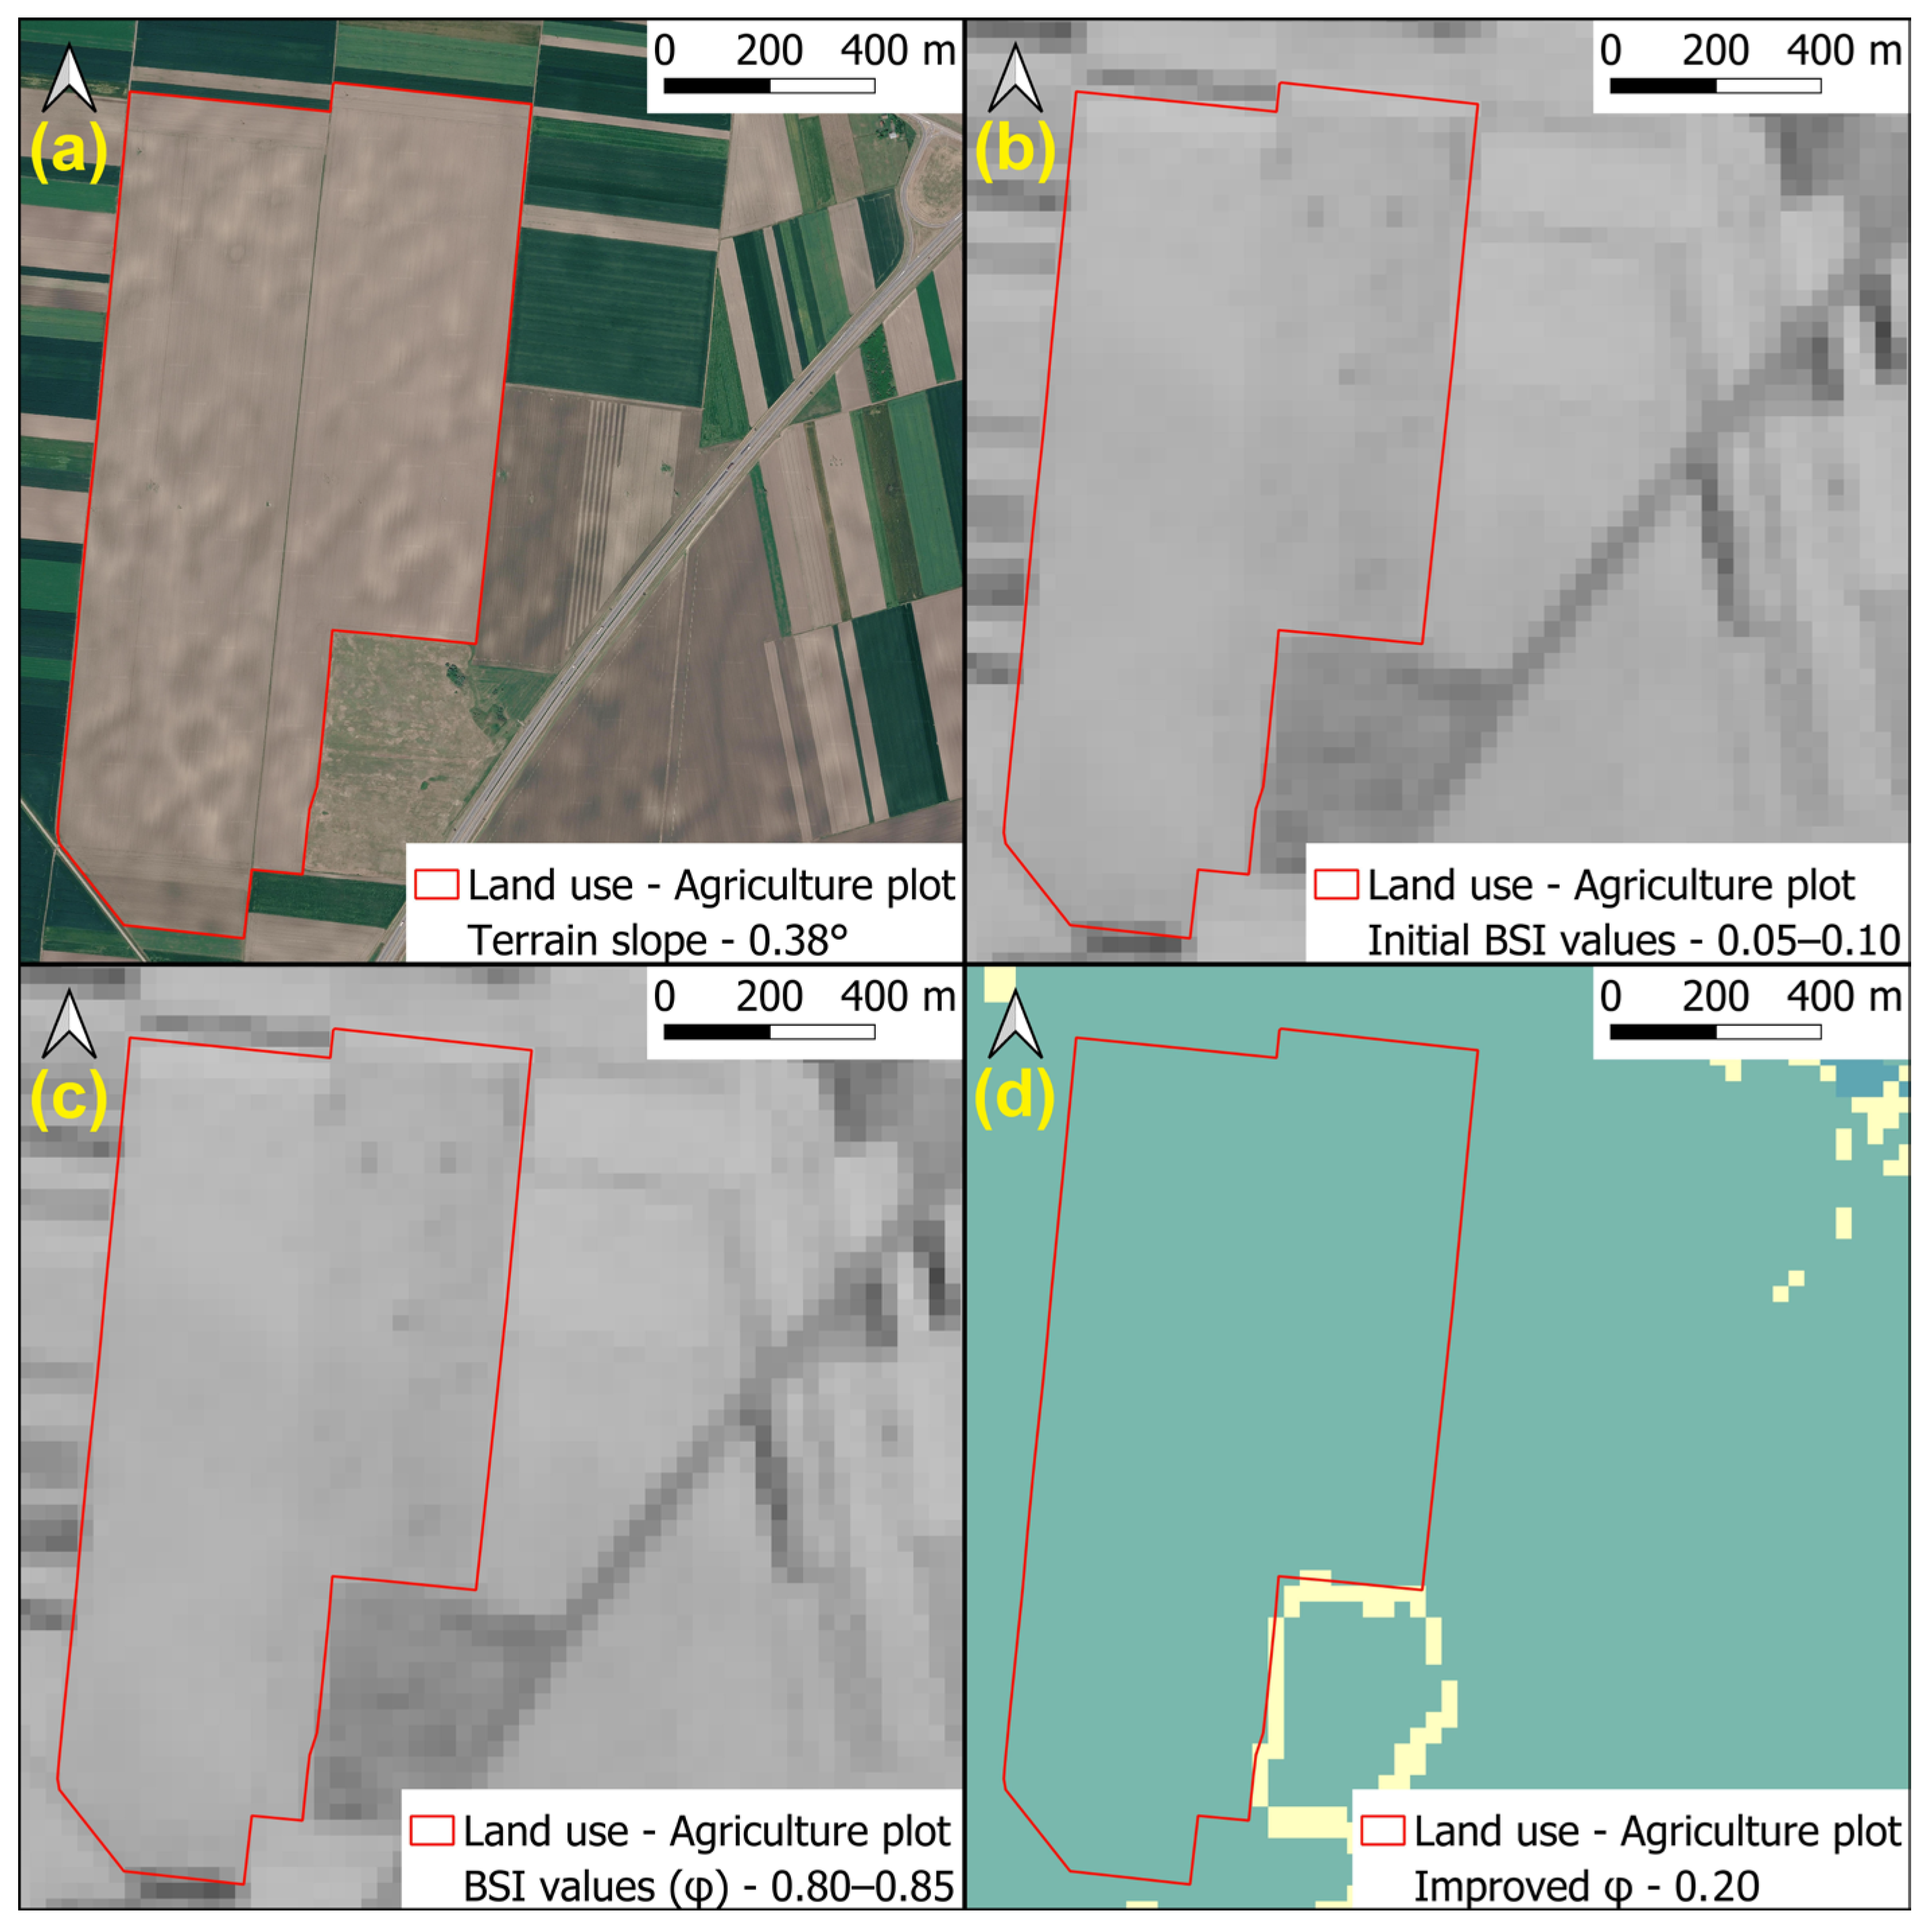
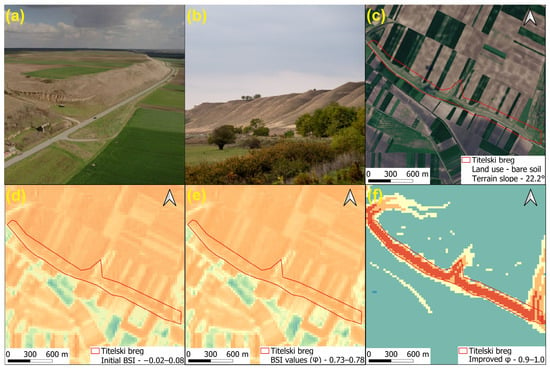
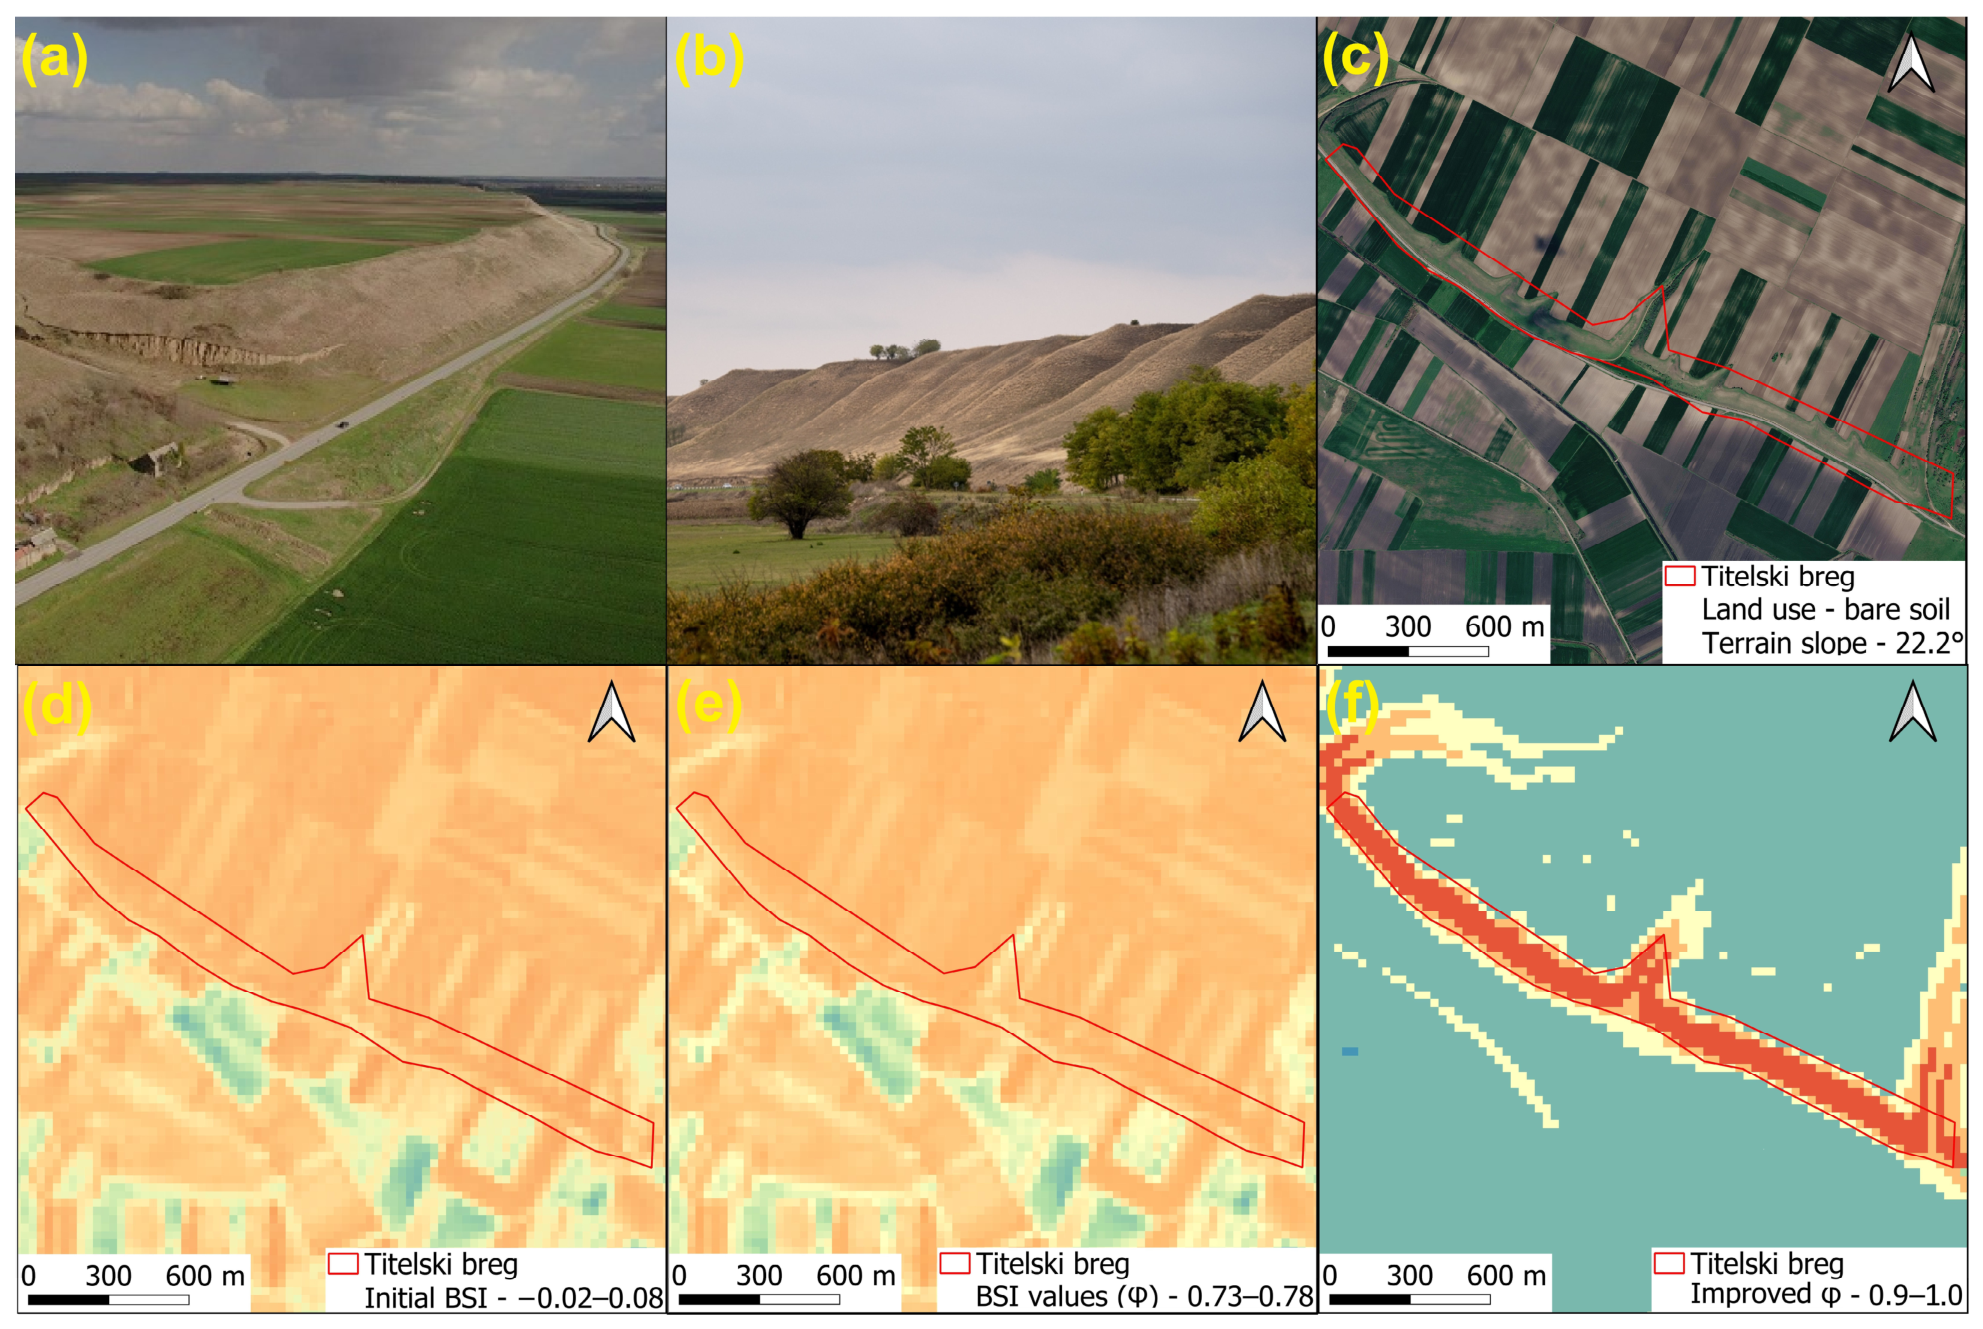
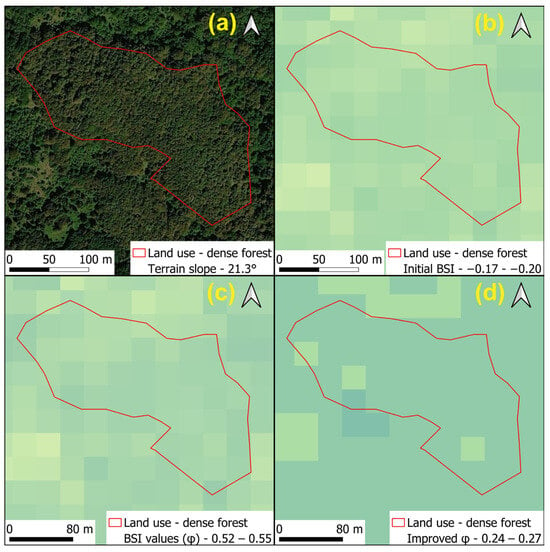
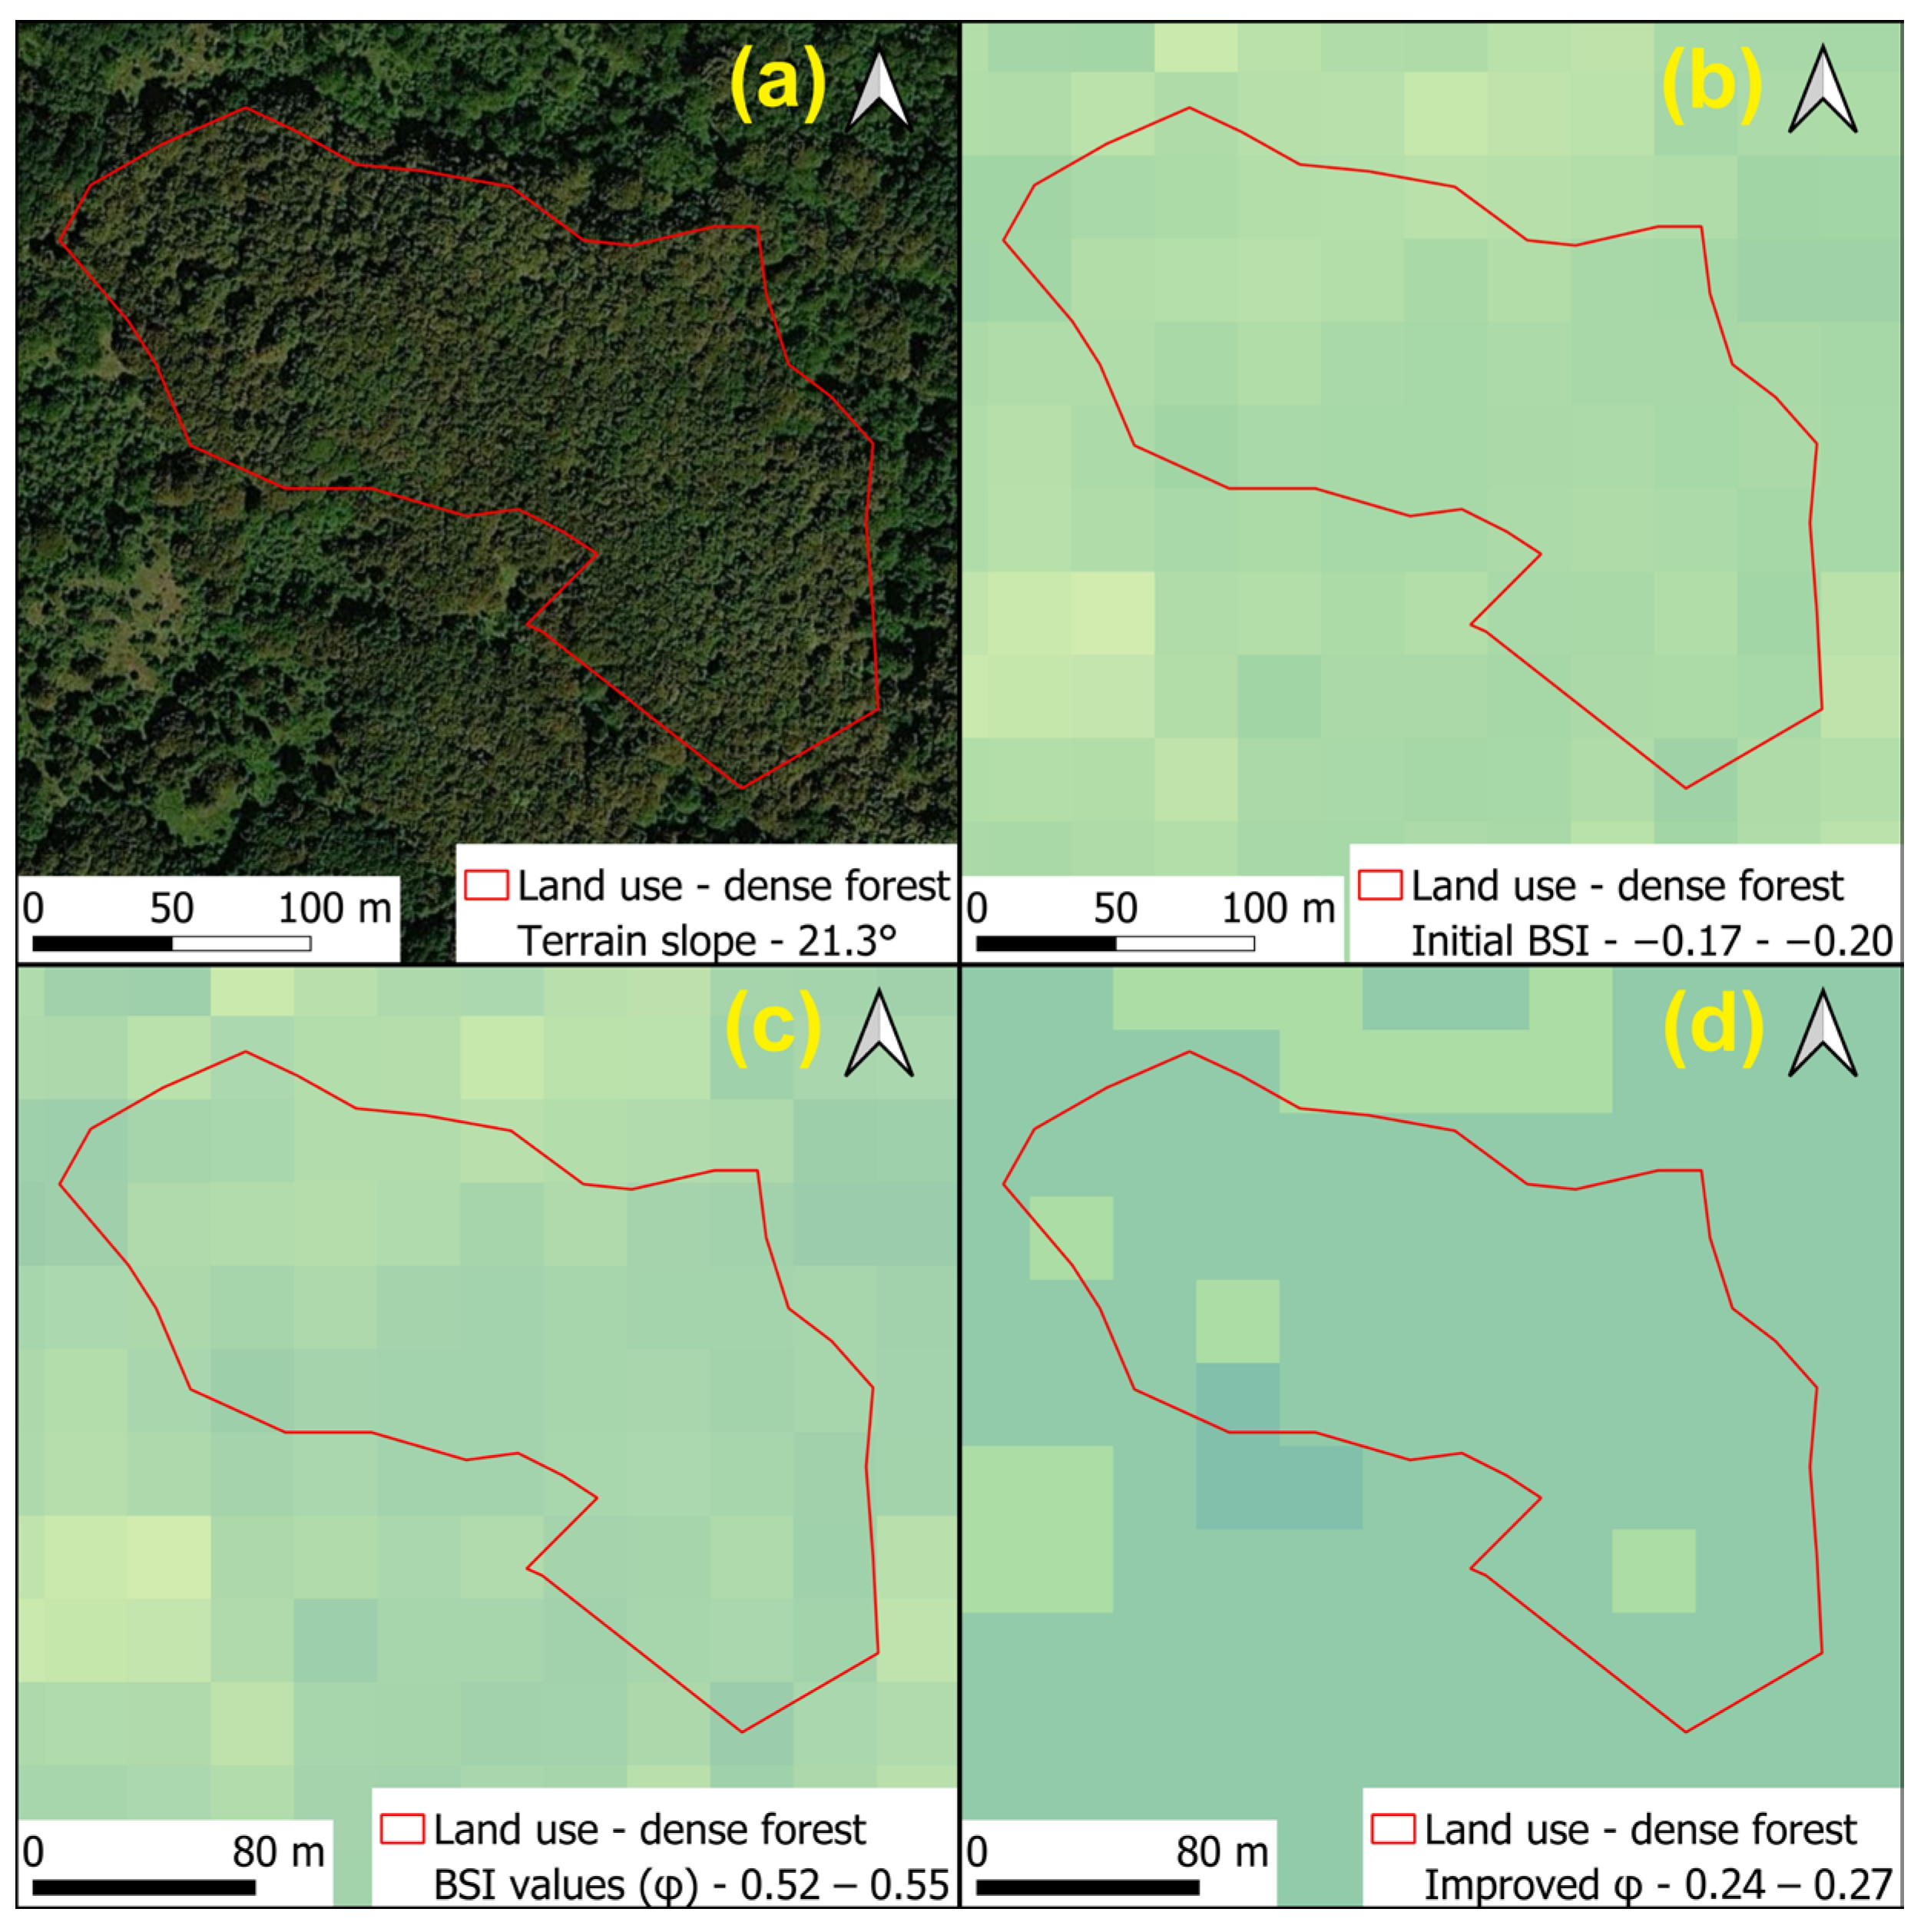

Disclaimer/Publisher’s Note: The statements, opinions and data contained in all publications are solely those of the individual author(s) and contributor(s) and not of MDPI and/or the editor(s). MDPI and/or the editor(s) disclaim responsibility for any injury to people or property resulting from any ideas, methods, instructions or products referred to in the content. |
© 2026 by the authors. Licensee MDPI, Basel, Switzerland. This article is an open access article distributed under the terms and conditions of the Creative Commons Attribution (CC BY) license.