


Abstract
Urban districts along major rivers are undergoing rapid transformation, yet long-term evidence on how redevelopment reshapes land cover and vegetation structure remains limited in post-socialist cities. This study examines the spatio-temporal evolution of land use and land cover (LULC) and vegetation dynamics along the Sava River corridor in Belgrade from 1990 to 2024. CORINE Land Cover (CLC) datasets were combined with Landsat-derived NDVI and MSAVI time series, while high-resolution Esri Wayback imagery was used for visual interpretation and qualitative corroboration of the detected land-cover and vegetation patterns. Beyond conventional NDVI/LULC assessments, the study integrates multi-decadal spectral trends with functional vegetation structure classification to evaluate canopy continuity and ecological configuration under contrasting redevelopment models. Results reveal a pronounced divergence between the two riverbanks. The left bank (New Belgrade) maintains stable land-cover composition and consistently higher NDVI and MSAVI values, indicating preserved green infrastructure and sustained canopy continuity. In contrast, the right bank (Belgrade Waterfront) experienced substantial land-cover conversion after 2006, with a statistically significant decline in vegetation greenness (NDVI −0.020 dec−1, p < 0.001) and a marked increase in impervious surfaces. MSAVI-based functional classes indicate a shift from mixed low vegetation to predominantly sealed land, while tree canopy remained persistently low throughout redevelopment. The findings demonstrate measurable ecological simplification and canopy loss, even where nominal green areas remain present. By providing a rare multi-decadal, spatially explicit comparison of two contrasting planning paradigms within the same river corridor, the study contributes new empirical evidence on how governance and redevelopment models shape riparian ecological trajectories and sustainable urbanism in post-socialist cities. Strengthening blue-green infrastructure and restoring native riparian vegetation are essential for enhancing climate resilience and ensuring long-term riverfront sustainability.
1. Introduction
Urban transformations, particularly along riverfronts, are intensifying in cities worldwide, reflecting the combined pressures of economic expansion and environmental uncertainty. In both post-industrial and post-socialist contexts, rivers have evolved from working infrastructures into contested urban frontiers, symbolically rich and strategically significant zones frequently targeted for high-profile redevelopment. While such transformations often promise economic revitalization and spatial renewal, they also may raise concerns regarding ecological degradation, restricted public access, and growing socio-spatial inequalities [1,2,3,4].
In response to this, the concept of sustainable urbanism has emerged as a critical planning framework. It promotes the integration of ecological sustainability, social equity, and economic resilience into urban development strategies. Central to this paradigm is the understanding that cities function most effectively when ecological, social, and economic systems are co-developed in a mutually reinforcing manner. Rather than treating environmental elements as residual or decorative spaces, sustainable urbanism positions green infrastructure, such as parks, urban forests, riverbanks, and green corridors, as structural components of urban form, essential for delivering ecosystem services including air purification, temperature regulation, biodiversity support and psychological well-being [5,6].
Within this framework, blue-green infrastructure (BGI) has gained prominence as a key strategy for enhancing urban climate adaptation, ecological performance, and public health. BGI systems, including rivers, floodplains, parks, and vegetated corridors, are increasingly recognized as critical to urban resilience, particularly in climate-sensitive areas such as riverfronts [7,8,9]. Riverfront zones hold strategic importance because they connect aquatic and terrestrial ecosystems while simultaneously functioning as ecological corridors and public social spaces [10]. However, their transformation often exposes inherent tensions between real estate development, environmental protection, and the public interest [11].
Vegetation along urban riverbanks typically consists of multi-layered plant communities composed of canopy trees, understory shrubs, and herbaceous species, each contributing distinct ecological functions [12]. In dense urban environments, spatial constraints, altered microclimates, and limited light exposure frequently lead to simplified vegetation structures and diminished ecological performance [13,14]. Research consistently demonstrates that structurally complex, multi-layered vegetation systems provide the highest benefits in terms of biodiversity support, microclimate regulation, erosion control, and water quality protection [15,16,17]. Even where full structural layering is not feasible, substitute plantings can still offer partial ecological and social benefits. Consequently, strategic landscaping of river corridors can serve both ecological enhancement and social inclusion, reinforcing riverbanks as shared urban commons within sustainable urban development frameworks [18,19].
In this study, the term “redevelopment models” refers to two contrasting urban development approaches observed along the Sava riverfront. Riverfront redevelopment embodies both the opportunities and contradictions of sustainable urbanism. On one hand, it can enable ecological restoration, improved public space, and efficient land use. On the other, poorly regulated redevelopment may result in fragmented green systems, simplified vegetation, increased impervious surfaces, and weakened climate resilience [20,21,22,23]. These tensions are particularly evident in post-socialist cities, where the transition from centralized planning to market-led development has often outpaced the establishment of integrated environmental governance mechanisms [24].
The term “multi-decadal” refers to the continuous analysis of vegetation dynamics over an extended period (1996–2024), capturing long-term structural changes associated with urban redevelopment. Such long-term, spatially explicit assessments remain relatively uncommon in riverfront studies, which often focus on shorter observation periods or single redevelopment phases. The extended temporal coverage used here allows the identification of gradual vegetation trends and structural shifts that may not be detectable in short-term analyses.
Recent European riverfront studies have increasingly examined the ecological and spatial consequences of waterfront regeneration, especially in post-industrial cities where restoration, public accessibility, and BGI integration are central objectives [25,26,27]. In post-socialist contexts, however, research remains more fragmented, frequently focusing on governance dynamics, real estate development, and socio-political implications of large-scale projects. Comparatively fewer studies provide long-term, spatially explicit assessments of ecological transformation using consistent remote sensing methodologies. This gap is particularly relevant given that vegetation change often serves as a measurable indicator of broader spatial restructuring processes.
Remote sensing approaches, including vegetation indices such as NDVI and MSAVI, provide valuable tools for monitoring changes in vegetation continuity, density, and structural integrity across time [28,29,30]. When integrated with standardized land-cover datasets such as CORINE, these methods allow for multi-decadal assessment of land-use transitions and vegetation dynamics.
In Belgrade, Serbia’s capital at the confluence of the Sava and Danube Rivers, these broader European and post-socialist dynamics are clearly visible. During the socialist period, the Sava riverfront was characterized by multifunctional land use integrating ecological corridors, public open spaces, and flood management systems [31]. Following political transition in the 2000s, large-scale developments such as the Belgrade Waterfront project redefined the urban riverfront, often privileging economic visibility over ecological continuity and public accessibility [32,33,34,35]. While such projects symbolize modernization, they have also attracted criticism regarding privatization of public space and limited citizen participation in decision-making processes [36,37].
At the national level, CORINE Land Cover (CLC) data have been widely applied to track anthropogenic land transformations across Serbia, including urban expansion, deforestation, and agricultural shifts between 1990 and 2018 [36]. However, these datasets often lack the spatial resolution necessary to capture fine-scale riverfront transformations, particularly after 2018, a period marked by intensified construction activity in Belgrade’s central waterfront zone [37]. Moreover, there remains a shortage of high-resolution, multi-decadal studies that explicitly link vegetation change with redevelopment models and planning paradigms in post-socialist contexts.
Within this broader debate, the case of Belgrade provides a valuable opportunity to examine how contrasting redevelopment trajectories reshape riparian landscapes over time.
Accordingly, this study addresses the following research question (RQ): How do contrasting urban redevelopment trajectories along the Sava River in Belgrade from 1990 to 2024 affect land cover, vegetation structure, and the ecological integrity of riparian zones, and what do these changes reveal about the challenges and opportunities for sustainable urbanism in post-socialist cities?
The research objectives are therefore to (1) quantify long-term LULC changes along both riverbanks, (2) analyze vegetation dynamics and structural shifts using NDVI and MSAVI time series, and (3) interpret these changes within the framework of sustainable urbanism and climate resilience in a post-socialist context.
To evaluate multi-decadal landscape transformation and position the Belgrade case within comparable European research, CORINE LULC data (1990–2018) were combined with Landsat-derived NDVI and MSAVI time series (1996–2024) [38], and visually validated using high-resolution Esri Wayback imagery (2014–2024) [39]. This multisource approach captures both structural land-cover transitions and changes in vegetation greenness and density. By analyzing NDVI and MSAVI data alongside LULC classifications, the study enables a consistent interpretation of vegetation extent and density changes, distinguishing well-vegetated areas from those affected by ongoing construction activity or soil exposure. In this way, remote sensing evidence serves as a spatially grounded tool for interpreting long-term redevelopment processes and situating Belgrade within the wider European discourse on sustainable riverfront transformation.
Despite growing interest in urban waterfront redevelopment, long-term empirical evidence on how large-scale redevelopment projects reshape vegetation structure and ecological functions remains limited, particularly in post-socialist cities undergoing rapid spatial transformation. Most existing studies focus either on short-term land-cover changes or on planning and governance aspects, rarely integrating multi-decadal remote sensing analysis with an urban planning perspective. As a result, the ecological consequences of contrasting redevelopment approaches along urban riverfronts remain insufficiently understood. This study addresses this gap by providing a multi-decadal analysis of vegetation dynamics along the Sava River corridor in Belgrade, comparing two contrasting riverbank development contexts and linking observed vegetation changes with broader urban transformation processes.
Unlike previous studies that typically examine redevelopment cases separately, this research compares two contrasting planning approaches within the same metropolitan river corridor, thereby minimizing climatic and geographic variability. This design allows a more direct attribution of observed vegetation changes to planning paradigms and redevelopment intensity, providing a differentiated contribution beyond existing post-socialist riverfront studies.
2. Literature Review
Urban rivers have historically functioned as multifunctional spaces linking hydrological processes, biodiversity, cultural identity and economic activity [34]. Since the industrial era, many river corridors have been ecologically altered through canalization, land reclamation, and physical enclosure, resulting in the degradation of natural floodplains and riparian habitats. In response, contemporary planning discourse has increasingly emphasized river restoration, daylighting and ecological regeneration, particularly in Asia, Europe and North America, where riverfronts have become experimental grounds for green infrastructure integration and public realm enhancement [40,41]. These initiatives frame river corridors not merely as redevelopment zones, but as strategic ecological and social assets within urban systems.
Within the broader field of sustainable urbanism, conceptual models such as compact cities, biophilic urbanism, and low-carbon urban design have contributed to integrating built environments with natural systems [42,43]. In this evolving paradigm, blue-green infrastructure (BGI) is understood as a strategic and interconnected network of water bodies, vegetation, and open spaces that simultaneously deliver ecological and social functions [44,45]. BGI is particularly relevant in riverfront contexts, where ecological sensitivity and exposure to climate-related risks, including flooding and urban heat stress, are pronounced. Empirical research demonstrates that well-integrated blue-green systems enhance environmental performance, improve microclimatic regulation, and strengthen social cohesion by ensuring equitable access to public open space [46,47,48].
In post-socialist settings, however, riverfront redevelopment has often diverged from these integrative principles. Case studies from Detroit (Michigan) and Porto (Portugal) illustrate how redevelopment processes may replace multifunctional green landscapes with high-density, impermeable surfaces and ornamental vegetation, reflecting tensions between redevelopment ambitions and ecological needs [15,16]. The Belgrade Waterfront development similarly exemplifies this trajectory, as its rapid implementation and prioritization of real estate value have been associated with significant alteration of the riverfront’s natural structure and ecological continuity [27,29,31,34,35,36].
Urban waterfront transformations have long been recognized as key moments of socio-spatial restructuring in cities. Historically, many riverfront areas shifted from industrial and transport functions toward mixed-use urban districts during the late twentieth and early twenty-first centuries [49,50]. While such redevelopment processes often aim to stimulate economic growth and improve urban image, they frequently generate tensions between ecological sustainability, spatial justice, and real-estate-driven planning priorities. Recent studies highlight how large-scale waterfront projects may reduce ecological complexity, replace multifunctional green landscapes with ornamental vegetation, and alter the accessibility and social function of riverfront public spaces. These dynamics are particularly visible in post-socialist cities, where rapid redevelopment has often occurred within evolving institutional and planning frameworks [51].
Methodologically, remote sensing techniques have become central to assessing landscape transformation, particularly in rapidly urbanizing and data-constrained environments [8,9]. Vegetation indices such as NDVI and MSAVI provide consistent and scalable measures of vegetation greenness, with density and structural variation across temporal and spatial scales. NDVI is widely employed to detect general vegetation health and cover, whereas MSAVI, through its soil-adjusted formulation, is better suited to environments characterized by sparse or heterogeneous vegetation, such as redeveloping urban waterfronts [14,52]. These indices have been successfully applied to evaluate changes in urban canopy cover, green infrastructure distribution, and the ecological impacts of redevelopment [53]. When combined with land-cover classification systems such as CORINE, they enable comprehensive assessments of both structural and functional ecological change in complex urban landscapes.
Despite the widespread application of these methods, their use in post-socialist urban waterfront contexts remains limited. National-level CORINE-based analyses have documented broader urbanization trends in Serbia, yet fine-scale, longitudinal assessments of high-impact redevelopment zones such as the Sava riverfront, particularly after 2018 are scarce [28]. Moreover, much of the existing literature does not explicitly situate remote sensing findings within planning frameworks or evaluate how observed vegetation changes correspond to shifts in spatial structure, public accessibility or ecological functionality [54,55]. This gap underscores the need for integrative, multi-decadal analyses that link quantitative vegetation dynamics with broader urban transformation processes.
While previous studies have examined riverfront redevelopment processes in post-socialist cities or market-driven urban regeneration contexts separately, comparative analyses that explicitly link long-term ecological change with contrasting planning approaches within the same metropolitan corridor remain limited. Most existing research focuses either on institutional dynamics, governance structures, or short-term land-use change, without providing spatially explicit evidence of how different redevelopment strategies influence vegetation structure over extended time periods. By combining multi-decadal remote sensing analysis with a comparative urban planning perspective, this study contributes new empirical insight into how contrasting redevelopment approaches shape the ecological trajectories of urban riverfront landscapes.
3. Materials and Methods
3.1. Study Area
Study area (Figure 1 and Figure 2) presents the spatial extent covering two polygons along the Sava River in central Belgrade, spanning from 44.8230° N, 20.4230° E to 44.8005° N, 20.4785° E and encompassing both riverbanks over an estimated area of approximately 4.5 km2. The polygons were delineated manually in a GIS environment (QGIS 3.x) using a reproducible protocol based on riverbank alignment, comparable longitudinal extent, and consistent buffer distance from the river corridor.
Figure 1.
Belgrade riverbank study area.
Figure 2.
Location of study area along the Sava River in Belgrade, showing left (New Belgrade—yellow) and right (Savski Venac/Belgrade Waterfront—pink) sides from 2014 and 2024 captured by the Esri (Redlands, CA, USA) Living Atlas of the World (https://livingatlas.arcgis.com/wayback/ accessed on 17 October 2025).
The left polygon, located within New Belgrade, represents a zone with extensive green open spaces and tree-lined areas. In contrast, the right polygon, situated on the Savski Venac side covering Belgrade Waterfront, is characterized by a denser urban structure and limited green coverage (Figure 2).
To ensure reproducibility and comparability, both polygons were defined following four criteria:
- (1)
- Riverbank alignment: each polygon follows the physical riverbank and extends inland to include the first continuous urban block adjacent to the Sava River.
- (2)
- Comparable longitudinal extent: both polygons cover the same river segment between Branko’s Bridge and the Ada Bridge, ensuring identical riverfront length on both sides.
- (3)
- Comparable spatial scale: polygon extents were adjusted so that both sides include similar landscape components (urban fabric, open green areas, transport infrastructure), allowing cross-bank comparison of vegetation dynamics.
- (4)
- Exclusion of river-water pixels: open-water pixels belonging to the Sava River were excluded from NDVI/MSAVI calculations to avoid spectral contamination from water reflectance. Only terrestrial pixels within the polygon boundaries were retained for vegetation analysis.
The resulting polygons therefore represent two comparable urban riverfront landscapes reflecting different redevelopment trajectories rather than strictly identical land-use compositions.
When analyzing natural and potential vegetation, it should be noted that the entire territory of Belgrade belongs to the Quercetum farnetto-cerris community, while areas near the rivers are characterized by Carpino-Quercetum roboris vegetation [56]. Therefore, the analyzed area on both sides of the Sava River, in the absence of human intervention, would naturally be covered by an oak–hornbeam forest association. Additionally, species from this association are likely the best adapted to the local environment and would therefore require minimal maintenance for providing diverse ecosystem services [57]. The New Belgrade side still preserves fragments of the area’s natural vegetation, including pedunculate oak and other hydrophilic species. In contrast, the right bank of the river features newly developed green areas, primarily composed of lawns, isolated trees, and parterres. On this side, small forested areas, bosquets, and other natural vegetation features are largely absent, in contrast to the New Belgrade side. This lack of vegetative complexity may negatively influence the green- blue infrastructure balance and its associated ecological functions, especially in terms of anticipated climate change [47].
3.2. Data Sources
The overall data integration and analytical workflow applied in this study is summarized in Figure 3. The framework illustrates how multi-source datasets (CORINE Land Cover, Landsat-derived NDVI/MSAVI, and Wayback imagery) are processed and integrated within a comparative design to assess structural and functional changes along the two riverbanks. Subsequent subsections describe each dataset and analytical component in detail.
Figure 3.
Integrated methodological workflow of the study, showing the multi-source data inputs (CORINE LULC, Landsat NDVI/MSAVI, Wayback imagery), processing steps, and comparative cross-bank analysis.
3.2.1. CORINE Land Cover (1990–2018)
CORINE Land Cover (CLC) data, a product of Copernicus Land Monitoring Service [58], was used to establish a wider land-use context of the study area over the period 1990–2018, providing a harmonized multi-decadal overview of major land-cover categories. Although the 100 m spatial resolution does not capture fine scale urban heterogeneity, CLC offers one of the few long-term and methodologically consistent LULC datasets available for European cities [59], making it suitable for identifying structural transitions relevant to urban-ecological interpretation. CORINE Level-3 classes (five Level-1 groups, 44 Level-3 classes) were aggregated and interpreted following Copernicus technical guidelines for the official reporting years 1990, 2000, 2006, 2012, and 2018. For similar animated illustrations, see Firanj Sremac [60]. CORINE Land Cover is available only for discrete reporting years (1990, 2000, 2006, 2012, 2018). To provide a continuous temporal framework for comparison with the annual Landsat NDVI/MSAVI time series (1996–2024), each CORINE layer was extended to intermediate years using a step-wise carry-forward approach, whereby the most recent available CLC classification was assumed to remain valid until the next official reporting year. This procedure does not generate new land-cover information but preserves the structural land-cover context associated with each official CLC dataset.
This approach is commonly used in multi-source remote sensing studies where temporally sparse land-cover inventories are integrated with higher-frequency satellite observations. The carry-forward procedure therefore serves only to maintain temporal alignment between structural land-cover classes (CLC) and annual spectral indicators (NDVI/MSAVI), allowing vegetation trends to be interpreted within a consistent land-cover framework.
An important limitation concerns the 2018–2024 interval, for which no updated CORINE layer is currently available. During this period, the 2018 CLC classification was retained as the structural land-cover reference. Consequently, any land-cover changes occurring after 2018 are not reflected in the categorical CLC dataset and are instead captured through Landsat-derived vegetation indices and visual interpretation of high-resolution Wayback imagery. The post-2018 interpretation should therefore be understood primarily as reflecting spectral vegetation dynamics rather than formally updated CORINE land-cover transitions.
For class-based vegetation analysis, CLC categories were used as zonal aggregation units. Spectral index (NDVI/MSAVI) values were extracted for all Landsat pixels located within the spatial extent of each Level-3 class, and annual class-based mean values were calculated. No spatial resampling of CLC data was performed; aggregation was conducted on the native Landsat grid within CLC-defined zones. This approach allows examination of vegetation dynamics across documented structural land-cover types while avoiding direct pixel-level cross-resolution comparison.
Within central Belgrade, the CLC maps (1990–2018) indicate dominance of urban fabric (2, 3, 4, 9), green urban areas (10), and water bodies (40) (Figure 4). While both riverbanks are predominantly urban, clear spatial differences are evident: the right bank is characterized by a more compact and construction-driven pattern, particularly after 2006, whereas the left bank displays a more heterogeneous mosaic in which built structures are interwoven with larger and more continuous green urban areas. Despite the coarse 100 m resolution, the CLC series reveals divergent structural trajectories between the two sides of the Sava River.
Figure 4.
CORINE Land Cover (CLC) map of central Belgrade showing dominant land-cover classes within the study area (2—Discontinuous urban fabric, 3—Industrial or commercial units, 4—Road and rail networks and associated land, 9—Construction sites, 10—Green urban areas, 40—Water courses (internal study codes).
Other high-resolution LULC products (e.g., Urban Atlas, ESA WorldCover, Dynamic World) were reviewed but not used due to limited temporal coverage or insufficient consistency for the multi-decadal scope of this study.
3.2.2. Vegetation Indices (NDVI and MSAVI, 1996–2024)
Vegetation dynamics were assessed using two complementary spectral indices: the Normalized Difference Vegetation Index (NDVI) and the Modified Soil-Adjusted Vegetation Index (MSAVI). These indices measure vegetation greenness and canopy density, each with distinct sensitivity to soil background effects. NDVI quantifies vegetation vigour and photosynthetic activity, but can be influenced by soil brightness and built-up surfaces in heterogeneous or urban environments. MSAVI reduces soil background without requiring an external soil factor, improving detection of low or sparse vegetation in areas with exposed soil, construction zones, or mixed land use. Using both indices enables a robust assessment of vegetation patterns across the study area, ensuring that both dense and sparse vegetation dynamics are captured accurately across the contrasting land-cover mosaics of the left (greener) and right (urbanizing) banks of the Sava River.
NDVI and MSAVI time series were obtained from Climate Engine [61], which provides vegetation indices computed from atmospherically corrected Landsat 5 TM, Landsat 7 ETM+, and Landsat 8/9 OLI Collection 2 Level-2 Surface Reflectance (SR) data available in Google Earth Engine (GEE). All images have a native spatial resolution of 30 m. Climate Engine applies standardized surface reflectance scaling (reflectance = DN × 0.0000275 − 0.2) and the CFMask (QA_PIXEL) algorithm for cloud, shadow, and snow masking [56].
Landsat Collection 2 Level-2 SR products are generated by the U.S. Geological Survey using consistent radiometric calibration and atmospheric correction procedures (LEDAPS for Landsat 5/7 and LaSRC for Landsat 8/9) within a unified processing framework. Cross-sensor reflectance continuity between Landsat sensors has been demonstrated in previous inter-calibration studies [61], supporting the use of Collection 2 SR data for multi-decadal trend analysis and ensuring inter-sensor comparability across the 1996–2024 time series. NDVI and MSAVI were calculated from the red and near-infrared (NIR) spectral bands according to:
where RED and NIR denote surface reflectance in the red and near-infrared bands (SR_B4 and SR_B5 for Landsat 8/9; SR_B3 and SR_B4 for Landsat 5/7, respectively). Annual NDVI and MSAVI values were calculated as the mean of all cloud-free Landsat observations acquired between 1 April and 30 June for each year from 1996 to 2024. This period corresponds to the peak spring growing season in Belgrade’s temperate continental climate, when tree canopies are fully developed and vegetation greenness reaches stable seasonal levels, while summer drought stress and late-season senescence effects are still limited. Selecting this phenological window minimizes short-term climatic variability and provides a consistent representation of structural vegetation conditions. Because both study polygons are located within the same metropolitan climatic zone and share similar elevation, hydrological influence from the Sava River, and seasonal vegetation dynamics, the selected temporal window is considered equally representative for both riverbanks.
To verify that the results are not sensitive to the chosen temporal aggregation period, a sensitivity check was conducted using alternative seasonal windows (April–May and May–July). The resulting NDVI and MSAVI time-series trends showed nearly identical directional patterns and comparable slope magnitudes for both riverbanks. This confirms that the long-term vegetation trends reported in the study are robust to reasonable variations in the seasonal averaging window.
Late-summer observations were excluded to reduce the influence of seasonal moisture stress and inter annual drought variability, thereby focusing the analysis on structural vegetation differences rather than short-term climatic fluctuations.
Residual cloud/shadow contamination from mixed pixels may persist near water edges or active construction zones, but these effects were minimized using CFMask filtering and seasonal averaging. Pixels corresponding to open-water surfaces of the Sava River were excluded from the analysis to prevent distortion of vegetation index values.
To explore how vegetation patterns relate to land-cover structure, annual mean NDVI and MSAVI values were summarized for dominant CORINE Level-3 classes within each polygon using a zonal statistics approach. CLC data (100 m resolution) were not resampled to Landsat resolution. Instead, Landsat 30 m pixels were spatially intersected with the vectorized CLC polygons, and all pixels whose centroids fell within a given CLC class were included in the class-level aggregation. This approach preserves the native resolution of both datasets and avoids artificial cross-resolution interpolation.
Given the differing spatial resolutions, the resulting statistics represent structural, class-level vegetation tendencies rather than parcel-scale conditions. The analysis therefore focuses on multi-decadal macro-structural patterns rather than fine-grained land-cover heterogeneity. Linear trends in NDVI and MSAVI were estimated using ordinary least squares (OLS) regression applied to the annual mean values for each riverbank. For each series we report the slope (expressed as change per decade), coefficient of determination (R2), standard error, and the p-value from the t-test on the slope coefficient. Statistical significance was assessed at α = 0.05. In addition to OLS, non-parametric Mann–Kendall tests and Sen’s slope estimators were applied to assess the robustness of monotonic trends.
To further assess potential structural shifts associated with redevelopment phases, a non-parametric Pettitt test was applied to the annual NDVI and MSAVI time series. The test identifies statistically significant change-points in the median of the series without assuming normality or linearity.
The redevelopment phases used for interpretation (1996–2013, 2014–2018, and 2019–2024) were defined independently from the statistical analysis based on documented planning milestones and visual interpretation of high-resolution Wayback imagery. The Pettitt test was subsequently applied to the NDVI and MSAVI time series as an exploratory method to detect potential structural shifts in vegetation dynamics without imposing predefined breakpoints.
3.2.3. Functional Vegetation Types Based on MSAVI
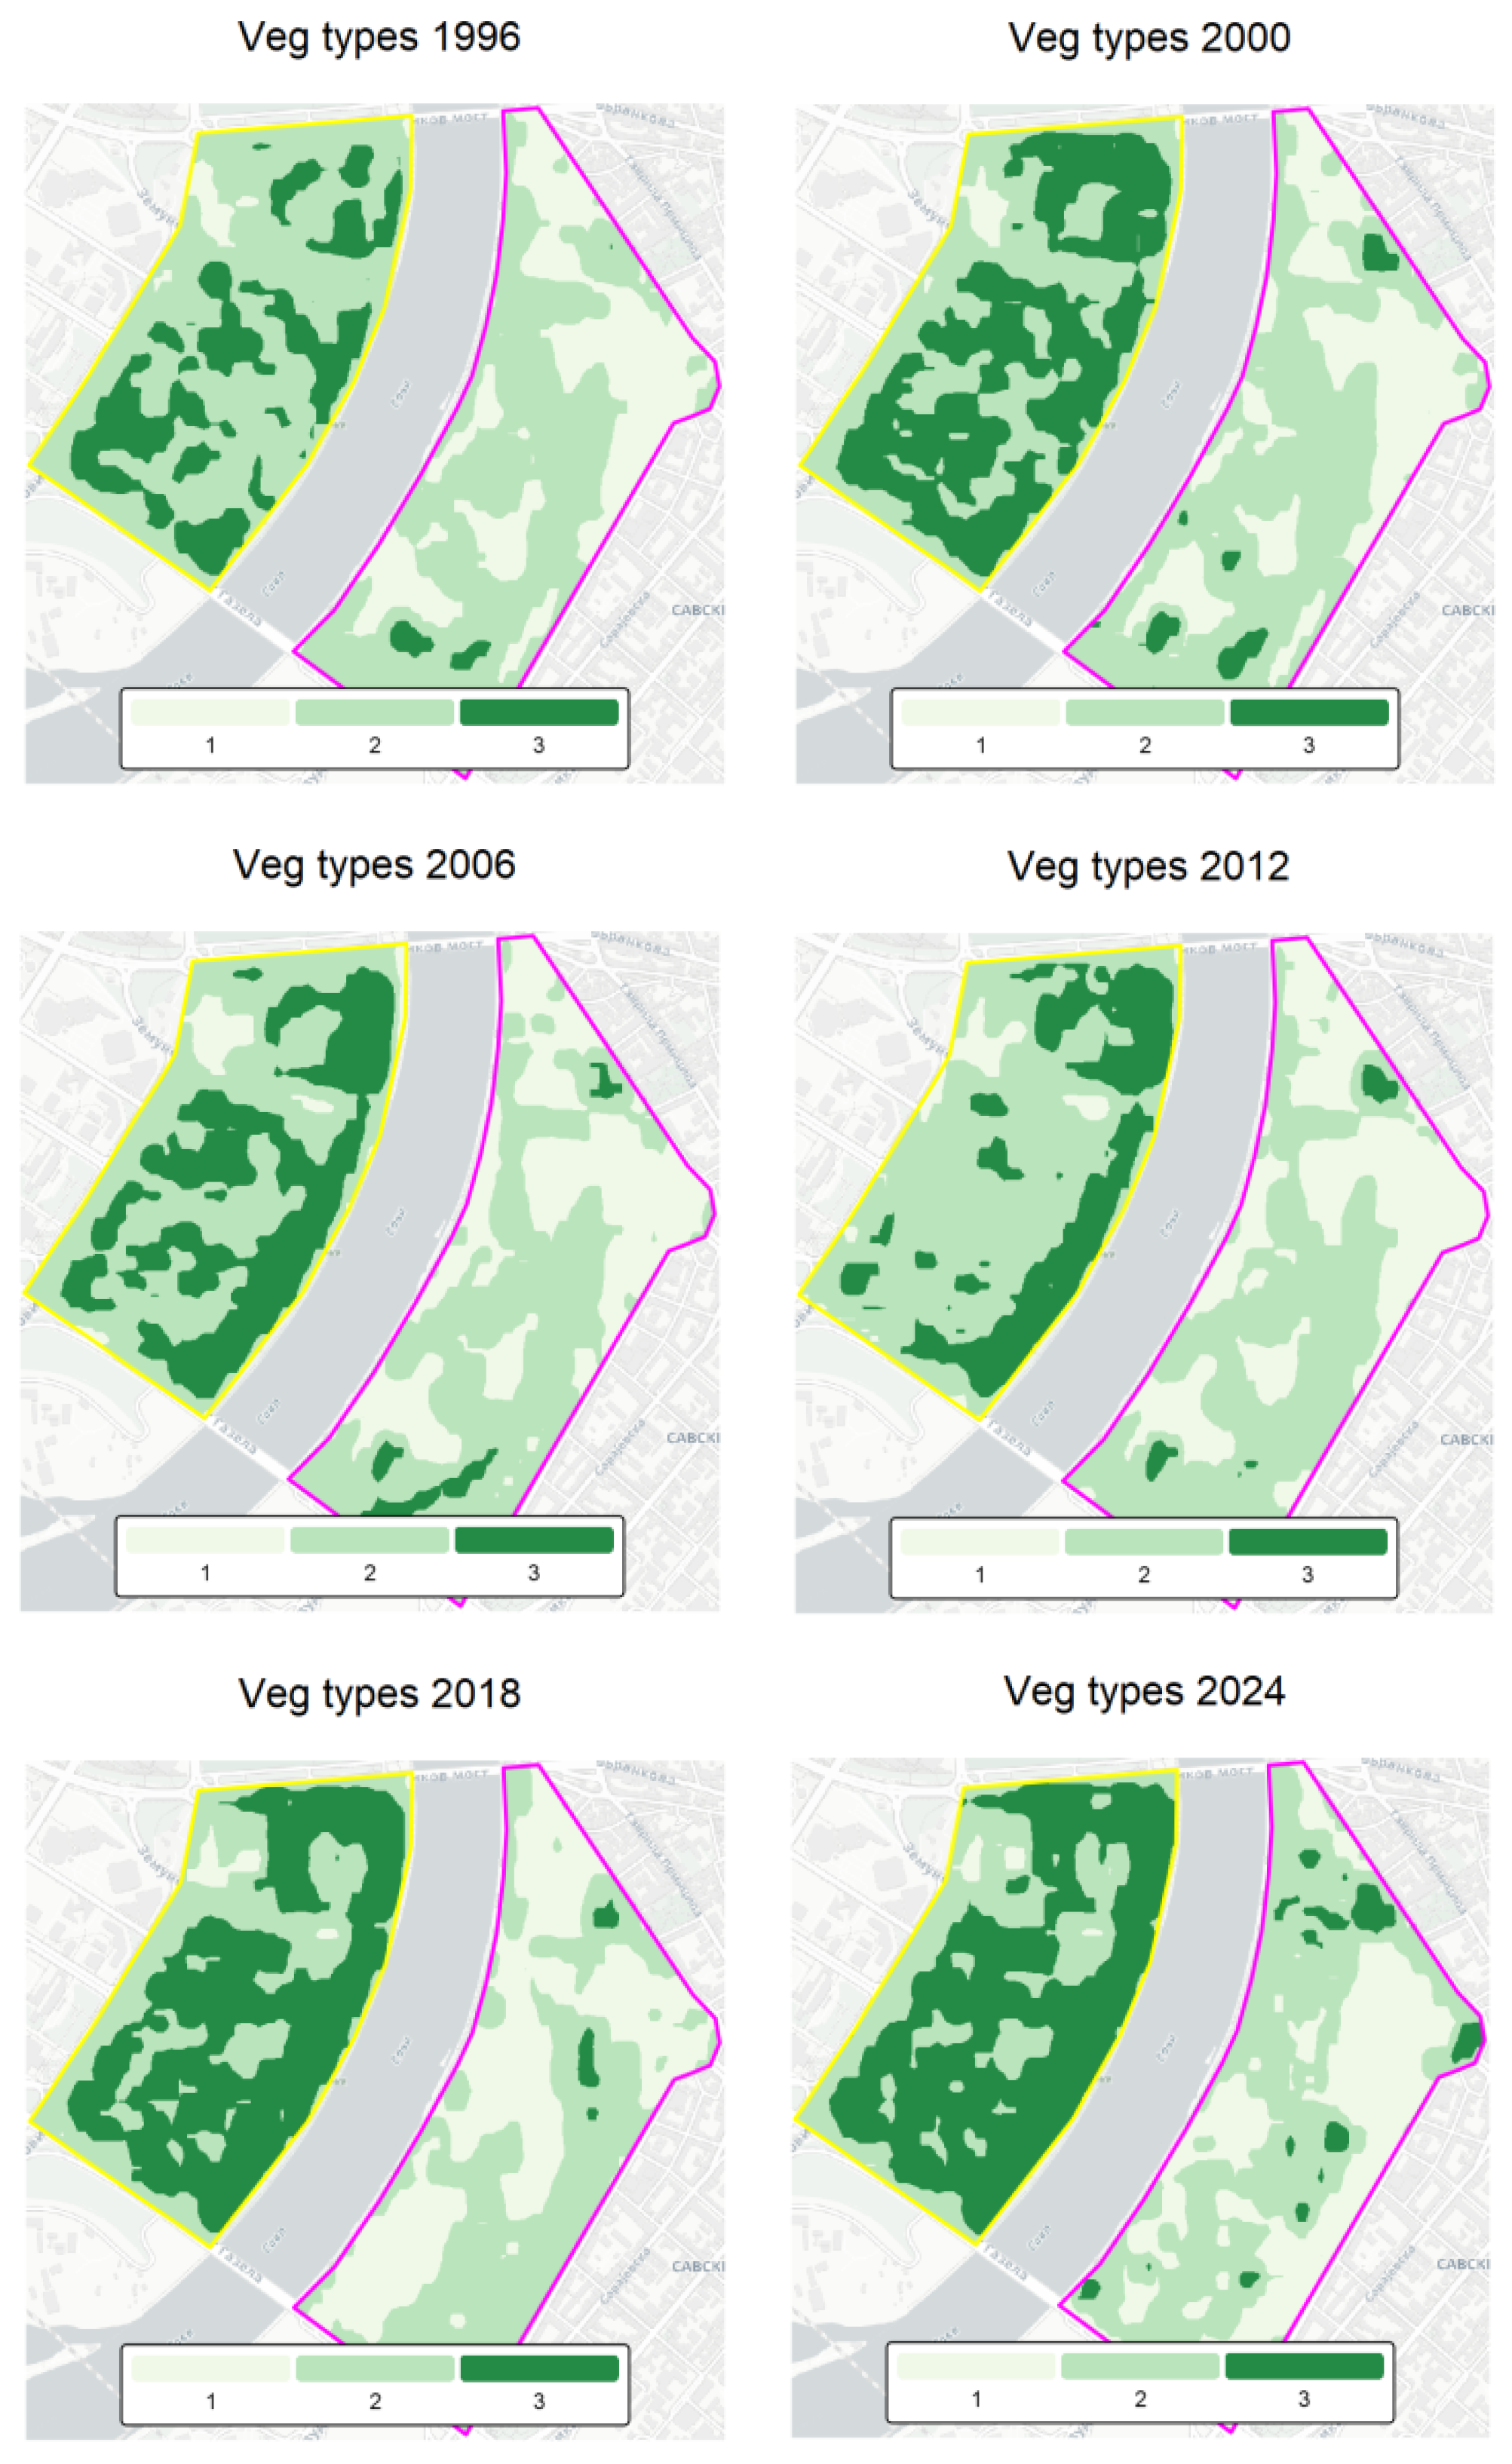
To identify structural differences in vegetation cover, annual MSAVI layers were classified into three functional vegetation types: (1) bare or sealed surfaces, (2) low vegetation, and (3) tree-dominated/dense canopy. MSAVI was selected because its adaptive soil-adjustment formulation enhances vegetation extraction in environments with strong soil influence, such as construction sites and heterogeneous urban mosaics [62]. By increasing the vegetation signal relative to soil noise, MSAVI performs reliably in heterogeneous urban settings. Previous studies demonstrated that MSAVI reliably distinguishes vegetation density gradients, with reported classification accuracies of 86–96% in urban land-cover mapping [63] and 91.3% for vegetation density classification [64].
Thresholds for functional vegetation types were defined based on documented MSAVI behavior: MSAVI < 0.10 (bare or impervious surfaces), 0.10–0.25 (low/sparse vegetation), and >0.25 (tree-dominated canopy). These ranges are consistent with vegetation–soil separation reported in foundational spectral studies [58,61,62] and widely applied in urban land-cover mapping.
To further substantiate the classification scheme, MSAVI pixel-value distributions were examined for representative years and both riverbanks (Figure A2 in Appendix A). The selected thresholds align with stable distribution breaks across the time series and consistently separate low-reflectance sealed surfaces from sparse and dense vegetation classes. This confirms that the adopted limits reflect intrinsic spectral structure rather than arbitrary segmentation.
This procedure was applied to each annual MSAVI raster after masking to the polygon boundaries. Pixel counts within each class were summarized by year and by side of the river.
Although species composition cannot be detected from satellite imagery, these three MSAVI classes correspond to the main structural components of the natural riparian vegetation along the Sava River. The native multi-layered canopy (Carpino-Quercetum roboris) aligns with the tree-dominated class, while disturbed or simplified vegetation corresponds to the low-vegetation and bare/sealed classes. This functional grouping therefore provides a meaningful structural proxy for assessing how redevelopment has altered the riverbank’s ecological architecture.
Because the analysis spans multiple Landsat sensors (Landsat 5 TM, Landsat 7 ETM+, and Landsat 8/9 OLI), potential inter-sensor radiometric differences were considered when applying fixed MSAVI thresholds. Landsat Collection 2 Level-2 surface reflectance products are processed using harmonized calibration and sensor-specific atmospheric correction algorithms (LEDAPS and LaSRC), which have been shown to ensure high cross-sensor consistency in vegetation index values. Visual inspection of MSAVI distributions around major sensor transition periods did not reveal systematic shifts that would require sensor-specific threshold adjustments. The thresholds used in this study therefore represent stable structural categories of vegetation density rather than sensor-dependent spectral boundaries.
To further evaluate the reliability of the adopted MSAVI thresholds, a local accuracy assessment was conducted using high-resolution imagery from the Esri World Imagery Wayback archive (30 cm–1 m spatial resolution). Three representative years corresponding to the major redevelopment phases (2013—pre-redevelopment, 2017—construction phase, and 2024—Waterfront built phase) were selected. For each year, a stratified random sample of pixels within the study polygons was manually interpreted and assigned to one of the three structural vegetation classes (bare/sealed surfaces, low vegetation, tree/dense canopy) based on visual inspection of the high-resolution imagery. These reference labels were then compared with the MSAVI-derived classification to produce a confusion matrix and estimate classification accuracy.
It should be noted that in complex urban environments, certain construction materials (e.g., light concrete, gravel, or weathered surfaces) may exhibit spectral reflectance values similar to sparse vegetation, which can occasionally lead to confusion between low vegetation and built surfaces when applying fixed MSAVI thresholds.
3.2.4. Esri World Imagery Wayback (2014–2024)
High-resolution, time-stamped aerial and satellite imagery from the Esri World Imagery Wayback archive (30 cm–1 m resolution) was used to complement the CORINE and Landsat-based analyses (https://livingatlas.arcgis.com/wayback/ accessed on 17 October 2025). Images from 2014, 2017, 2018, 2022, and 2024 were examined to visually identify the onset and progression of major construction phases on the right riverbank (Figure 2 and Figure A1). These images were used exclusively for qualitative interpretation, providing detailed spatial context for redevelopment patterns that cannot be resolved by CORINE’s coarse resolution or by 30 m Landsat imagery.
4. Results
4.1. Long-Term Land-Cover Trends from CORINE (1990–2018)
Figure 5 shows temporal changes in land-cover composition (CLC Level-3 classes) within the left and right polygons along the Sava River from 1990 to 2024, displayed across the available CORINE reporting years, with each dataset held constant until the next reporting year (step-wise carry-forward assignment). The left polygon (top panel) exhibits a remarkably stable composition throughout the observation period, with nearly constant shares of discontinuous urban fabric, green urban areas, and industrial or commercial units. This stability suggests that large-scale land conversion did not occur on the New Belgrade side, where planned green and open spaces have been largely maintained despite urban densification. In contrast, the right polygon (bottom panel) indicates a structural reconfiguration between 2006 and 2018, reflected in a relative decline of vegetated categories and a proportional increase in built-up classes. This transition coincides with intensive construction in the Belgrade Waterfront and adjacent Savski venac area, resulting in a clear reduction in vegetation-related classes and a more compact urban footprint. Overall, these trends highlight distinct urbanization trajectories on the two sides of the river: at the time of observation, the left bank appears as a stable but already urbanized landscape, while the right bank shows a rapidly transforming environment characterized by ongoing land-use conversion from vegetated to impervious surfaces. While CORINE data provide a structural overview of land-cover composition, their 100 m resolution does not resolve fine-scale urban heterogeneity; detailed vegetation dynamics are therefore derived from 30 m Landsat observations presented in subsequent sections.
Figure 5.
Temporal changes in CLC composition within the left and right polygons (CLC reporting years (1990–2018), extended to 1990–2024 using step-wise carry-forward assignment).
4.2. Multi-Decadal Vegetation Dynamics Based on NDVI/MSAVI (1996–2024)
Figure 6 summarizes the long-term trends in vegetation greenness (NDVI) for the left and right polygons and their dominant land-cover types. The left polygon (New Belgrade) maintained consistently higher NDVI values (≈0.30–0.38) throughout the 1996–2024 period, with no significant long-term trend (slope = −0.003 NDVI dec−1; p = 0.61). In contrast, the right polygon (Savski Venac side) exhibited a statistically significant decrease in NDVI (slope = −0.020 NDVI dec−1; p < 0.001; R2 = 0.38), reflecting a progressive decline in vegetation cover. The relative greenness difference (ΔNDVI = NDVI Left–NDVI Right) indicates that this divergence became most pronounced after 2015, coinciding with intensified urban redevelopment on the right bank. Positive Δ values therefore indicate higher vegetation greenness on the left bank, while negative values would indicate higher values on the right bank.
Figure 6.
Long-term NDVI (1996–2024) trends for left and right banks of the Sava River.
When disaggregated by CORINE land-cover classes (Figure 7), NDVI trends reveal that vegetated categories such as Green urban areas and Sport and leisure facilities preserved moderate to high greenness on both sides, while Discontinuous urban fabric and Industrial/commercial units maintained lower values with minimal interannual variability. The right polygon’s NDVI reduction is primarily associated with the expansion of Road and rail networks and impervious surfaces at the expense of vegetated areas, consistent with the observed CLC transitions. Overall, these results indicate that while both riverbanks are urbanized, the left bank maintained relatively stable vegetation cover, whereas the right bank shows a measurable decline in vegetation greenness coinciding with recent construction phases and land-cover transitions.
Figure 7.
Long-term class-based breakdowns by dominant CLC types of NDVI (1996–2024) for left and right banks of the Sava River.
The color scale ranges from low NDVI (red) indicating bare or built-up surfaces to high NDVI (green) representing dense vegetation. Figure 8 highlights the progressive decline in vegetation cover on the right bank following the onset of intensive urban redevelopment after 2014, while the left bank maintains relatively stable greenness throughout the study period.
Figure 8.
Temporal evolution of vegetation greenness (NDVI, 1996–2024) in the study area.
For cartographic visualization (Figure 7, Figure 8, Figure 9 and Figure 10), annual NDVI, MSAVI and derived vegetation-type maps were resampled from the native Landsat grid to a Web Mercator tile grid using bilinear interpolation (CartoDB.Positron basemap, zoom level 15). All quantitative analyses and statistics were computed on the original Landsat resolution data.
Figure 9.
Long-term MSAVI (1996–2024) trends for left and right banks of the Sava River.
Figure 10.
Long-term class-based breakdowns by dominant CLC types of MSAVI (1996–2024) for left and right banks of the Sava River.
Figure 9 shows the temporal evolution of vegetation greenness based on the MSAVI for the left and right polygons, together with the relative difference and class-based trends. In contrast to NDVI, the MSAVI values are generally lower, reflecting its reduced sensitivity to soil and built-up background reflectance. The left polygon (New Belgrade) shows stable to slightly increasing MSAVI values over the study period (slope = +0.002 MSAVI dec−1; p = 0.67), confirming persistent vegetation cover despite the high proportion of impervious surfaces. The right polygon (Savski Venac) exhibits a weak but negative trend (slope = −0.005 MSAVI dec−1; p = 0.055), with lower overall values indicating reduced vegetative density and greater exposure of non-vegetated surfaces.
The relative MSAVI difference (ΔMSAVI = Left–Right) remains consistently positive across the 1996–2024 period, further emphasizing the greener character of the left riverbank. Here, positive Δ values indicate higher vegetation greenness on the left bank, while negative values would indicate higher values on the right bank. Class-specific trends show that discontinuous urban and sport and leisure areas on the left bank maintain moderate to high MSAVI stability, whereas industrial/commercial and road and rail categories on the right bank present persistently low values. Together, these results corroborate the NDVI-based findings, demonstrating that while both sides of the Sava River are highly urbanized, vegetation on the left bank remains better preserved and less affected by soil or construction-related spectral interference (Figure 10).
The MSAVI accounts for soil reflectance and thus provides a more conservative measure of vegetation density than NDVI (Figure 11). The maps highlight persistent differences in vegetation structure between the two riverbanks: the left bank maintains stable or slightly increasing MSAVI values, while the right bank exhibits progressive loss of vegetative cover and greater spectral dominance of bare or built surfaces.
Figure 11.
Temporal evolution of soil-adjusted vegetation greenness (MSAVI, 1996–2024) in the study area.
Across the full 1996–2024 record, MSAVI means are consistently lower than NDVI, as expected from its soil-adjusted formulation, but the inter-polygon patterns are congruent (Table 1). To improve clarity, the statistical trend results are summarized in a single consolidated table that reports the outputs of the three applied approaches: Ordinary Least Squares (OLS) regression, the non-parametric Mann–Kendall trend test, and Sen’s slope estimator. The left bank is greener in both indices (NDVI = 0.344; MSAVI = 0.202) and shows no significant long-term trend (NDVI: −0.003 dec−1, p = 0.61; MSAVI: +0.002 dec−1, p = 0.67). The right bank has lower greenness (NDVI = 0.176; MSAVI = 0.093) with a clear decline in NDVI (−0.020 dec−1, p < 0.001) and a marginal MSAVI decrease (−0.005 dec−1, p = 0.055). Disaggregating by CLCs, high-greenness categories on the left (e.g., Sport & leisure, Green urban) remain broadly stable, whereas on the right, Industrial or commercial shows a significant decline (NDVI: −0.032 dec−1, p = 0.0015; MSAVI: −0.018 dec−1, p = 0.0038) (Table A1). Discontinuous urban on the right has a small but positive MSAVI trend (+0.005 dec−1, p = 0.024), suggesting localized greening within built areas.
Table 1.
Summary statistics of NDVI and MSAVI by riverbank (1996–2024).
To assess whether the observed trends reflected gradual monotonic change or structural regime shifts, a non-parametric Pettitt test was applied to the annual NDVI and MSAVI series. On the right bank, both indices revealed a statistically significant breakpoint in 2017 (MSAVI: p = 0.028; NDVI: p = 0.004), indicating a marked structural shift rather than a purely gradual decline. In contrast, no significant breakpoints were detected on the left bank (p > 0.10), confirming its temporal stability over the 1996–2024 period.
Notably, the detected breakpoint falls within the predefined construction phase (2014–2018), providing independent statistical support for the phase-based temporal framework used in the subsequent structural analysis.
4.3. Vegetation Structure and Functional Green Types
To complement the NDVI and MSAVI trends, vegetation was classified into three functional green-infrastructure types: (1) bare/sealed surfaces, (2) low vegetation (lawns, ruderal vegetation, shrubs), and (3) tree/dense canopy. Unlike spectral indices alone, this structural classification captures differences in vertical vegetation organization and ecological function, thereby providing an additional dimension for assessing redevelopment impacts.
Redevelopment phases (1996–2013, 2014–2018, 2019–2024) were defined based on documented construction timelines and visual interpretation of high-resolution Wayback imagery. The period 1996–2013 represents the pre-redevelopment phase prior to the formal launch of the Belgrade Waterfront project. The interval 2014–2018 corresponds to the initial implementation phase following the official project announcement in 2014, when large-scale demolition, land preparation, and the first construction works began. The period 2019–2024 reflects the phase in which major buildings and urban infrastructure became operational and the new waterfront urban form largely stabilized. Across the entire 1996–2024 time series, the two riverbanks exhibit distinct and stable vegetation identities (Table 2), indicating that redevelopment altered not only vegetation quantity but its structural configuration.
Table 2.
Mean proportional cover (%) of functional vegetation types on the left (L) and right (R) riverbank across three redevelopment phases (mean ± SD).
Although, in this case, satellite data cannot identify species, the structural vegetation classes correspond to the principal components of the riparian vegetation historically associated with the Sava River corridor. Naturally, the riverbank would be dominated by the Carpino–Quercetum roboris association, characterized by a multi-layered tree canopy (Quercus robur, Carpinus betulus), a shrub layer (Cornus sanguinea, Corylus avellana), and a herbaceous understory (Urtica dioica, Galium aparine, Arctium lappa). This community aligns structurally with the MSAVI tree/dense-canopy (T3) class. In contrast, disturbed ruderal vegetation, typically composed of species such as Ambrosia artemisiifolia, Chenopodium album, Artemisia vulgaris, and various Poaceae, corresponds to the low vegetation (T2) class. Bare/sealed surfaces (T1) reflect areas where natural vegetation has been fully removed. Linking these ecological expectations to MSAVI structural classes helps interpret how redevelopment has displaced natural riparian vegetation and replaced it with horticultural or impervious surfaces.
Left bank (New Belgrade): Stable, canopy-supported horticultural structure. The left bank consistently maintained a mature, multi-layered vegetation structure throughout all periods. During the pre-redevelopment years, tree/dense canopy (T3) accounted for ~43% of the surface (SD ≈ 11%), while low vegetation (T2) comprised ~54%. Bare or sealed surfaces remained minimal at ~3% (Table 2). This balance between canopy and understory reflects the original modernist urban planning of New Belgrade, the preservation of park systems and linear green corridors, routine horticultural maintenance, and good rooting continuity enabling long-term canopy development. During the construction and redevelopment periods, the overall structure remained stable. The share of mature tree canopy stayed within 45–47%, despite localized densification and infill. This confirms that green infrastructure here was not substantially fragmented, and canopy continuity, a key factor for cooling and biodiversity, was preserved.
Right bank (Savski Venac/Belgrade Waterfront): Ruderal low vegetation and canopy collapse. Before redevelopment (1996–2013), the right bank already differed significantly from the left: low vegetation dominated (~64%), while tree canopy was scarce (~3%) (Table 2). Much of this vegetation was unmanaged, ruderal, or early successional, low in ecological complexity but extensive in coverage. During the construction phase (2014–2018), structural vegetation degradation became dramatic. Tree canopy remained extremely limited (~6%), and bare/sealed surfaces rose from 33% to nearly 39%, replacing both tree cover and low vegetation. By the Waterfront built phase (2019–2024), bare/sealed land increased further to ~51%, while low vegetation declined to ~46%. Tree canopy remained at only 3%, indicating that recently planted ornamental trees have not yet contributed meaningfully to vertical structure or MSAVI signal. This evolution reflects a systemic replacement of ecologically complex vegetation with ornamental, shallow-rooted horticultural surfaces, including lawn-type groundcovers, irrigation-dependent green strips, and young isolated tree plantings. These features provide limited cooling, weak biodiversity function, and low resilience compared to the mature riparian canopy replaced by the redevelopment.
This phase-based redistribution demonstrates a shift from heterogeneous ruderal vegetation toward predominantly impervious and horticultural surfaces (Figure A3), consistent with the spectral regime shift identified in Section 4.2.
The validation results indicate an overall classification accuracy above 85%, with particularly strong agreement for the bare/sealed and tree/dense canopy classes. Misclassification occurred mainly between sparse vegetation and transitional surfaces typical of construction areas. These results support the reliability of the MSAVI threshold scheme used in the structural vegetation analysis.
The statistically significant breakpoint detected around 2017 broadly coincides with the period of intensive construction and land preparation associated with the Belgrade Waterfront redevelopment.
5. Discussion
Although the detected breakpoint aligns with the main construction phase of the Belgrade Waterfront redevelopment, vegetation indices can also be influenced by interannual climatic variability such as precipitation deficits or heat anomalies. Therefore, the 2017 breakpoint should be interpreted primarily as a signal of structural land-cover change, potentially amplified by short-term meteorological conditions. Because both riverbanks experience the same regional climate regime, the contrasting vegetation trends observed between the two polygons suggest that local land-cover transformation rather than climatic variability is the dominant driver of the detected shift.
5.1. Divergent Land-Cover and Vegetation Trajectories
The empirical results reveal a pronounced and quantifiable divergence in land-cover composition, vegetation greenness, and structural vegetation types between the two banks of the Sava River over the 1996–2024 period. Rather than representing uniform urban growth, redevelopment along the river corridor followed two clearly differentiated trajectories with distinct ecological outcomes.
On the left bank (New Belgrade), CORINE data indicate long-term land-cover stability, with persistent proportions of discontinuous urban fabric, green urban areas, and industrial/commercial zones. This compositional stability is mirrored in vegetation indices: NDVI and MSAVI values remain consistently higher than on the right bank and show no statistically significant long-term decline (NDVI slope −0.003 dec−1, p = 0.61; MSAVI slope +0.002 dec−1, p = 0.67). Structural classification confirms that this stability is not merely spectral but morphological. The left bank maintains a mature, multi-layered vegetation system, with tree/dense canopy (T3) consistently accounting for approximately 43–47% of the surface and bare/sealed areas remaining minimal (~3%). This indicates preserved canopy continuity and rooted green infrastructure capable of supporting cooling, habitat connectivity, and ecological buffering.
In contrast, the right bank (Savski Venac/Belgrade Waterfront) exhibits a statistically significant decline in vegetation greenness (NDVI −0.020 dec−1, p < 0.001; MSAVI −0.005 dec−1, p = 0.055) accompanied by clear land-cover conversion from vegetated and semi-natural classes to built-up and transport-related categories. Structural vegetation analysis demonstrates that this shift is not limited to reduced greenness but reflects a deeper ecological simplification. Prior to redevelopment, the right bank was already dominated by low vegetation (~64%) with minimal canopy presence (~3%). During and after the main construction phase (2014–2024), bare/sealed surfaces increased to approximately 51%, while tree canopy remained persistently low (~3%), indicating that redevelopment did not restore vertical vegetation structure.
These findings suggest that redevelopment altered not only vegetation quantity but its ecological configuration. The replacement of ruderal or semi-natural vegetation with impervious surfaces and ornamental landscaping represents a transition from horizontally extensive but ecologically simple vegetation to highly sealed and structurally shallow green elements. Although a small positive MSAVI trend within discontinuous urban fabric on the right bank suggests localized greening interventions (+0.005 dec−1, p = 0.024), these remain spatially limited and insufficient to offset the broader canopy deficit and expansion of impervious cover.
An important limitation of the structural land-cover analysis is that the most recent CORINE Land Cover dataset is available only up to 2018. Consequently, land-cover classes for the 2019–2024 period were extended using a step-wise carry-forward approach and should therefore be interpreted as a structural baseline rather than newly observed land-cover information. This limitation means that the most recent redevelopment phase of the Belgrade Waterfront is not independently captured by a new CLC layer. For this period, interpretation relies primarily on the independently derived Landsat NDVI/MSAVI time series and visual corroboration from high-resolution Wayback imagery, which together provide evidence of vegetation loss and surface sealing associated with redevelopment activities. Future studies could further strengthen this analysis by incorporating higher-resolution land-cover products such as Urban Atlas to independently verify post-2018 structural changes.
5.2. Structural Vegetation Change and Ecological Function
From an ecological perspective, the structural decline of tree canopy is particularly significant. Naturally, the Sava riverbank would be associated with the Carpino–Quercetum roboris forest community, dominated by Quercus robur and Carpinus betulus with a layered shrub and herbaceous understory [65,66,67]. Such multi-layered systems support microclimate regulation, evapotranspiration, biodiversity, and soil stabilization.
The empirical absence of canopy recovery on the right bank indicates that redevelopment displaced this structurally complex vegetation without functionally equivalent replacement. Instead, newly introduced greenery appears predominantly lawn-based or ornamental, offering limited vertical stratification and reduced long-term ecological performance. This confirms that vegetation structure, not merely its presence, determines ecological capacity [68].
The climate resilience implications of these structural differences are substantial. Tree canopy continuity, as observed on the left bank, enhances shading, moderates surface temperatures, supports carbon sequestration, and reduces stormwater runoff through interception and infiltration. Conversely, the expansion of impervious surfaces and reduction of the canopy on the right bank likely intensify urban heat island effects, increase surface runoff, and reduce adaptive capacity to hydrological extremes. The divergence between the two banks thus reflects not only alternative redevelopment models but contrasting capacities for climate adaptation [69].
5.3. Governance and Socio-Economic Drivers of Divergence
Beyond the spatial patterns identified through LULC and vegetation analyses, the observed divergence between the two riverbanks reflects deeper socio-economic and governance dynamics characteristic of post-socialist urban transformation.
The stability of the left bank can be linked to its origin in centrally planned urbanism, where green infrastructure was embedded as a structural component of spatial design rather than treated as residual land. In contrast, the rapid restructuring of the right bank corresponds to a governance model increasingly influenced by public–private partnerships, investment-driven planning, and expedited regulatory procedures. Such mechanisms tend to prioritize real estate valorization and short-term economic returns, often compressing ecological considerations into secondary or symbolic roles.
The empirical reduction of the canopy structure and expansion of impervious surfaces on the right bank therefore cannot be interpreted solely as a morphological change, but as an outcome of shifting institutional priorities, land-ownership structures, and decision-making frameworks. In this sense, riverfront transformation emerges as a manifestation of broader governance transitions, from redistributive planning models toward entrepreneurial urbanism. Understanding these underlying drivers is essential for explaining why similar riverfront zones within the same city have produced markedly different ecological outcomes.
5.4. Methodological Considerations and Interpretation Limits
It is important to acknowledge that the spatial resolution of CORINE Land Cover and Landsat-derived indices constrains the detection of fine-scale or recently introduced green elements, such as narrow green strips, young ornamental trees, or small courtyard vegetation. Consequently, localized greening initiatives may be partially underrepresented in the quantitative results.
However, given the consistency of multi-decadal trends and the magnitude of observed canopy loss and impervious expansion on the right bank, the identified structural divergence between the two riverbanks is unlikely to be solely an artifact of resolution limitations. Rather, the findings indicate broader spatial restructuring processes that exceed the scale of minor horticultural interventions.
A methodological limitation of the study arises from the spatial resolution mismatch between the datasets used. Landsat-derived vegetation indices provide observations at a 30 m spatial resolution, while CORINE Land Cover polygons represent land-cover classes with a minimum mapping unit of approximately 100 m. Although the analytical workflow preserves the native resolution of Landsat pixels during aggregation, the structural context provided by CORINE classes reflects a generalized landscape representation. As a result, narrow riparian vegetation strips, micro-ecological nodes, and small urban green corridors along the riverbanks may be partially obscured or underrepresented in the analysis. This limitation should be considered when interpreting the ecological configuration of the waterfront environment. Nevertheless, the combination of CORINE structural context with long-term Landsat vegetation time series remains suitable for identifying macro-scale landscape transformation patterns associated with large redevelopment projects.
5.5. Implications for Post-Socialist Riverfront Sustainability
Within the broader post-socialist context, these results empirically substantiate concerns raised in European literature regarding riverfront regeneration. While redevelopment may increase economic visibility and urban density, the Belgrade case demonstrates that insufficient integration of structurally robust green infrastructure can lead to long-term ecological simplification.
Importantly, the findings indicate that sustainable urbanism cannot be assessed solely through land-use categories or nominal green-space percentages. Structural vegetation quality, canopy continuity, and functional green typologies are critical determinants of ecological integrity. Integrating native riparian species and multi-layered vegetation structures, such as those characteristic of Carpino–Quercetum roboris, into redevelopment strategies could strengthen habitat connectivity, microclimate regulation and long-term resilience. Overall, the Sava River corridor illustrates how divergent planning approaches produce materially different ecological landscapes over time. The left bank demonstrates that dense urban form can coexist with stable canopy-supported green infrastructure when embedded in long-term spatial planning. The right bank, by contrast, reveals the ecological costs of rapid, market-driven redevelopment in the absence of structurally integrated blue-green networks. For Belgrade and for other post-socialist cities undergoing waterfront transformation, the challenge lies in reconciling economic redevelopment with the preservation and restoration of ecologically functional riverfront systems [70,71,72,73,74,75,76].
The observed vegetation decline on the right bank is consistent with findings from previous studies examining large-scale waterfront redevelopment projects, where intensified construction and increased impervious surfaces often lead to reductions in vegetation cover and ecological complexity. Similar trends have been reported in studies of rapidly redeveloping urban waterfronts, where economic redevelopment priorities frequently conflict with ecological continuity and green infrastructure preservation [77]. However, the clear contrast between the two riverbanks observed in this study highlights the role of planning frameworks in shaping ecological outcomes. While the left bank reflects a planning approach that historically incorporated larger green open spaces, the redevelopment pattern on the right bank demonstrates how high-density urban construction can significantly alter vegetation structure even when new landscaped areas are introduced. This comparison provides additional insight into how different redevelopment strategies influence long-term vegetation dynamics in urban riverfront environments [78].
Although climatic variability can influence vegetation indices, the two analyzed polygons are located within the same metropolitan climatic regime and therefore experience nearly identical temperature and precipitation patterns. For this reason, climate was not treated as an independent variable in the present analysis. The comparative design of the study allows regional climatic influences to be considered broadly uniform across both riverbanks, making it possible to interpret the contrasting vegetation trends primarily in relation to differences in land-cover transformation and redevelopment intensity.
6. Conclusions
This study demonstrates that land-use and land-cover changes along the Sava River corridor between 1990 and 2024 reflect two contrasting paradigms of urban development in post-socialist Belgrade. On the left bank, New Belgrade continues to embody a legacy of structured planning in which green infrastructure is systematically embedded within the urban form; however, this spatial model is increasingly vulnerable, as continuous riverfront construction is being proposed, posing potential risks to the long-term continuity and functionality of established green systems. In contrast, the right bank, particularly the Belgrade Waterfront zone, has been shaped by market-driven redevelopment that prioritizes land valorization over ecological and social integration. This divergence illustrates a broader paradox of post-socialist transformation: economic modernization and global visibility have often advanced at the expense of ecological integrity and long-term resilience.
Beyond summarizing spatial change, the unique contribution of this research lies in its multi-decadal, spatially explicit assessment of riverfront transformation that integrates CORINE land-cover data with long-term NDVI and MSAVI time series and structural vegetation classification. By combining land-cover transitions with quantitative vegetation dynamics and functional green typologies, the study moves beyond categorical LULC analysis and demonstrates how redevelopment reshapes not only surface composition but vegetation structure, canopy continuity, and ecological performance. This integrative methodological framework provides a replicable model for evaluating riverfront sustainability in other post-socialist and rapidly transforming urban contexts.
Empirical findings reveal pronounced vegetation decline, landscape homogenization, and ecological fragmentation on the right bank, including statistically significant NDVI reduction and persistent canopy deficiency. These structural changes are associated with reduced thermal regulation potential, weakened hydrological buffering, and diminished biodiversity support, thereby increasing climate vulnerability. While localized greening interventions are detectable, they remain insufficient in scale and structural complexity to compensate for canopy loss and expanding impervious surfaces.
From a sustainable urbanism perspective, the results underscore the limitations of redevelopment models that treat green space as ornamental rather than infrastructural. The absence of integrated blue-green networks, limited incorporation of native riparian species, and fragmentation of vegetation systems constrain the city’s adaptive capacity under climate stress. Sustainable riverfront regeneration therefore requires not merely the preservation of nominal green areas, but the maintenance and restoration of structurally complex and multi-layered vegetation systems.
Looking forward, strengthening ecological resilience along the Sava River will depend on safeguarding remaining canopy-supported areas, restoring riparian ecosystems inspired by native communities such as Carpino-Quercetum roboris, and reconnecting fragmented green spaces into a continuous, functional network. A transdisciplinary planning approach, integrating spatial design, ecological science, policy frameworks and participatory governance, offers the most viable pathway for reconciling urban growth with environmental responsibility. Without such integration, the riverfront risks becoming not a model of contemporary urban regeneration, but a manifestation of the structural disconnect between redevelopment ambitions and ecological sustainability.
Based on the empirical results of this study, several policy-oriented recommendations can be proposed for future riverfront redevelopment. First, planning frameworks should prioritize the preservation and restoration of continuous riparian vegetation corridors, which play a crucial role in maintaining ecological connectivity and microclimatic regulation along urban rivers. Second, redevelopment projects should incorporate minimum tree canopy coverage targets and prioritize native riparian species adapted to local ecological conditions. Third, urban planning regulations should integrate blue-green infrastructure standards that ensure the functional continuity of ecological networks rather than relying solely on fragmented ornamental green spaces. Finally, systematic monitoring of vegetation dynamics using remote sensing tools should be integrated into urban environmental management systems, enabling planners to track ecological impacts of redevelopment and adjust planning strategies accordingly.
From a practical planning perspective, the results suggest that riverfront redevelopment should prioritize continuous tree canopy preservation, limit large contiguous impervious surfaces, and integrate structurally complex vegetation rather than fragmented ornamental landscaping. Urban planning regulations may incorporate minimum canopy coverage targets, protection of existing riparian vegetation corridors, and requirements for multi-layered planting schemes using native species. Furthermore, periodic monitoring using NDVI/MSAVI indicators can support evidence-based planning decisions and allow municipalities to evaluate the ecological performance of redevelopment projects over time. These measures provide actionable mechanisms for strengthening blue-green infrastructure and improving climate resilience in rapidly transforming riverfront environments.
Author Contributions
Conceptualization, M.M., M.L. and A.F.S.; methodology, M.M., M.L. and A.F.S.; software, A.F.S.; validation, M.L. and A.F.S.; formal analysis, A.F.S.; investigation, M.M., M.L. and A.F.S.; resources, A.F.S.; data curation, M.L.; writing—original draft preparation, M.M., M.L. and A.F.S.; writing—review and editing, M.M., M.L. and A.F.S.; visualization, M.M., M.L. and A.F.S.; supervision, M.M., M.L. and A.F.S. All authors have read and agreed to the published version of the manuscript.
Funding
This research received no external funding.
Data Availability Statement
All data is provided in manuscript.
Acknowledgments
The authors have reviewed and edited the output and take full responsibility for the content of this publication. This research is supported by Ministry of Science, Technological Development and Innovation of the Republic of Serbia for funding the scientific research work, contract no. 451-03-65/2024-03/200155, realized by the Faculty of Technical Sciences in Kosovska Mitrovica, University of Pristina, and no. 451-03-34/2026-03/200117 and 451-03-33/2026-03/200117, realized by the Faculty of Agriculture, University of Novi Sad.
Conflicts of Interest
The authors declare no conflicts of interest.
Abbreviations
The following abbreviations are used in this manuscript:
| LULC | Land Use and Land Cover |
| CLC | CORINE Land Cover |
| NDVI | Normalized Difference Vegetation Index |
| MSAVI | Modified Soil-Adjusted Vegetation Index |
Appendix A
Table A1.
Summary statistics of NDVI and MSAVI by CORINE Land Cover (CLC) class for the left and right banks of the Sava River (1996–2024).
All satellite basemaps were obtained from the Esri World Imagery Wayback archive, part of the Esri Living Atlas of the World (https://livingatlas.arcgis.com/wayback/ accessed on 17 October 2025). This archive provides access to time-stamped snapshots of Esri’s global World Imagery basemap, allowing users to view and compare changes in satellite and aerial imagery over time. The basemap is a mosaic of high-resolution commercial satellite and aerial photographs, with spatial resolution ranging typically from 30 cm to 1 m per pixel in urban areas such as Belgrade. The imagery is orthorectified and blended from multiple sensors to form a seamless global layer. The Figure A1 present study area captured on 20 February 2014, 25 January 2017, 17 October 2018, 10 August 2022, and 9 April 2024.
Figure A1.
Study area urban development in period 2014–2024. Yellow marks the boundary of the left bank area, while pink marks the boundary of the right bank area.
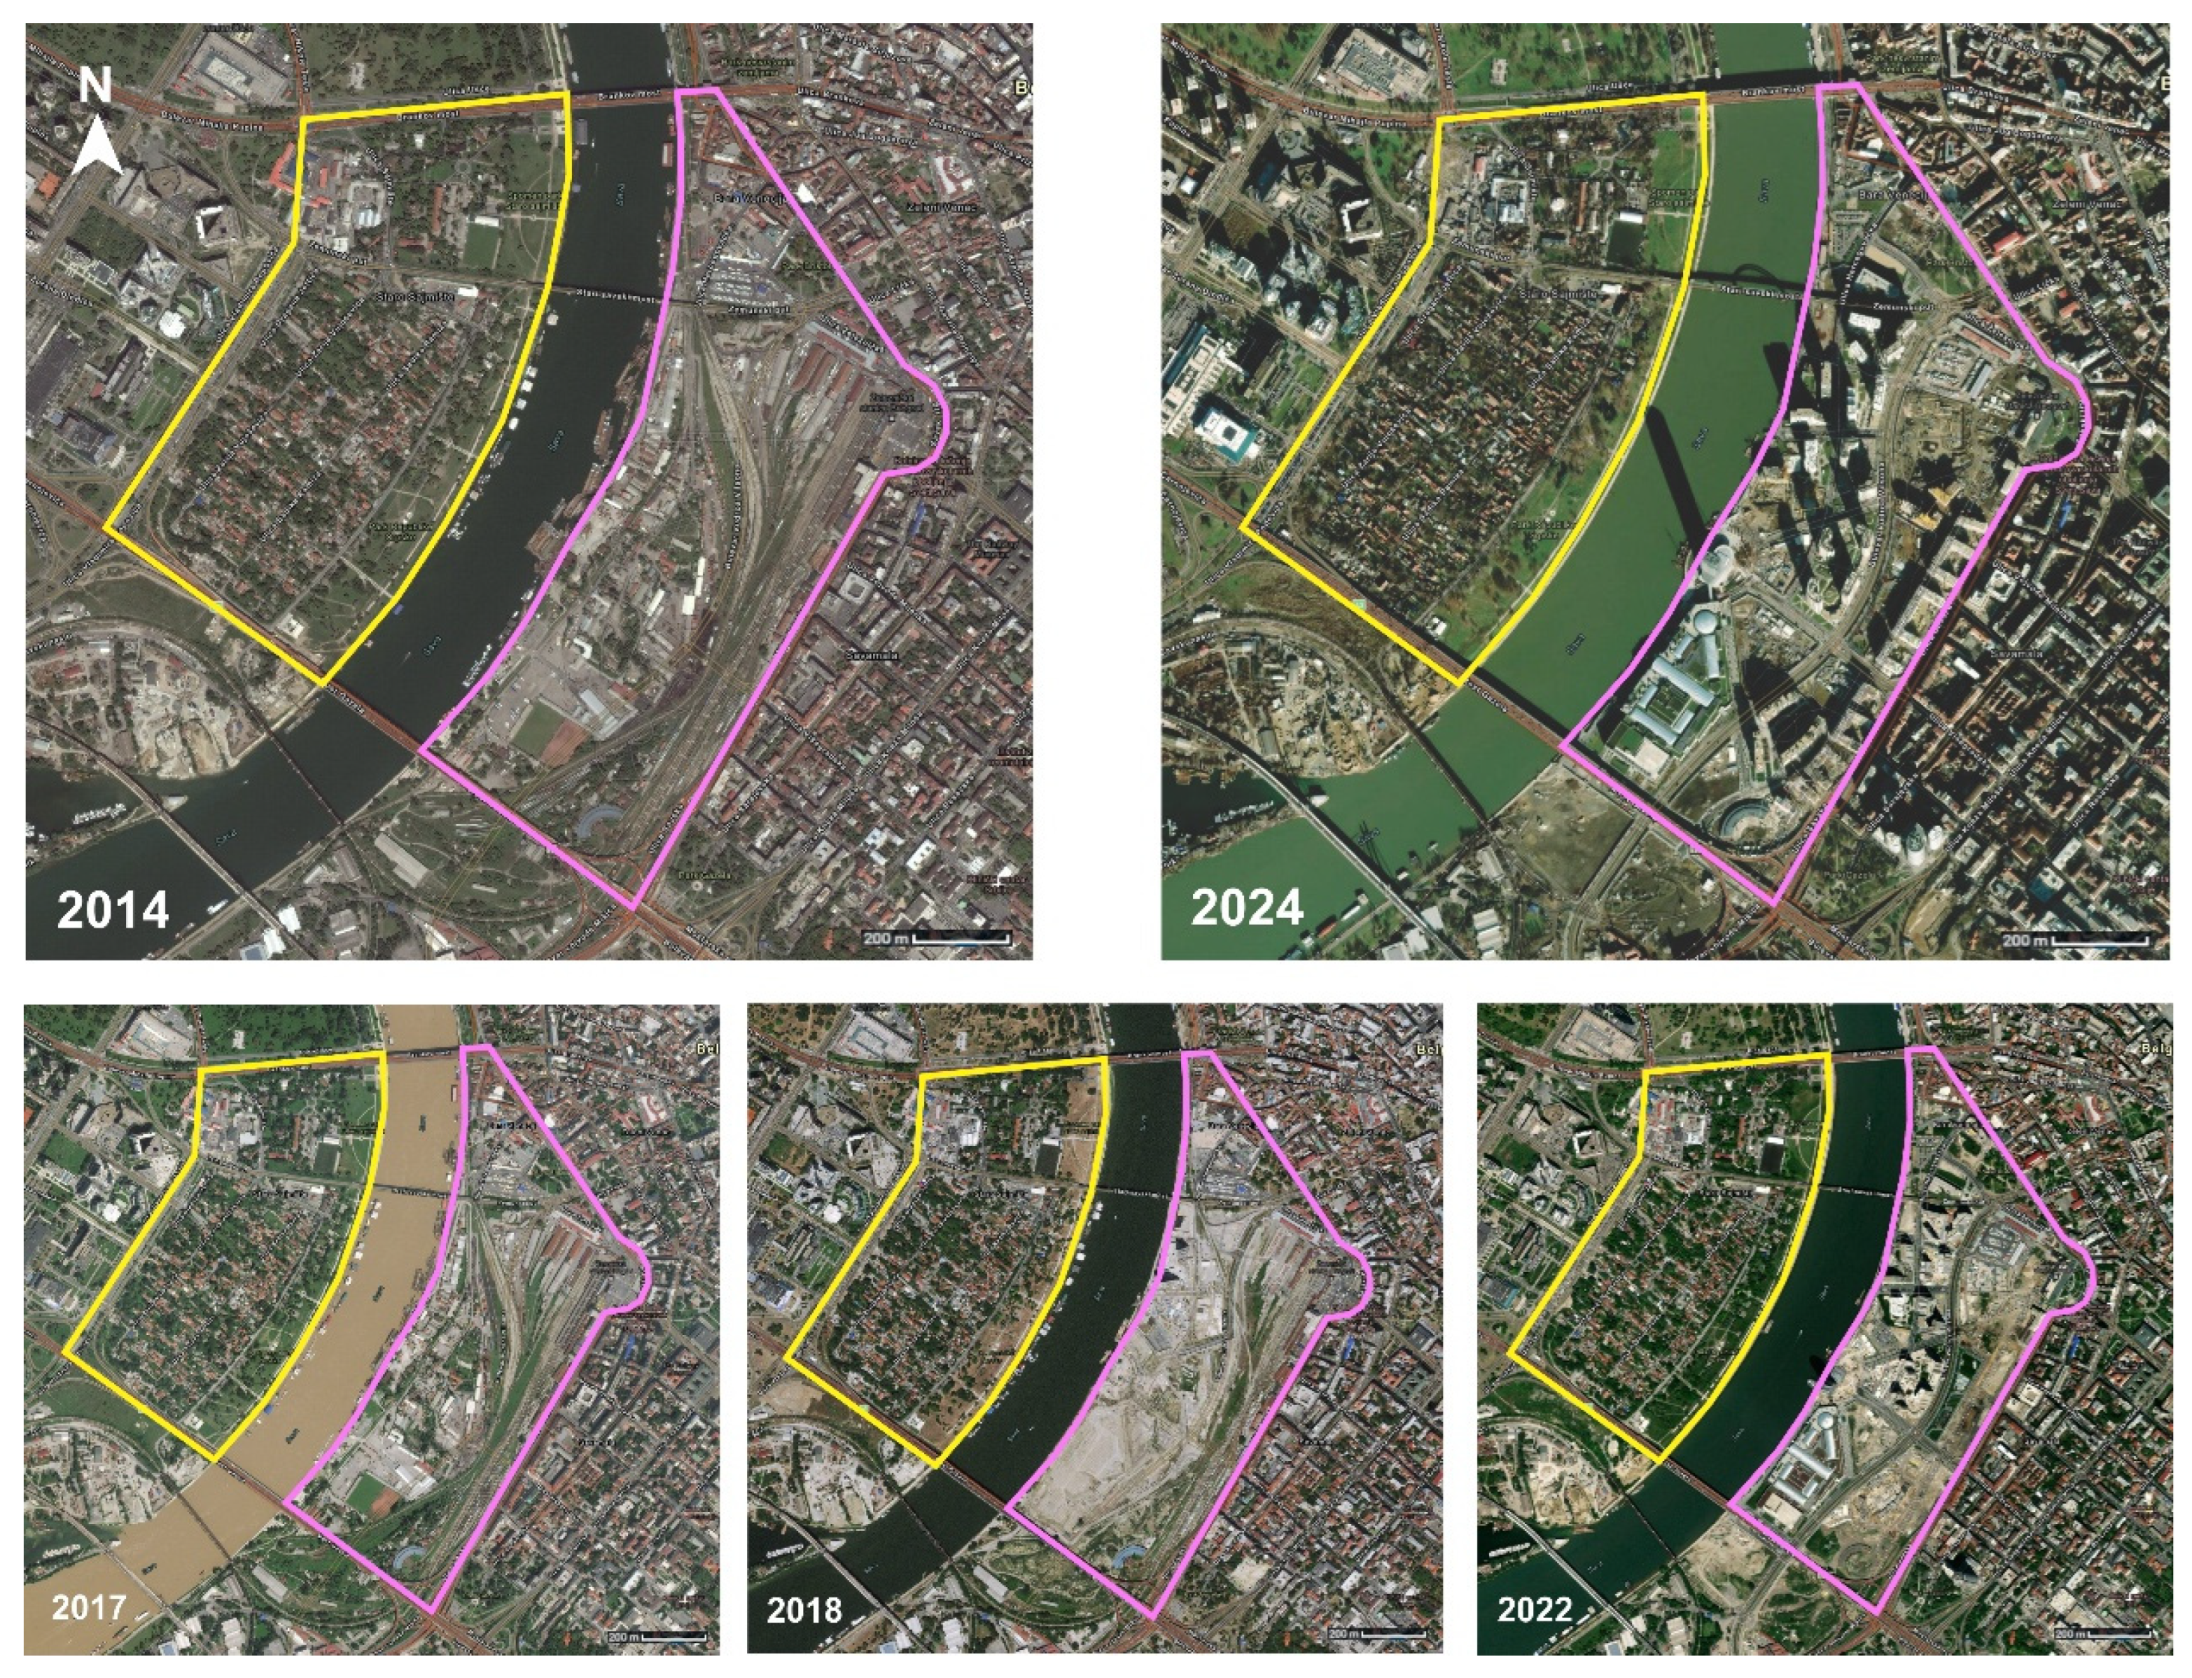
Figure A2.
Distribution of MSAVI pixel values for representative years spanning the pre-redevelopment (1996, 2013), construction (2017), and Waterfront built (2024) phases for both riverbanks. Dashed lines mark the classification thresholds (MSAVI = 0.10 and 0.25) used to define functional vegetation types (T1–T3). The stable alignment of these thresholds with distribution breaks across years supports the robustness of the classification scheme applied in Table 2.
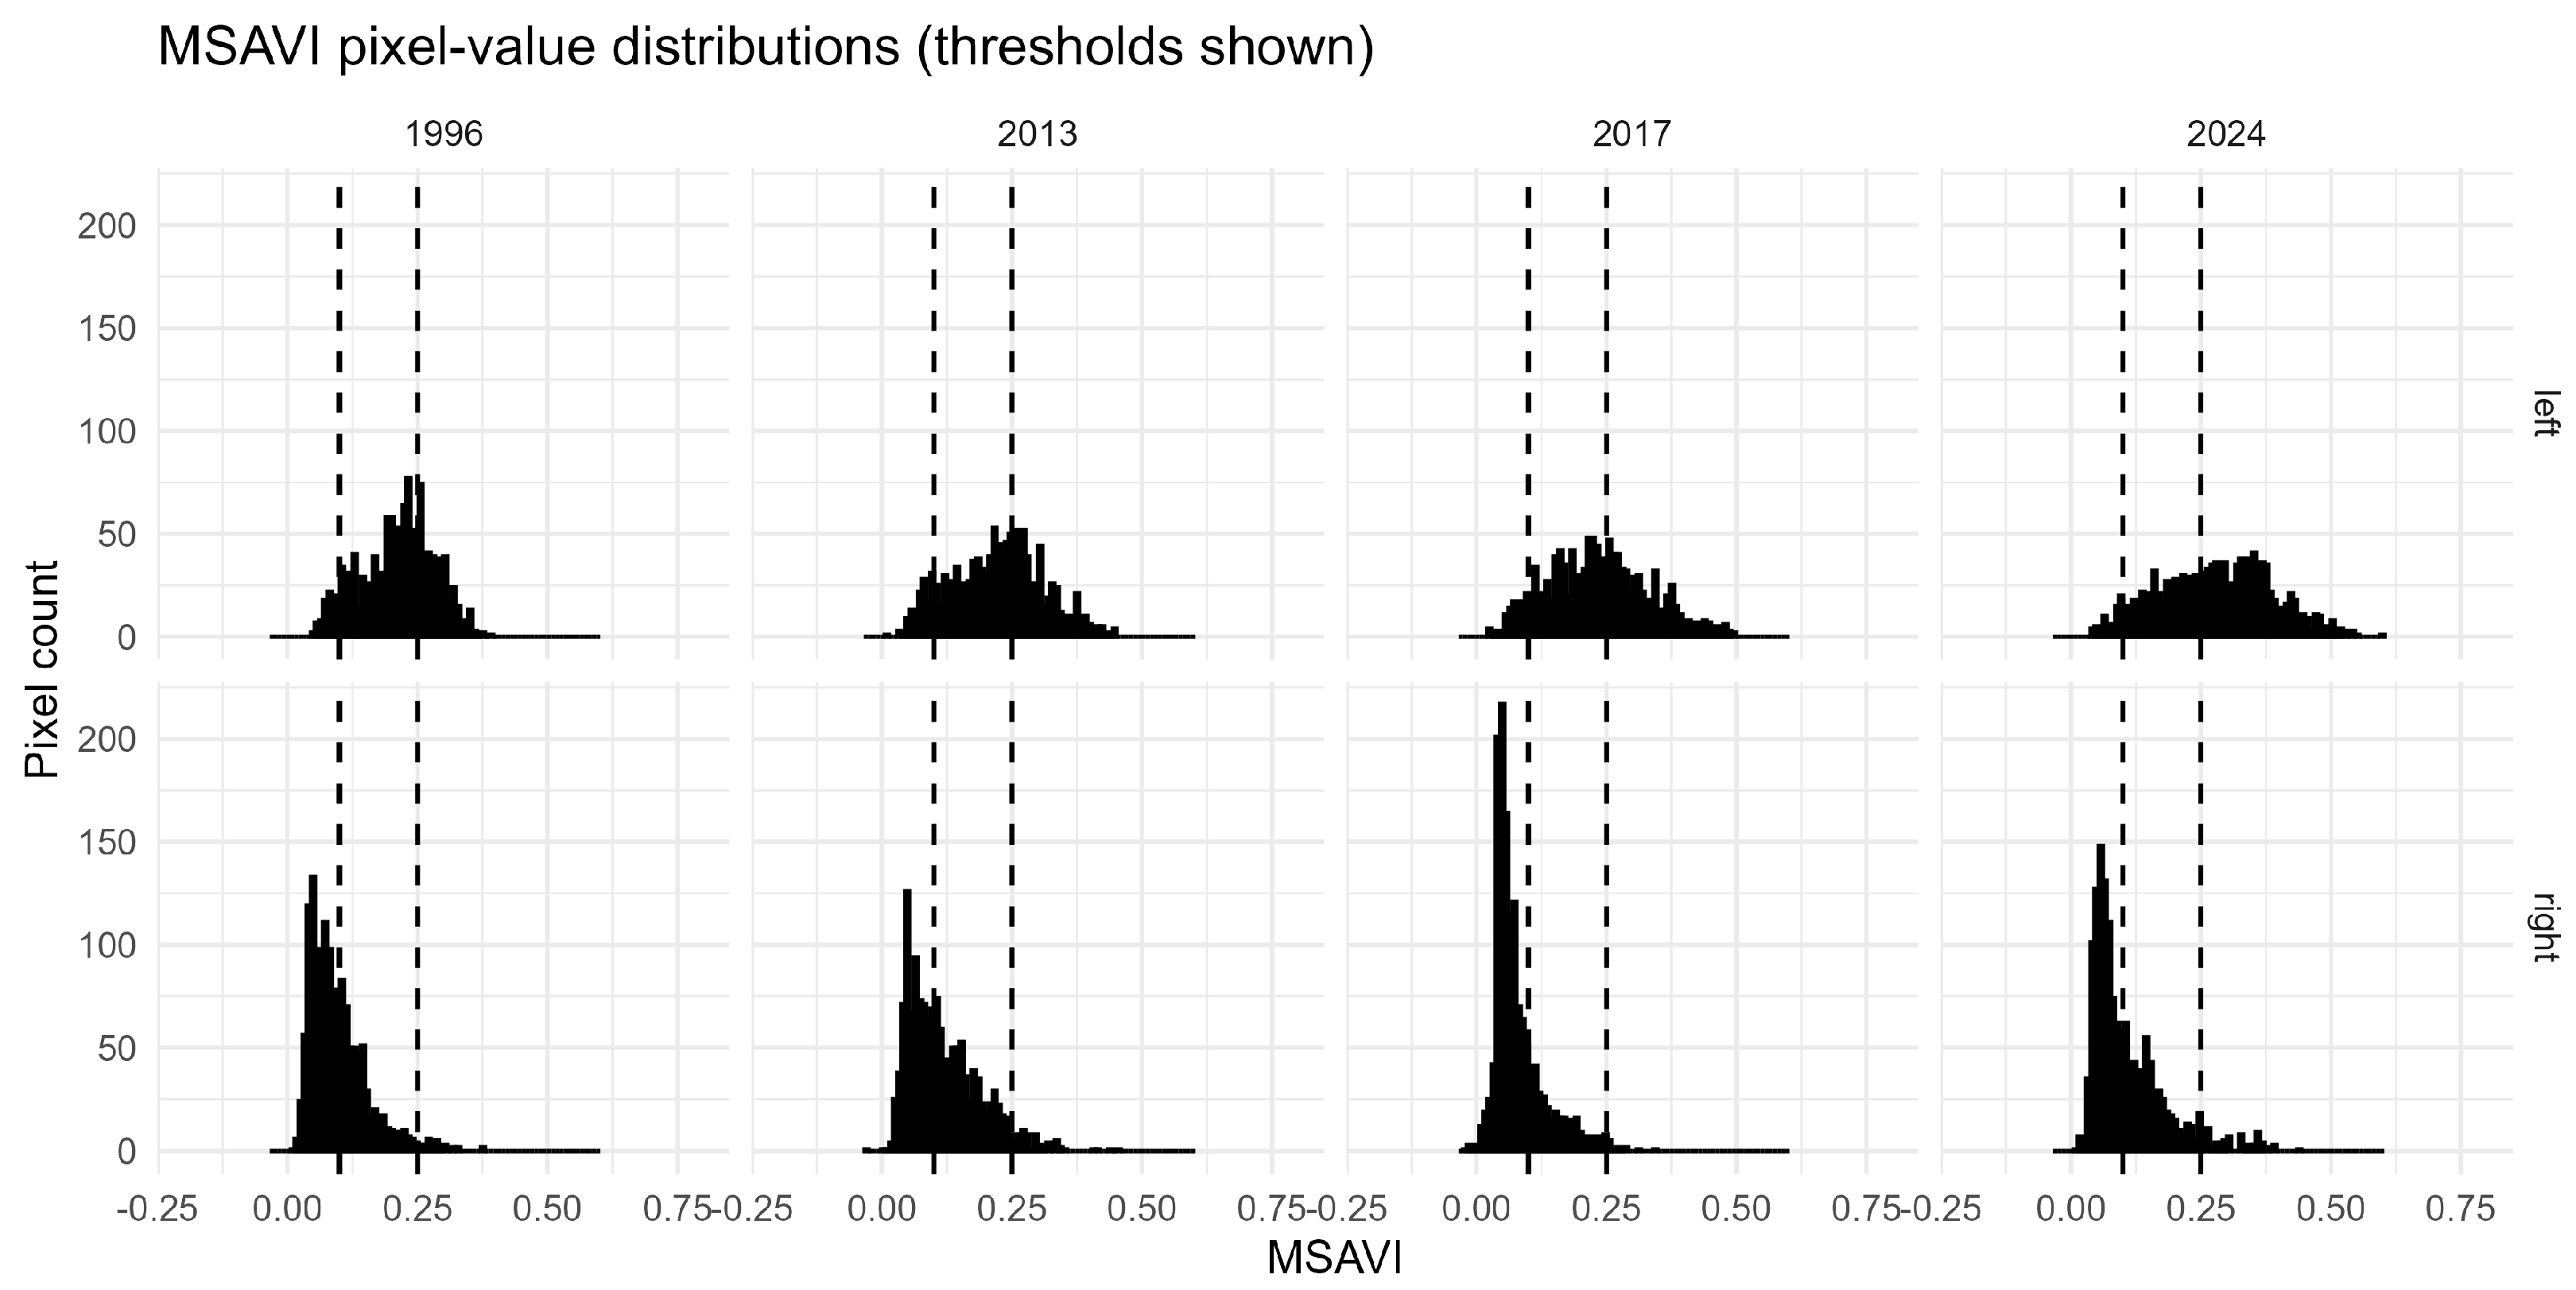
Figure A3.
Functional vegetation classes derived from MSAVI thresholds (1—bare/impervious, 2—low vegetation, 3—dense canopy) for selected representative years. Yellow marks the boundary of the left bank area, while pink marks the boundary of the right bank area.
References
- Prothi, A.; Mohankumar, V.; Jha, V. Understanding riverfront developments: Through time, function, and drivers for transformation. In Managing Urban Rivers; Shinde, V.R., Mishra, R.R., Bhonde, U., Vaidya, H., Eds.; Elsevier: Amsterdam, The Netherlands, 2024; pp. 73–88. [Google Scholar] [CrossRef] [Scilit]
- Jiang, G.; Zuo, L.; Asutosh, A.T.; Zhang, J. Environmental Sustainability Study of Urban Waterfront Landscapes Based on the LCA–Emergy–Carbon Footprint and Artificial Neural Network Method. Buildings 2024, 14, 386. [Google Scholar] [CrossRef] [Scilit]
- Simic, M.A.B. The Spatial Transformation of the River Waterfront through Three Historical Periods: A Case Study of Belgrade. J. Contemp. Urban Aff. 2020, 4, 27–36. [Google Scholar] [CrossRef] [Scilit]
- Ćorović, D.; Korać, S.T.; Milinković, M.M. Revisiting the Contested Case of Belgrade Waterfront Transformation: From Unethical Urban Governance to Landscape Degradation. Land 2025, 14, 988. [Google Scholar] [CrossRef] [Scilit]
- Oktay, D. Human Sustainable Urbanism: In Pursuit of Ecological and Social-Cultural Sustainability. Procedia-Soc. Behav. Sci. 2012, 36, 16–27. [Google Scholar] [CrossRef] [Scilit]
- Ostárek, M. Environmental urbanism and sustainable cities. IOP Conf. Ser. Earth Environ. Sci. 2021, 900, 012031. [Google Scholar] [CrossRef] [Scilit]
- Rethinking The Future. Riverfront Development: Revitalizing Waterfronts-RTF. Available online: https://www.re-thinkingthefuture.com/articles/riverfront-development/ (accessed on 6 September 2025).
- Marković, Đ.; Gvozdić, M.; Kosanović, S. Green Infrastructure and Climate Resilience of Urban Neighborhoods: What Can the Citizens Do Together? Buildings 2025, 15, 446. [Google Scholar] [CrossRef] [Scilit]
- Kosanović, S.; Marković, Đ.; Stamenković, M. New Belgrade’s Thermal Mosaic: Investigating Climate Performance in Urban Heritage Blocks Beyond Coverage Ratios. Atmosphere 2025, 16, 935. [Google Scholar] [CrossRef] [Scilit]
- Jepson, E.J.; Edwards, M.M. How Possible is Sustainable Urban Development? An Analysis of Planners’ Perceptions about New Urbanism, Smart Growth and the Ecological City. Plan. Pract. Res. 2010, 25, 417–437. [Google Scholar] [CrossRef] [Scilit]
- Naess, P. Urban planning and sustainable development. Eur. Plan. Stud. 2001, 9, 503–524. [Google Scholar] [CrossRef] [Scilit]
- Capobianco, V.; Robinson, K.; Kalsnes, B.; Ekeheien, C.; Høydal, Ø. Hydro-Mechanical Effects of Several Riparian Vegetation Combinations on the Streambank Stability—A Benchmark Case in Southeastern Norway. Sustainability 2021, 13, 4046. [Google Scholar] [CrossRef] [Scilit]
- Wang, R.; Helbich, M.; Yao, Y.; Zhang, J.; Liu, P.; Yuan, Y.; Liu, Y. Urban Greenery and Mental Wellbeing in Adults: Cross-Sectional Mediation Analyses on Multiple Pathways across Different Greenery Measures. Environ. Res. 2019, 177, 108535. [Google Scholar] [CrossRef] [Scilit]
- Camporeale, C.; Perucca, E.; Ridolfi, L.; Gurnell, A. Modeling the Interactions between River Morphodynamics and Riparian Vegetation. Rev. Geophys. 2013, 51, 379–414. [Google Scholar] [CrossRef] [Scilit]
- Sun, P.; Hou, R.; Lynch, J.P. Measuring the Utilization of Public Open Spaces by Deep Learning: A Benchmark Study at the Detroit Riverfront. In Proceedings of the IEEE/CVF Winter Conference on Applications of Computer Vision (WACV); IEEE: New York, NY, USA, 2020; pp. 2217–2226. [Google Scholar] [CrossRef] [Scilit]
- Hoffimann, E.; Barros, H.; Ribeiro, A.I. Socioeconomic Inequalities in Green Space Quality and Accessibility—Evidence from a Southern European City. Int. J. Environ. Res. Public Health 2017, 14, 916. [Google Scholar] [CrossRef] [Scilit]
- Jun, J.; Song, M. Study on the Redevelopment of the Hangang River Waterfront from an Urban Resilience Perspective. Sustainability 2023, 15, 14249. [Google Scholar] [CrossRef] [Scilit]
- Yan, C.; Cai, X.; Wu, Y.; Tang, X.; Zhou, Y.; Yang, Q.; Li, F.; Lan, S.; Lin, L. How do urban waterfront landscape characteristics influence people’s emotional benefits? Mediating effects of water-friendly environmental preferences. Forests 2024, 15, 25. [Google Scholar] [CrossRef] [Scilit]
- Popescu, C.; Oprina-Pavelescu, M.; Dinu, V.; Cazacu, C.; Burdon, F.J.; Forio, M.A.E.; Kupilas, B.; Friberg, N.; Goethals, P.; McKie, B.G.; et al. Riparian Vegetation Structure Influences Terrestrial Invertebrate Communities in an Agricultural Landscape. Water 2021, 13, 188. [Google Scholar] [CrossRef] [Scilit]
- Rusnák, M.; Goga, T.; Michaleje, L.; Šulc Michalková, M.; Máčka, Z.; Bertalan, L.; Kidová, A. Remote Sensing of Riparian Ecosystems. Remote Sens. 2022, 14, 2645. [Google Scholar] [CrossRef] [Scilit]
- Tavares, P.A.; Beltrão, N.; Guimarães, U.S.; Teodoro, A.; Gonçalves, P. Urban Ecosystem Services Quantification through Remote Sensing Approach: A Systematic Review. Environments 2019, 6, 51. [Google Scholar] [CrossRef] [Scilit]
- Srdjevic, B.; Lakicevic, M.; Srdjevic, Z. Fuzzy AHP Assessment of Urban Parks Quality and Importance in Novi Sad City, Serbia. Forests 2023, 14, 1227. [Google Scholar] [CrossRef] [Scilit]
- Miletić, M.; Komatina, D.; Ružičić, M.M. Climate Responsive Green Building Strategies in Circular Cities: A Comparative Study for Two Regions. Sustainability 2025, 17, 3469. [Google Scholar] [CrossRef] [Scilit]
- Ružičić, M.M.; Miletić, M.; Dobrota, M. Does a National Innovation System Encourage Sustainability? Lessons from the Construction Industry in Serbia. Sustainability 2021, 13, 3591. [Google Scholar] [CrossRef] [Scilit]
- Petrtýlová, R.; Jaššo, M. Towards a New Typology for Classifying Urban Riverfront Character Sections: Insights from European Cities. Eur. XXI 2024, 47, 63–85. [Google Scholar] [CrossRef] [Scilit]
- Nowacka-Rejzner, U. River and Riverside Areas-in the Context of Shaping the Urban Space-Case Study. IOP Conf. Ser. Mater. Sci. Eng. 2019, 471, 112088. [Google Scholar]
- Bulatović, S.; Đukić, A. Modern Transformations of City Riverfront—Comparison of the Riverfronts of Belgrade and Zagreb. In Proceedings of the ICUP 2022, 4rd International Conference on Urban Planning, Niš, Serbia, 9–10 November 2022; Faculty of Civil Engineering and Architecture, University of Nis: Niš, Serbia, 2022; pp. 1–8. [Google Scholar]
- Corine Land Cover. Available online: https://www.eea.europa.eu/en/datahub/datahubitem-view/a5144888-ee2a-4e5d-a7b0-2bbf21656348 (accessed on 6 September 2025).
- Perić, A.; Maruna, M. Post-socialist discourse of urban megaproject development: From City on the Water to Belgrade Waterfront. Cities 2022, 130, 103876. [Google Scholar] [CrossRef] [Scilit]
- ISPGAYA. Available online: https://ispgaya.pt/pt/vida-academica/noticias/building-healthier-communities-initiatives-in-the-porto-metropolitan-area-portugal (accessed on 23 October 2025).
- Čamprag, N. Effects and Consequences of Authoritarian Urbanism: Large-Scale Waterfront Redevelopments in Belgrade, Zagreb, and Novi Sad. Urban Plan. 2024, 9, 7589. [Google Scholar] [CrossRef] [Scilit]
- Roggema, R. The future of sustainable urbanism: A redefinition. City Territ. Archit. 2016, 3, 22. [Google Scholar] [CrossRef] [Scilit]
- Yamahaki, C.; Marchewitz, C. Collaborative investor engagement with policymakers: Changing the rules of the game? Qual. Res. Financ. Mark. 2025, 17, 21–40. [Google Scholar] [CrossRef] [Scilit]
- Zeković, S.; Maričić, T. Contemporary governance of urban mega-projects: A case study of the Belgrade waterfront. Territ. Polit. Gov. 2022, 10, 527–548. [Google Scholar] [CrossRef] [Scilit]
- Lalovic, K.; Radosavljevic, U.; Djukanovic, Z. Reframing public interest in the implementation of large urban projects in Serbia: The case of Belgrade Waterfront Project. Facta Univ.-Ser. Archit. Civ. Eng. 2015, 13, 35–46. [Google Scholar] [CrossRef] [Scilit]
- Grubbauer, M.; Čamprag, N. Urban megaprojects, nation-state politics and regulatory capitalism in Central and Eastern Europe: The Belgrade Waterfront project. Urban Stud. 2019, 56, 649–671. [Google Scholar] [CrossRef] [Scilit]
- Zeković, S.; Perić, A.; Hadžić, M. The financialization of ‘the urban’ in the post-socialist Serbia: Evidence from the Belgrade Waterfront megaproject. J. Urban Aff. 2025, 47, 1579–1598. [Google Scholar] [CrossRef] [Scilit]
- U.S. Geological Survey (USGS). Landsat Collection 2 Level-2 Surface Reflectance Products; U.S. Geological Survey (USGS): Reston, VA, USA, 2023. Available online: https://www.usgs.gov/landsat-missions (accessed on 17 October 2025).
- Esri. World Imagery Wayback Archive; Esri Living Atlas of the World: Redlands, CA, USA, 2024; Available online: https://livingatlas.arcgis.com/wayback/ (accessed on 17 October 2025).
- Yassin, A.B.M.; Bond, S.; McDonagh, J. Principles For Sustainable Riverfront Development For Malaysia. J. Technol.-Soc. 2012, 4. Available online: https://penerbit.uthm.edu.my/ojs/index.php/JTS/article/view/1347 (accessed on 22 October 2025).
- Chittoor Viswanathan, V.; Schirmer, M. Water quality deterioration as a driver for river restoration: A review of case studies from Asia, Europe and North America. Environ. Earth Sci. 2015, 74, 3145–3158. [Google Scholar] [CrossRef] [Scilit]
- Jabareen, Y.R. Sustainable Urban Forms. J. Plan. Educ. Res. 2006, 26, 38–52. [Google Scholar] [CrossRef] [Scilit]
- Beatley, T.; Newman, P. Biophilic Cities Are Sustainable, Resilient Cities. Sustainability 2013, 5, 3328–3345. [Google Scholar] [CrossRef] [Scilit]
- Sönmez, B.E. A Research on Urban Identity: Sample of Kadikoy District. J. Contemp. Urban Aff. 2020, 4, 21–32. [Google Scholar] [CrossRef] [Scilit]
- Pazzini, M.; Corticelli, R.; Lantieri, C.; Mazzoli, C. Multi-Criteria Analysis and Decision-Making Approach for the Urban Regeneration: The Application to the Rimini Canal Port (Italy). Sustainability 2022, 15, 772. [Google Scholar] [CrossRef] [Scilit]
- Kabir, K.H.; Khan, M.A. Rethinking urban development. In Making Sense of Planning and Development for the Post-Pandemic Cities; Springer: Singapore, 2024; p. 261. [Google Scholar]
- Newman, P.; Beatley, T.; Boyer, H. ‘Urban Resilience: Cities of Fear and Hope’: From Resilient Cities: Responding to Peak Oil and Climate Change (2009). In The Urban Design Reader; Routledge: Oxfordshire, UK, 2013; pp. 569–579. [Google Scholar] [CrossRef] [Scilit]
- Urbanization and Global Environmental Change: Local Effects of Urban Warming on JSTOR. Available online: https://www.jstor.org/stable/30113496 (accessed on 8 September 2025).
- CTD. Climate Change. Available online: https://crossing-the-divide.org/materials/climate-change (accessed on 31 October 2025).
- Dewi, L.M.R.R.; Suartika, G.A.M.; Saputra, K.E. Riverfront development—A public realm, its adaptations, and environmental impacts. IOP Conf. Ser. Earth Environ. Sci. 2021, 903, 012013. [Google Scholar] [CrossRef] [Scilit]
- Shaw, B. History at the water’s edge. In Waterfronts in Post-Industrial Cities; Marshall, R., Ed.; Taylor & Francis: London, UK, 2004; pp. 168–180. [Google Scholar] [CrossRef] [Scilit]
- Zou, H.; Ge, J.; Cai, Y.; Wang, X.; Duan, X. Effect of riverfront utilization transitions on riparian water quality in the middle-lower Yangtze River. J. Environ. Manag. 2025, 380, 124960. [Google Scholar] [CrossRef] [Scilit]
- Hobbie, S.E.; Grimm, N.B. Nature-based approaches to managing climate change impacts in cities. Philos. Trans. R. Soc. B 2020, 375, 20190124. [Google Scholar] [CrossRef] [Scilit]
- Goodwin, S.; Olazabal, M.; Castro, A.J.; Pascual, U. Global mapping of urban nature-based solutions for climate change adaptation. Nat. Sustain. 2023, 6, 458–469. [Google Scholar] [CrossRef] [Scilit]
- Gimona, A.; Messager, P.; Occhi, M. CORINE-based landscape indices weakly correlate with plant species richness in a northern European landscape transect. Landsc. Ecol. 2009, 24, 53–64. [Google Scholar] [CrossRef] [Scilit]
- Srdjevic, B.; Srdjevic, Z.; Lakicevic, M. Urban greening and provisioning of ecosystem services within hesitant decision making framework. Urban For. Urban Green. 2019, 43, 126371. [Google Scholar] [CrossRef] [Scilit]
- Srdjevic, B.; Srdjevic, Z.; Lakicevic, M. Validating the importance of criteria for assessing climate change scenarios. J. Water Clim. Change 2018, 9, 570–583. [Google Scholar] [CrossRef] [Scilit]
- Stoica, I.V.; Vîrghileanu, M.; Zamfir, D.; Mihai, B.A.; Săvulescu, I. Comparative Assessment of the Built-Up Area Expansion Based on Corine Land Cover and Landsat Datasets: A Case Study of a Post-Socialist City. Remote Sens. 2020, 12, 2137. [Google Scholar] [CrossRef] [Scilit]
- CORINE Land Cover—Copernicus Land Monitoring Service. Available online: https://land.copernicus.eu/en/products/corine-land-cover (accessed on 22 October 2025).
- Ana, F.S. Animation of Land Cover Changes from 1990 to 2018 Using CORINE Data in Paris, France; Zenodo: Geneva, Switzerland, 2024. [Google Scholar] [CrossRef]
- Huntington, J.L.; Hegewisch, K.C.; Daudert, B.; Morton, C.G.; Abatzoglou, J.T.; McEvoy, D.J.; Erickson, T. Climate engine: Cloud computing and visualization of climate and remote sensing data for advanced natural resource monitoring and process understanding. Bull. Am. Meteorol. Soc. 2017, 98, 2397–2410. [Google Scholar] [CrossRef] [Scilit]
- Roy, D.P.; Kovalskyy, V.; Zhang, H.K.; Vermote, E.F.; Yan, L.; Kumar, S.S.; Egorov, A. Characterization of Landsat-7 to Landsat-8 reflective wavelength and normalized difference vegetation index continuity. Remote Sens. Environ. 2016, 185, 57–70. [Google Scholar] [CrossRef] [Scilit]
- Qi, J.; Chehbouni, A.; Huete, A.R.; Kerr, Y.H.; Sorooshian, S. A modified soil adjusted vegetation index. Remote Sens. Environ. 1994, 48, 119–126. [Google Scholar] [CrossRef] [Scilit]
- Kareem, H.; Attaee, M.; Omran, Z. Evaluation the Soil-Adjusted Vegetation Indices SAVI and MSAVI for Bristol City, United Kingdom using Landsat 8-OLI Through Geospatial Technology. Ecol. Eng. Environ. Technol. 2023, 24, 89–97. [Google Scholar] [CrossRef] [Scilit]
- Novando, G.; Arif, D.A. Comparison of soil adjusted vegetation index (SAVI) and modified soil adjusted vegetation index (MSAVI) methods to view vegetation density in Padang city using Landsat 8 image. Int. Remote Sens. Appl. J. 2023, 2, 31–36. [Google Scholar] [CrossRef] [Scilit]
- Rondeaux, G.; Steven, M.; Baret, F. Optimization of soil-adjusted vegetation indices. Remote Sens. Environ. 1996, 55, 95–107. [Google Scholar] [CrossRef] [Scilit]
- Haboudane, D.; Miller, J.R.; Pattey, E.; Zarco-Tejada, P.J.; Strachan, I.B. Hyperspectral vegetation indices and novel algorithms for predicting green LAI of crop canopies: Modeling and validation in the context of precision agriculture. Remote Sens. Environ. 2004, 90, 337–352. [Google Scholar] [CrossRef] [Scilit]
- Ogwu, M.C.; Kosoe, E.A. Integrating green infrastructure into sustainable agriculture to enhance soil health, biodiversity, and microclimate resilience. Sustainability 2025, 17, 3838. [Google Scholar] [CrossRef] [Scilit]
- Lekić, O.; Miletić, M.; Fikfak, A. Healthy places in the built environment. In Sustainability and Resilience Socio-Spatial Perspective; TU Delft Open: Delft, The Netherlands, 2018; pp. 217–230. [Google Scholar]
- Karadžić, B.; Jarić, S.; Pavlović, P.; Mitrović, M. Aquatic and Wetland Vegetation Along the Sava River. Handb. Environ. Chem. 2015, 31, 249–316. [Google Scholar] [CrossRef] [Scilit]
- Jokanović, D.; Desimirović, I.; Živanović, K. Taxonomy and phytogeography analysis of medicinal plants within forest complex of pedunculate oak at the area of Gornji Srem. Topola 2022, 210, 5–14. [Google Scholar] [CrossRef] [Scilit]
- Stefańska-Krzaczek, E.; Pech, P. Vegetation diversity of the Scots pine stands in different forest sites in the Turawa Forest District. For. Res. Pap. 2014, 75, 77–87. [Google Scholar] [CrossRef] [Scilit]
- Balázs, K.; Csilla, B. White Poplar Riparian Forests Along the Rába River, Hungary (Senecioni sarracenici-Populetum albae Kevey in Borhidi & Kevey 1996); Repository of the Academy’s Library: Budapest, Hungary, 2018; Available online: https://real.mtak.hu/91589/ (accessed on 23 October 2025).
- Vukelić, J.; Korijan, P.; Šapić, I.; Alegro, A.; Šegota, V.; Poljak, I. Forest vegetation of hardwood tree species along the Mirna River in Istria (Croatia). South-East. Eur. For. 2018, 9, 1–16. [Google Scholar] [CrossRef] [Scilit]
- Lakicevic, M.; Reynolds, K.M.; Orlovic, S.; Kolarov, R. Measuring dendrofloristic diversity in urban parks in Novi Sad (Serbia). Trees For. People 2022, 8, 100239. [Google Scholar] [CrossRef] [Scilit]
- Lakicevic, M.; Srdjevic, B. An Approach to Developing the Multicriteria Optimal Forest Management Plan: The ‘Fruska Gora’ National Park Case Study. Land 2022, 11, 1671. [Google Scholar] [CrossRef] [Scilit]
- Evans, C.; Harris, M.S.; Taufen, A.; Livesley, S.J.; Crommelin, L. What does it mean for a transitioning urban waterfront to “work” from a sustainability perspective? J. Urban Int. Res. Placemaking Urban Sustain. 2025, 18, 349–372. [Google Scholar] [CrossRef] [Scilit]
- Tan, D.Y.; Woo, S.W.; Wong, Y.C. Enhancing economic, social, and ecological resilience through sustainable waterfront development in Penang. J. Urban Dev. Manag. 2024, 3, 176–187. [Google Scholar] [CrossRef] [Scilit]
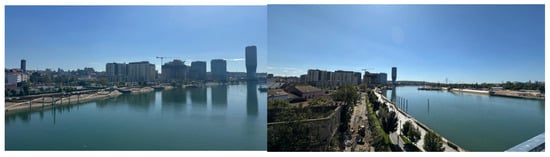
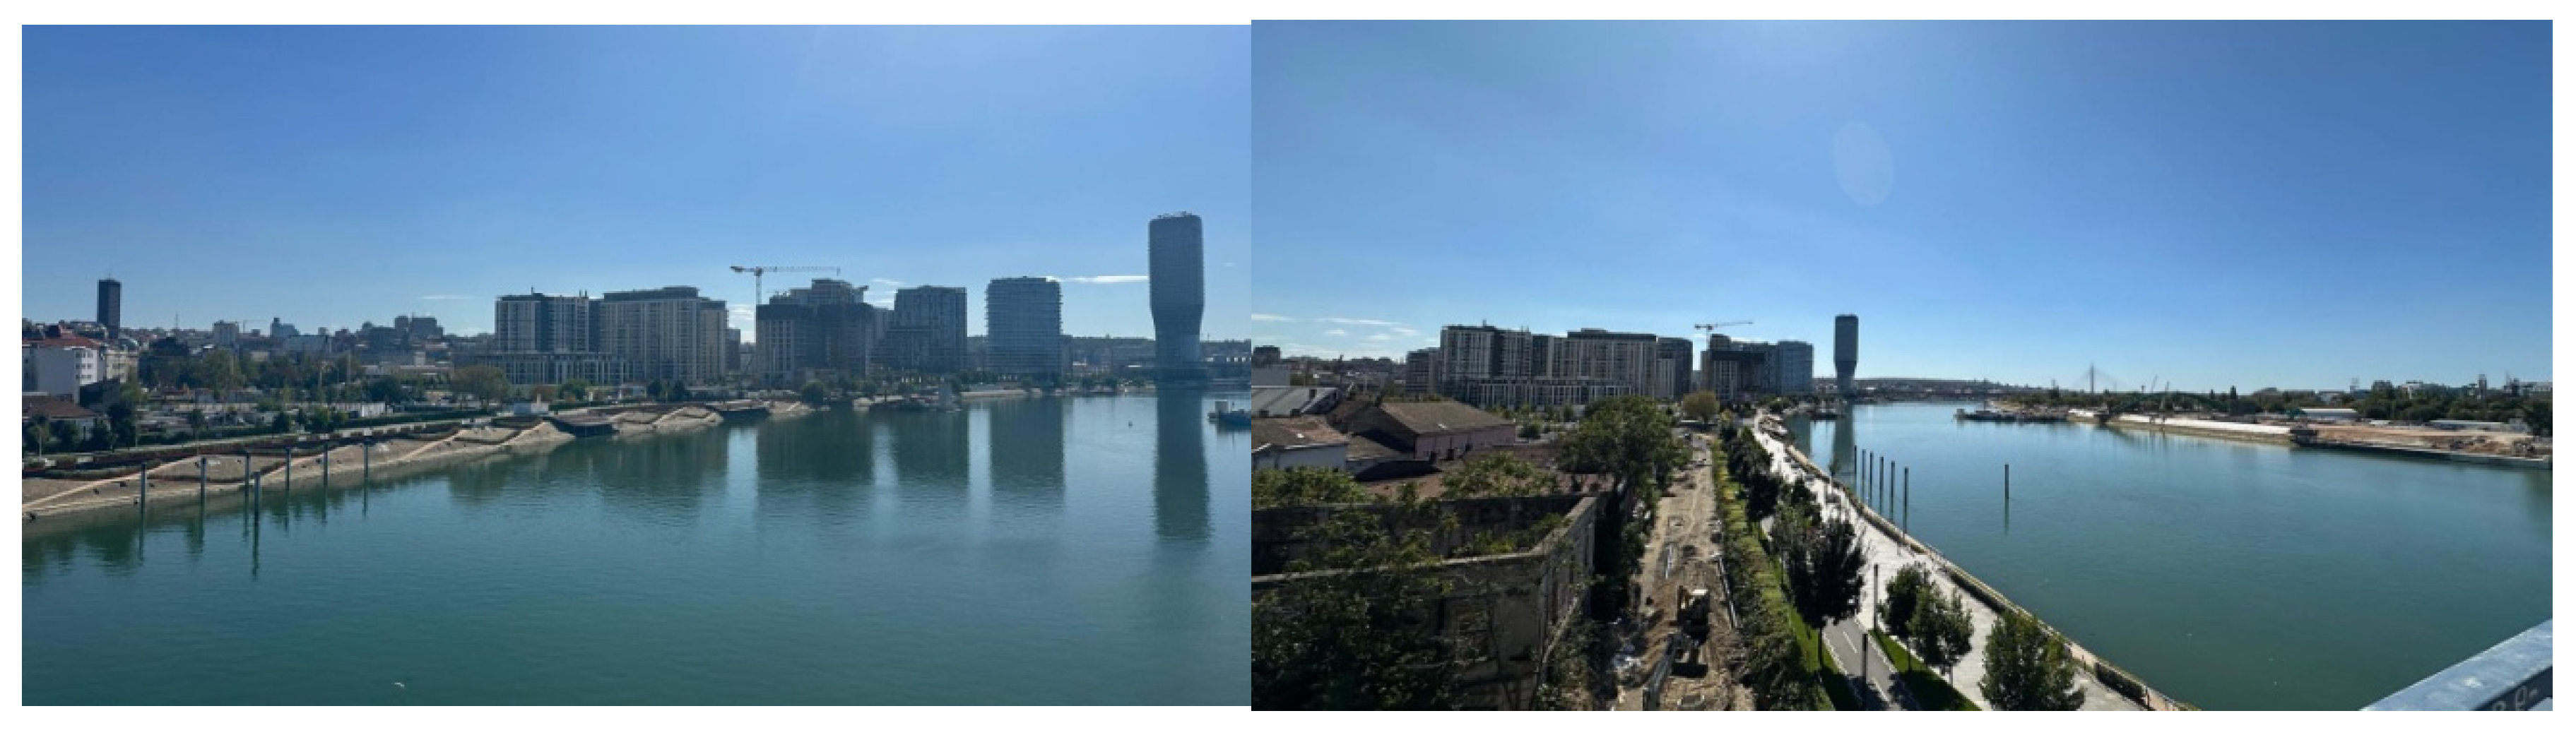
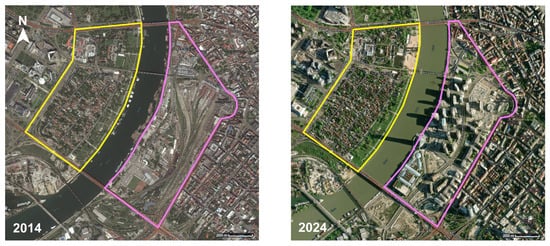
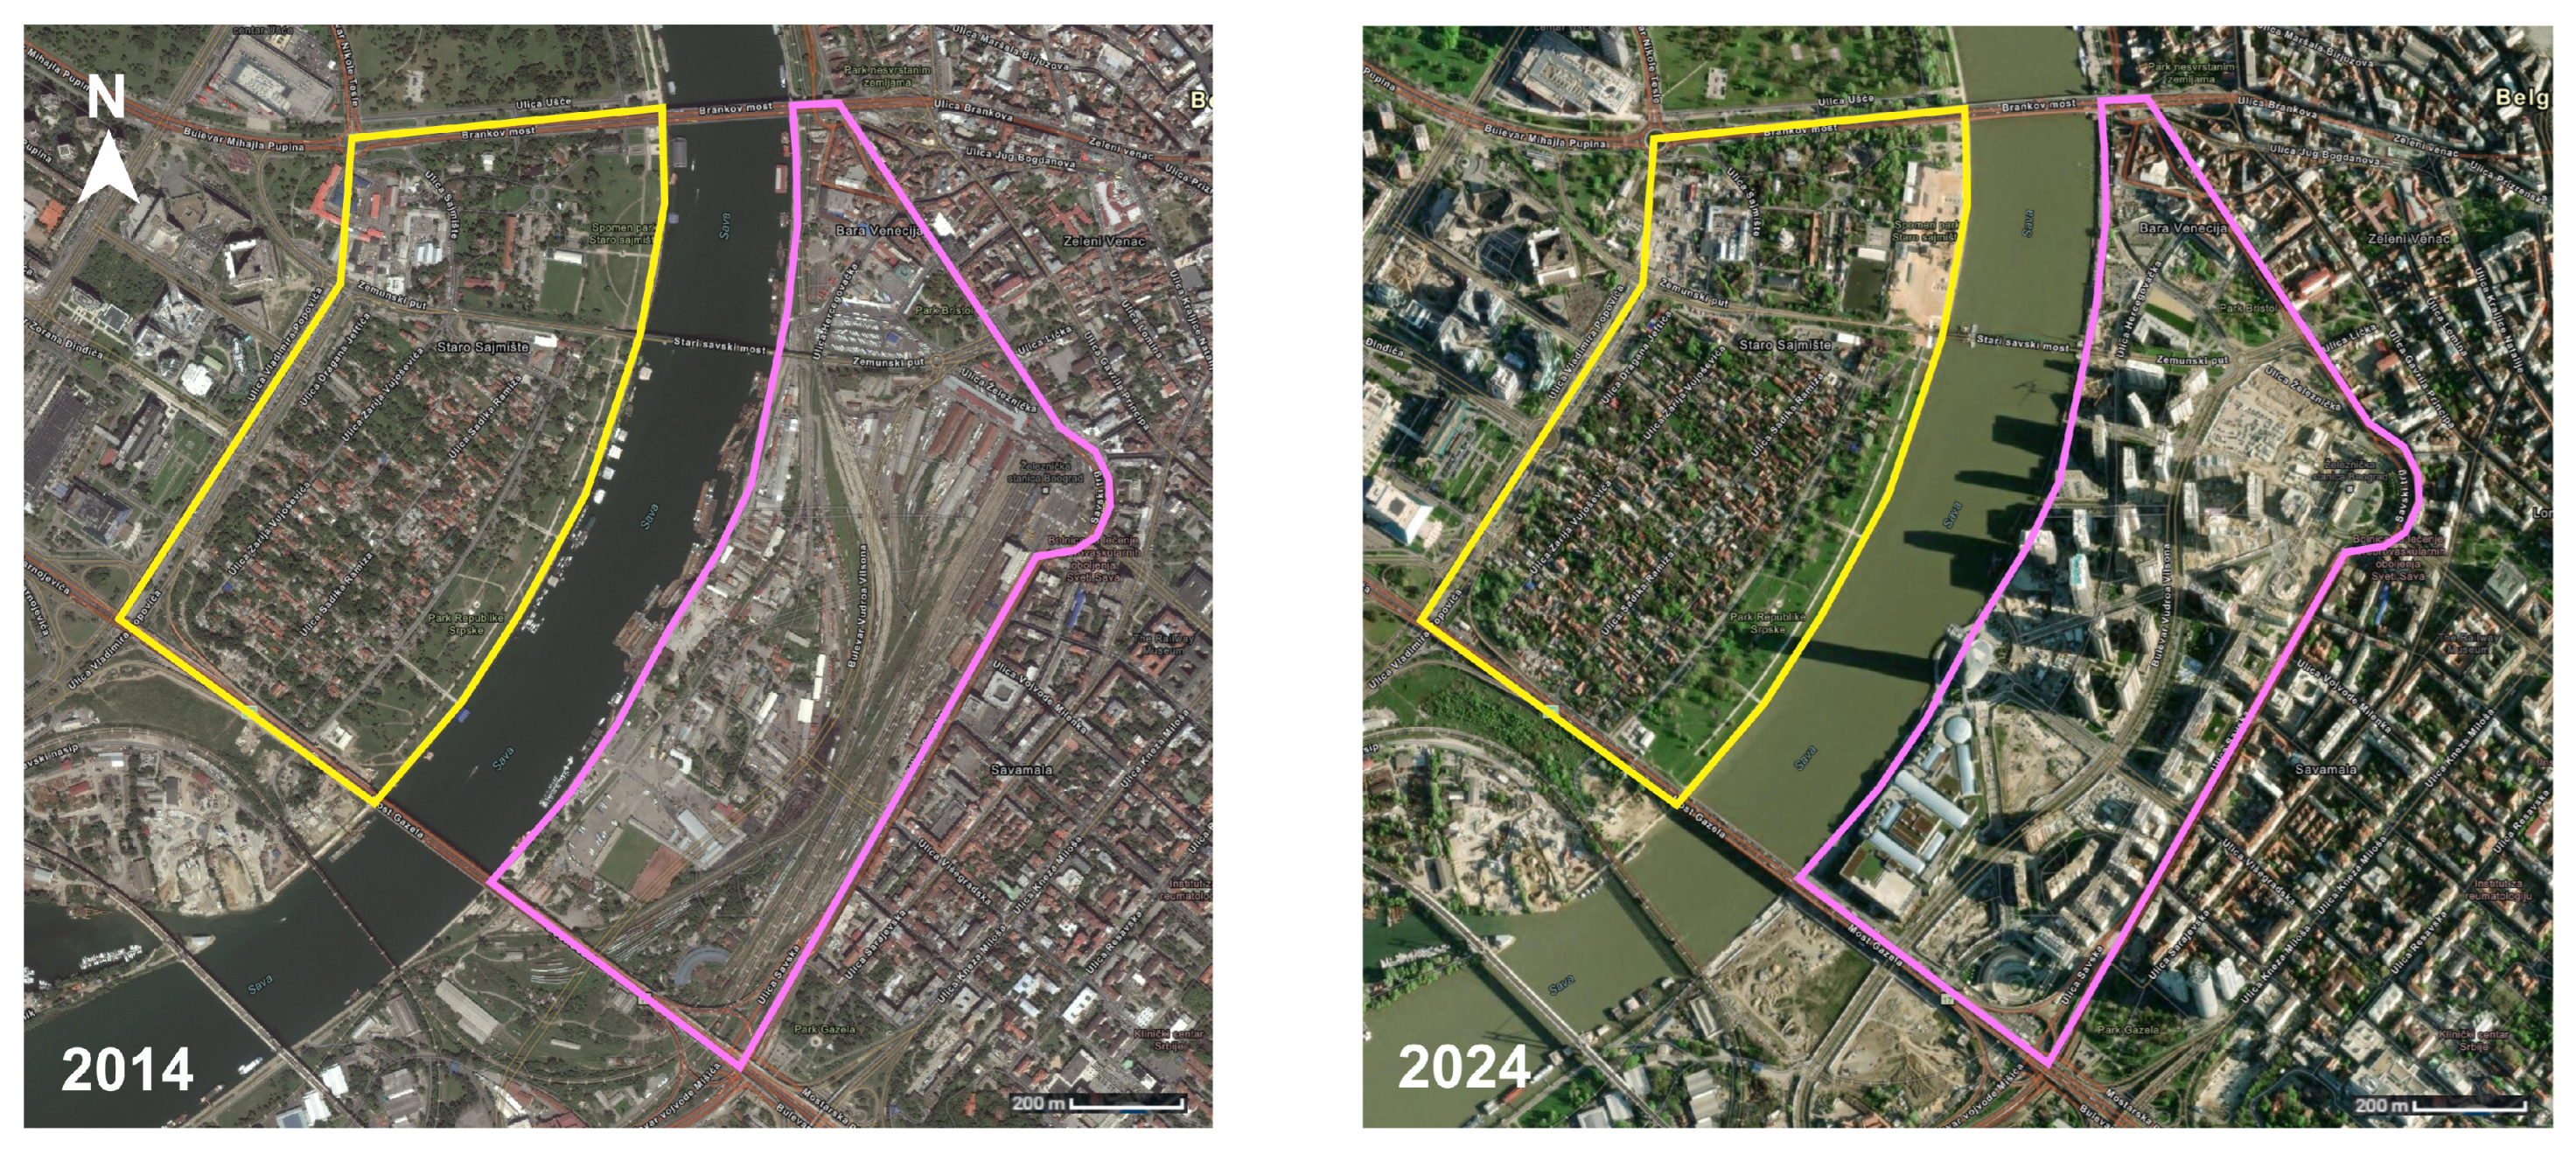
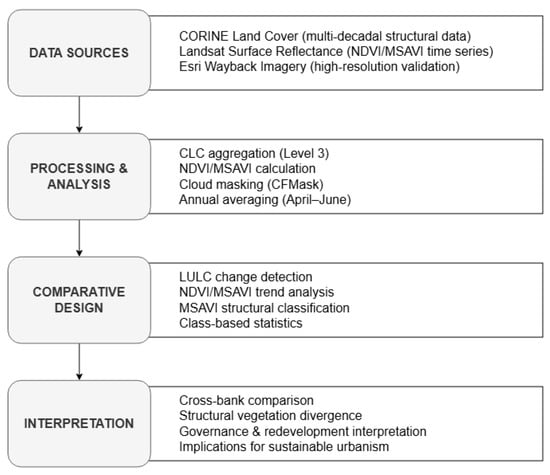
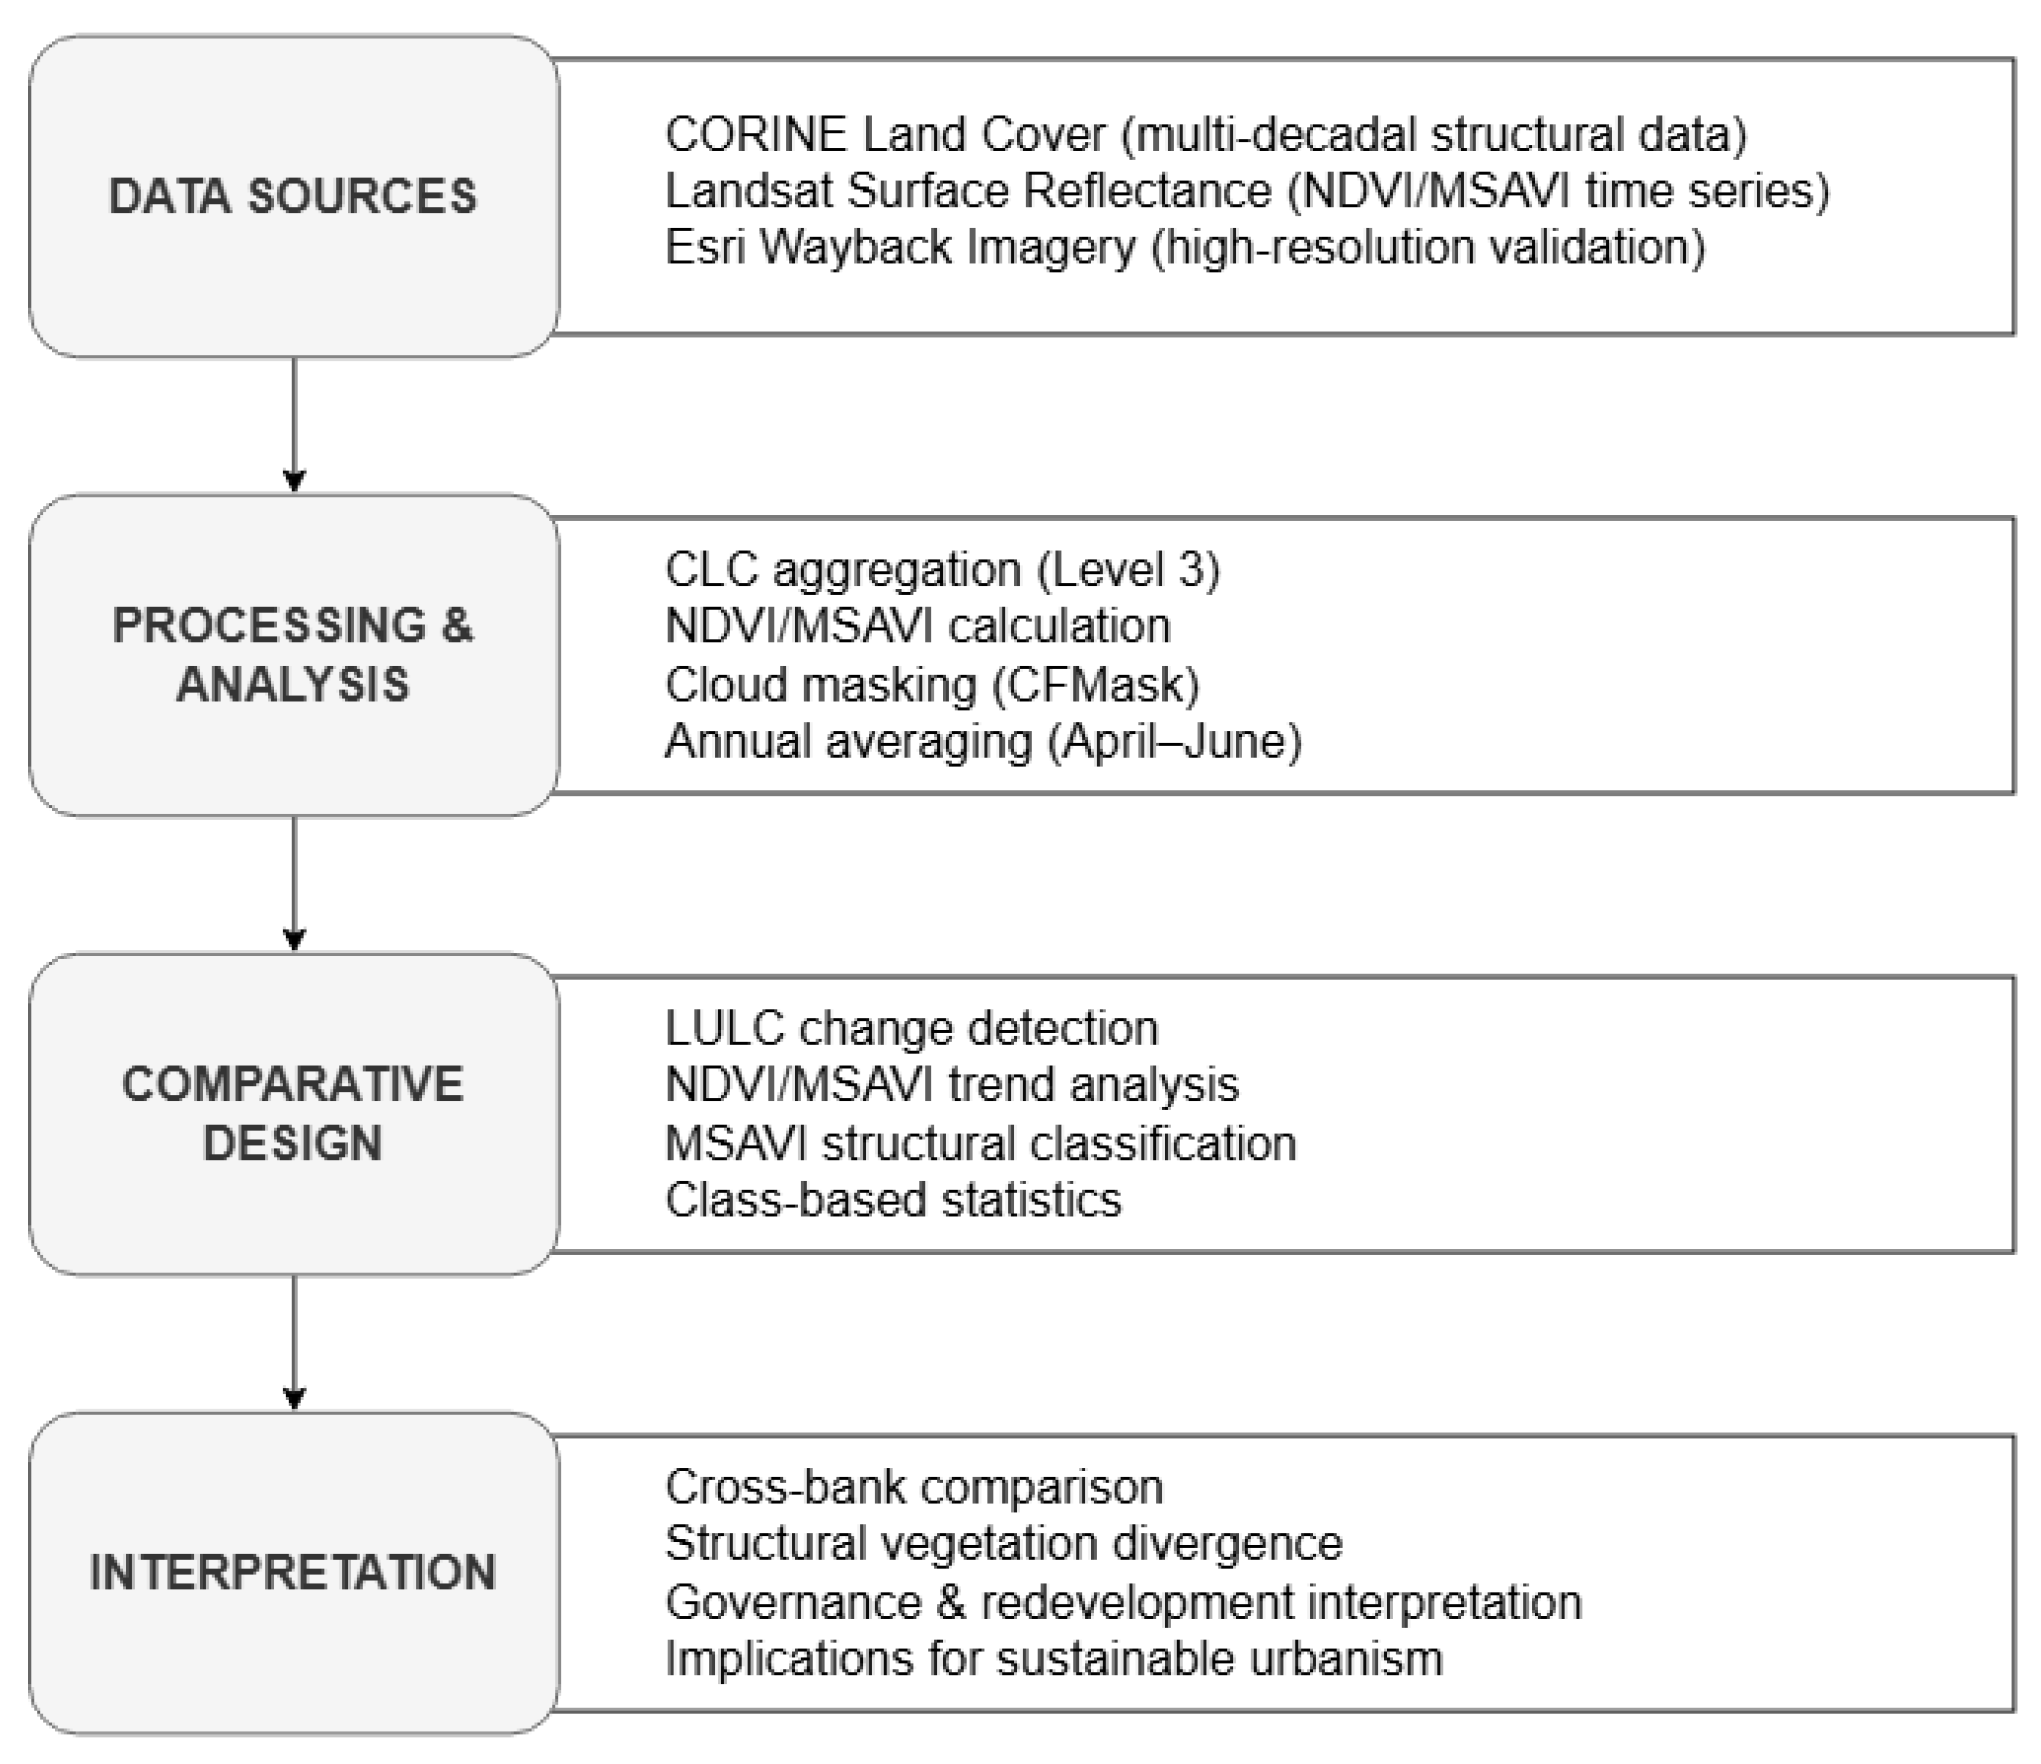
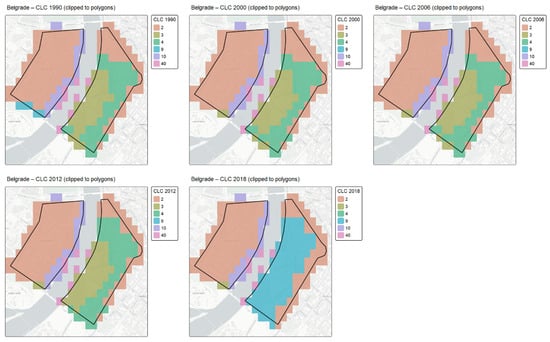
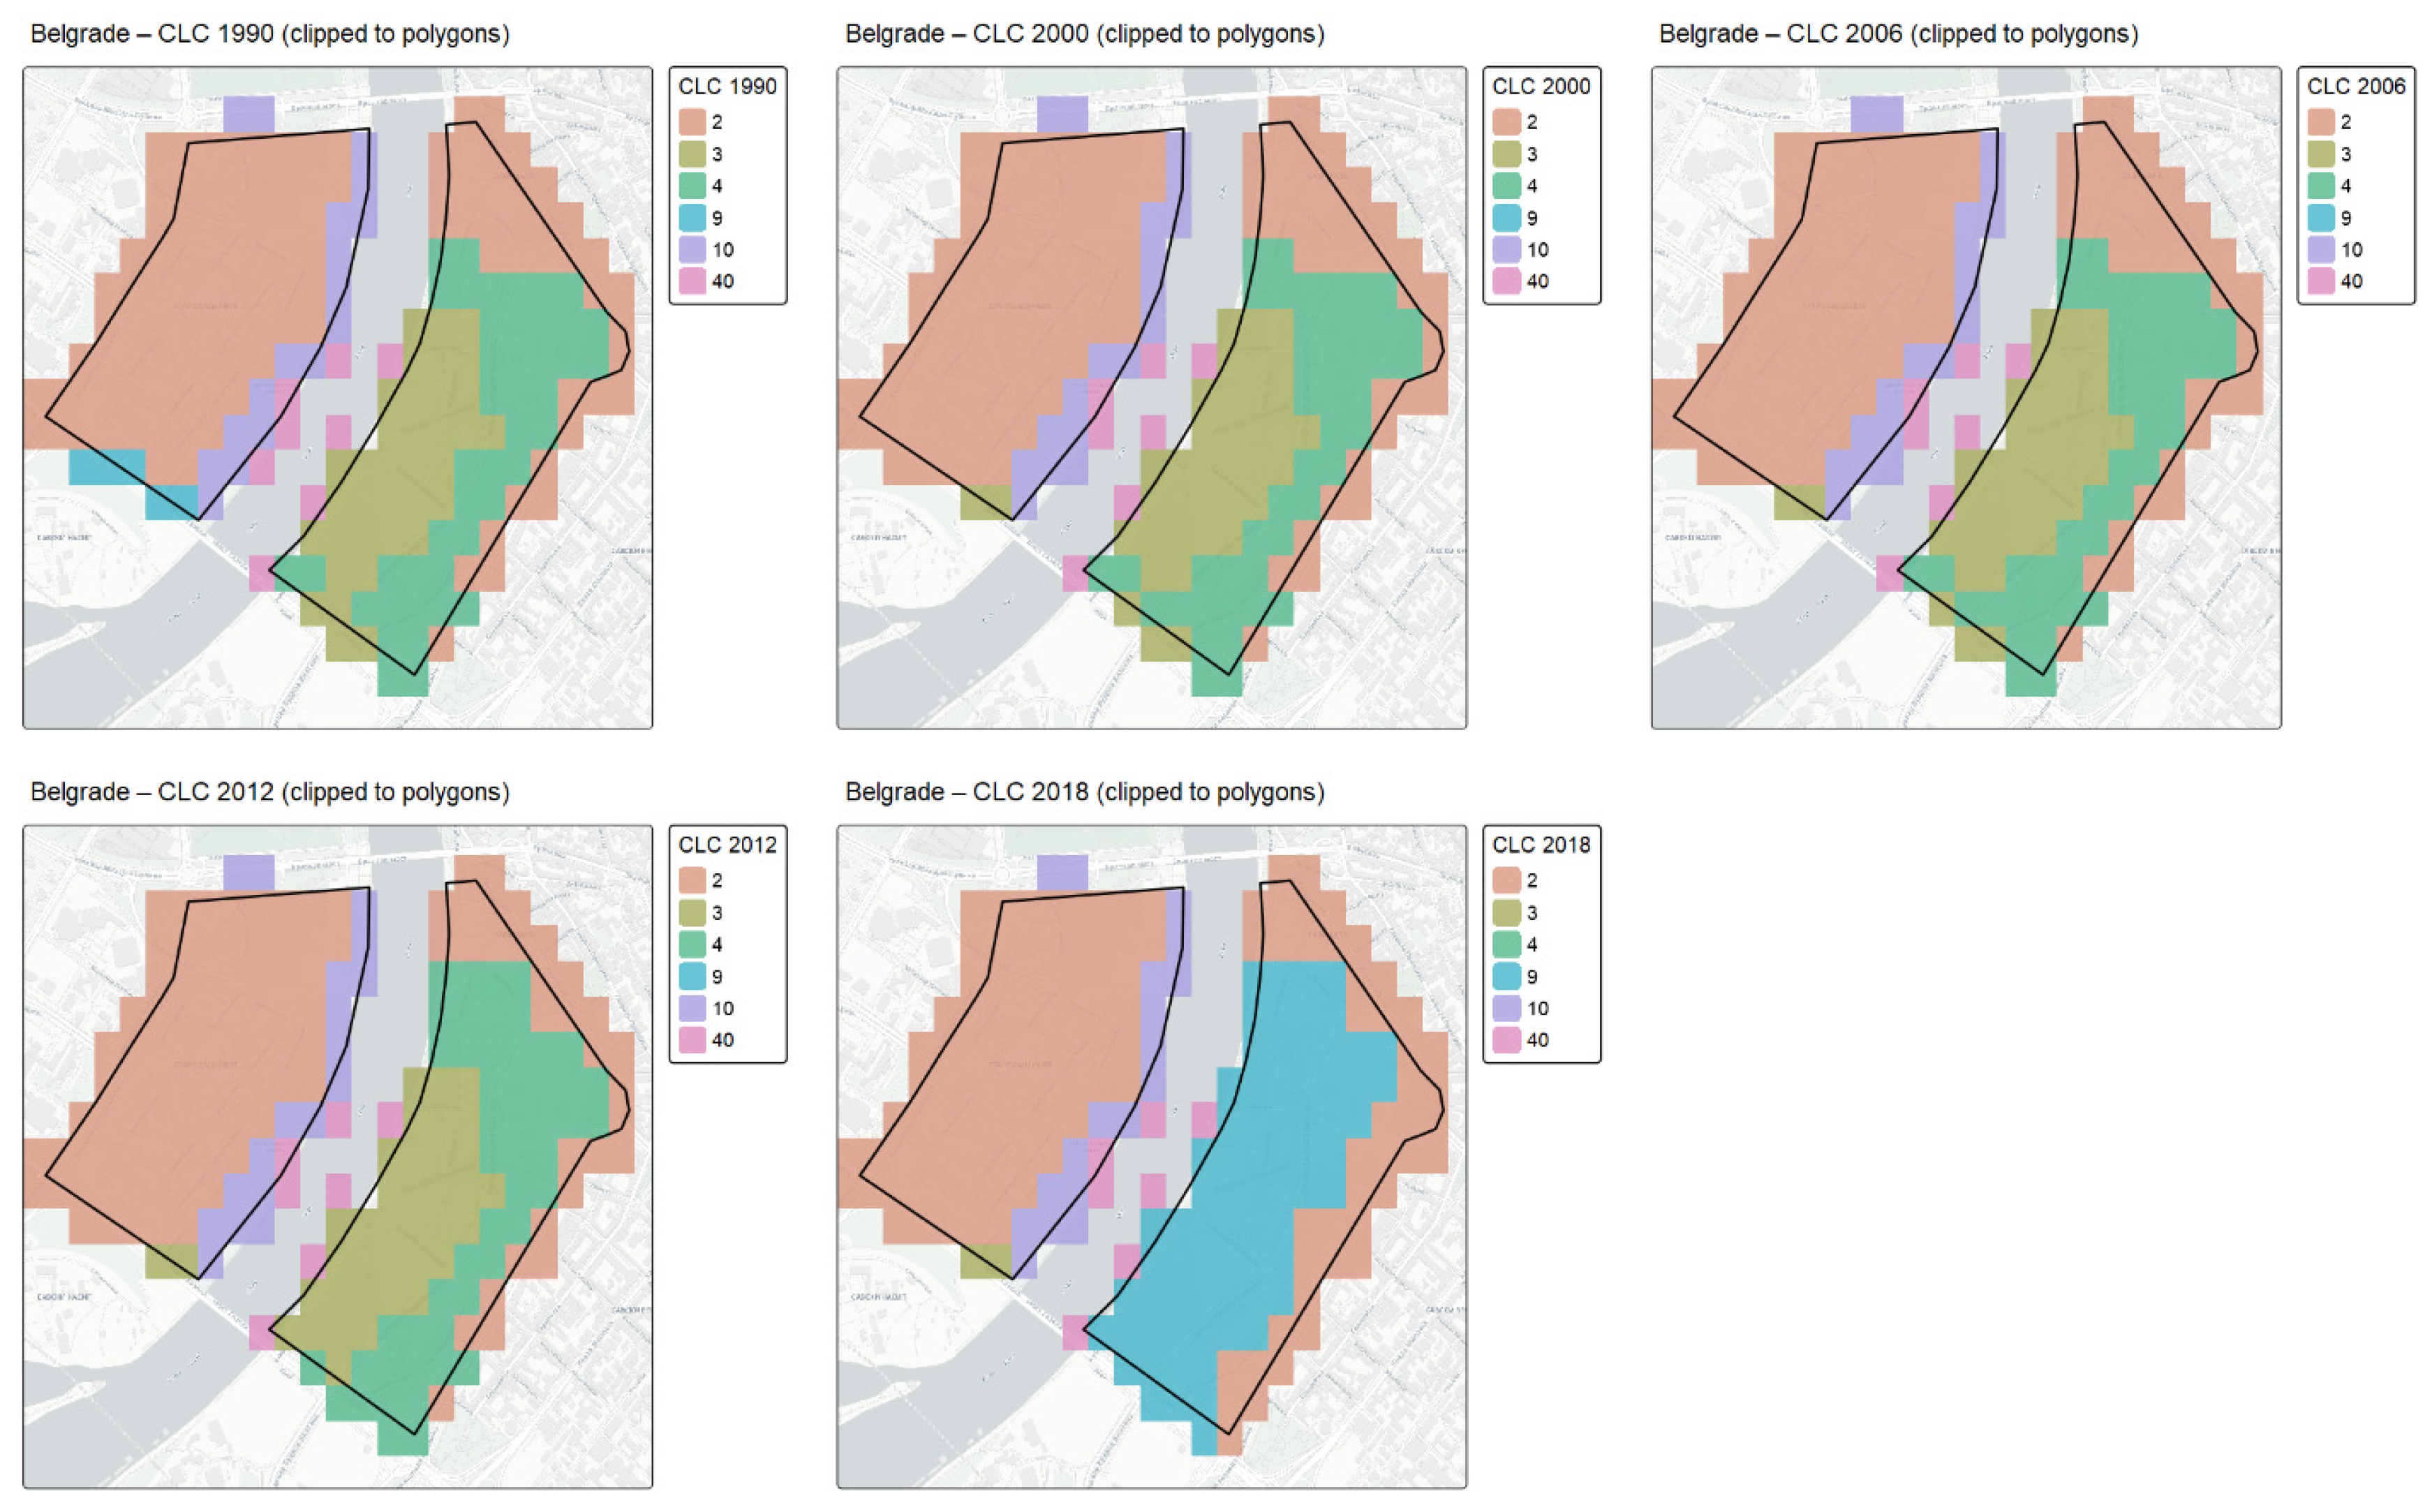
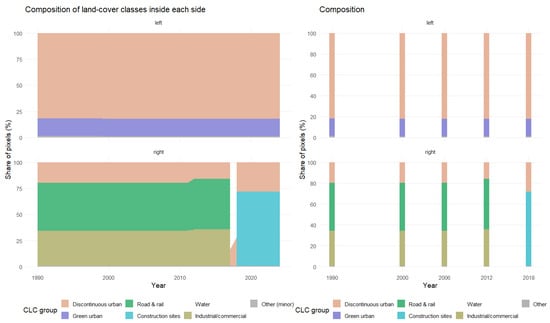
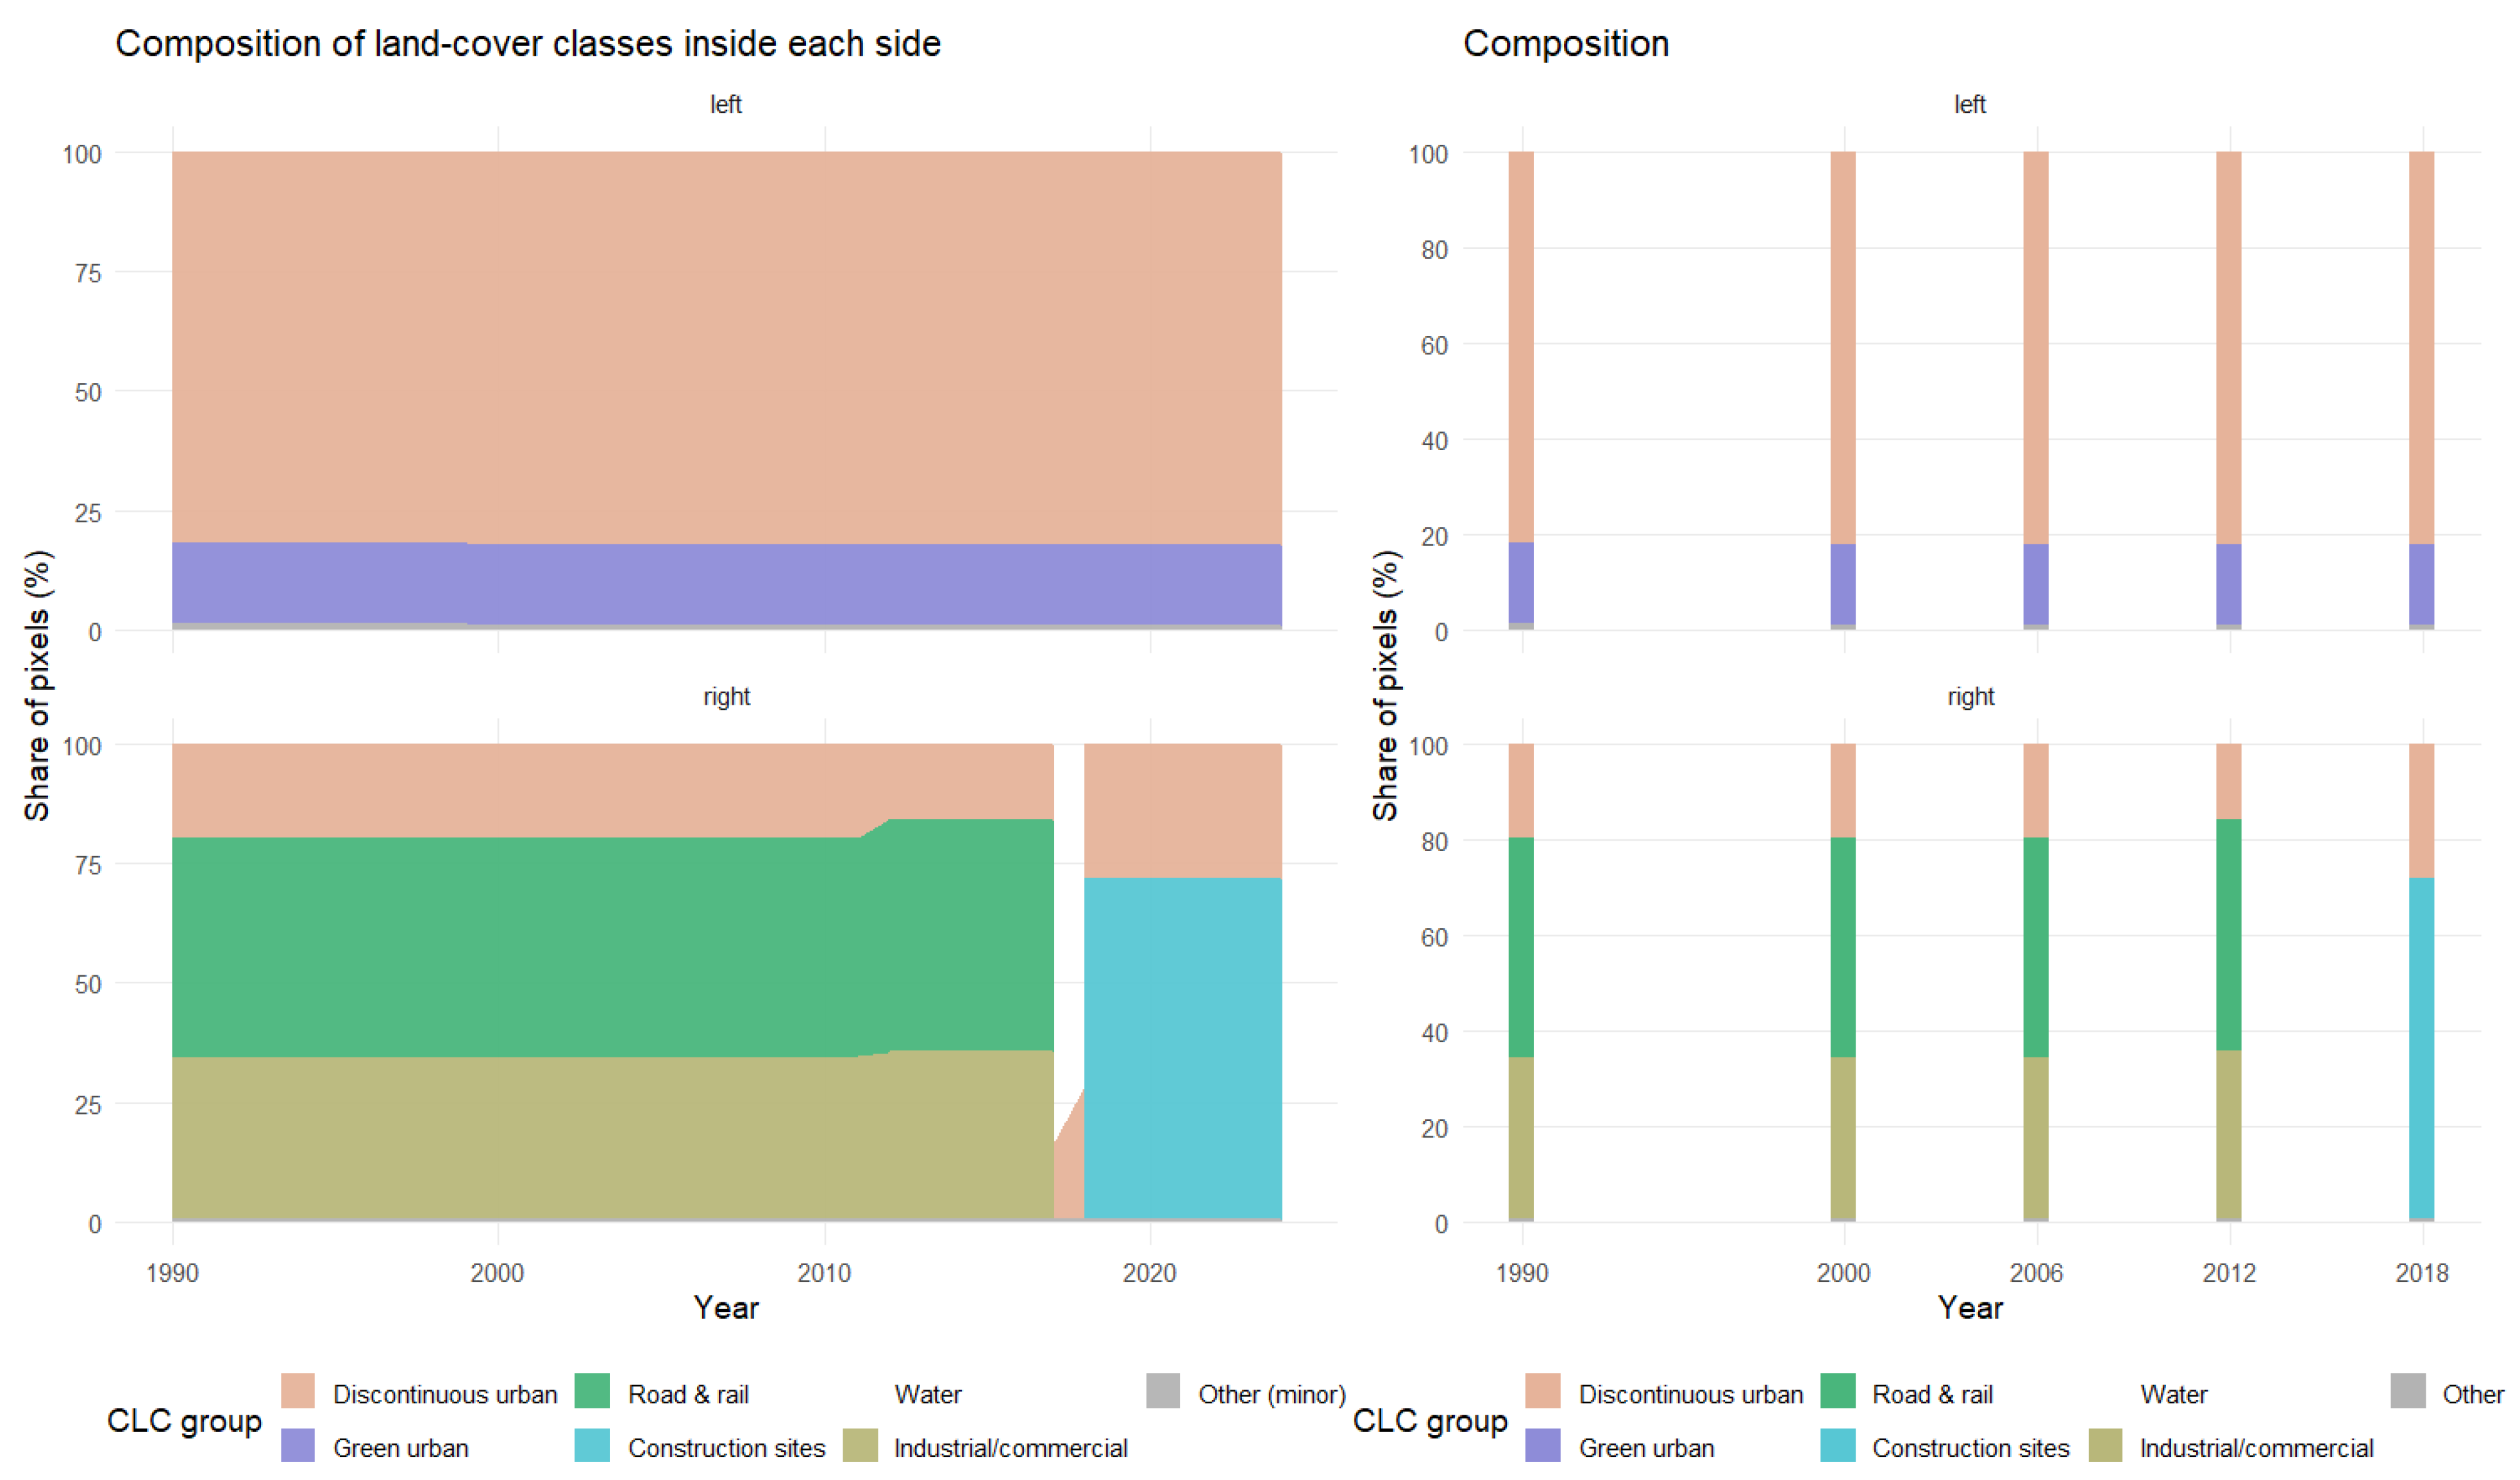
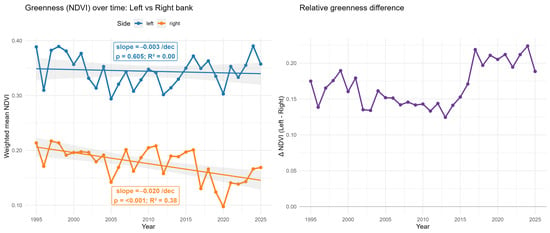
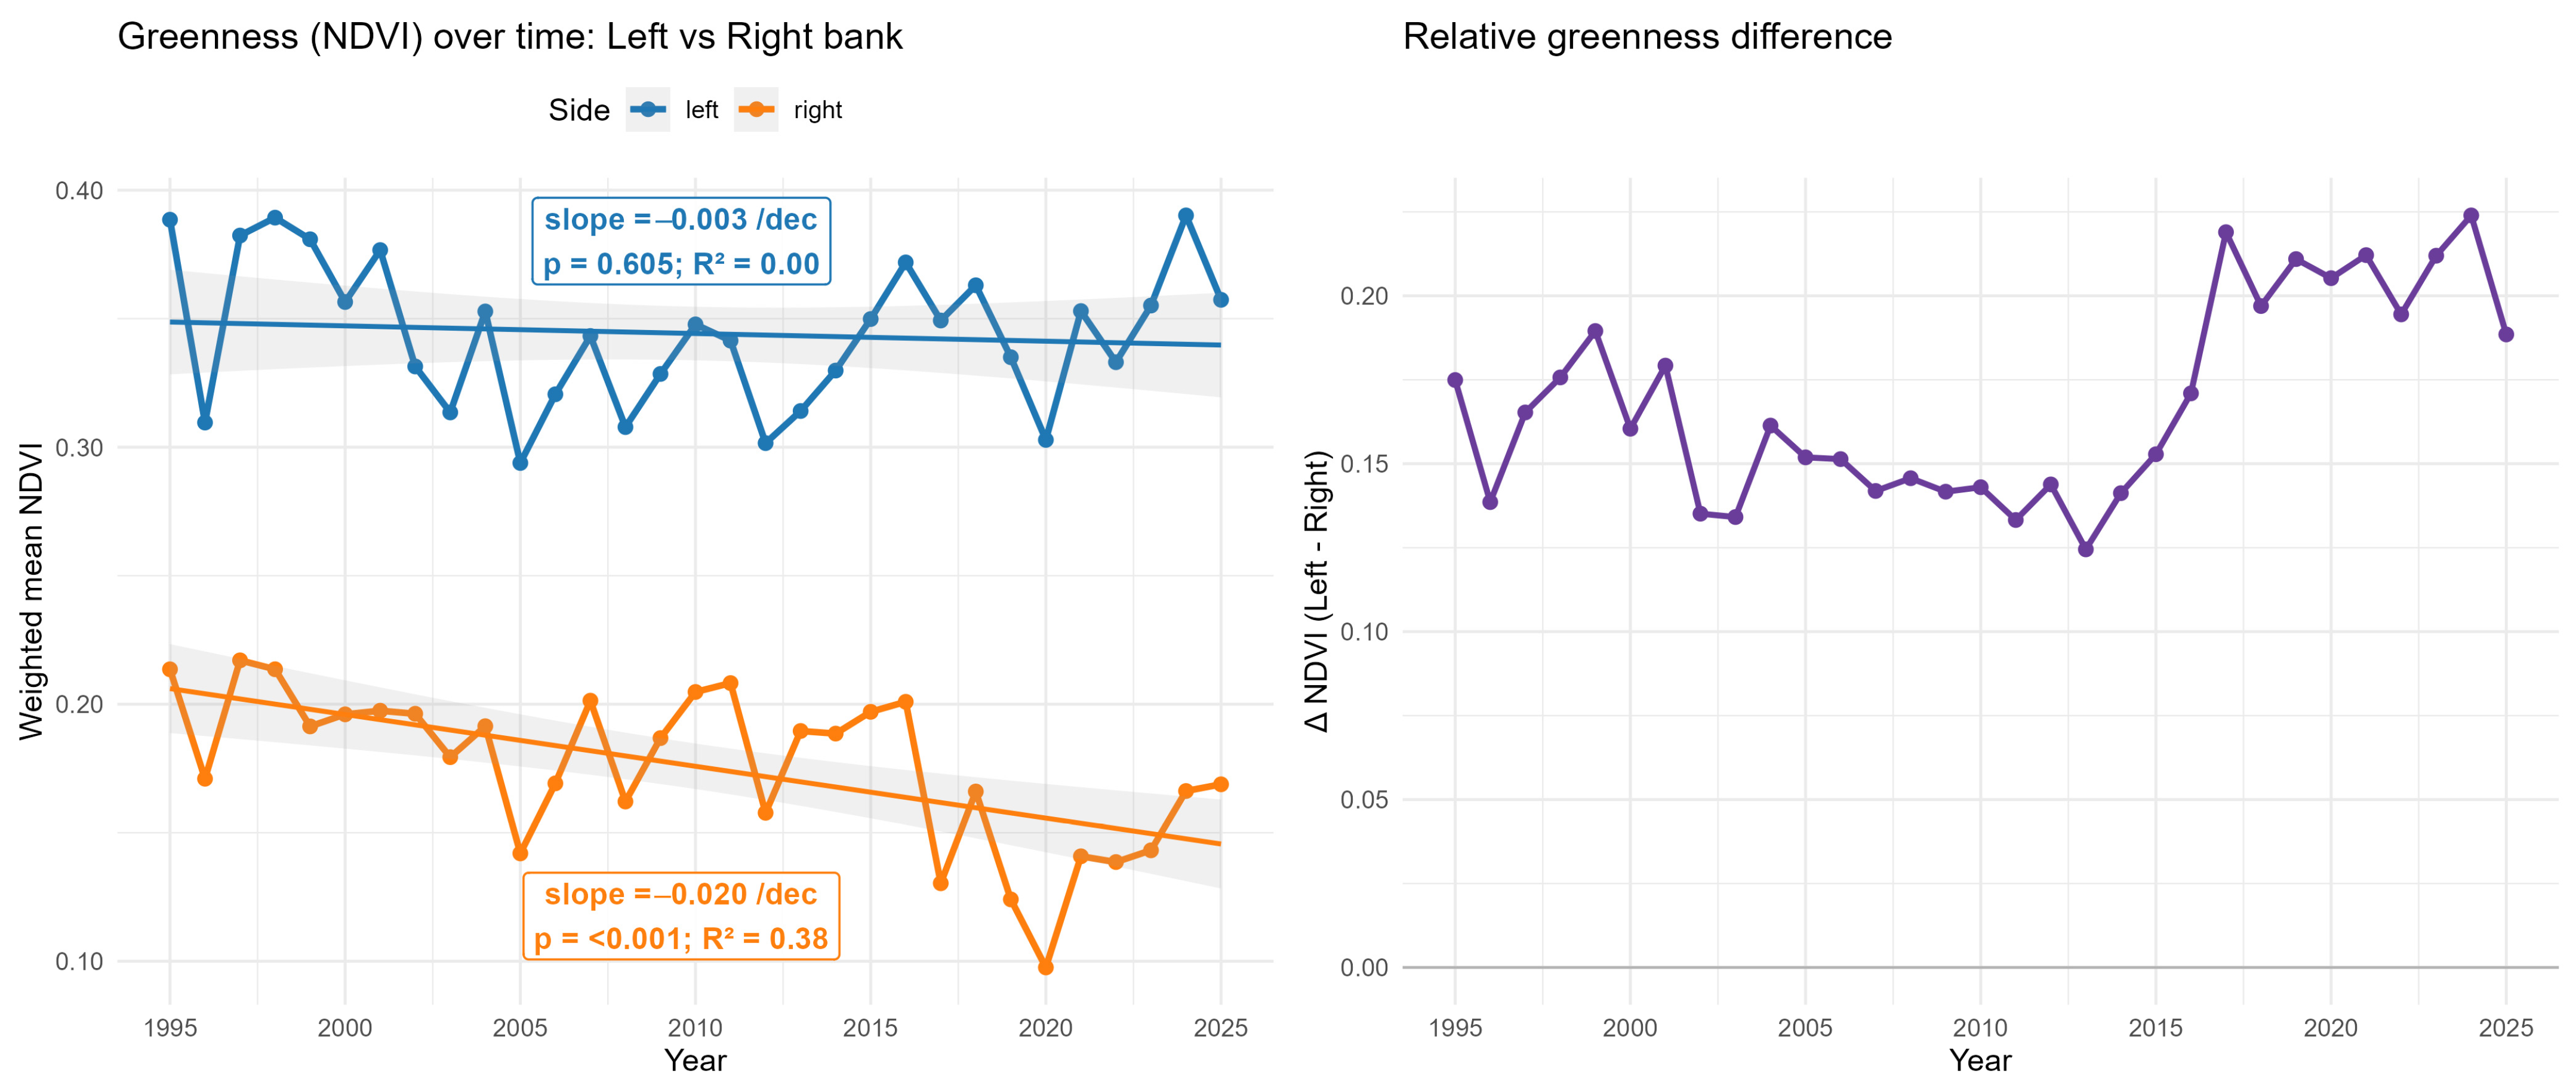
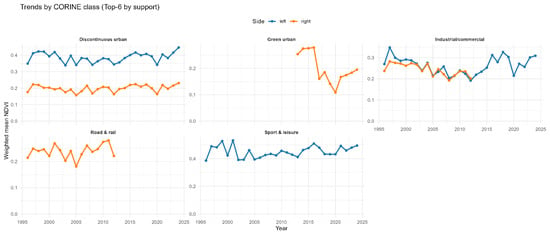
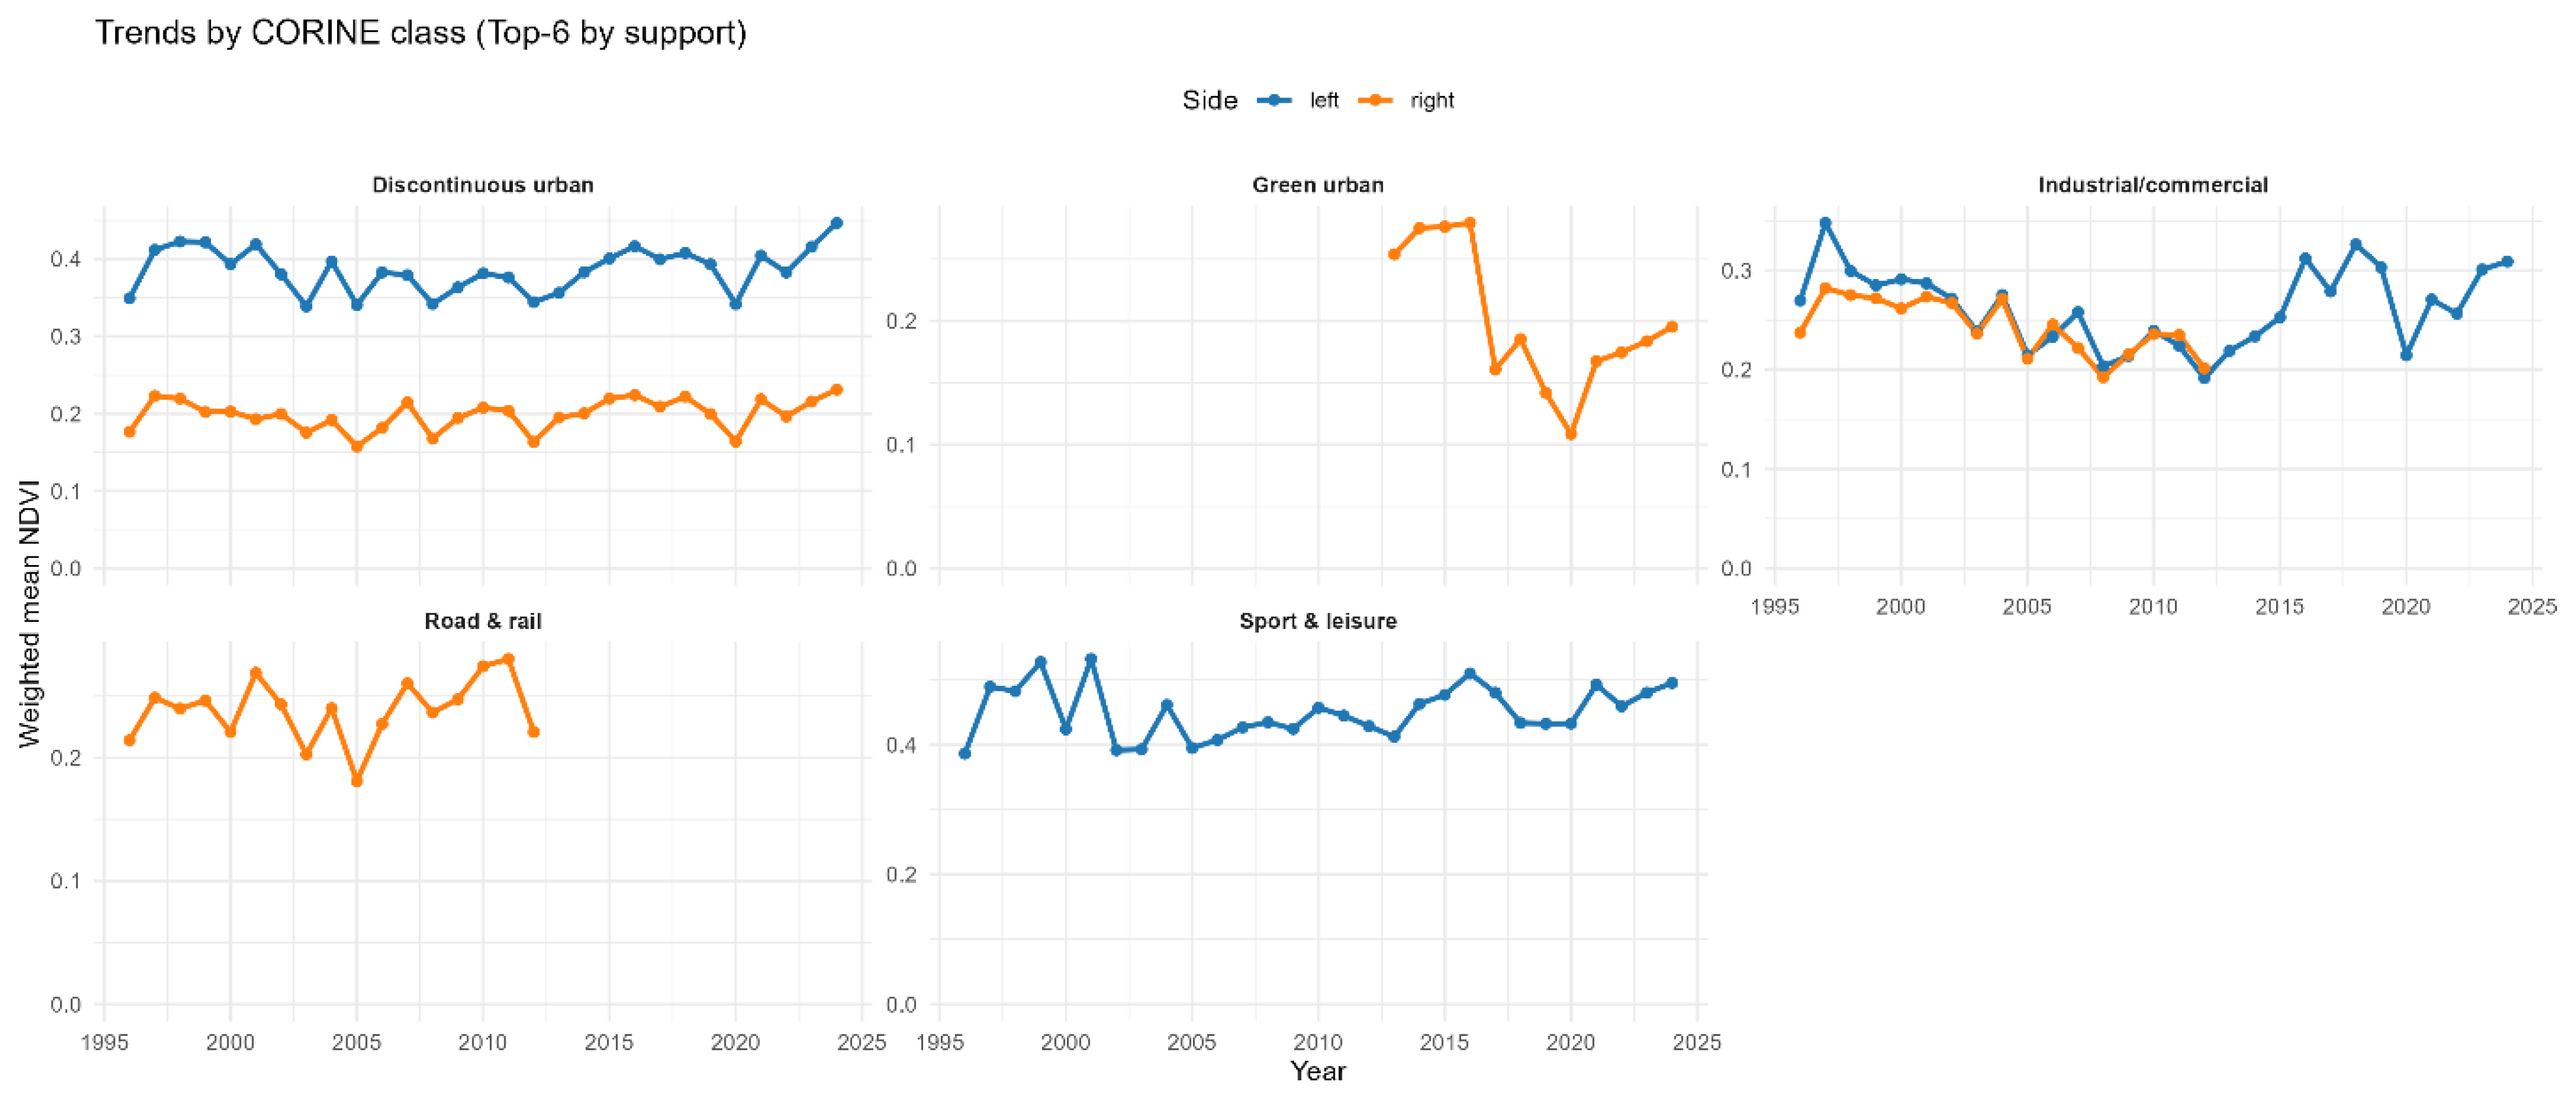
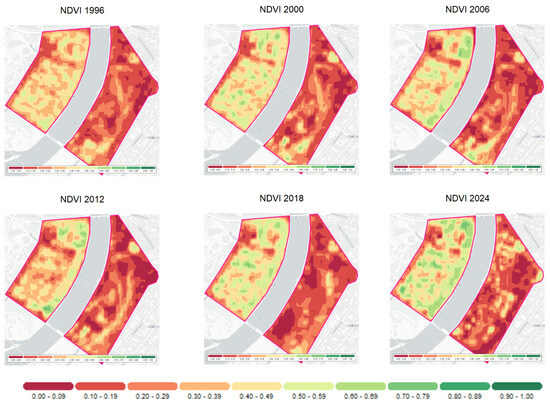
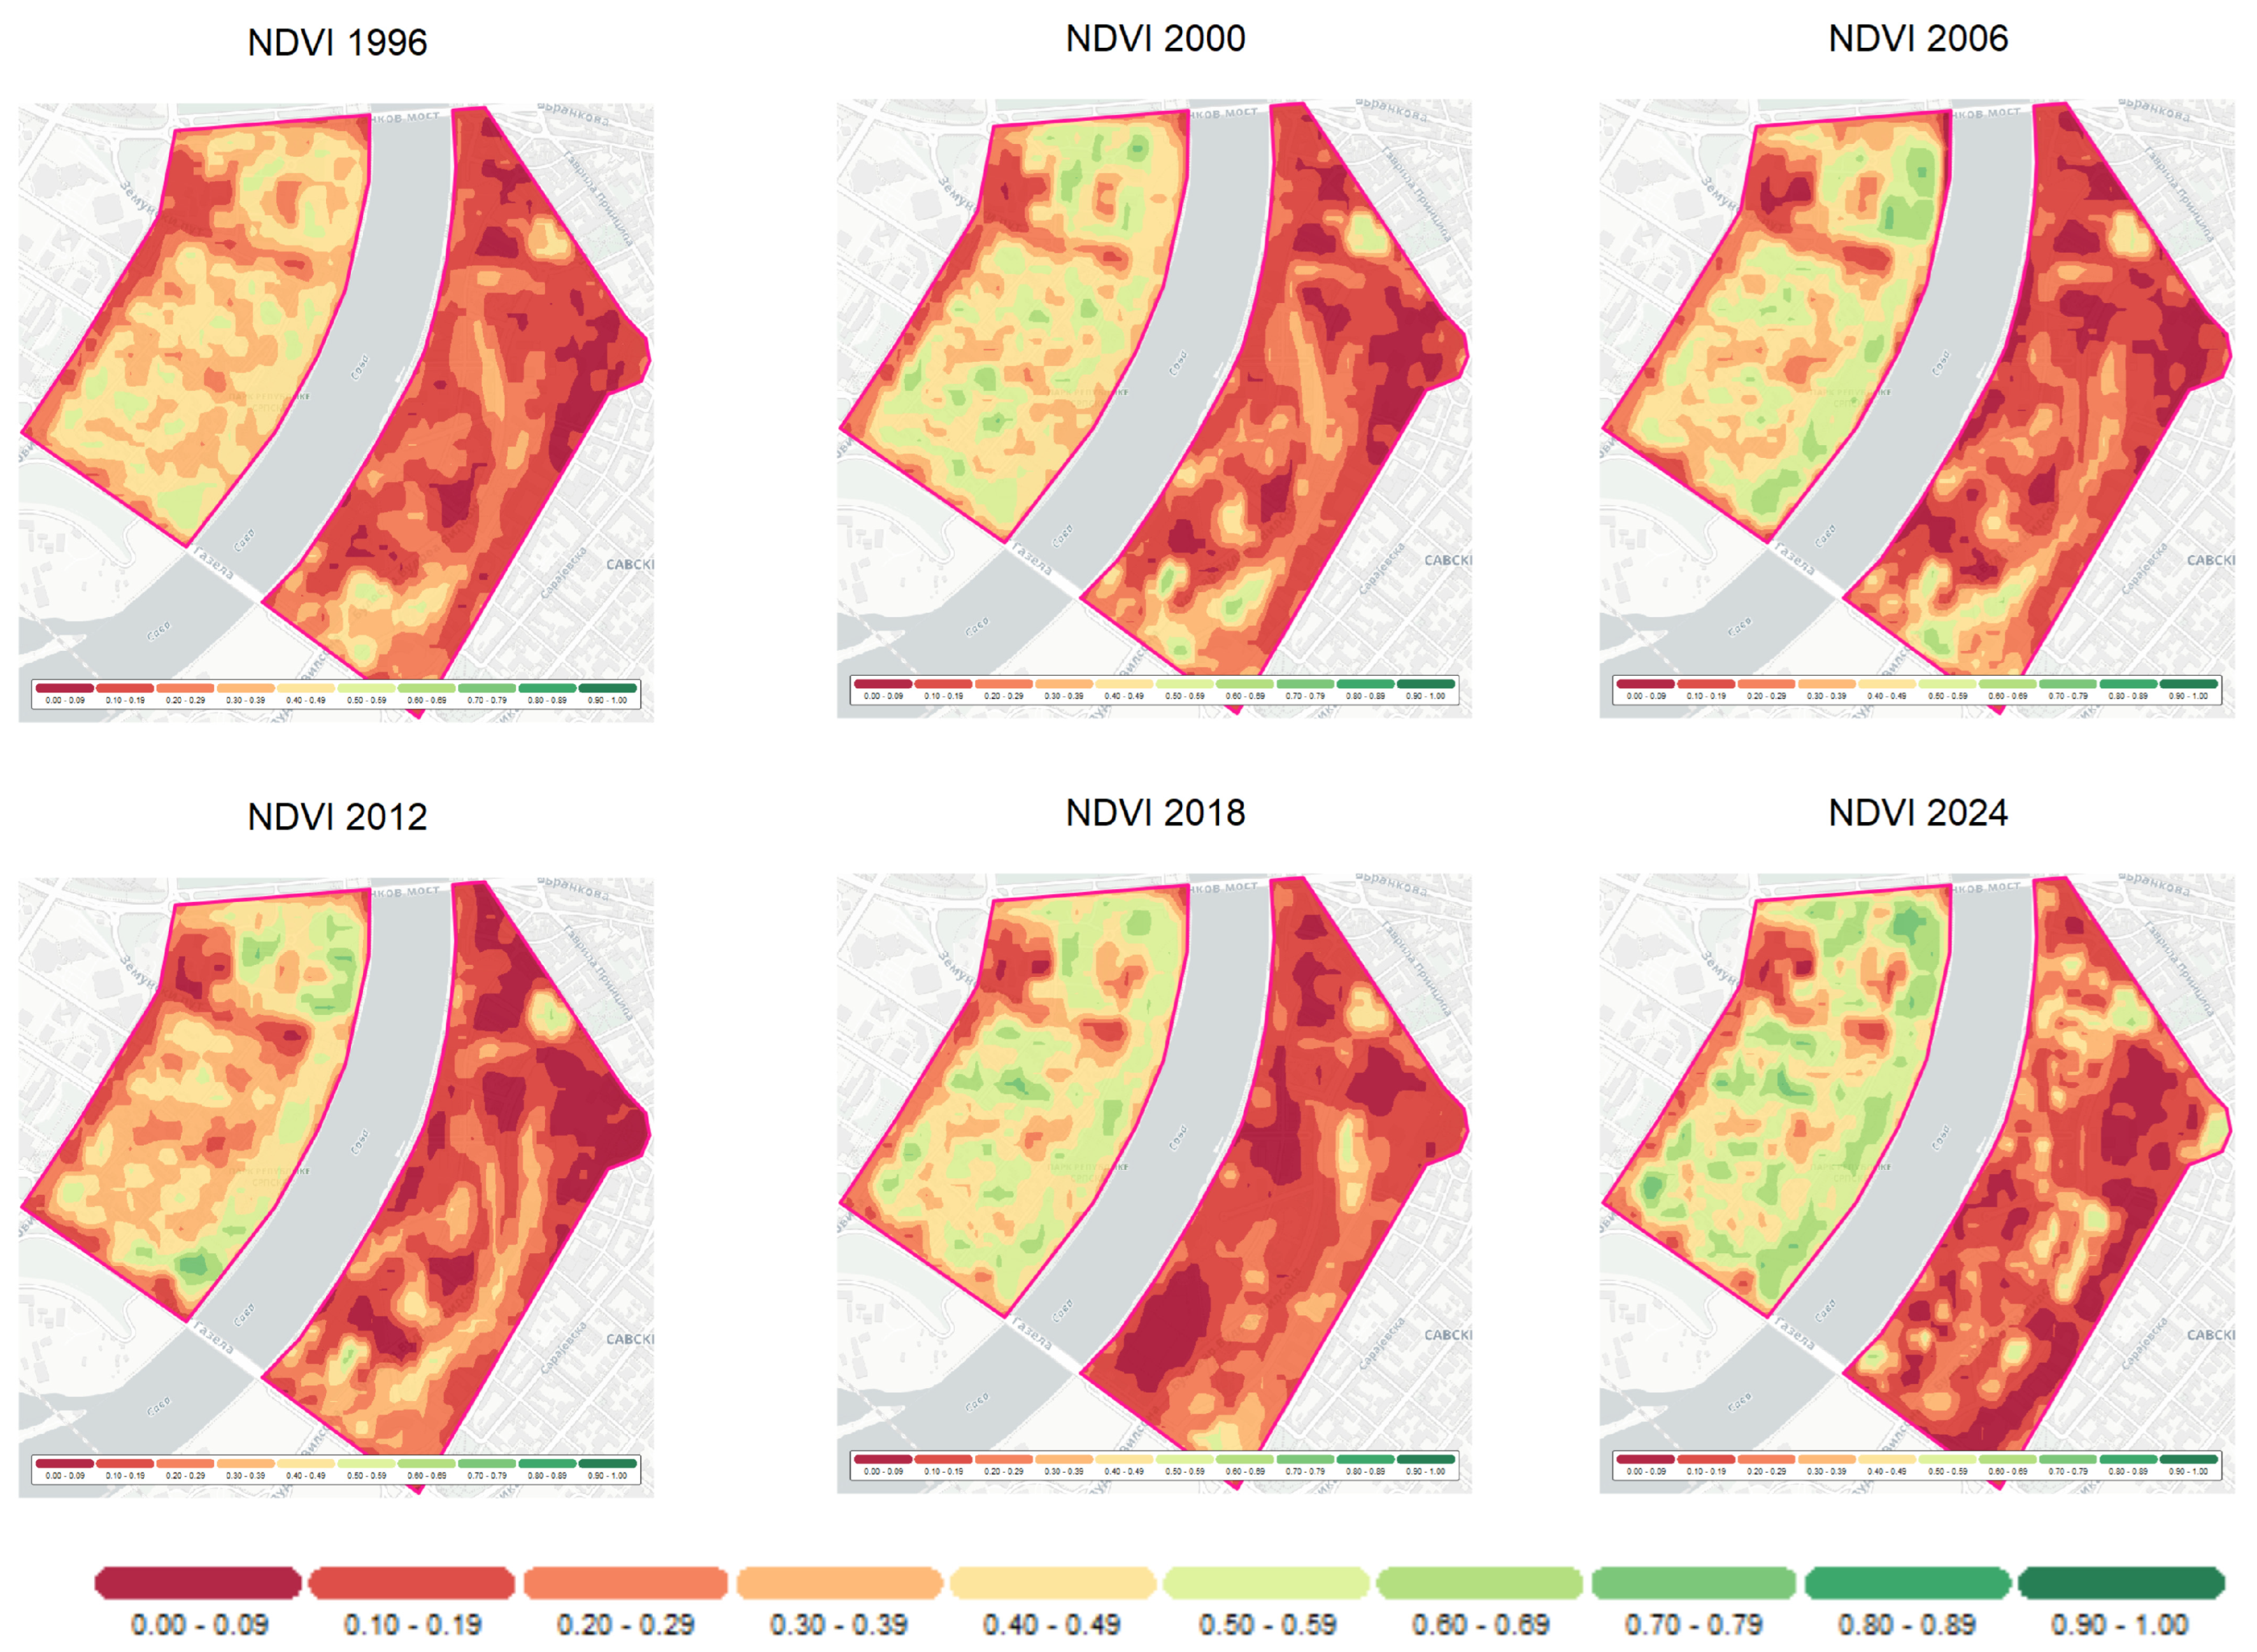
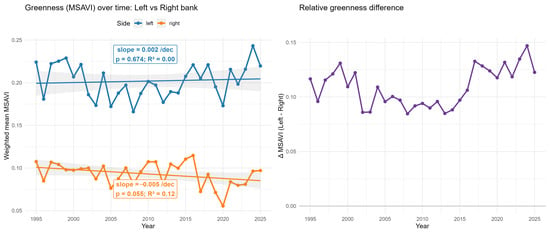
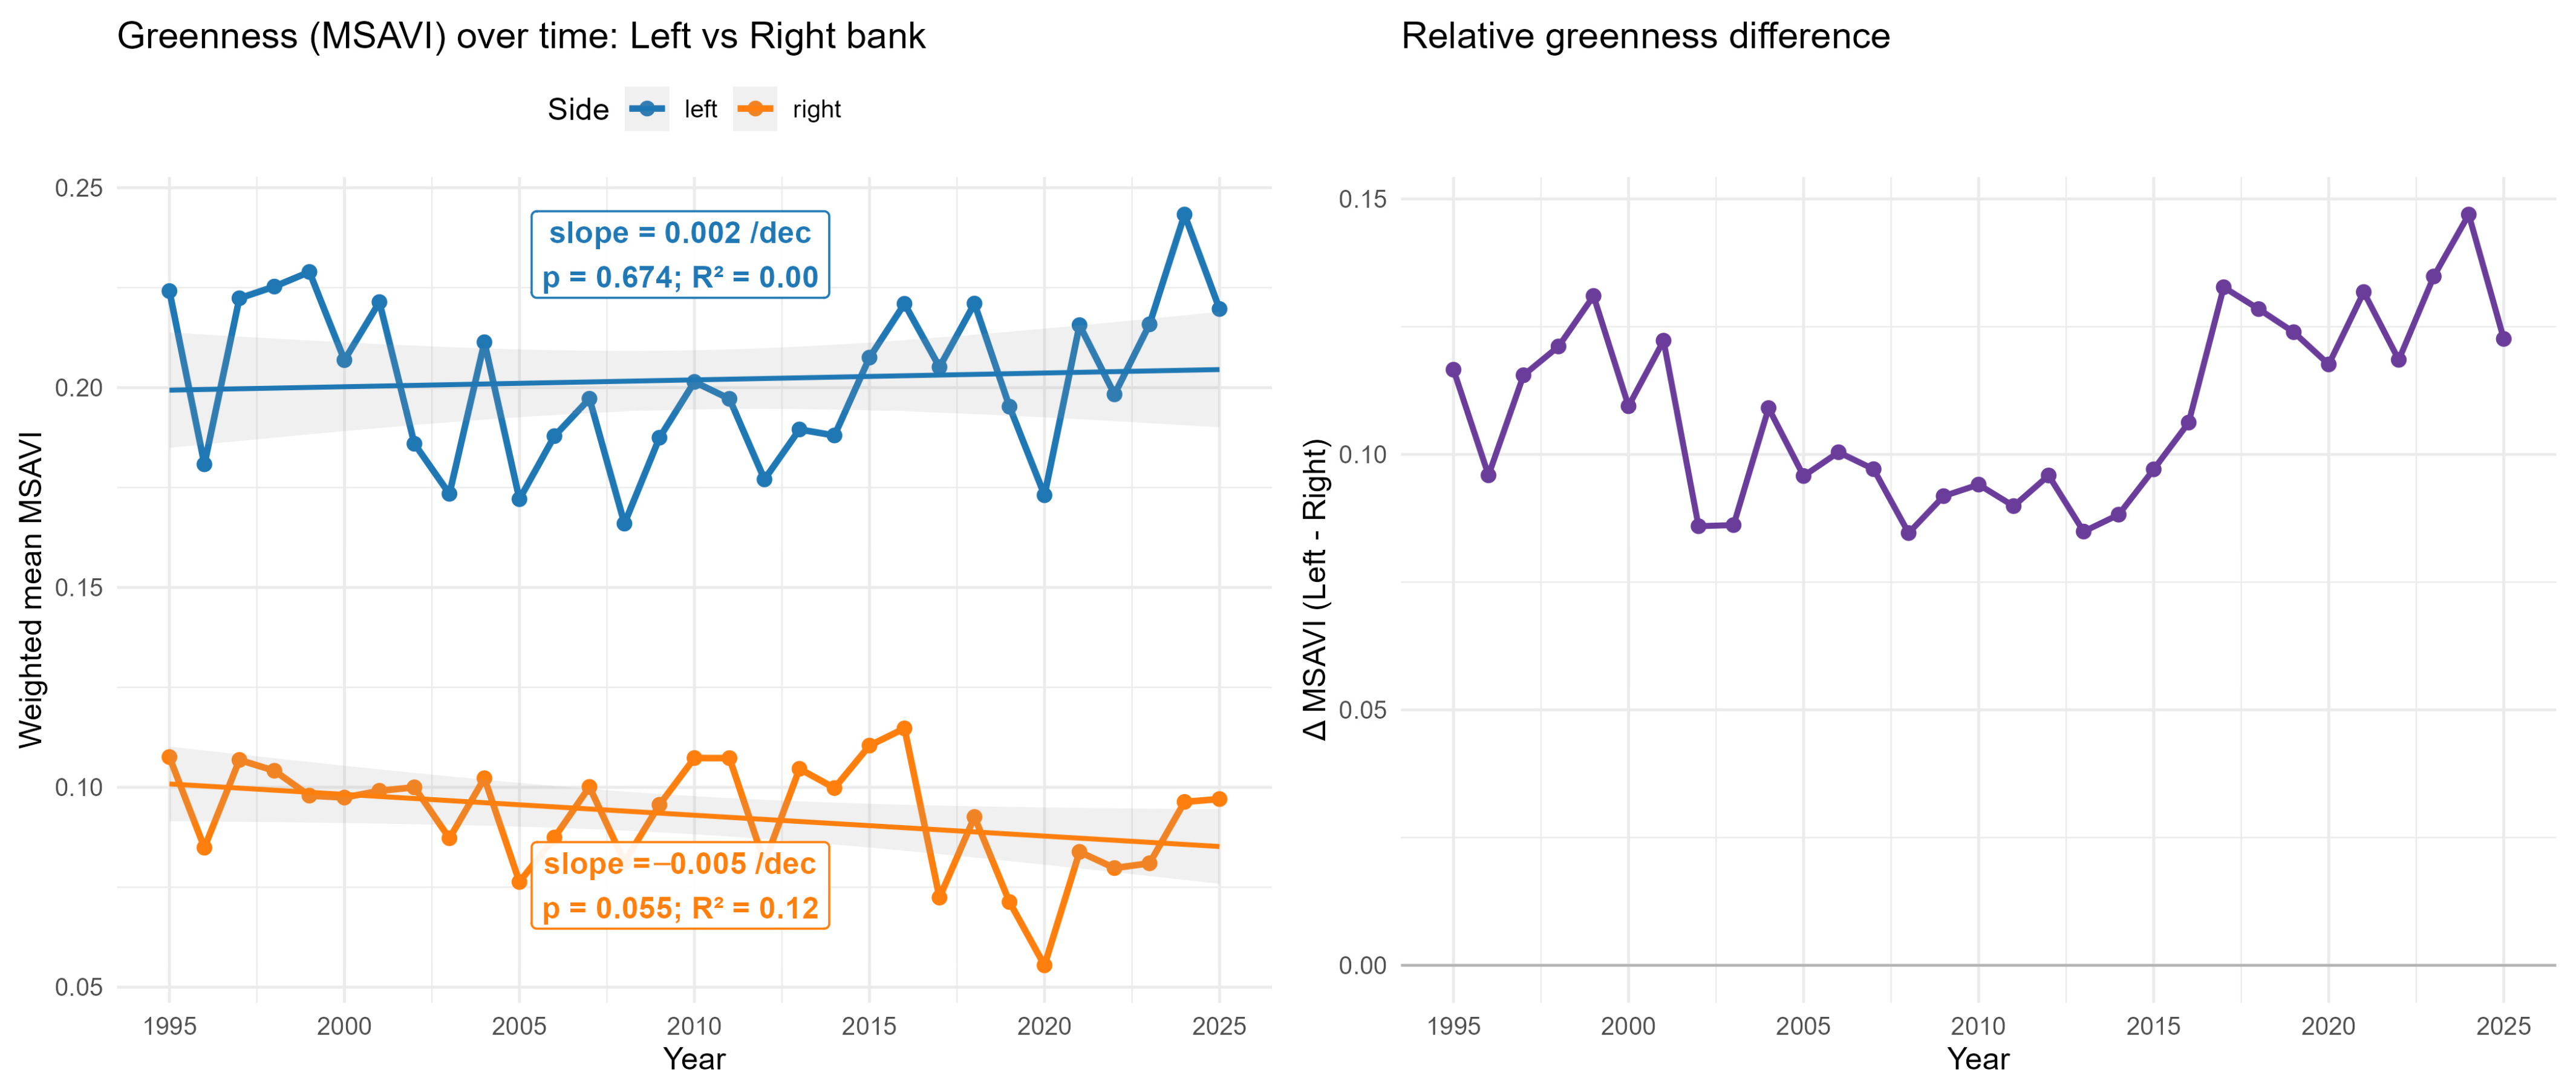
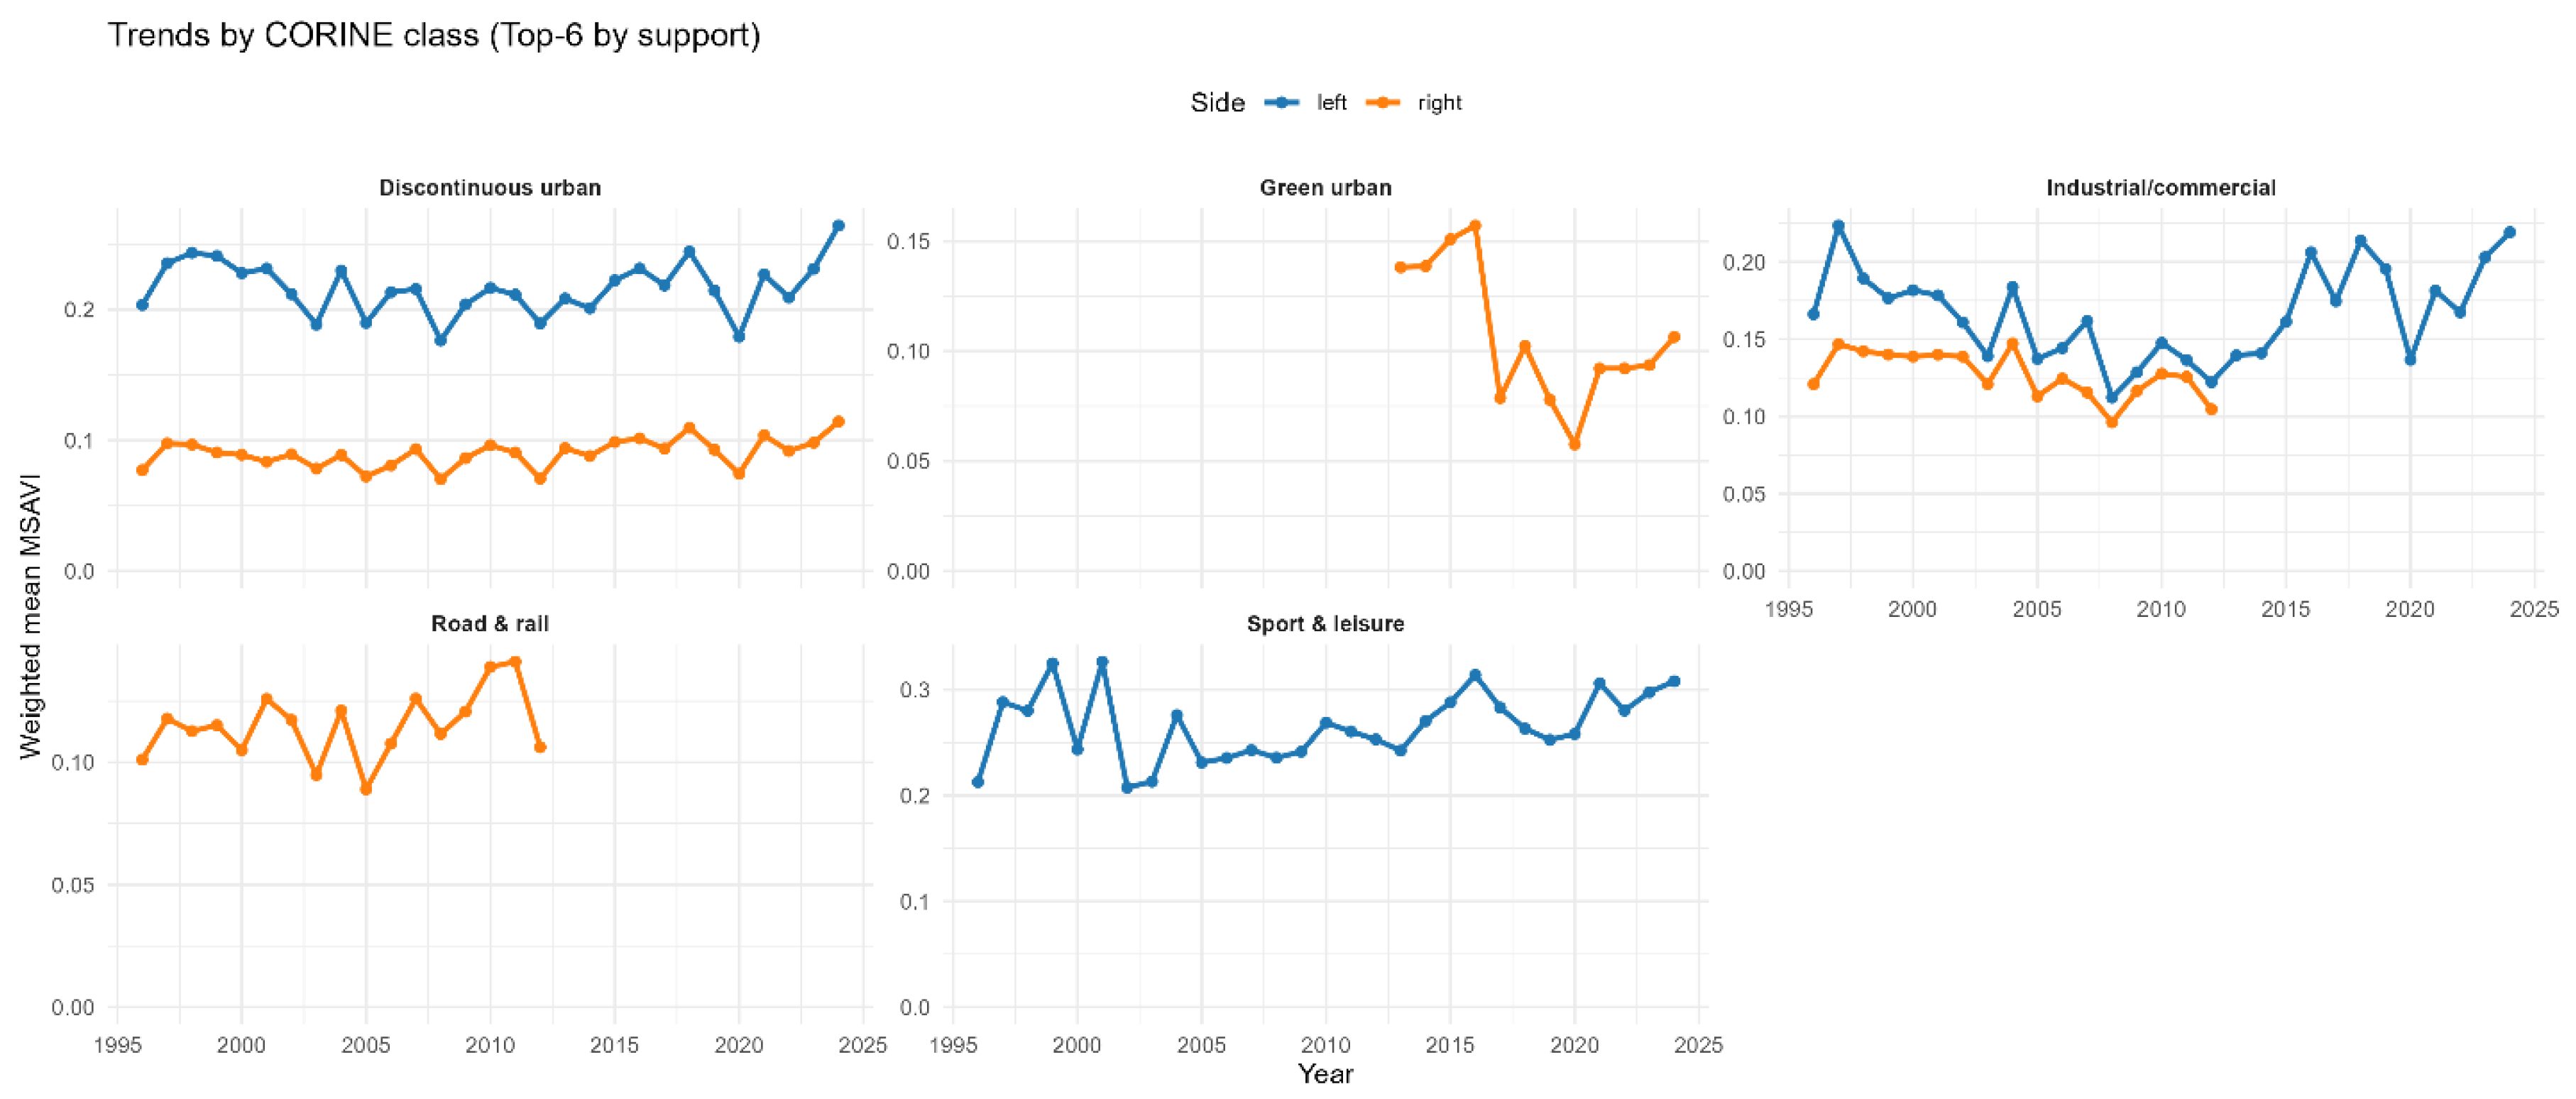
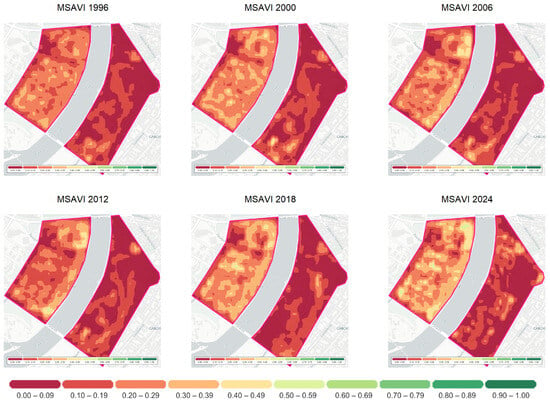
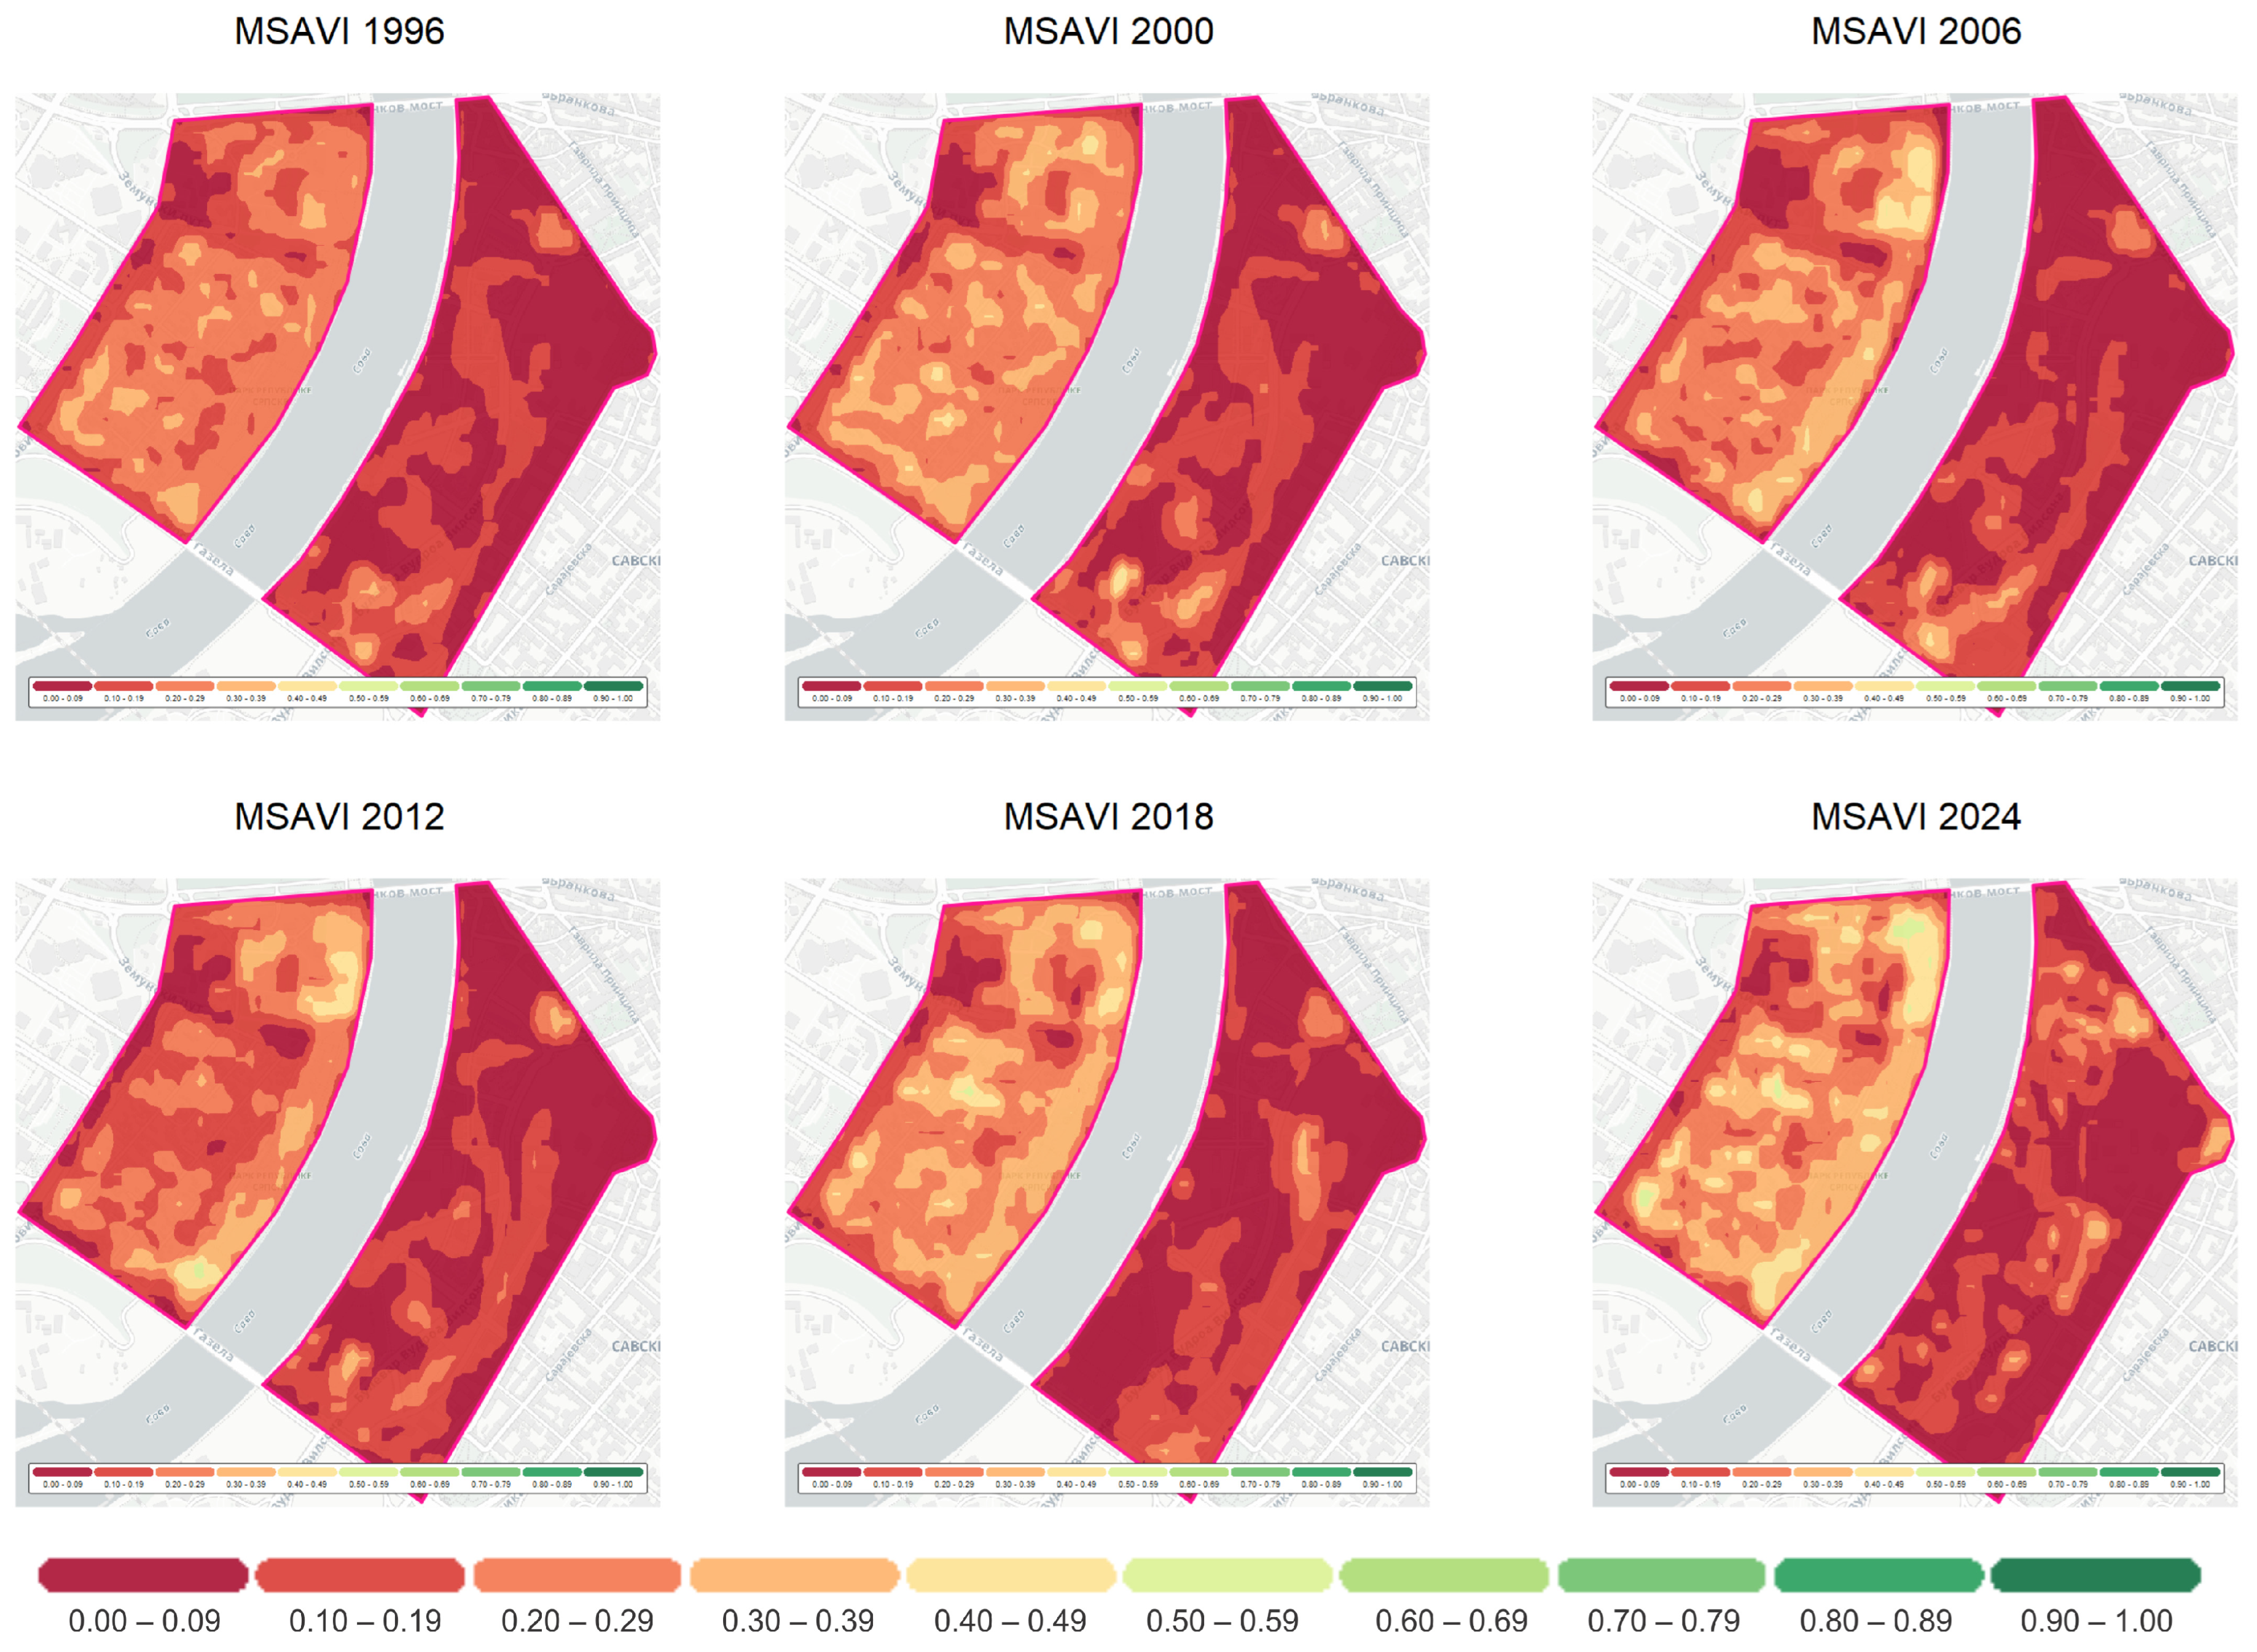

Disclaimer/Publisher’s Note: The statements, opinions and data contained in all publications are solely those of the individual author(s) and contributor(s) and not of MDPI and/or the editor(s). MDPI and/or the editor(s) disclaim responsibility for any injury to people or property resulting from any ideas, methods, instructions or products referred to in the content. |
© 2026 by the authors. Licensee MDPI, Basel, Switzerland. This article is an open access article distributed under the terms and conditions of the Creative Commons Attribution (CC BY) license.