


Abstract
Gavdos is assessed as a non-interconnected island without mainland electricity exchange over the adopted planning horizon. A configuration with 340 kWp of photovoltaics, an 800 kW wind turbine, and surplus-fed electrolysis is evaluated for electricity supply and ferry hydrogen. Twelve public HEDNO monthly day-ahead files were concatenated into an 8760 h rolling-year demand series. RETScreen-based F-chart solar calculations and a Weibull wind distribution (k = 2) provided twelve representative monthly 24 h renewable profiles, mapped by month and hour to the dispatch chronology. Renewable generation first serves demand; deficits are assigned to conventional generation and surplus to electrolysis. Annual demand is 662.630 MWh, of which renewables supply 650.633 MWh directly (98.19%); the residual deficit is 11.997 MWh across 419 h. The 302.6 kW baseline electrolyzer produces 34.488 t H2 year−1 gross versus a ferry demand of 33.890 t H2 year−1. Although daily production is lower than demand in 130 days, accumulated hydrogen keeps the gross inventory non-negative. The maximum seasonal drawdown is 947.4 kg, giving a usable hydrogen-mass requirement of 1133.1 kg including a two-day reserve. The results demonstrate gross-production compatibility under the adopted assumptions; net ferry-fuel adequacy requires detailed assessment of component operation, auxiliary loads, storage, delivery, and vessel duty.
1. Introduction
Decarbonizing a small non-interconnected island is not simply a matter of installing sufficient renewable nameplate capacity. It is a coupled problem involving hourly electricity adequacy, operational flexibility, fuel logistics, renewable-energy curtailment, and transport services that may be difficult to electrify directly. The European Green Deal established climate neutrality as a long-term European Union objective and placed renewable energy at the center of the associated economic and energy-system transformation [1]. The REPowerEU Plan subsequently added an energy-security rationale and accelerated the deployment of renewable electricity, energy efficiency, and renewable hydrogen [2]. Maritime transport is undergoing a parallel transition. The 2023 International Maritime Organization Strategy introduced 2030 uptake checkpoints under which zero- or near-zero-greenhouse-gas technologies, fuels, and energy sources should account for at least 5%, while striving for 10%, of the energy used by international shipping [3]. Regulation (EU) 2023/1805 (FuelEU Maritime) complements this direction through progressively stricter limits on the well-to-wake greenhouse-gas intensity of the energy used onboard covered ships [4]. These policy instruments establish a strong application context for island-produced renewable hydrogen, but they do not demonstrate the feasibility of a specific resource, electrolyzer, storage system, or vessel duty.
Non-interconnected island electricity systems present a particularly demanding implementation environment. They must maintain supply without support from a mainland transmission network while operating with small and often highly seasonal loads, limited generating redundancy, constrained reserve provision, and dependence on imported liquid fuels. Hatziargyriou et al. examined these characteristics in the Greek non-interconnected islands and documented the operational and planning challenges created by geographically dispersed systems, local thermal generation, and increasing renewable penetration [5]. Blechinger et al. quantified the global techno-economic potential of renewable hybrid systems on small islands and showed that competitiveness depends strongly on local renewable resources, electricity demand, conventional-fuel costs, and the selected system configuration [6]. Alves et al. investigated pathways towards fully renewable isolated-island systems and demonstrated that high renewable penetration requires coordinated generation, storage, flexibility, and demand-side measures rather than renewable-capacity expansion alone [7]. Results obtained for one island therefore cannot be transferred directly to another without preserving the corresponding resource, demand, infrastructure, and operational boundaries.
Chronology is fundamental to this distinction. Renewable electricity supplied directly to the load is limited by the simultaneous values of generation and demand; positive renewable surplus and residual demand occur at different hours. Annual renewable generation can consequently exceed annual demand while periods of curtailment and periods requiring dispatchable backup coexist. Luna-Rubio et al. reviewed sizing methodologies for renewable hybrid energy systems and showed that methods based on average meteorological conditions or isolated worst cases can mis-size systems because they do not adequately represent renewable variability, load behavior, component response, and reliability constraints [8]. Cebulla et al. synthesized 17 storage-expansion studies containing more than 400 scenarios and found that storage power requirements increased approximately linearly with variable-renewable penetration, whereas energy-capacity requirements increased much more steeply [9]. Their synthesis also showed that estimated storage needs depend materially on the wind–photovoltaic mix, spatial boundary, permitted curtailment, assumed autonomy, and technology-cost assumptions. An annual renewable share is therefore not a sufficient indicator of operational adequacy.
Storage technologies must be assigned according to the service they provide. Mathiesen and Lund compared seven technologies for integrating fluctuating renewable electricity and demonstrated that flexibility options are not interchangeable; their value depends on the temporal and sectoral characteristics of the energy system [10]. Batteries are generally suited to rapid balancing and repeated short-duration cycling, whereas hydrogen can provide a storable fuel and a means of coupling electricity to difficult-to-electrify end uses. Marocco et al. developed a component-resolved and lifetime-aware optimization of stand-alone renewable, battery, electrolyzer, hydrogen-storage, and fuel-cell configurations for Ginostra on Stromboli [11]. Their case study found that hydrogen storage could reduce excessive battery and photovoltaic sizing, but the reported cost advantage depended on the local resource, load, fuel-delivery cost, component assumptions, and optimization boundary. Kafetzis et al. contributed a hybrid-automata supervisory-control framework for islanded systems containing renewable generation, batteries, electrolysis, hydrogen storage, fuel cells, and conventional backup [12]. Their model illustrates that uninterrupted supply results from explicit operating-state logic and component prioritization, not from a favorable annual energy balance alone.
A distinction is also required between hydrogen used for power-to-power storage and hydrogen produced as a transport fuel. In a power-to-power configuration, surplus electricity is converted to hydrogen and later returned to the electricity system through a fuel cell. In the Gavdos concept, hydrogen is instead assigned to mobility and is not reconverted to cover electricity deficits. Direct renewable coverage and hydrogen production must therefore be evaluated separately: the former depends on the hourly coincidence of generation and load, whereas the latter is limited by the positive surplus after the island demand has been served.
The electrolyzer cannot be represented uncritically as a constant-efficiency converter of every available kilowatt-hour. Ursúa et al. reviewed alkaline, proton-exchange-membrane, and solid-oxide water-electrolysis technologies and documented differences in efficiency, operating range, dynamic behavior, maturity, and compatibility with variable electricity supply [13]. Kotowicz et al. combined laboratory-derived electrolyzer characteristics with wind-generation profiles and demonstrated that the ratio between electrolyzer and wind-farm rated power materially affects annual operating time and conversion efficiency [14]. Kojima et al. examined the influence of renewable-power fluctuations on water electrolysis and showed why the temporal characteristics of renewable input should be considered when estimating green-hydrogen performance [15]. Reksten et al. developed a capacity-dependent capital-cost model for alkaline and proton-exchange-membrane plants and found that plant size remains an important cost determinant, particularly up to approximately the 1–10 MW range [16]. Because the evaluated Gavdos train is substantially smaller, at 302.6 kW, utility-scale cost projections cannot be transferred without a compatible system boundary and explicit allowances for balance of plant, installation, compression, storage, and replacement.
Published island studies demonstrate the potential of hydrogen while also illustrating the site specificity of the results. Dimou et al. examined Anafi and connected renewable-hydrogen production with mobility demand, thereby treating transport as an identifiable hydrogen end use rather than an unlimited sink [17]. Fragoso et al. performed a techno-economic analysis for Flores Island and evaluated how hydrogen technologies could facilitate greater renewable penetration under the island’s particular generation, demand, and economic conditions [18]. Bionaz et al. conducted a life-cycle assessment of a renewable-hydrogen-based remote-energy system for the Froan islands and compared it with diesel generation and a submarine grid connection [19]. Their ranking was sensitive to the carbon intensity of mainland electricity and to cable length, demonstrating that hydrogen cannot be assigned a universal environmental advantage independently of the local counterfactual. Ali et al. translated a defined public-transport service on Favignana into hydrogen-production and infrastructure requirements, reinforcing the need to derive hydrogen demand from a specified transport duty rather than from a generic annual allocation [20].
Maritime use introduces a further layer of constraints. The European Maritime Safety Agency assessed hydrogen as a shipping fuel and identified short-sea operation as a more immediately plausible application than long-distance shipping, while emphasizing volumetric energy density, onboard storage, bunkering infrastructure, cost, safety, and regulation [21]. Fu et al. reviewed maritime fuel-cell and hydrogen applications from technological, economic, and regulatory perspectives and showed that fuel-cell selection is only one element of a wider vessel and fuel-supply system [22]. Van Sickle et al. documented the development of the MV Sea Change, the first commercial 100% hydrogen fuel-cell passenger ferry, and provided practical information concerning fuel cells, compressed-hydrogen storage, vessel integration, bunkering, approval, and operation [23]. Di Ilio et al. developed a hydrogen-powered ferry design in which propulsion demand, fuel-cell sizing, hydrogen storage, vessel layout, and operating profile were treated as interdependent variables [24]. Perna et al. extended the system boundary to the maritime hydrogen supply chain and showed that production, compression, storage, bunkering, and vessel demand must be sized together when assessing economic feasibility [25]. These contributions demonstrate that comparing annual hydrogen production with annual ferry demand is only an initial feasibility indicator.
Hourly analysis is essential because annual energy totals alone do not establish operational adequacy. Electricity deficits and renewable surpluses occur at different times, while hydrogen production and ferry consumption form a chronological stock–flow problem. Storage inventory, conversion and compression losses, reserve requirements, and service timing can therefore alter conclusions derived from annual production–demand comparisons.
The present study develops and evaluates an integrated renewable-hydrogen configuration for Gavdos. The selected equipment comprises a 340 kWp photovoltaic installation, one 800 kW ENERCON E-48 wind turbine, water electrolysis, and renewable-hydrogen use for ferry service. The analysis links the island electricity balance with surplus-constrained hydrogen production and chronological ferry-fuel inventory.
The analysis combines twelve monthly operator data files into a complete 8760 h rolling-year demand-estimate chronology covering March–December 2021 and January–February 2022. The values are treated as operator day-ahead estimates rather than revenue-meter observations. Monthly renewable-resource inputs, fixed hourly wind and photovoltaic generation profiles, equipment capacities, electrolyzer characteristics, and the ferry-duty definition are integrated within a common hourly calculation framework. Dispatch prioritizes direct renewable supply, assigns residual deficits to local conventional generation, and supplies electrolysis only from positive renewable surplus. Hydrogen availability is evaluated through annual production–demand comparison and chronological inventory analysis.
Accordingly, the study has four objectives: (i) to reconstruct and characterize the complete hourly electricity-demand-estimate series; (ii) to quantify direct renewable coverage, renewable surplus, and residual electricity deficits; (iii) to compare the technical performance of five electrolyzer configurations under surplus-constrained operation; and (iv) to evaluate the chronological compatibility of hydrogen production with the selected ferry duty, including the usable storage capacity and operating-inventory conditions required to manage seasonal variability. Therefore, the central research question is as follows: to what extent can the selected renewable-hydrogen configuration serve the electricity and ferry-fuel requirements of Gavdos under a non-interconnected operating boundary?
2. Materials and Methods
2.1. Study Area and Long-Term Non-Interconnected System Boundary
Gavdos is a small Greek island located south of Crete and represents the southernmost permanently inhabited island of Greece. Electricity demand is strongly seasonal because the number of residents and visitors increases substantially during the summer tourism period. The combination of a small annual electricity market, a pronounced seasonal demand peak, and dependence on locally operated generating units makes Gavdos a representative case for investigating renewable-energy integration and renewable-hydrogen production in an autonomous island system.
The distinction between an autonomous island and an island awaiting imminent grid interconnection is methodologically important. The Seven-Year Generation Development Programme for the Non-Interconnected Islands, published by the Hellenic Electricity Distribution Network Operator for 2024–2030, did not schedule an electrical interconnection for Gavdos during the examined planning period [26]. A subsequent public presentation by the Regulatory Authority for Waste, Energy and Water identified Gavdos among the small islands expected to remain autonomous over the longer term because autonomous operation was considered more appropriate than interconnection under the examined techno-economic conditions [27]. Gavdos is therefore treated in this study as a long-term, autonomous, non-interconnected electricity system rather than as a temporary system awaiting interconnection.
This boundary condition is maintained throughout the analysis. Electricity imports from and exports to an interconnected grid are set equal to zero:
Pgrid,t = 0, t = 1, …, 8760
Consequently, renewable electricity exceeding the simultaneous island demand cannot be exported. It may be directed to hydrogen production or remain unused. Conversely, renewable-generation deficits cannot be covered through grid imports and are assigned to local conventional generation. The proposed renewable-hydrogen architecture must therefore be evaluated as part of a locally balanced island energy system.
The HEDNO development program reports five diesel generating sets, aggregate available summer generation of approximately 0.755 MW, and heatwave-derated availability of approximately 0.495 MW [26]. The same program reports no installed renewable-electricity capacity in its Gavdos planning snapshot. The wind, photovoltaic, and hydrogen systems investigated here therefore constitute a proposed energy-transition scenario rather than a description of existing infrastructure.
The reported conventional-generation capacities were not used to rescale the hourly demand series or to construct a diesel-unit commitment model. Conventional generation was represented as the residual balancing source whenever renewable production was insufficient. This treatment maintains the focus on renewable-hydrogen integration without introducing unit-specific efficiencies, fuel-consumption curves, minimum stable loads, start-up constraints, or maintenance schedules. Ramping constraints are also excluded. The calculated residual deficit is an energy-balance requirement rather than a validated diesel-unit operating schedule. Minimum stable loads, start-up and ramping constraints could change renewable curtailment and the surplus available for electrolysis; diesel fuel use is not quantified.
2.2. Renewable-Hydrogen System Configuration
The evaluated system comprises a photovoltaic installation with a nominal capacity of 340 kWp and one ENERCON (Aurich, Germany) E-48 wind turbine with a nominal capacity of 800 kW. Wind and photovoltaic electricity first supply the simultaneous island demand. Local conventional generation supplies the residual deficit, while renewable electricity remaining after demand satisfaction becomes available for hydrogen production.
The resource assessment used an annual horizontal solar irradiation of 1931.95 kWh m−2 year−1 and an annual mean wind speed of 7.25 m s−1. These values were treated as model inputs and not as on-site measurements because no long-term ground-measurement campaign was available.
The renewable-energy dispatch priority was defined as follows: wind and photovoltaic generation first supply the simultaneous island electricity demand; the remaining renewable production becomes available to the electrolyzers; production exceeding both electricity demand and electrolyzer absorption capacity is curtailed; and any remaining electricity deficit is supplied by local conventional generation.
The baseline hydrogen-production system comprises two Norsk Hydro (Hydro, Notodden, Norway) HPE30 electrolyzers and one smaller Proton electrolyzer (Hydro, Notodden, Norway). Each HPE30 unit has a rated electricity input of 144 kW, a nominal hydrogen-production rate of 2.7 kg h−1, and a specific electricity consumption of 53.4 kWh kg−1 H2. The Proton unit has a rated electricity input of 14.6 kW, a nominal production rate of 0.1798 kg h−1, and a specific electricity consumption of 81.201 kWh kg−1 H2. The aggregate rated electrical input of the baseline configuration is therefore 302.6 kW.
The HPE30 units were dispatched before the Proton unit because of their lower specific electricity consumption. The Proton unit was treated as a secondary device capable of absorbing residual renewable electricity after the installed HPE30 capacity had been utilized. This priority constitutes an energy-efficiency assumption and not a manufacturer-specified industrial control strategy.
2.3. RETScreen Expert Assessment and Input Data
RETScreen Expert, developed by Natural Resources Canada (Varennes, QC, Canada), was used as the pre-feasibility environment for the renewable-energy calculation. The model defined the project location, organized the monthly climate and renewable-resource inputs, and calculated production for the proposed 340 kWp photovoltaic system and 800 kW ENERCON E-48 wind turbine [28].
In the adopted RETScreen-based calculation, solar availability was represented using an F-chart-based method, while wind-speed variability was represented by a Weibull distribution with a fixed shape parameter of k = 2. The resulting production values were used as the renewable-generation inputs to the chronological dispatch model. Array orientation, tilt, tracking, temperature, and loss effects were handled within the RETScreen project calculation rather than introduced as separate adjustments in the dispatch step.
The electricity-demand input comprised 12 publicly available HEDNO monthly files containing day-ahead hourly demand estimates [29,30].
2.4. Reconstruction of the Hourly Electricity-Demand Series
The electricity-demand chronology was reconstructed from 12 monthly daily-ahead estimation files obtained from the Gavdos electricity-system operator [30]. The files cover March–December 2021 followed by January–February 2022. The resulting dataset therefore represents a continuous rolling 12-month period rather than a January–December calendar year.
The hourly estimates were ordered chronologically and concatenated into a single series containing 8760 values. Each value was interpreted as the estimated average electrical power during the corresponding one-hour interval. The values are operator day-ahead estimates rather than revenue-meter or supervisory-control measurements. The term ‘hourly demand’ is used below for readability, while this distinction is retained in the interpretation of the results. The estimates were not independently validated against metered consumption. Forecast errors can affect the coincidence of renewable generation and demand, the surplus available for electrolysis, and the hydrogen inventory; the reported coverage therefore applies to the operator-estimate scenario.
Monthly electricity consumption was calculated as
where Em is the electricity consumption during month m, m is the set of hourly intervals belonging to that month, Pload,t is the estimated load during hour t, and Δt = 1 h.
Annual electricity consumption was calculated as
The reconstructed series has an annual electricity consumption of 662.63 MWh, a mean load of 75.64 kW, a maximum hourly load of 150 kW and a minimum hourly load of 40 kW. The annual load factor was calculated as
where Ppeak is the maximum hourly load. The resulting annual load factor was 0.504. These quantities were calculated directly from the input hourly series and were not inferred from population or tourism statistics.
2.5. Weather and Renewable-Generation Inputs
Monthly horizontal solar irradiation and wind speed were used to characterize the renewable-energy resource of Gavdos. The annual horizontal solar irradiation was 1931.95 kWh m−2 year−1, while the annual mean wind speed was 7.25 m s−1.
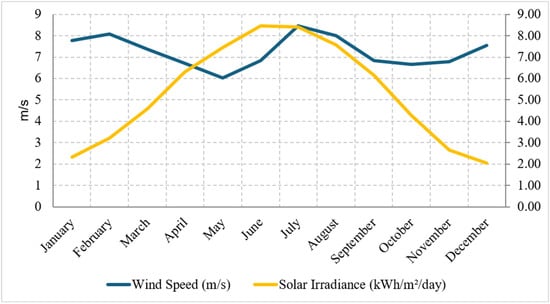
The monthly solar series displays the expected seasonal maximum during summer, whereas the wind resource remains comparatively strong throughout the year. These complementary resource patterns provide the basis for the combined wind–photovoltaic configuration considered in the hourly energy balance.
The RETScreen-based calculations produced twelve representative 24 h photovoltaic and wind profiles, one for each calendar month, for the 340 kWp photovoltaic installation and the 800 kW ENERCON E-48 turbine. For each hour of the March 2021–February 2022 simulation, the renewable-generation value corresponding to the relevant month and hour of day was assigned. This mapping formed continuous 8760 h photovoltaic and wind series, which were aligned with the HEDNO demand chronology.
Because each representative monthly 24 h renewable profile was applied to every day of the corresponding month, the series captures modeled seasonal and diurnal variation but not the observed day-to-day meteorological sequence. The dispatch results are therefore interpreted as a feasibility scenario rather than a reconstruction of historical renewable operation. The same renewable series was applied to every electrolyzer configuration, enabling comparison under identical resource and demand conditions. For the 340 kWp capacity, an annual photovoltaic production of 596.353 MWh corresponds to a specific yield of 1754 kWh kWp−1 year−1 and an implied capacity factor of 20.0%.
2.6. Hourly Electricity Balance and Electrolyzer Dispatch
Total renewable generation during hour t was calculated as the sum of wind and photovoltaic generation:
where PWT,t and PPV,t are the modeled wind and photovoltaic outputs, respectively.
PRES,t = PWT,t + PPV,t
Renewable electricity supplied directly to the island demand was calculated as
Pdirect,t = min (Pload,t, PRES,t)
Renewable electricity remaining after the simultaneous demand had been satisfied was defined as the positive renewable surplus:
Psurplus,t = max (PRES,t − Pload,t, 0)
The residual electricity deficit assigned to local conventional generation was
Pdeficit,t = max (Pload,t − PRES,t, 0)
Because Gavdos was modeled as an autonomous non-interconnected system, no grid-import or grid-export term was included in Equations (5)–(8). Direct chronological renewable coverage was calculated as
This indicator measures the proportion of electricity demand supplied directly by simultaneous renewable generation. It is not equivalent to the ratio of annual renewable production to annual demand because production occurring during surplus hours cannot compensate for deficits occurring at other times without energy conversion and storage.
Five electrolyzer configurations were evaluated: one HPE30 unit; two HPE30 units; two HPE30 units and one Proton unit; three HPE30 units; and three HPE30 units and one Proton unit. The first three define reduced-capacity and baseline cases, whereas configurations containing a third HPE30 unit represent capacity-expansion sensitivities.
For a configuration containing NHPE HPE30 electrolyzers, the electricity supplied to the HPE30 bank during hour t was
where 144 kW is the rated electricity input of each HPE30 unit. The renewable electricity remaining after operation of the HPE30 bank was
PHPE,t = min (Psurplus,t, 144NHPE)
Prem,t = max (Psurplus,t − PHPE,t, 0)
For configurations containing the Proton electrolyzer, its electricity input was calculated as
PProton,t = min (Prem,t, 14.6)
For configurations without the Proton electrolyzer, PProton,t = 0. Hourly gross hydrogen production was calculated from the electricity supplied to each electrolyzer type and its corresponding specific electricity consumption:
where is gross hydrogen production during hour t, 53.4 kWh kg−1 H2 is the specific electricity consumption of the HPE30 units, 81.201 kWh kg−1 H2 is the corresponding value for the Proton unit, and Δt = 1 h.
Fixed specific electricity consumptions of 53.4 and 81.201 kWh kg−1 H2 were applied to the HPE30 and Proton units, respectively, with linear conversion between zero and rated input. Complete equipment-specific part-load curves, minimum operating thresholds, start-up, ramp-rate, degradation, and maintenance characteristics were unavailable in the component dataset. This is a first-order conversion approximation, and its effect on annual production and configuration ranking is not quantified. The adopted specific consumptions were used without a separate plant-wide auxiliary-load model. Additional loads for desalination and water treatment, purification and drying, compression, cooling, storage, and bunkering were not separately deducted from the renewable surplus. Reported hydrogen quantities therefore represent gross modeled production rather than net fuel delivered to the vessel.
2.7. Ferry-Duty and Hydrogen-Inventory Assessment
The maritime assessment uses an assumed aggregate daily service envelope comprising an outward and a return traversal of each of the three route patterns: 50 km for Gavdos–Loutro–Sfakia, 40 km for Gavdos–Loutro, and 40 km for Gavdos–Sfakia [30]. The three distances are added within the same modeled day and doubled for return travel, giving 260 km day−1. This duty is applied on each of the 365 days. It is an aggregate scenario assumption rather than an observed sailing timetable; the three routes are not treated as alternative daily options in this calculation.
Applying the adopted hydrogen-consumption factor of 0.357114 kg H2 km−1 gives
mroute = (260 km day−1)(0.357114 kg H2 km−1) = 92.8497 kg H2 day−1
The fixed consumption factor of 0.357114 kg H2 km−1 is an adopted scenario input from the project dataset [30] rather than a calibrated result for a specified vessel. It was derived from 3000 kg over 21 days, divided by the distance implied by 16.668 km h−1 over 24 h per day. These are proxy assumptions, not a measured vessel duty cycle. The resulting hydrogen requirement represents the reference ferry duty. A vessel-specific hydrodynamic and propulsion model, including speed, passenger loading, displacement, sea state, wind, hotel loads, maneuvering, and propulsion reserves, is outside the present scope. Changes in the duty or consumption factor would change both annual hydrogen demand and the chronological storage requirement.
Hourly hydrogen production was aggregated into daily production:
where Md is the gross hydrogen production during day d and Td is the set of hourly intervals belonging to that day. The daily hydrogen inventory was then calculated chronologically as
where Id is the available gross hydrogen inventory at the end of day d.
Id = Id−1 + mprod,d − mroute
To calculate the working-storage requirement, the cumulative daily hydrogen balance was first defined as
The working-storage requirement was calculated as the maximum peak-to-subsequent-trough drawdown of the cumulative balance:
Finally, two additional days of ferry hydrogen demand were added as an operational reserve:
Sdesign = Sworking + 2mroute
The resulting value represents the usable hydrogen-storage capacity required to bridge the maximum chronological drawdown while retaining the specified two-day operational reserve. It does not represent hydrogen that must necessarily be present at the beginning of every operating year. In the reported chronology, the cumulative balance was initialized at zero on 1 March and increased before the principal seasonal drawdown occurred. If ferry service were to commence later in the annual cycle, the same gross-production balance could be supported by operating the electrolyzers during a pre-service commissioning period or by providing an appropriate opening inventory. A sailing schedule adjusted to seasonal hydrogen availability represents another possible operating strategy, but this alternative was not quantified. The calculated storage requirement is expressed as usable hydrogen mass under the gross, loss-free inventory balance, including the two-day operational reserve. No storage pressure or physical tank volume is assigned. A final storage design must account for operating and minimum delivery pressures, residual unusable inventory, compression and storage losses, and engineering safety margins. The two-day reserve is an operating allowance and does not replace those design margins.
2.8. Scope and Deliberate Exclusions
The methodology constitutes a chronological techno-energetic feasibility assessment. It is not a detailed engineering design, investment-grade financial assessment, or optimized unit-commitment model. The analysis evaluates the extent to which the selected renewable configuration can serve the electricity demand, the amount of renewable surplus available for electrolysis, and the chronological compatibility between hydrogen production and the specified ferry-duty envelope.
No levelized cost of hydrogen, net present value, payback period, or detailed greenhouse-gas balance was calculated because a complete and traceable set of capital costs, replacement schedules, fuel-consumption curves, financing assumptions, and operating costs was not available. Water consumption, desalination requirements, hydrogen-compression energy, storage losses, and allocation to secondary hydrogen uses were also excluded. Introducing numerical values for these quantities without documented sources would create false precision. Consequently, financial viability, investor returns, and a least-cost configuration are not established by the present energy and inventory balances.
The analysis combines operator demand estimates, the selected technology configuration, and modeled renewable-production profiles within a consistent hourly energy-balance framework.
3. Results
3.1. Electricity-Demand Profile
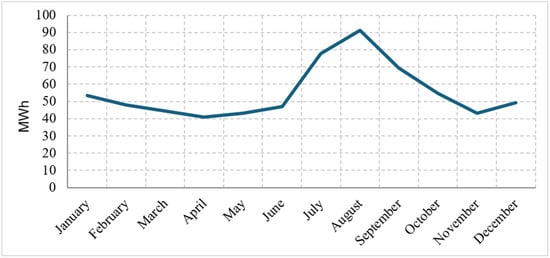
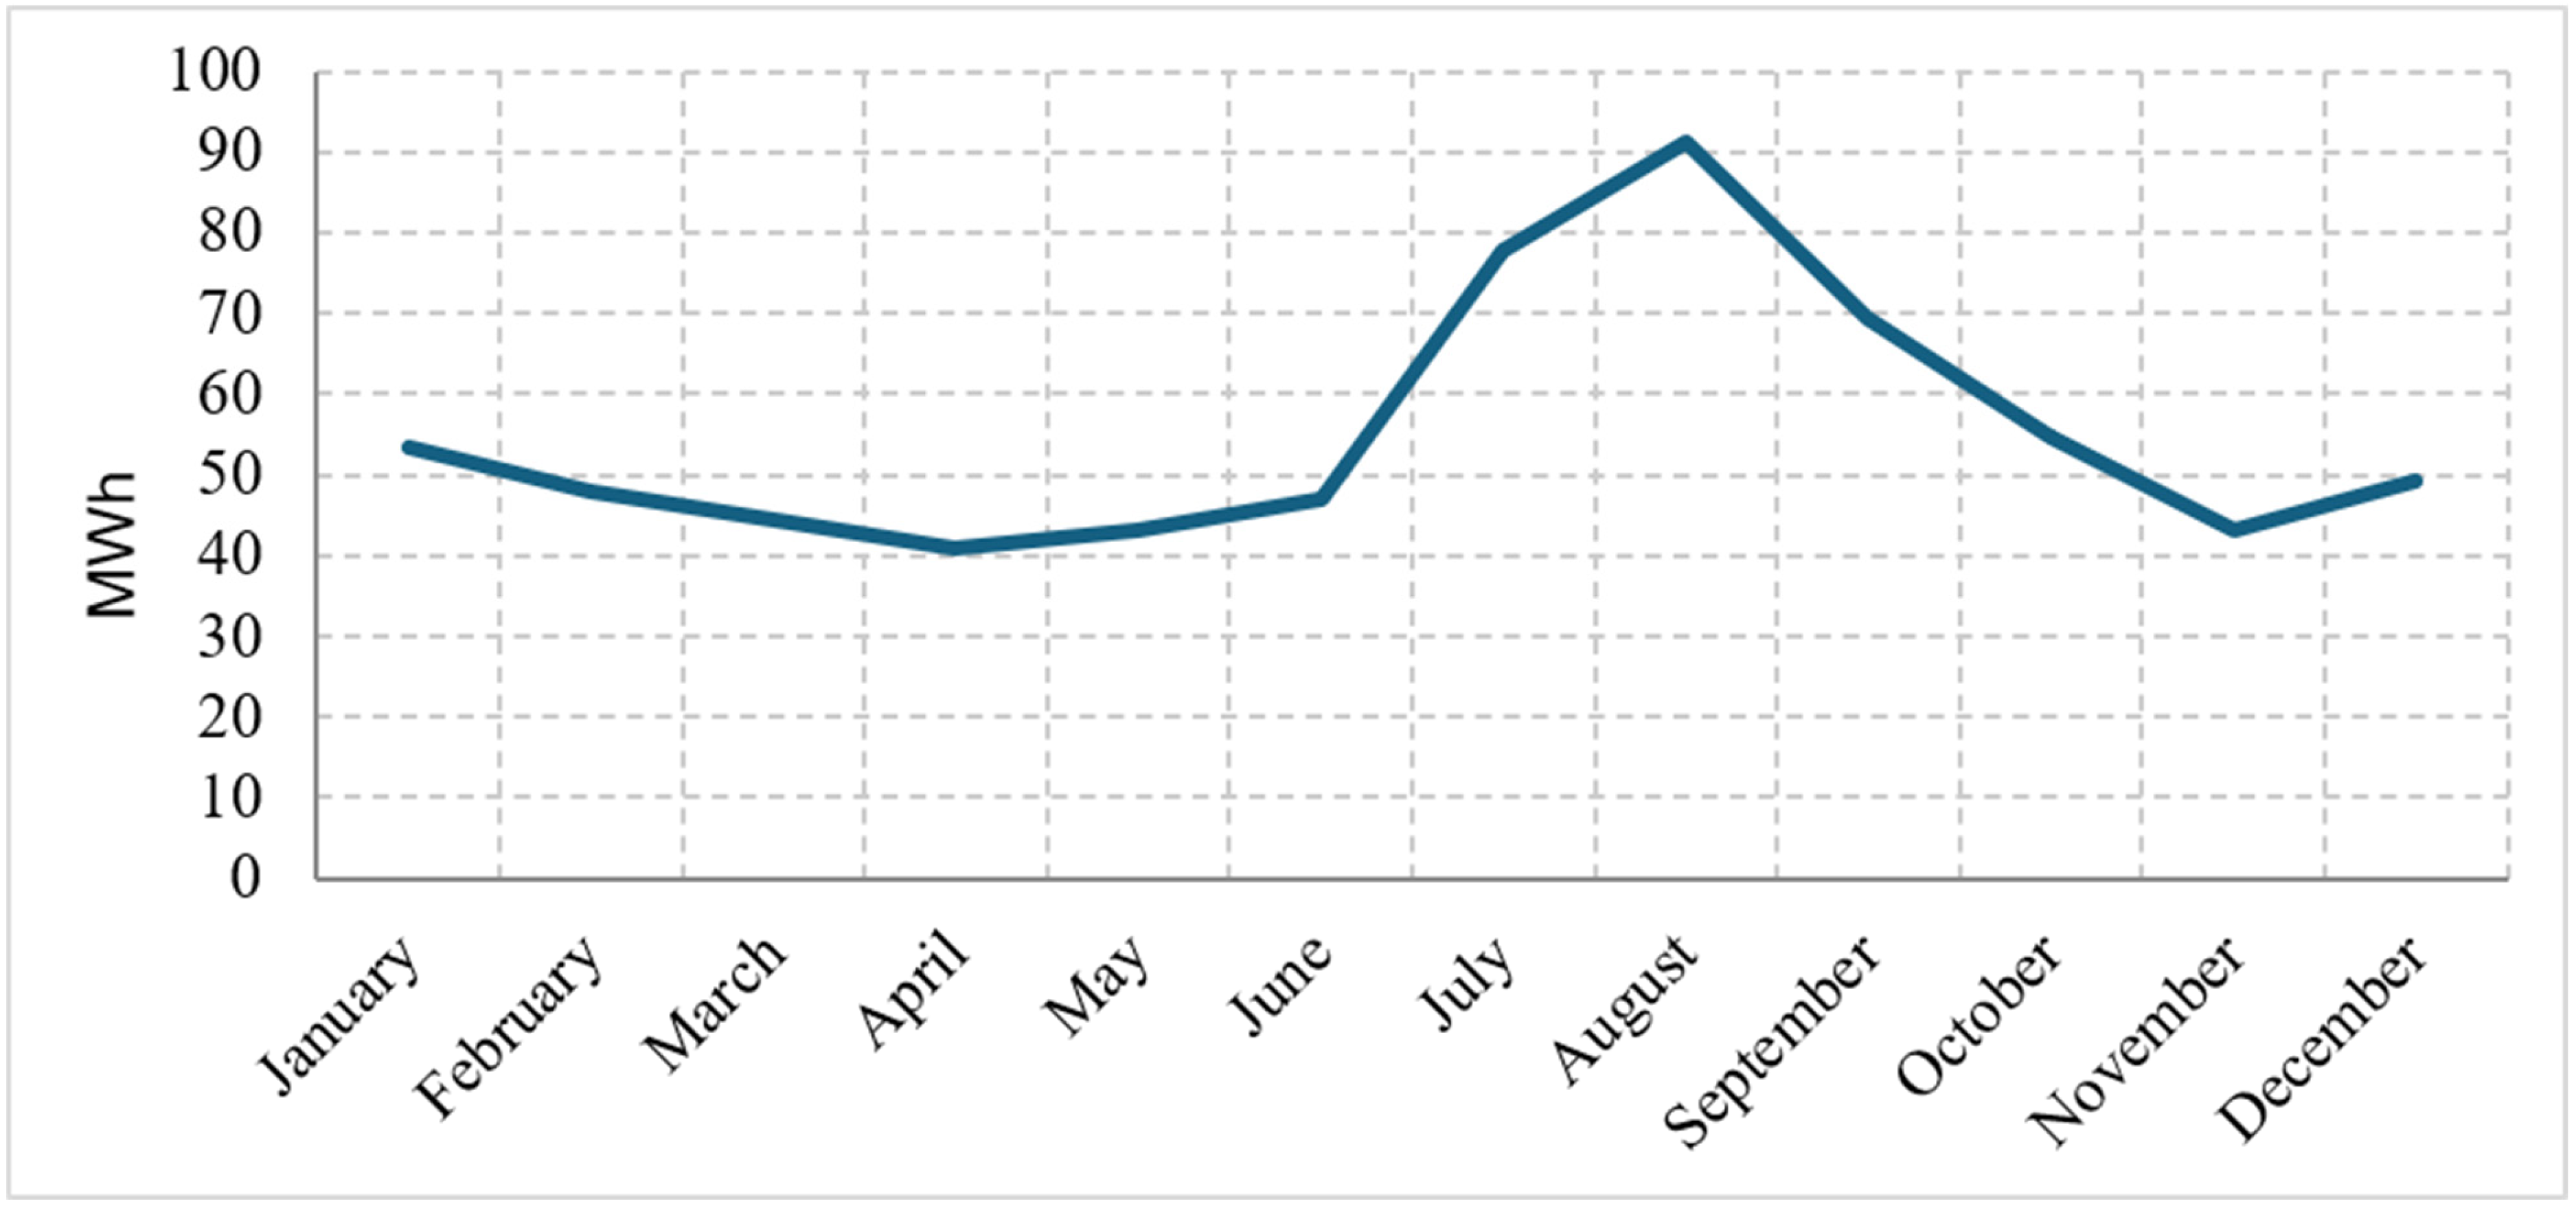
The complete rolling-year demand series comprised 8760 hourly estimates and totaled 662.630 MWh and is presented in Figure 1. The mean load was 75.643 kW, the maximum hourly load was 150 kW, the minimum hourly load was 40 kW, and the annual load factor was 0.504. These values describe the operator day-ahead chronology and are not revenue-meter measurements.
Figure 1.
Monthly electricity-demand estimates reconstructed from the twelve operator data files. Months are rearranged into January–December calendar order for presentation; January–February refer to 2022 and March–December to 2021. The original March 2021–February 2022 sequence is retained in all chronological calculations.
Electricity demand displayed a pronounced summer increase. August had the highest monthly demand, at 91.35 MWh, together with the highest monthly mean load of 122.78 kW and the annual peak of 150 kW. July followed with 77.79 MWh, a mean load of 104.56 kW and a peak of 140 kW. September demand was 69.44 MWh, with a mean load of 96.44 kW and a peak of 120 kW. The lowest monthly electricity requirement occurred in April, at 40.92 MWh. The monthly profile therefore confirms that the principal demand pressure occurs during the summer tourism period.
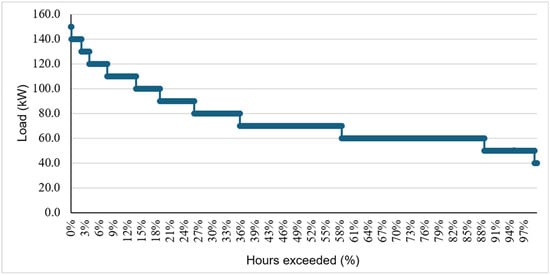
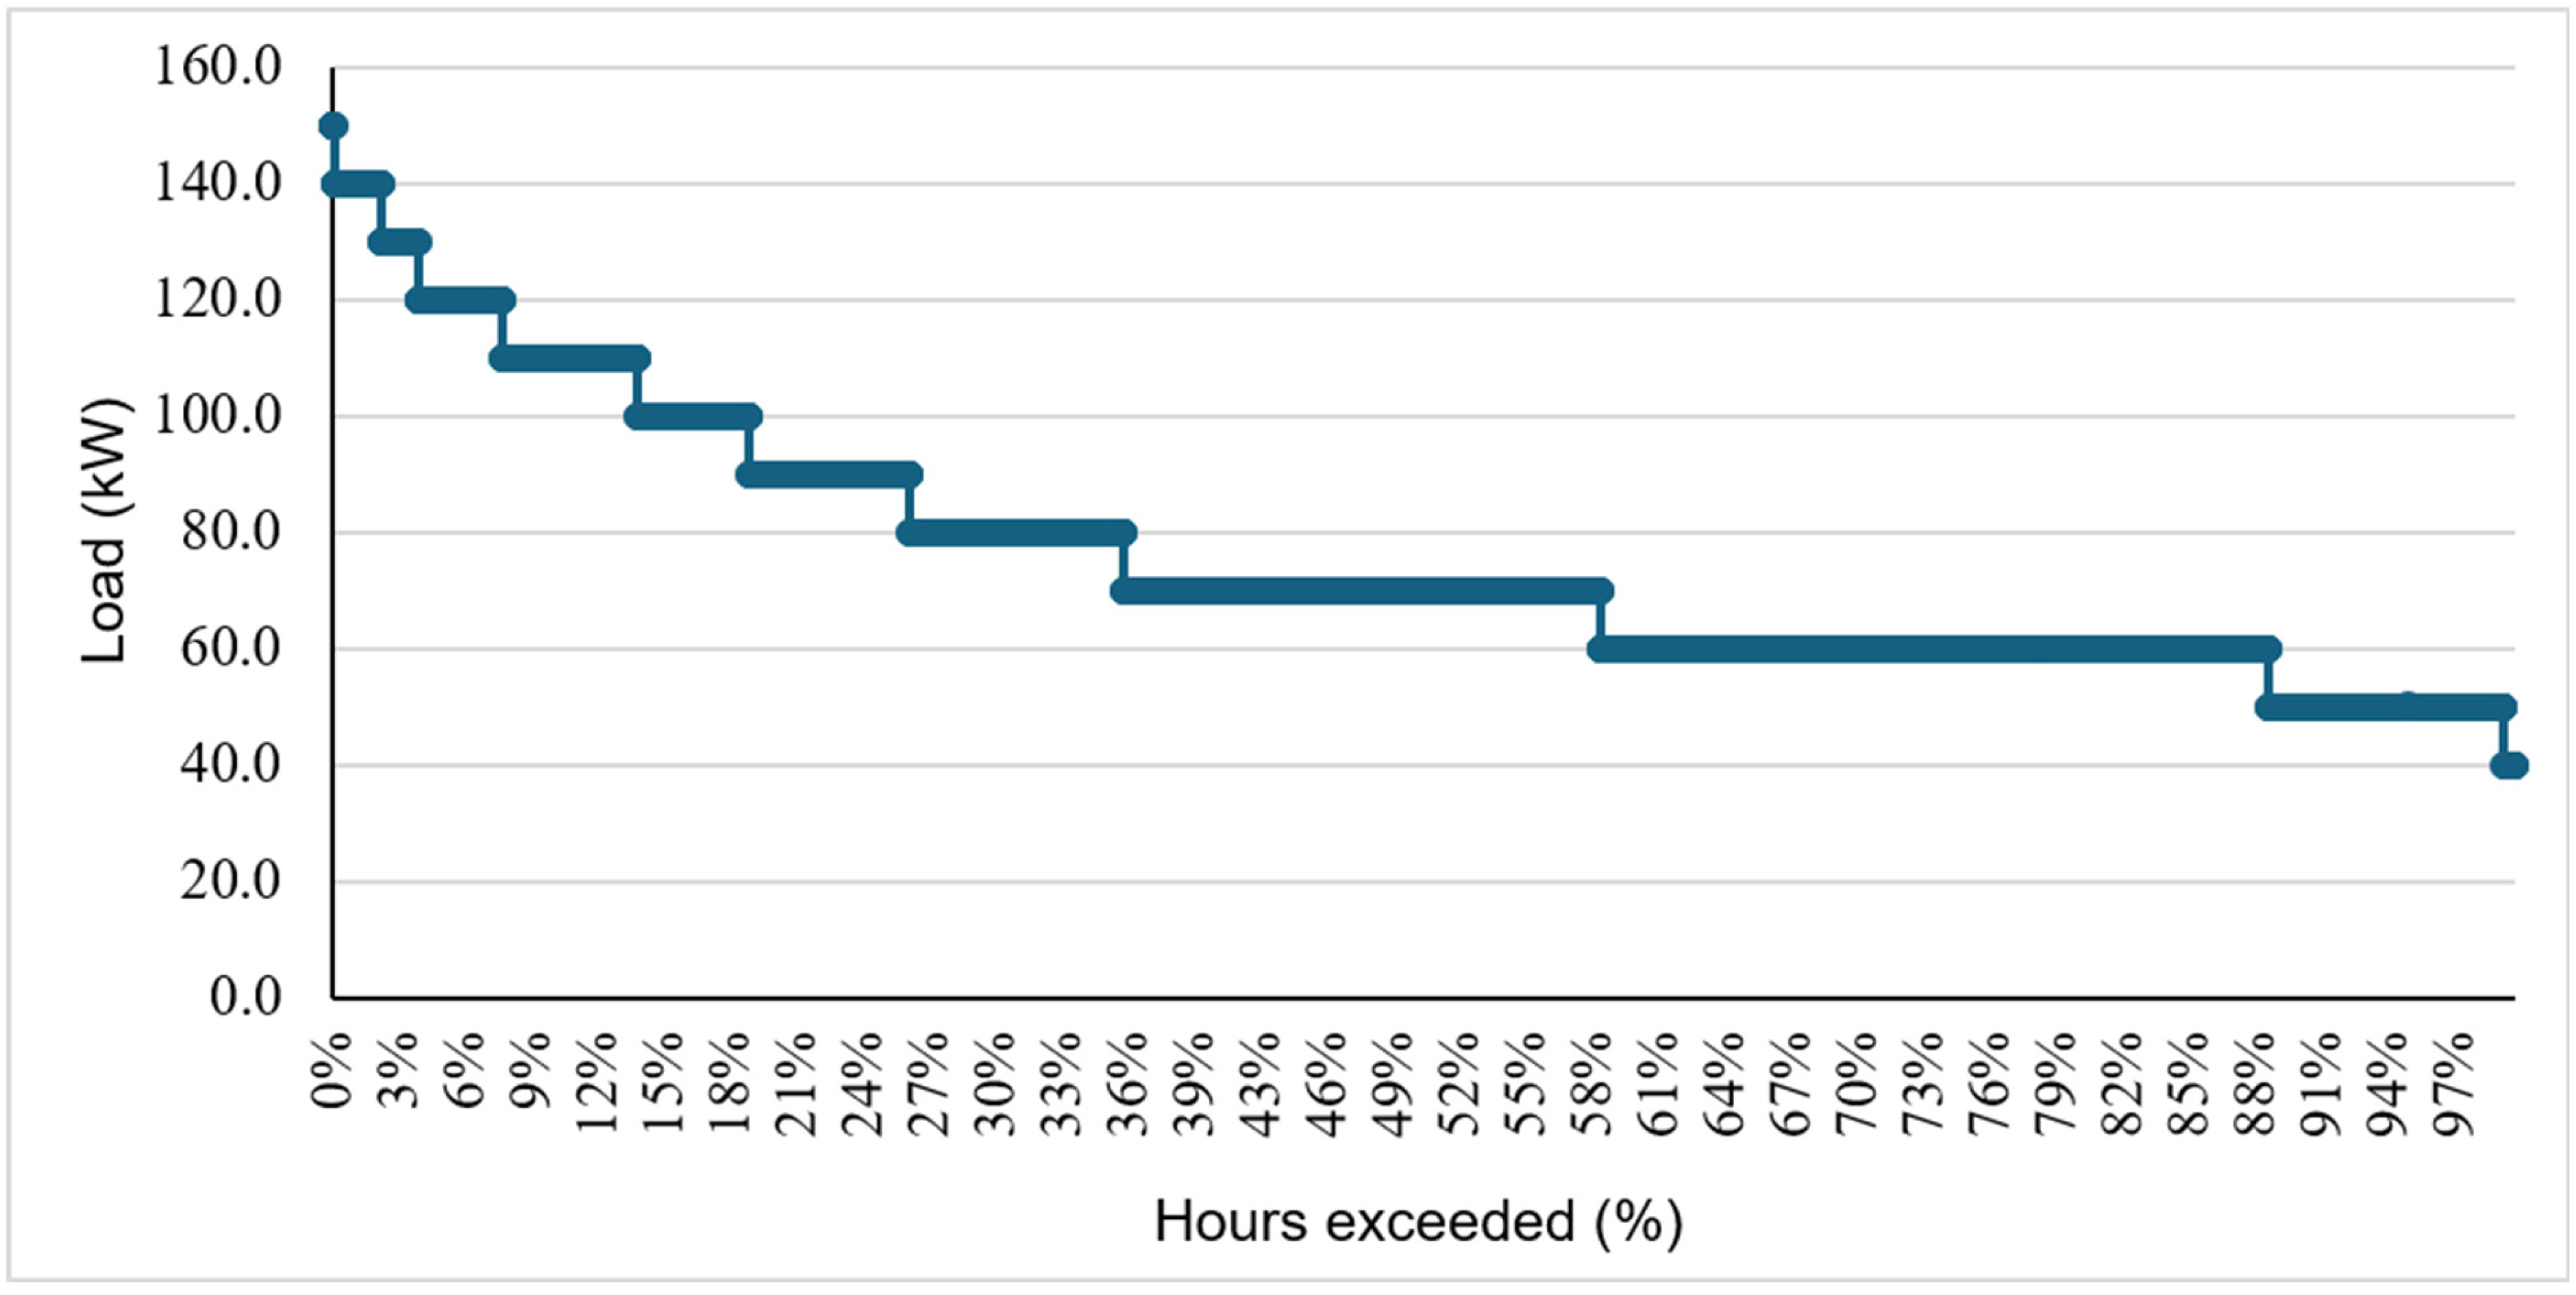
The load-duration curve preserved the distribution of all 8760 hourly estimates. Hourly demand ranged from 40 to 150 kW, with a mean of 75.64 kW. As seen in Figure 2, Its stepped form reflects the resolution of the operator demand estimates, which were reported in increments equivalent to approximately 10 kW. The curve also shows that the annual peak was limited to a relatively small number of hours, whereas most of the year was characterized by substantially lower demand.
Figure 2.
Load-duration curve constructed from all 8760 operator hourly mean-load estimates for the rolling study year.
3.2. Renewable-Resource Characteristics
The monthly renewable-resource series is presented in Figure 3. The annual horizontal solar irradiation was 1931.95 kWh m−2 year−1. Solar availability increased from winter toward June and July before declining through autumn, indicating a pronounced seasonal contribution from the photovoltaic system.
Figure 3.
Monthly solar-irradiation and wind-speed inputs of the study area.
The mean of the twelve monthly wind-speed values was 7.254 m s−1. Wind speed remained comparatively high across the year and reached its maximum during summer. The combined resource profile therefore supports complementary wind and photovoltaic production in the reference configuration.
3.3. Renewable Production and Electricity Balance
Applying the hourly renewable-generation profiles to the reconstructed demand series produced 2889.312 MWh of gross renewable electricity during the rolling. Wind generation accounted for 2292.959 MWh, while photovoltaic generation contributed 596.353 MWh. Gross renewable production was therefore 4.36 times the annual electricity demand. This ratio represents gross generation and must not be interpreted as the proportion of demand supplied directly by renewable energy. For the corrected 340 kWp photovoltaic capacity, the reported annual photovoltaic generation corresponds to a specific yield of 1754 kWh kWp−1 year−1 and an implied capacity factor of 20.0%.
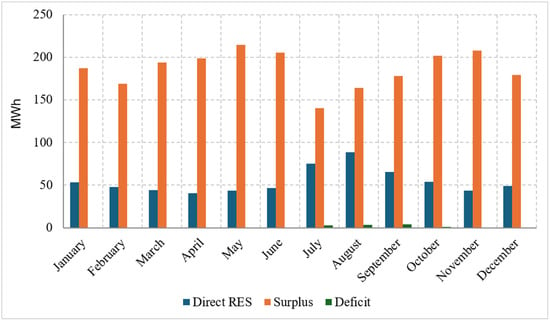
Of the total renewable production, 650.633 MWh supplied the simultaneous island demand directly. The remaining positive renewable surplus was 2238.679 MWh, while the residual electricity deficit was 11.997 MWh. Direct chronological renewable coverage was consequently 98.189%. Because Gavdos was modeled as a non-interconnected system, the residual deficit was assigned to local conventional generation and the renewable surplus was not assigned to grid exports.
Residual deficits occurred during 419 h, corresponding to 4.78% of the year, and the maximum hourly deficit was 102 kW. The deficits were concentrated during the summer demand period. July, August, and September together accounted for 9.755 MWh, or 81.3% of the annual residual deficit. September had the largest monthly deficit, at 3.790 MWh, followed by August at 3.076 MWh and July at 2.889 MWh. No residual deficit occurred in May or December.
The monthly balance therefore shows in Figure 4 that a large annual renewable surplus can coexist with short periods of conventional-generation requirement. Annual renewable-energy abundance alone does not eliminate hourly deficits in an autonomous system.
Figure 4.
Monthly electricity allocation: direct renewable supply, positive renewable surplus and residual electricity deficit.
3.4. Hydrogen Production by Electrolyzer Configuration
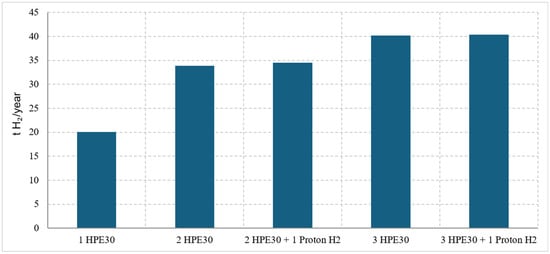
The five electrolyzer configurations produced materially different levels of hydrogen while also exhibiting a clear capacity-utilization trade-off. One HPE30 unit captured 1071.500 MWh of surplus electricity and produced 20.066 t year−1 of gross hydrogen. Its capacity factor was 84.94%, but it utilized only 47.86% of the available renewable surplus.
Increasing the installation to two HPE30 units raised the captured electricity to 1808.169 MWh and gross hydrogen production to 33.861 t year−1. The two units captured 80.77% of the available surplus and operated at an aggregate capacity factor of 71.67%.
The baseline configuration of two HPE30 units and one Proton H2 unit had an installed electrical input of 302.6 kW. It captured 1859.120 MWh, corresponding to 83.05% of the available surplus, and produced 34.488 t year−1 of gross hydrogen. Mean gross production was 94.489 kg day−1, and the aggregate capacity factor was 70.13%. Relative to the two-HPE30 configuration, the Proton unit increased annual production by 0.627 t, as seen in Figure 5.
Figure 5.
Gross annual hydrogen production for the five evaluated electrolyzer configurations.
The three-HPE30 configuration increased captured energy to 2144.581 MWh and gross hydrogen production to 40.161 t year−1. It captured 95.80% of the available surplus, but its aggregate capacity factor decreased to 56.67%. Adding one Proton unit after the three HPE30 units increased annual production by only 0.196 t, resulting in 40.357 t year−1, 96.51% surplus capture and a capacity factor of 55.23%.
These results quantify technical utilization only. They do not identify an economic optimum because a complete cost dataset was outside the scope of the assessment.
3.5. Ferry-Duty Coverage and Hydrogen Inventory
The adopted ferry-duty envelope of 260 km day−1 required 92.8497 kg H2 day−1, equivalent to 33.890 t year−1. The baseline electrolyzer configuration produced 34.488 t year−1 and therefore provided a positive annual gross margin of 0.598 t year−1. This corresponds to an annual-average margin of approximately 1.64 kg day−1, or 1.74% of gross hydrogen production.
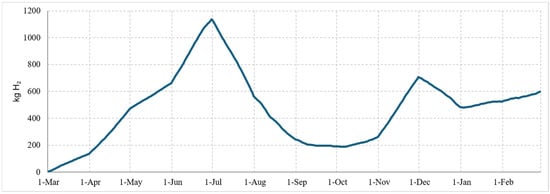
Daily gross hydrogen production ranged from 69.09 to 111.79 kg and equaled or exceeded the constant ferry requirement on 235 of 365 days. On the remaining 130 days, stored hydrogen was required to supplement simultaneous production. These days represent periods of inventory withdrawal rather than unserved ferry demand.
As presented in Figure 6, with the cumulative balance initialized at zero on 1 March, hydrogen production during the first part of the rolling year established sufficient inventory before the principal drawdown period. The balance reached 1136.5 kg on 30 June, subsequently decreased to 189.1 kg on 3 October, and ended the rolling year at 598.2 kg. It did not become negative during the examined chronology. The maximum peak-to-subsequent-trough drawdown was 947.4 kg. Adding the two-day operational reserve of 185.7 kg resulted in a required usable storage capacity of 1133.1 kg. Consequently, the baseline configuration satisfies the constant ferry duty on a gross-production basis when the calculated storage capacity and chronological charging sequence are included.
Figure 6.
Cumulative gross hydrogen balance for the constant ferry-duty requirement, initialized with zero inventory.
Secondary hydrogen use could be considered after net ferry-fuel coverage, and the operational reserve has been verified. The present gross-production balance does not quantify a deliverable allocation to another application.
4. Discussion
4.1. Integrated Interpretation of the Study Configuration
The integrated system gives priority to wind and photovoltaic generation for the island electricity demand and directs the remaining renewable electricity to hydrogen production for transport. This formulation connects hourly electricity adequacy, renewable-surplus utilization, electrolyzer operation, and ferry-fuel availability within a single chronological framework.
The complete 8760 h demand series permits direct calculation of renewable coverage, residual deficits, surplus electricity, and hydrogen production. Using the same twelve representative monthly 24 h wind and photovoltaic profiles for all configurations ensures that performance differences arise from electrolyzer capacity and dispatch rather than changes in the renewable input [30]. The resulting annual renewable generation is 2889.312 MWh, comprising 2292.959 MWh from wind and 596.353 MWh from photovoltaics. Because the monthly profiles are repeated by day, these results describe the modeled feasibility scenario and not a historical day-to-day operating record.
The resource characterization combines annual solar irradiation of 1931.95 kWh m−2 with an average wind speed of approximately 7.25 m s−1. The GEO.RAE portal provides spatial context for the wind resource [30], while the Global Solar Atlas supports assessment of solar-resource magnitude and location [31]. The manufacturer’s E-48 technical data provide the turbine-specific basis for interpreting wind-energy performance [32]. Together, these sources establish the renewable-resource context for the Gavdos feasibility assessment.
The integrated formulation is particularly relevant for small islands, where relatively small changes in demand, component availability, or transport duty can determine whether an annual renewable surplus is operationally usable.
4.2. Electricity Balance in a Permanently Non-Interconnected Planning Context
No mainland electricity interconnection is scheduled for Gavdos in the examined planning program; continued non-interconnection is therefore adopted as the study boundary [26]. This boundary materially changes the interpretation of the results. Renewable shortfalls cannot be assumed to be covered by imports from the continental system, and excess production cannot be exported. Local generation, local flexibility, and dispatchable reserve must consequently be assessed as parts of the same autonomous system.
The rolling-year demand totals 662.630 MWh, with a mean load of 75.643 kW, a peak of 150 kW, and a load factor of 0.504. The moderate load factor confirms that the system is shaped by pronounced temporal variation rather than by a stable baseload. The summer tourism period is particularly important: August has the highest monthly demand at 91.35 MWh, while July and September also exhibit elevated mean and peak loads. This seasonal concentration explains why an annual average alone is inadequate for equipment sizing.
The renewable-generation scenario produces 2292.959 MWh year−1 from wind and 596.353 MWh year−1 from photovoltaics, giving a gross renewable-to-demand ratio of 4.36. Nevertheless, only 650.633 MWh is delivered directly to the load. A residual deficit of 11.997 MWh remains across 419 h, and the maximum hourly residual reaches 102 kW. Thus, direct renewable coverage of 98.19% is a strong annual energy result, but it is not equivalent to autonomous operation, firm capacity, or continuous security of supply. Moreover, 81.3% of the annual deficit occurs from July through September, when demand is greatest. The chronological analysis therefore identifies a seasonal adequacy issue that is hidden by the annual gross surplus.
Hatziargyriou et al. described Greek non-interconnected islands as systems in which high renewable penetration must be reconciled with reserve requirements, frequency control, operational security, and continued reliance on dispatchable generation [5]. The 419 deficit hours found here provide a case-specific expression of that general constraint. Even in a scenario with a renewable nameplate capacity of 1.14 MW, approximately 7.6 times the 150 kW demand peak, the conventional units cannot be declared redundant.
Blechinger et al. demonstrated the broad techno-economic potential of wind–PV–battery hybridization across small diesel-based island systems while also identifying storage as an integral part of high renewable penetration [6]. The Gavdos results are compatible with that system-level finding because high gross production coexists with both large surpluses and short residual deficits. However, the present study does not calculate battery capacity or operation and therefore cannot quantify how much of the 11.997 MWh deficit could be shifted rather than supplied by conventional generation.
Alves et al. showed for Pico and Faial that interconnecting the two island systems was decisive in reaching a fully renewable configuration in their modeled case [7]. That result is especially instructive for Gavdos by contrast. Because interconnection is not foreseen within the adopted planning boundary, the balancing benefit identified by Alves et al. is unavailable here. Any progression from 98.19% annual direct coverage toward firm local adequacy must therefore be demonstrated through local storage, demand management, renewable diversification, or dispatchable low-carbon capacity. The current results do not yet identify the least-cost combination of those measures.
4.3. Meaning and Allocation of the Renewable Surplus
The model produces 2238.679 MWh year−1 of electricity above the simultaneous island demand. This large surplus is the physical basis for the hydrogen assessment. It should not, however, be interpreted as electricity that is automatically recoverable at constant efficiency. Its value depends on timing, electrolyzer capacity, part-load behavior, storage constraints, and the alternative flexibility services required by the electricity system.
Mathiesen and Lund compared seven approaches for integrating fluctuating renewable generation through hour-by-hour whole-system analysis [10]. Their principal relevance to Gavdos is methodological: flexibility options should be assessed according to the service they provide and their interaction with the complete energy system. Short-duration electrical balancing and the production of a transport fuel are different services, even if both can absorb renewable surplus. The present model assigns all positive surplus to electrolysis up to the installed electrolyzer capacity, but it does not model competition with a battery, reserve provision, flexible water production, or other island loads. The reported hydrogen yield is therefore conditional on the adopted dispatch priority rather than proof that electrolysis is the uniquely optimal use of every surplus hour.
O’Shaughnessy et al. showed that renewable curtailment can result from oversupply, network limits, and temporal mismatch and that eliminating all curtailment is not necessarily the economically optimal objective [33]. Although their analysis concerns larger electricity markets, the principle is applicable to the Gavdos feasibility case: the existence of 2238.679 MWh year−1 of surplus does not by itself justify sufficient conversion equipment to absorb every kilowatt-hour. The declining electrolyzer capacity factor observed as installed capacity increases is the direct local expression of this trade-off.
The baseline configuration of two HPE30 units and one Proton H2 unit captures 1859.120 MWh year−1, equivalent to 83.05% of the positive renewable surplus. The remaining surplus occurs during periods when instantaneous excess generation exceeds the 302.6 kW electrolyzer rating. Increasing electrolyzer capacity raises surplus capture, but it also spreads capital equipment over fewer equivalent full-load hours. The five configurations should therefore be interpreted as a utilization-versus-capture comparison, not as a ranking based only on annual hydrogen output.
4.4. Electrolyzer Configuration and Operational Implications
The configuration results reveal a clear capacity-utilization trade-off. One HPE30 unit operates at a high annual capacity factor of 84.94% but captures only 47.86% of the renewable surplus and produces 20.066 t H2 year−1. Two HPE30 units capture 80.77% of the surplus and produce 33.861 t H2 year−1 at a capacity factor of 71.67%. Adding the 14.6 kW Proton H2 unit raises production to 34.488 t H2 year−1 and creates the small positive annual margin relative to the ferry requirement. Three HPE30 units increase production to 40.161 t H2 year−1 and surplus capture to 95.80%, but their capacity factor falls to 56.67%. Once three HPE30 units are installed, the Proton unit adds only 0.196 t H2 year−1 because little residual surplus remains within its dispatch range.
These results explain why the baseline two-HPE30-plus-Proton configuration is a meaningful threshold case, but they do not establish that it is economically optimal. The Proton unit has a higher specific electricity consumption than the HPE30 and contributes only 0.627 t H2 year−1 to the two-HPE30 configuration. Nevertheless, that relatively small contribution changes the annual ferry balance from a slight shortfall to a 0.598 t year−1 surplus. Its value is therefore determined by service adequacy and storage consequences, not only by annual conversion efficiency.
Ursúa et al. reviewed the technical characteristics of water electrolysis and emphasized that efficiency, operating range, system integration, and balance-of-plant requirements are central to renewable-hydrogen production [13]. The fixed specific electricity consumptions used here are applied consistently in the feasibility calculation, but they cannot represent the full variation of system efficiency with load and operating state.
Kojima et al. examined how renewable-power fluctuations affect electrolysis and highlighted the importance of time-dependent operation when coupling electrolyzers directly to variable generation [15]. Their contribution supports the use of chronological dispatch in the present study while also showing why a simple linear conversion from zero to rated power is only a first-order approximation.
Kotowicz et al. derived hydrogen-generator efficiency and auxiliary-power behavior as functions of relative load using experimentally characterized electrolyzers [14]. Their analysis is directly relevant to the Gavdos configuration comparison because the candidate units experience different utilization levels. Omitting part-load efficiency and auxiliary consumption is likely to affect both annual production and the apparent advantage of adding small incremental capacity.
Reksten et al. demonstrated that electrolyzer plant size and technology development materially affect capital-cost estimates [16]. Their model addresses plants in the MW-to-GW range, whereas the Gavdos train is only 302.6 kW. It would therefore be inappropriate to transfer large-plant cost projections directly to this case. The absence of current vendor quotations, replacement schedules, availability data, and balance-of-plant costs means that no levelized cost of hydrogen or payback claim should be made from the present results.
The technically defensible interpretation is consequently narrower: the baseline train nearly matches the adopted annual ferry demand under idealized gross-production assumptions, while the three-HPE30 configuration provides a larger production margin at lower utilization. Selection between them requires cost, availability, part-load, maintenance, and storage data beyond the present feasibility scope.
4.5. Ferry Adequacy, Chronological Inventory, and Port Implications
The ferry calculation is the most consequential result of the chronological assessment. The adopted duty of 260 km day−1 and hydrogen intensity of 0.357114 kg km−1 produce a constant requirement of 92.8497 kg day−1, or 33.890 t year−1. The baseline electrolyzer configuration produces 34.488 t year−1, giving a positive annual gross margin of 0.598 t year−1. Although this margin is relatively small, the chronological calculation shows that its operational significance depends on storage and system initialization rather than on the comparison of production and demand on each individual day.
Gross production equals or exceeds the ferry requirement on 235 days and is lower on 130 days. The latter should not be interpreted as 130 days of interrupted ferry service. They are days during which the balance shifts from direct production to previously stored hydrogen. With zero opening inventory on 1 March, the cumulative balance remains non-negative because sufficient hydrogen is accumulated before the main seasonal drawdown. The maximum drawdown of 947.4 kg defines the required working capacity, while the addition of a two-day reserve increases the usable storage-capacity requirement to 1133.1 kg.
The starting date nevertheless affects the required opening inventory. If the system begins operating before the high-production period, the store can be charged progressively from renewable-hydrogen production. Alternatively, electrolysis can begin during commissioning before regular ferry operation. If service commences immediately before the maximum seasonal drawdown, an opening usable inventory of up to 1133.1 kg, including the reserve, would be required under the adopted constant-duty assumption. A seasonally adjusted ferry schedule could also reduce the storage drawdown, although this option requires a vessel-specific timetable and was not separately simulated.
Capacity expansion provides another feasible pathway. The three-HPE30 configuration produces 40.161 t H2 year−1, exceeding annual ferry demand by 6.271 t, while the three-HPE30-plus-Proton configuration produces 40.357 t year−1 and provides a margin of 6.467 t. These configurations offer greater production headroom for auxiliary consumption and operational variability, although their lower capacity factors and higher installed capacity require economic evaluation. Their final storage requirements should also be established through configuration-specific chronological calculations.
The baseline hydrogen balance is conditional on the generation inputs, ferry duty, and opening inventory. Its annual gross margin is 0.598 t, equivalent to 1.74% of gross production. A reduction of 1.74% in effective annual hydrogen availability would exhaust that margin. This arithmetic threshold does not quantify part-load or auxiliary losses. The positive gross annual margin and non-negative modeled inventory do not establish net ferry-fuel adequacy when the omitted plant and delivery-chain requirements are considered. The three-HPE30 configuration provides greater gross-production headroom, while its net fuel adequacy and configuration-specific storage requirement also require validation.
The European Maritime Safety Agency concluded that hydrogen is more promising for short-sea shipping than for deep-sea service but identified low volumetric energy density, onboard storage demand, cost, infrastructure, and safety as central barriers [21]. The Gavdos–Crete connection fits the short-sea application category. The estimated 1.13 t of usable shore-side storage capacity nevertheless shows that hydrogen conditioning, storage, safety distances, and bunkering infrastructure would constitute material elements of a small-island port design.
Fu et al. reviewed maritime hydrogen technologies across production, storage, end use, cost, and regulation [22]. Their system-wide treatment indicates why gross electrolyzer output alone is an incomplete boundary for a maritime-fuel claim. A complete design must connect renewable production to conditioned fuel at the delivery pressure and then to the vessel powertrain and operating profile.
Van Sickle et al. documented the MV Sea Change, a commercial 75-passenger ferry with a 360 kW fuel-cell powertrain and 246 kg of hydrogen stored at 250 bar [23]. This demonstration confirms that a fully hydrogen-fueled passenger ferry can be built, certified, and operated. It does not validate the Gavdos consumption proxy, because the vessels, routes, speeds, passenger capacities, storage arrangements, and operating schedules differ substantially. The comparison is useful primarily to show that tank pressure, usable onboard inventory, refueling frequency, and certification are design variables that must be specified explicitly.
Di Ilio et al. sized hybrid fuel-cell and battery powertrains for a Greek car-passenger ferry using an operational profile provided by the shipping company and then examined machinery layout, payload, and hydrodynamic consequences [24]. Their methodology identifies a principal design input required for the Gavdos case: vessel-specific power demand over the route. A constant kg km−1 factor cannot represent speed, sea state, hotel load, maneuvering, reserve, battery contribution, or the effect of hydrogen storage on vessel payload.
Perna et al. designed a complete renewable-hydrogen supply chain for a small passenger ferry, jointly sizing renewable generation, electrolysis, hydrogen production, and the ferry service requirement before evaluating economics [25]. Their contribution demonstrates that route coverage and hydrogen cost emerge from integrated sizing and an explicit energy-management strategy. The chronological inventory analysis used here is a necessary step in that direction, while a full techno-economic evaluation remains a subsequent design stage.
Züttel’s review of hydrogen storage methods showed that the high mass-specific energy of hydrogen is accompanied by low volumetric density and demanding storage conditions [34]. For Gavdos, the estimated usable capacity of approximately 1.13 t must therefore be converted into a pressure-defined physical storage design before its footprint, safety distances, cost, and compatibility with the port can be determined.
4.6. Comparison with Previous Island Studies
The baseline configuration leaves an annual gross surplus of 598.2 kg after satisfying the adopted ferry duty. This surplus is temporally variable and should not be represented as a fixed daily quantity available for other uses. Secondary hydrogen applications could be considered on an interruptible basis only after net ferry-fuel coverage has been verified and when stored inventory exceeds the ferry-protection threshold and two-day reserve. A larger electrolyzer configuration would provide greater scope for additional mobility demand, while any fixed secondary allocation would require its own chronological assessment.
The result does not preclude broader hydrogen mobility on islands; it shows that mobility claims must be derived from the specific resource, demand, and service chronology. Dimou et al. modeled a wind–photovoltaic system for Anafi and allocated surplus electricity to heat pumps and hydrogen for bus and private-vehicle mobility [17]. Their work established the value of cross-sector coupling for a non-interconnected Greek island, but its hydrogen and vehicle results arise from Anafi-specific loads, renewable capacities, and transport routes and cannot be transferred numerically to Gavdos.
Fragoso et al. optimized a hydrogen-storage system for Flores Island using a multi-objective genetic algorithm that considered renewable curtailment, emissions, and levelized electricity cost [18]. Their selected solution increased renewable penetration to 89% and substantially reduced diesel use, but it also increased the levelized cost of electricity. This finding is directly relevant to the Gavdos interpretation: higher renewable utilization and lower fossil-fuel use do not automatically demonstrate economic superiority.
Ali et al. developed an optimized PV–wind–battery–hydrogen configuration for public transport on Favignana and evaluated both cost and greenhouse-gas performance [20]. The explicit inclusion of battery storage, transport duty, and economic indicators distinguishes that work from the present techno-energetic feasibility assessment. Gavdos may support a comparable integrated mobility concept, although cost and emissions evaluation requires an expanded system boundary.
Hanley et al. reviewed hydrogen pathways in integrated low-carbon energy-system models and found that hydrogen’s role depends strongly on electrification, renewable penetration, competing technologies, and the depth of decarbonization required [35]. Their synthesis supports prioritizing hydrogen where direct electrification is difficult. In the Gavdos case, this makes the ferry the most defensible initial hydrogen service, provided that the vessel duty and delivery chain are validated.
4.7. Scope of the Findings and Requirements for Decision-Grade Design
The results support three principal conclusions. First, the operator data form a complete rolling-year demand-estimate chronology. Second, the renewable configuration produces sufficient gross surplus to make hydrogen production technically relevant, while still leaving 419 h of electrical deficit. Third, the baseline electrolyzer train approximately matches the annual ferry requirement, but chronological operation requires substantial hydrogen inventory.
The study is a techno-energetic feasibility assessment rather than a detailed engineering design. The electricity model does not include unit commitment, reserve, voltage and frequency behavior, battery operation, forced outages, or network constraints. The electrolyzer model does not include minimum load, start-up, ramping, degradation, maintenance, water treatment, or balance-of-plant power. The ferry model does not include a vessel-specific propulsion profile, sailing calendar, adverse-weather operation, vessel propulsion and fuel reserves, storage pressure, compression, bunkering, or fuel-cell conversion. Cost, emissions, and safety assessment are outside the present scope. These exclusions restrict the findings to the stated input scenario and gross energy and hydrogen balances; they do not establish a physically constrained generating-unit schedule, net ferry-fuel adequacy, a final storage installation, or financial viability.
Further system development should incorporate correctly geolocated hourly weather, validated component models, meter-verified load where available, local reserve and storage operation, current electrolyzer operating envelopes, pressure-defined hydrogen storage, and a vessel-specific power and route schedule. The present study provides the chronological energy and inventory basis for those subsequent engineering and economic design stages.
5. Conclusions
This study evaluated an integrated renewable-hydrogen configuration for Gavdos under the planning boundary that the island remains non-interconnected over the examined horizon. No mainland-grid import or export was permitted, and the wind, photovoltaic, and hydrogen systems were assessed as part of a locally balanced system. The principal contribution is an 8760 h coupled assessment of electricity demand, renewable generation, surplus-fed electrolysis, ferry hydrogen demand, and hydrogen inventory.
The twelve operator data files form a complete 8760 h rolling-year demand-estimate series totaling 662.630 MWh, with a mean load of 75.643 kW, a peak of 150 kW, and a load factor of 0.504. Demand is strongly seasonal and reaches its highest monthly value in August. The operator estimates provide the chronological electricity-demand basis for the feasibility assessment.
RETScreen Expert was used to calculate the renewable-production inputs for the 340 kWp photovoltaic system and the 800 kW wind turbine. The adopted calculation used an F-chart-based representation of solar availability and a Weibull wind-speed distribution with k = 2. Twelve representative monthly 24 h profiles were mapped by calendar month and hour of day to the independently constructed HEDNO demand chronology and used consistently across all configurations.
In the renewable-generation scenario, gross production is 2889.312 MWh year−1, or 4.36 times annual demand. Nevertheless, only 650.633 MWh supplies the simultaneous load directly. Direct renewable coverage is 98.19%, while 11.997 MWh of residual deficit remains across 419 h and reaches 102 kW in the most demanding hour. July–September accounts for 81.3% of the annual deficit. A large annual renewable surplus consequently does not demonstrate electrical autonomy: dispatchable local generation or explicitly modeled local flexibility remains necessary because mainland balancing is unavailable.
The baseline electrolyzer train (two HPE30 units plus one Proton H2 unit) has a rated input of 302.6 kW, captures 83.05% of the positive renewable surplus, operates at a 70.13% aggregate capacity factor, and produces 34.488 t H2 year−1 gross. A three-HPE30 configuration raises production to 40.161 t H2 year−1 and captures 95.80% of the surplus, but its capacity factor decreases to 56.67%. The baseline therefore represents a meaningful service-threshold case. Final configuration selection requires part-load performance, availability, maintenance, balance-of-plant, storage, and current cost data.
For the adopted ferry duty, annual gross hydrogen demand is 33.890 t year−1. The baseline configuration produces 34.488 t year−1 and provides a positive annual margin of 0.598 t. Daily production is lower than the ferry requirement on 130 days, but these days do not represent service interruptions: previously accumulated hydrogen maintains a non-negative cumulative balance throughout the March–February chronology. The maximum seasonal drawdown is 947.4 kg, resulting in a usable storage-capacity requirement of 1133.1 kg after inclusion of the two-day operational reserve. The chronological gross hydrogen result is conditional on the adopted generation inputs, daily ferry duty, and opening inventory; it does not establish net fuel-delivery adequacy. If ferry operation begins later in the seasonal cycle, equivalent coverage can be supported through pre-service hydrogen production or an appropriate opening inventory. The three-HPE30 configuration provides a larger annual production margin and represents an alternative where additional operating headroom is required. Final confirmation must account for compression, purification, storage and dispensing losses, auxiliary demand, equipment availability, bunkering, and vessel-specific operation.
Gavdos is therefore a credible candidate for a renewable-electricity and ferry-hydrogen system. The results demonstrate gross-production compatibility under the specified resource, dispatch, and ferry-duty assumptions and quantify the associated usable hydrogen-mass requirement. Detailed design should incorporate validated hourly weather and component models, meter-verified demand where available, explicit reserve and storage operation, electrolyzer availability, a pressure-defined hydrogen delivery chain, and a vessel-specific propulsion profile. Cost, emissions, water, safety, and permitting analyses should accompany the next engineering stage.
Author Contributions
Conceptualization, P.P. and S.V.; methodology, P.P., A.D. and S.V.; data curation, P.P.; formal analysis, A.K. and S.V.; validation, A.D. and A.K.; visualization, A.K.; writing—original draft preparation, P.P. and S.V.; writing—review and editing, A.D., A.K. and S.V.; supervision, S.V. All authors have read and agreed to the published version of the manuscript.
Funding
The research was partially funded by the project BioFairNet, which has received funding from the European Commission’s Horizon Europe research and innovation program under Grant Agreement No. 101181568.
Institutional Review Board Statement
Not applicable.
Informed Consent Statement
Not applicable.
Data Availability Statement
The HEDNO day-ahead demand files used to construct the demand chronology are publicly available from HEDNO. The processed data, calculation formulas, and scenario outputs supporting the findings are presented in this manuscript and can be fully available from the corresponding author upon reasonable request.
Acknowledgments
During the preparation of this manuscript, the authors used OpenAI ChatGPT 5.6 for editing, formula checks, and document formatting. The authors independently reviewed and verified the text and take full responsibility for the content of the publication.
Conflicts of Interest
The authors declare no conflicts of interest.
References
- European Commission. The European Green Deal; COM(2019) 640 Final; European Commission: Brussels, Belgium, 2019; Available online: https://eur-lex.europa.eu/legal-content/EN/TXT/?uri=CELEX:52019DC0640 (accessed on 20 August 2026).
- European Commission. REPowerEU Plan; COM(2022) 230 Final; European Commission: Brussels, Belgium, 2022; Available online: https://eur-lex.europa.eu/legal-content/EN/TXT/?uri=COM:2022:230:FIN (accessed on 20 August 2026).
- International Maritime Organization. 2023 IMO Strategy on Reduction of GHG Emissions from Ships; IMO: London, UK, 2023; Available online: https://www.imo.org/en/ourwork/environment/pages/2023-imo-strategy-on-reduction-of-ghg-emissions-from-ships.aspx (accessed on 20 August 2026).
- European Parliament and Council. Regulation (EU) 2023/1805 of 13 September 2023 on the use of renewable and low-carbon fuels in maritime transport, and amending Directive 2009/16/EC. Off. J. Eur. Union 2023, L234, 48–100. Available online: https://eur-lex.europa.eu/eli/reg/2023/1805/oj/eng (accessed on 20 August 2026).
- Hatziargyriou, N.; Margaris, I.; Stavropoulou, I.; Papathanassiou, S.; Dimeas, A. Noninterconnected island systems: The Greek case. IEEE Electrif. Mag. 2017, 5, 17–27. [Google Scholar] [CrossRef] [Scilit]
- Blechinger, P.; Cader, C.; Bertheau, P.; Huyskens, H.; Séguin, R.; Breyer, C. Global analysis of the techno-economic potential of renewable energy hybrid systems on small islands. Energy Policy 2016, 98, 674–687. [Google Scholar] [CrossRef] [Scilit]
- Alves, M.; Segurado, R.; Costa, M. On the road to 100% renewable energy systems in isolated islands. Energy 2020, 198, 117321. [Google Scholar] [CrossRef] [Scilit]
- Luna-Rubio, R.; Trejo-Perea, M.; Vargas-Vázquez, D.; Ríos-Moreno, G.J. Optimal sizing of renewable hybrids energy systems: A review of methodologies. Sol. Energy 2012, 86, 1077–1088. [Google Scholar] [CrossRef] [Scilit]
- Cebulla, F.; Haas, J.; Eichman, J.; Nowak, W.; Mancarella, P. How much electrical energy storage do we need? A synthesis for the U.S., Europe, and Germany. J. Clean. Prod. 2018, 181, 449–459. [Google Scholar] [CrossRef] [Scilit]
- Mathiesen, B.V.; Lund, H. Comparative analyses of seven technologies to facilitate the integration of fluctuating renewable energy sources. IET Renew. Power Gener. 2009, 3, 190–204. [Google Scholar] [CrossRef] [Scilit]
- Marocco, P.; Ferrero, D.; Lanzini, A.; Santarelli, M. Optimal design of stand-alone solutions based on RES + hydrogen storage feeding off-grid communities. Energy Convers. Manag. 2021, 238, 114147. [Google Scholar] [CrossRef] [Scilit]
- Kafetzis, A.; Ziogou, C.; Panopoulos, K.D.; Papadopoulou, S.; Seferlis, P.; Voutetakis, S. Energy management strategies based on hybrid automata for islanded microgrids with renewable sources, batteries and hydrogen. Renew. Sustain. Energy Rev. 2020, 134, 110118. [Google Scholar] [CrossRef] [Scilit]
- Ursúa, A.; Gandía, L.M.; Sanchis, P. Hydrogen production from water electrolysis: Current status and future trends. Proc. IEEE 2012, 100, 410–426. [Google Scholar] [CrossRef] [Scilit]
- Kotowicz, J.; Jurczyk, M.; Węcel, D. The possibilities of cooperation between a hydrogen generator and a wind farm. Int. J. Hydrogen Energy 2021, 46, 7047–7059. [Google Scholar] [CrossRef] [Scilit]
- Kojima, H.; Nagasawa, K.; Todoroki, N.; Ito, Y.; Matsui, T.; Nakajima, R. Influence of renewable energy power fluctuations on water electrolysis for green hydrogen production. Int. J. Hydrogen Energy 2023, 48, 4572–4593. [Google Scholar] [CrossRef] [Scilit]
- Reksten, A.H.; Thomassen, M.S.; Møller-Holst, S.; Sundseth, K. Projecting the future cost of PEM and alkaline water electrolysers: A CAPEX model including electrolyser plant size and technology development. Int. J. Hydrogen Energy 2022, 47, 38106–38113. [Google Scholar] [CrossRef] [Scilit]
- Dimou, A.; Moustakas, K.; Vakalis, S. The role of hydrogen and H2 mobility on the green transition of islands: The case of Anafi (Greece). Energies 2023, 16, 3542. [Google Scholar] [CrossRef] [Scilit]
- Fragoso, D.R.; dos Santos, A.; Fernandes, E.C. Increasing RES penetration through H2 technologies on Flores Island, Azores: A techno-economic analysis. Int. J. Hydrogen Energy 2023, 48, 19846–19861. [Google Scholar] [CrossRef] [Scilit]
- Bionaz, D.; Marocco, P.; Ferrero, D.; Sundseth, K.; Santarelli, M. Life cycle environmental analysis of a hydrogen-based energy storage system for remote applications. Energy Rep. 2022, 8, 5080–5092. [Google Scholar] [CrossRef] [Scilit]
- Ali, Q.; Di Silvestre, M.L.; Zizzo, G. Hydrogen-powered public transport: A sustainable future for Favignana Island. Int. J. Hydrogen Energy 2025, 193, 152419. [Google Scholar] [CrossRef] [Scilit]
- European Maritime Safety Agency. Potential of Hydrogen as Fuel for Shipping; EMSA: Lisbon, Portugal, 2023; Available online: https://emsa.europa.eu/publications/reports/item/5062-potential-of-hydrogen-as-fuel-for-shipping.html (accessed on 20 August 2026).
- Fu, Z.; Lu, L.; Zhang, C.; Xu, Q.; Zhang, X.; Gao, Z.; Li, J. Fuel cell and hydrogen in maritime application: A review on aspects of technology, cost and regulations. Sustain. Energy Technol. Assess. 2023, 57, 103181. [Google Scholar] [CrossRef] [Scilit]
- Van Sickle, E.; Ralli, P.; Pratt, J.W.; Klebanoff, L.E. MV Sea Change: The first commercial 100% hydrogen fuel cell passenger ferry in the world. Int. J. Hydrogen Energy 2025, 105, 389–404. [Google Scholar] [CrossRef] [Scilit]
- Di Ilio, G.; Bionda, A.; Ponzini, R.; Salvadore, F.; Cigolotti, V.; Minutillo, M.; Georgopoulou, C.; Mahos, K. Towards the design of a hydrogen-powered ferry for cleaner passenger transport. Int. J. Hydrogen Energy 2024, 95, 1261–1273. [Google Scholar] [CrossRef] [Scilit]
- Perna, A.; Jannelli, E.; Di Micco, S.; Romano, F.; Minutillo, M. Designing, sizing and economic feasibility of a green hydrogen supply chain for maritime transportation. Energy Convers. Manag. 2023, 278, 116702. [Google Scholar] [CrossRef] [Scilit]
- Hellenic Electricity Distribution Network Operator. Seven-Year Generation Development Programme for the Non-Interconnected Islands, 2024–2030; HEDNO: Athens, Greece, 2025. [Google Scholar]
- Athens-Macedonian News Agency. Forward Green/Renewable EnergyTech: Tο χρονοδιάγραμμα ηλεκτρικής διασύνδεσης των νησιών [The Timeline for the Electrical Interconnection of the Islands]. 13 March 2025. Available online: https://www.amna.gr/business/article/890097/Forward-Green-Renewable-EnergyTech-To-chronodiagramma-ilektrikis-diasundesis-ton-nision (accessed on 24 August 2026).
- Natural Resources Canada. RETScreen Expert Clean Energy Management Software; Government of Canada: Ottawa, ON, Canada, 2026; Available online: https://natural-resources.canada.ca/maps-tools-publications/tools-applications/retscreen (accessed on 24 August 2026).
- Hellenic Electricity Distribution Network Operator. Proposed Day-Ahead Schedule for Gavdos: Monthly Hourly Demand-Estimate Files, March–December 2021 and January–February 2022; publicly available XLSX files; Hellenic Electricity Distribution Network Operator: Athens, Greece, 2021–2022. [Google Scholar]
- Regulatory Authority for Energy. GEO.RAE Energy Geospatial Portal: Candidate Renewable-Energy Projects and Wind-Potential Data for Gavdos; Regulatory Authority for Energy: Athens, Greece, 2023; Available online: https://geo.rae.gr/ (accessed on 20 August 2026).
- World Bank Group; ESMAP; Solargis. Global Solar Atlas: Photovoltaic Power Potential and Solar Resource. Available online: https://globalsolaratlas.info (accessed on 20 August 2026).
- ENERCON GmbH. E-48 Wind Turbine Technical Data and Power-Curve Information; ENERCON: Aurich, Germany, 2023. [Google Scholar]
- O’Shaughnessy, E.; Cruce, J.R.; Xu, K. Too much of a good thing? Global trends in the curtailment of solar PV. Sol. Energy 2020, 208, 1068–1077. [Google Scholar] [CrossRef] [Scilit]
- Züttel, A. Hydrogen storage methods. Naturwissenschaften 2004, 91, 157–172. [Google Scholar] [CrossRef] [Scilit]
- Hanley, E.S.; Deane, J.P.; Ó’Gallachóir, B.P. The role of hydrogen in low carbon energy futures: A review of existing perspectives. Renew. Sustain. Energy Rev. 2018, 82, 3027–3045. [Google Scholar] [CrossRef] [Scilit]
Disclaimer/Publisher’s Note: The statements, opinions and data contained in all publications are solely those of the individual author(s) and contributor(s) and not of MDPI and/or the editor(s). MDPI and/or the editor(s) disclaim responsibility for any injury to people or property resulting from any ideas, methods, instructions or products referred to in the content. |
© 2026 by the authors. Licensee MDPI, Basel, Switzerland. This article is an open access article distributed under the terms and conditions of the Creative Commons Attribution (CC BY) license.