


Abstract
Transmission expansion planning must ensure an infrastructure capable of meeting growing demand while simultaneously taking into account economic, operational, and reliability criteria. This paper proposes a multi-period methodology for transmission expansion planning formulated as a mixed-integer linear programming (MILP) problem based on DC-OPF, which incorporates single transmission-corridor contingencies under the N–1 criterion and the cost of Expected Energy Not Supplied (EENS) in the objective function. The methodology jointly determines the circuits to be built, their commissioning phase, and system operation for the different states considered. The model’s performance is evaluated on the 6-bus Garver system and IEEE RTS-24 systems for a horizon comprising years 0, 5, and 10, and is compared with a traditional TEP approach. The results show that incorporating reliability modifies the location and timing of investments, as well as generation dispatch and the distribution of power flows. In year 10, the cost obtained using the proposed methodology exceeds that of the traditional TEP by approximately 50.5% for Garver and 10.7% for IEEE RTS-24. In the latter system, the selected reinforcements allow for zero values of EENS, LOLP, and LOLE to be achieved in years 5 and 10 for the evaluated contingencies. The results demonstrate that the proposed methodology explicitly quantifies the trade-off among investment cost, operating cost, and the expected consequences of load curtailment, and that this trade-off depends significantly on network topology and initial redundancy.
1. Introduction
Transmission Expansion Planning (TEP) is one of the most critical issues in electric power system planning, as it determines the investments required to ensure a secure, reliable, and economically efficient energy supply in the face of growing demand, the integration of new generation sources, and changes in the system’s operating conditions. Because expansion decisions involve large-scale investments and a long-term planning horizon, an inappropriate selection of expansion alternatives can compromise both the operational security and the economic viability of the system for decades. Consequently, the TEP has evolved from a problem focused exclusively on cost minimization to a decision-making process in which economic, technical, and operational aspects must be considered simultaneously [1,2,3].
The last few decades have seen advances in optimization techniques that have significantly increased the level of detail and computational efficiency with which the TEP problem can be addressed. Among these techniques, the use of Mixed-Integer Linear Programming (MILP) has become popular along with related models based on Direct Current Optimal Power Flow (DC-OPF), as the models perform well in incorporating discretization of investment decisions while retaining solution times that are relevant to large-scale power systems [4,5,6]. While simplified compared to AC models, various works have reported that these models provide a good trade-off between accuracy and computational burden for long-term planning studies [7,8].
Advancements in optimization techniques have been coupled with a recognition in the literature that the economically optimal expansion plan may lead to an undesirable performance in the presence of component failures, unpredicted demand, and uncertain generation. For these reasons, reliability criteria based on risk have been incorporated into planning studies to assess the impact of service disruptions. EENS, LOLP, and LOLE are some of the more popular metrics used to evaluate the performance of power systems [9,10].
Some studies have shown that incorporating probabilistic thinking changes the best investments when compared to decisions made using only deterministic models [11,12,13,14,15]. Many existing methods approach reliability as a post-evaluation method, or incorporate a single probabilistic criterion, which leads to constrained representation for the risk of performance of the system under study.
In addition, operational security is another fundamental requirement in the planning of transmission systems. In practice, the deterministic N–1 criterion has become the standard used by electric system operators to ensure that the grid remains within its operational limits in the event of the unavailability of any single component. Incorporating this criterion into the expansion problem has made it possible to develop investment plans that are more robust in the face of contingencies; however, it also significantly increases the computational complexity of the problem due to the large number of scenarios that must be evaluated [16,17,18,19].
Recent studies have made progress on both introducing probabilistic reliability and including operational security constraints, but these advancements have been made independently. Therefore, many studies focus on representing uncertainty and reliability, while others address the N–1 criterion, and there are only a few studies that address both within a single optimization framework. Furthermore, the combined use of the EENS, LOLP, and LOLE indices to support expansion decisions has been used infrequently, especially when used together with explicit operational security constraints.
Considering these gaps in the literature, this paper proposes a methodology for transmission expansion planning using Mixed-Integer Linear Programming (MILP) within a Direct Current Optimal Power Flow (DC-OPF) framework. The proposed method incorporates EENS into the objective function to capture the expected cost of supply interruptions during the optimization; the LOLP and LOLE metrics are used to assess the performance of the solutions obtained. The deterministic N–1 criterion is used to analyze transmission contingencies in conjunction with the other optimization criteria, to construct expansion plans that integrate economic criteria, probabilistic reliability, and operational security.
The main contributions of this work are as follows:
- A multi-period MILP formulation based on DC-OPF is developed to jointly determine transmission expansion and system operation under normal and contingency states.
- Expected Energy Not Supplied (EENS) is explicitly monetized in the objective function, allowing the expected economic consequences of load curtailment to influence expansion decisions.
- EENS, LOLP, and LOLE are jointly evaluated to characterize the probabilistic reliability performance of the resulting expansion plans.
- Single transmission contingencies are explicitly represented through N–1 operating states, enabling their operational and reliability consequences to be evaluated within the planning framework.
- The methodology is assessed using the Garver 6-bus and IEEE RTS-24 systems under a three-stage planning horizon.
The remainder of this paper is organized as follows. Section 2 reviews the relevant literature on transmission expansion planning, probabilistic reliability, and security criteria. Section 3 presents the proposed mathematical formulation and solution procedure. Section 4 describes the test systems and assessment scenarios. Section 5 presents and discusses the results. Finally, Section 6 summarizes the main conclusions and outlines directions for future research.
2. Related Works
2.1. Transmission Expansion Planning
The importance of the transmission system expansion planning process as a catalyst for the continuous growth of electric power systems has attracted a great deal of interest over the last few decades. The main objective of this problem is to determine the timing, the capacity, and the location of future transmission system infrastructure in order to fulfill the anticipated increase in demand while guaranteeing operational reliability at an optimal total cost for the system. Because of the discontinuity of expansion decisions and the intermixing of technical and economical influences, the problem of transmission expansion planning (TEP) is a challenging problem of combinatorial optimization of high complexity [1,2].
Prior to the advent of modern electricity systems, this problem was addressed with a set of methodologies based on engineering restraints and successive power flows. Successful implementation of this approach allowed the planning and development of transmission systems for several decades. However, this approach provided reasonable results only to a skilled planner and could not efficiently represent uncertainty or the growth and complexity of electric systems and demands. Due to these constraints, optimal mathematical models were developed in order to support the planning of electric systems by expressing the physical limits of the transmission network.
Latorre et al. [1] evaluated different methods in terms of the representation of the grid and planning stage horizon and the optimization methods. Their contribution was quite relevant in the context of the advancement of the literature at that time, as they showed that the selection of a methodology is primarily a matter of determining the adequate trade-off between the accuracy of the model and the computational burden. This approach is still valid today. Hemmati et al. [2] extended Latorre et al.’s [1] study by focusing on the integration of uncertainty and different markets, especially the integration of renewable generation in planning. They showed that, unlike in the past, the planning problem shifted from a focus on cost minimization to a focus on integrating various technical and economic criteria in planning.
Currently, the methodologies used to solve the TEP problem can be grouped into three broad categories: deterministic models, stochastic models, and robust models. Deterministic models continue to be widely used due to their simplicity and low computational effort, and are suitable when future scenarios can be represented by expected values of demand and generation. However, the growth of renewable generation and the uncertainty inherent in modern electric power systems have driven the development of stochastic models capable of considering multiple operating scenarios, as well as robust optimization formulations aimed at obtaining solutions that are less sensitive to variations in system parameters [3,4].
Optimization techniques have made it easier to solve large scale expansion problems. Among many alternatives, Mixed-Integer Linear Programming (MILP) is one of the most popular techniques. This is due to the fact that binary decisions related to the establishment of new transmission lines can be easily expressed using MILP. In addition, this is combined with a convenient mathematical framework that can be easily expressed and solved using efficient optimization algorithms.
The authors Li et al. [4] add that MILP models strike a good balance between the time needed for computations, solution quality, and numerical stability, and therefore continue to be the most popular techniques in recent research related to transmission expansion planning.
The strength of MILP models is closely related to the use of the Direct Current Optimal Power Flow (DC-OPF) model. As a linear approximation to power flow, the DC-OPF can incorporate constraints related to the generation schedule and balance, as well as transmission constraints, without introducing the nonlinearities that are typical of AC models. Because of these characteristics, the DC-OPF is a powerful tool to deal with complicated power systems. Most of the existing large scale systems can be easily solved using linear optimization techniques [5,6]. This approach can be simplified at the expense of some approximations. Some studies show that, in the context of long-term planning studies, this model is able to answer the questions of interest, which are the identification of possible economic corridors for transmission expansion, without losing accuracy. Electric power systems are complex, and simplifications to the model can help power system planning.
There are acknowledged limitations of linearized models in literature, and AC-OPF formulations are more precise in representing the behavior of power systems. This is especially the case when voltage stability, energy loss, or reactive power support play a significant role in the study. Wang and Chiang also indicate that neither the AC nor DC models are generally applicable; rather, choice of model should be based on the objectives of the study, along with the efficiency versus accuracy trade-off. Because of this, DC-OPF based models are still preferred in planning, as most models strike the best balance between accuracy and ease of computing [7,8].
One of the more recent changes in the traditional TEP problem is the addition of more complex elements. The TEP problem includes the integration of a large amount of renewable generation, operational flexibility, more energy storage, more extreme event resilience, and the decarbonization of electric systems. All of these have increased the scope for planning [3,4]. This shift has transformed TEP into a multi-criteria planning problem in which investment cost, security, sustainability, and reliability must be considered simultaneously.
In addition to transmission investment costs, more comprehensive TEP formulations have incorporated operating costs and other system-level economic terms to better represent the trade-off between network reinforcement and system operation [20]. In the proposed formulation, this economic representation is extended by explicitly incorporating the expected cost of unsupplied energy, allowing transmission investment decisions to account for the economic consequences of load curtailment under the considered contingency states.
Evolution of TEP has shifted the focus from the cost of investment to the integration of other planning criteria and reliability. The increasing emphasis on reliability has strengthened the need for planning models capable of representing the performance of alternative expansion solutions under different operating conditions and contingency states.
Table 1 provides a comparison of the main features of the methodologies reviewed regarding the use of probabilistic indices, the incorporation of reliability into the planning process, and the main concerns of each approach.
Table 1.
Comparison of representative reliability assessment methodologies adopted in transmission expansion planning.
As shown in Table 1, the EENS is the most widely used index in the reviewed studies, while the combined use of EENS, LOLP, and LOLE remains less common. Furthermore, a significant portion of the methodologies assess reliability after obtaining the expansion plan, which reduces computational complexity but prevents probabilistic risk from directly influencing investment decisions.
2.2. Security-Constrained Transmission Expansion Planning
The importance of security constraints in transmission expansion planning is growing as modern power systems push against their technical limits with more renewable generation and increasing demand for electricity. Under such conditions, planning based on economic or reliability criteria alone may provide only a marginal system response to the outage of key network elements. As a result, security evaluation during transmission expansion planning has shifted from being a post-optimization validation stage to being a primary approach for evaluating the security of transmission expansion plans.
The N–1 criterion requires the power system to remain operationally feasible following the outage of any single considered component, such as a transmission circuit, transformer, or generating unit. It is widely adopted by transmission system operators as a practical compromise between operational security and computational complexity.
Different mathematical formulations have incorporated security constraints into transmission expansion planning. One of the more popular methods is to integrate security analyses directly into the optimization model through the solution of Security-Constrained Optimal Power Flows (SCOPF) for every option being considered for expansion. This formulation assures that thermal limits, generation, and power balance constraints are satisfied for normal operation and contingency cases. While the results of this approach provide planning with expanded security, it introduces a significantly larger optimization problem, since each contingency case adds a new operating constraint.
Several authors have designed contingency screening methods to rapidly facilitate identification of the worst-case outages. These methods greatly reduce the number of security constraints while preserving the essentials of system security. Some other papers provide contingency analyses in the optimal expansion plan as a validation tool using the N–1 criterion, as opposed to an optimization constraint. Although this methodology substantially reduces the burden of computation, it is possible that network reinforcements will be required in the event that security constraints are violated in the post-optimization assessment.
Some recent contributions have studied combinations of the deterministic security criteria and reliability assessment in probabilistic terms. The aim of these studies is to integrate the efficiency of operation, security, and adequate provision of the system. These studies consider both the analysis of contingencies and the assessment of reliability in a probabilistic sense in a single framework. However, in most of the existing studies, the integration of these two types of evaluations is limited. While the determination of the degree of reliability of system elements focuses on the assessment of the consequences of system failure, the determination of security constraints focuses on the operational feasibility of the system in certain contingencies. Because of this, these assessments are performed separately and not in an integrated optimization framework.
According to the existing literature, the incorporation of security constraints improves the robustness of transmission expansion plans. Most of the existing techniques either oversimplify the assessment of probabilistic reliability while emphasizing deterministic security or concentrate on reliability indices without explicitly incorporating security constraints into the optimization framework. Thus, designing planning models for integrating probabilistic reliability assessment and deterministic security constraints is a substantial gap in modern research of transmission expansion planning.
The main features of the reviewed studies are summarized in Table 2. This table compares a few landmark security-constrained transmission expansion planning techniques based on the security approach they apply and the key methodological shortcomings found in the literature.
Table 2.
Comparison of representative methodologies for security-constrained transmission expansion planning.
As summarized in Table 2, different strategies have been proposed to incorporate security considerations into transmission expansion planning. While recent approaches have significantly improved the representation of contingency scenarios through SCOPF formulations, topology optimization, and contingency screening techniques, each methodology presents a trade-off between computational efficiency and security accuracy. Furthermore, most existing approaches emphasize deterministic security assessment, whereas the simultaneous integration of probabilistic reliability indices and security constraints within a unified optimization framework remains limited.
2.3. Comparative Analysis and Discussion
Previous sections show that the development of expansion planning has shifted from cost-based deterministic formulations to frameworks incorporating assessments of reliability and operational security. Investment decisions must now consider all three (economic, technical and operational) when designing power systems that can accommodate high levels of uncertain demand and generation from renewable energy resources.
Two main research streams can be identified in the literature, both of which focus on adequacy from the perspective of reliability and security, respectively. Security-oriented research is concerned with ensuring operational security via deterministic contingency criteria, especially the N–1 criterion, by employing SCOPF, contingency screening, and topology control. Reliability-oriented research uses methods that integrate reliability analyses with the optimization process in order to facilitate the optimization of system performance when considering the effects of component failures, such as by using EENS, LOLP and LOLE.
Security- and reliability-oriented research stream address performance of the transmission network. However these research streams have been developed separately. Security-oriented research considers deterministic security constraints within a post-optimization framework, whereas reliability-oriented research considers performance metrics within an optimization framework. As a result, there have been few attempts to address reliability and security in a unified transmission planning framework within a single research stream.
To consolidate main features from the literature, Table 3 summarizes some representative planning-focused methods and their main modeling features. These features include the planning horizon, the network representation, probabilistic reliability levels, planning security restrictions, capability for topology optimization, and the integration of reliability and security in the optimization framework.
Table 3.
Comparison of representative transmission expansion planning methodologies.
The comparative analysis indicates that existing methodologies generally emphasize either probabilistic reliability assessment or deterministic security constraints. Although several studies have addressed these aspects individually or through partially integrated frameworks, the simultaneous treatment of multi-period expansion planning, probabilistic reliability assessment, and explicit N–1 contingency states within a unified optimization framework remains limited. This gap motivates the formulation proposed in this work.
3. Mathematical Formulation
This section presents the mathematical formulation of the proposed transmission expansion planning model, which integrates economic, operational, reliability, and security considerations within a unified framework. The problem is formulated as a Mixed-Integer Linear Programming (MILP) model based on a Direct Current Optimal Power Flow (DC-OPF) representation, allowing discrete expansion decisions to be modeled while preserving computational tractability.
The model simultaneously determines the installation of new transmission circuits, generation dispatch, active power flows, nodal voltage angles, and unsupplied load. Expected Energy Not Supplied (EENS) is incorporated into the objective function so that the expected economic cost of supply interruptions directly influences expansion decisions.
N–1 contingency states are explicitly represented through the individual unavailability of transmission corridors. For each operating state, the model enforces nodal power balance, generation limits, transmission capacity limits, DC power-flow relationships, and allows feasible load curtailment when the available generation and transmission capacity are insufficient to fully supply demand. Therefore, the proposed formulation does not impose a strict N–1 contingency-state constraint requiring zero load shedding for every contingency. Instead, it explicitly evaluates the system response to each considered N–1 transmission-corridor contingency and incorporates the expected economic consequences of load curtailment into the expansion problem through EENS.
The planning horizon is divided into several planning stages. For each stage, system demand is projected according to a predefined annual growth rate.
Transmission lines and proposed corridors connect transmission segments. Each segment may consist of multiple circuits that are operational only if they are constructed initially or if an investment decision is made during the planning period and if the operational state being evaluated is appropriate.
Decisions of system expansion are expressed in terms of binary variables, while system operation is expressed in terms of generation and nodal power flows and angles as well as unsupplied load that are modeled by continuous variables. The operational states under consideration include the base case together with the contingencies incorporated in the N–1 security analysis.
Table 4 presents the sets and indices used in the formulation.
Table 4.
Sets and indices used in the mathematical formulation.
The set of operating states comprises the normal operating state and a set of N–1 transmission-contingency states. Each contingency state explicitly represents the unavailability of one transmission corridor, while all remaining corridors retain their corresponding availability status. The transmission expansion variables are common to all operating states, whereas generation dispatch, voltage angles, transmission flows, and load curtailment are state-dependent. Therefore, the contingency states are embedded within the same MILP formulation rather than being evaluated through independent optimization problems. This structure allows the expansion plan to be determined while simultaneously accounting for the operational response of the system under the complete set of considered N–1 corridor contingencies.
Table 5 summarizes the main parameters used in the model formulation.
Table 5.
Parameters used in the mathematical formulation.
The availability parameter takes the value of one when transmission corridor is available in operating state s and zero when that corridor corresponds to the contingency being evaluated. This representation allows the considered N–1 transmission-corridor contingencies to be explicitly incorporated into the mathematical formulation.
Table 6 presents the decision variables used in the optimization model.
Table 6.
Decision variables and reliability metrics used in the proposed formulation.
The binary variables and represent transmission expansion decisions, whereas , , , and characterize system operation. The quantities , , , and are subsequently used to quantify the reliability performance of the resulting expansion plans.
With the definition of the sets, parameters, and decision variables, the nomenclature used in the rest of the model is established. The following subsection presents the objective function and the constraints governing the planning of the transmission system expansion.
3.1. Objective Function and Model Constraints
The expansion planning problem is formulated as an MILP model whose objective is to minimize the total expected cost of the system over the planning horizon. The objective function simultaneously integrates the investment costs for new transmission lines, the operating costs of the generating units, and the economic penalty associated with expected energy shortfalls. Thus, expansion decisions are based not only on economic criteria but also on the system’s expected performance in terms of reliability.
The objective function is expressed as:
where , , and represent, respectively, the investment, operating, and reliability costs corresponding to stage t.
The investment cost is calculated as follows:
The above expression includes the cost associated with each candidate circuit whose construction is selected during the corresponding planning stage.
The expected operating cost is determined as
where the generation dispatch is weighted by the probability of occurrence of each operating state.
The cost associated with reliability is defined as
so that the expected economic impact of lost power is explicitly incorporated into the optimization process. This formulation encourages the selection of expansion alternatives capable of simultaneously reducing operating costs and the expected risk of power outages.
Decisions regarding the construction of new circuits are represented by binary variables. The availability of each circuit during a given stage depends on its initial existence and on the cumulative investment decisions up to that stage. This relationship is expressed by
Equation (5) ensures that a constructed circuit remains available throughout all subsequent stages of the planning horizon.
The variables associated with investment and availability decisions are binary:
To prevent multiple constructions of the same candidate circuit, the following restriction applies:
The above constraints define the temporal evolution of the transmission network and ensure consistency between investment decisions and the available topology during each stage of the planning horizon.
System operation is modeled using a direct current optimal power flow (DC-OPF). For each stage of the planning horizon and for each operating state, the model must simultaneously satisfy the nodal balance constraints, generation limits, transmission limits, and power flow relationships.
The active power balance at each bus is expressed as
Equation (9) ensures a balance between generation, demand, unsupplied load, and power exchanges at each node in the system.
The power generated by each unit must remain within its technical operating limits:
Similarly, the unsupplied load is limited to physically feasible values by means of
The variable ensures the feasibility of the problem when generation or transmission capacity is insufficient to fully meet demand.
Power flows are modeled using the DC-OPF approximation. To do this, a Big-M formulation is used that activates or deactivates the flow equations depending on the availability of each circuit:
for all , , , and .
When the circuit is available, the above constraints reproduce the linear relationship between power flow and angular difference. Otherwise, the Big-M formulation decouples both ends of the circuit, allowing for the representation of circuits that are not built or are out of service due to a contingency.
The transmission capacity of each circuit is limited by
for all , , , and .
These constraints ensure that the flow remains within the thermal capacity of each circuit and is zero when that circuit is unavailable.
Finally, in order to obtain a single solution to the DC-OPF model, the voltage angle of a reference bus is set by
The growth in demand is represented by an exponential projection based on a constant annual rate. For each stage of the planning horizon, the demand in each bus is updated according to
where corresponds to the initial demand on bus i, r represents the annual rate of demand growth, and indicates the number of years that have elapsed since the start of the planning horizon.
This formulation assesses the variation in demand over time and identifies the optimal stage to build new transmission infrastructure. It helps maintain the system’s reliability and operating conditions as demand increases.
3.2. Reliability Assessment Under the N–1 Transmission Contingencies
System reliability is assessed under the normal operating state and under single transmission-corridor contingencies. Accordingly, the set of operating states comprises the normal state and one contingency state for each transmission corridor considered in the N–1 analysis. This representation enables the operational consequences of each considered contingency to be incorporated into the planning process and their effects on the system’s ability to meet demand to be quantified.
The operating-state probabilities are defined using a normalized probability distribution over the complete set of states . Let denote the aggregate probability assigned to the set of N–1 transmission-corridor contingencies. The probability of the normal operating state is defined as
whereas the aggregate contingency probability is uniformly distributed among the explicitly modeled N–1 states:
Therefore, the probabilities satisfy the normalization condition
In the present study, the operating-state probabilities are parametrically defined rather than estimated from historical outage records. Accordingly, individual component failure rates, repair times, and outage frequencies are not explicitly modeled. The parameter represents the aggregate probability assigned to the set of considered N–1 transmission-corridor contingencies, and this probability is distributed uniformly among the contingency states. This assumption provides a normalized probabilistic weighting for comparing the consequences of the explicitly modeled contingencies without assigning different likelihoods to individual corridor outages. Therefore, the resulting reliability indices should be interpreted within the defined set of operating states and the adopted probability model, rather than as estimates derived from historical component reliability data.
ENS linked to each operational state is determined based on the unsupplied load from the solution of the optimization model. For each planning period t and operating state s, the ENS is obtained from the optimal load curtailment as
where is the number of hours represented by planning period t. Accordingly, quantifies the energy-not-supplied consequence associated with operating state s if that state is assumed to persist over the represented time interval.
Equation (21) converts unserved power into energy using the number of representative hours for each planning stage.
Subsequently, the Expected Energy Not Supplied (EENS) is obtained by weighting the unsupplied energy for each operational state by its probability of occurrence:
For each operating state, represents the deterministic energy-not-supplied consequence obtained from the optimal load-curtailment solution under the network condition associated with state s. In contrast, is a probabilistic expected-value metric because the state-specific ENS values are weighted by their corresponding occurrence probabilities . Therefore, EENS is not merely the deterministic load-shedding penalty included in the objective function; rather, it represents the probability-weighted expected energy not supplied over the complete set of operating states considered in the analysis. The monetary term associated with EENS in the objective function converts this expected reliability consequence into an economic cost through the adopted cost of unsupplied energy.
To identify the operating states in which load curtailment occurs, an indicator is defined from the optimal unsupplied load as
The Loss of Load Probability (LOLP) for planning stage t is then calculated as
whereas the Loss of Load Expectation (LOLE) is determined by
The annual duration h is used to convert the probability assigned to each operating state into its expected annual exposure time. Under the adopted discrete-state representation, the expected duration associated with state s is therefore . Consequently, EENS can equivalently be interpreted as the sum, over all operating states, of the load curtailment associated with each state multiplied by its expected annual exposure time,
Similarly, LOLP represents the probability that an operating state results in load curtailment, whereas LOLE converts this probability into the expected number of hours per year during which load curtailment occurs. Thus, EENS is expressed in MWh/year, LOLP is dimensionless, and LOLE is expressed in h/year. These indices are evaluated with respect to the operating-state probability model defined in this study and therefore characterize reliability within the considered normal and N–1 transmission-contingency states.
The probabilistic reliability assessment is restricted to the operating-state space explicitly defined in this study. Specifically, the analysis considers the normal operating state and single transmission-corridor outages represented by the N–1 contingency set. Component-specific failure rates, repair times, outage frequencies, generation-unit outages, multiple simultaneous transmission outages, correlated failures, and common-mode events are not explicitly modeled. Consequently, the calculated EENS, LOLP, and LOLE values should not be interpreted as comprehensive adequacy indices for the entire power system. Instead, they quantify the expected reliability consequences associated with the considered N–1 transmission-contingency space under the adopted probability assumptions. Incorporating component-specific reliability data and a broader set of stochastic outage events would extend the proposed framework toward a more comprehensive probabilistic adequacy assessment.
In the proposed formulation, the N–1 criterion is used to define the set of transmission-contingency states to be explicitly evaluated rather than as a strict feasibility requirement imposing zero load curtailment after every outage. Consequently, load shedding is permitted in a contingency state when the available system resources are insufficient to fully supply demand, but its expected economic consequence is penalized through the EENS term included in the objective function. This representation allows the optimization model to determine the economically optimal trade-off between additional transmission reinforcement and the expected consequences of contingency-induced load curtailment.
The N–1 contingency representation is incorporated through the binary availability parameter , which identifies the transmission corridors available in each operating state. For the normal operating state, all transmission corridors are considered to be in service,
For a contingency state associated with the outage of transmission corridor , the availability parameter is defined as
Thus, each contingency state explicitly represents the unavailability of one transmission corridor, while all remaining corridors retain their corresponding availability. The transmission expansion variables are shared across the operating states, whereas generation dispatch, voltage angles, transmission flows, and load curtailment are state-dependent. Consequently, the normal and N–1 contingency states are explicitly embedded within the same MILP formulation rather than being evaluated through independent optimization problems. This structure enables the expansion decisions to account for the operational response of the system under the complete set of considered N–1 transmission-corridor contingencies.
For the indicators, the ENS, EENS, LOLP, and LOLE values that are calculated for all planning horizon stages are used. Based on these performance indicators, it can be stated that the selected infrastructure not only minimizes the expected total system cost, but also improves the system’s ability to maintain the supply of electricity for the growing demand and the occurrence of single transmission-corridor contingencies.
3.3. Solution Procedure
The solution procedure integrates multi-period expansion planning, the modeling of single transmission-corridor contingencies, and probabilistic reliability assessment. Initially, the system’s electrical, operational, and economic data are loaded, the planning horizon is defined, and demand is projected for each stage.
Next, the set of operating states is constructed, consisting of the normal state and the transmission-corridor contingencies considered in the N–1 analysis. The planning stages are evaluated sequentially. At each stage, the expansion decisions inherited from previous stages are retained, while the MILP determines the additional reinforcements required for the corresponding demand level. Within each planning stage, the normal operating state and all defined N–1 contingency states are simultaneously represented in the MILP. Therefore, the contingency analysis does not require solving an independent optimization problem for each outage state. The solution at each stage determines the additional expansion decisions, generation dispatch, power flows, and unsupplied load for all operating states considered at that stage.
Based on the optimal solution, the ENS, EENS, LOLP, and LOLE indicators are calculated, and the critical contingencies and buses with unsupplied load are identified. Algorithm 1 summarizes the general procedure used.
| Algorithm 1 Multi-period transmission expansion planning with probabilistic reliability assessment and N–1 contingency analysis. |
|
4. Case Studies
To validate the proposed methodology, simulations were performed on two test systems widely used in the literature on transmission expansion planning: the 6-bus Garver system and the 24-bus IEEE Reliability Test System (IEEE RTS-24). The use of both systems allows for the evaluation of the model’s performance in networks with varying levels of complexity, verifying both the consistency of the formulation and its ability to address larger-scale expansion problems.
In both systems, the methodology developed in Section 3 was applied; this methodology integrates multi-period transmission expansion planning with probabilistic reliability criteria and operational security under the N–1 criterion. The following subsections describe the test systems used and the scenarios considered for the model evaluation.
4.1. Test Systems
The first test system is the 6-bus Garver system, one of the most widely used reference cases for validating transmission expansion planning methodologies. Its simplified structure allows for a detailed analysis of investment decisions, identification of the candidate corridors selected by the model, and evaluation of the effect of those investments on the system’s operational behavior. Due to its small size, this system serves as a suitable tool for verifying the correct operation of the proposed formulation and analyzing the evolution of expansion decisions over the planning horizon.
The second test system is the IEEE 24-bus Reliability Test System (IEEE RTS-24), widely used as a benchmark for evaluating expansion and operation methodologies for electric power systems. Compared to the Garver system, the IEEE RTS-24 features a larger transmission network, a greater number of generation units, and a more complex operational structure, which significantly increases the number of expansion alternatives and operational states that must be evaluated.
The combined use of both systems allows for the validation of the proposed methodology under different operating conditions. While the Garver system facilitates a detailed interpretation of the investment decisions obtained by the model, the IEEE RTS-24 enables the analysis of its performance in a larger-scale problem, verifying the formulation’s ability to determine optimal expansion plans while simultaneously considering economic, reliability, and operational security criteria.
The contingency set was constructed according to the transmission corridors represented in each test system. For the Garver 6-bus system, eight N–1 transmission-corridor contingencies are explicitly considered in addition to the normal operating state, resulting in a total of nine operating states. For the IEEE RTS-24 system, 40 N–1 transmission-corridor contingencies are considered together with the normal operating state, resulting in 41 operating states. The operating states considered for both test systems are summarized in Table 7. All the defined contingency states are explicitly incorporated into the corresponding optimization model rather than being evaluated through separate optimization problems.
Table 7.
Operating states considered in the N–1 contingency assessment.
4.2. Assessment Scenarios
From a computational perspective, the transmission expansion variables are shared across the operating states, whereas the operational variables, including generation dispatch, voltage angles, transmission flows, and load curtailment, are state-dependent. Consequently, the state-dependent portion of the formulation increases approximately linearly with the number of explicitly modeled operating states, , where denotes the number of N–1 transmission-corridor contingencies. Thus, increasing the network size increases both the number of candidate expansion decisions and the number of contingency states, while extending the planning horizon requires the corresponding optimization to be performed for additional planning stages. Although the explicit representation of contingencies increases the computational burden, all operating states associated with a given planning stage are incorporated within the same MILP rather than requiring an independent optimization problem for each contingency.
For both test systems, a ten-year planning horizon was considered, divided into three stages corresponding to years 0, 5, and 10. The planning stages were evaluated sequentially, retaining the expansion decisions inherited from previous stages and updating demand according to the growth rate defined in Equation (17). At each stage, the MILP simultaneously represents the normal operating state and all N–1 contingency states defined for the corresponding test system.
For the numerical assessment, an aggregate contingency probability of was adopted, resulting in a normal-state probability of . Because no corridor-specific historical outage data are assumed, is uniformly distributed among the explicitly modeled N–1 contingency states. Consequently, the Garver system, with eight contingency states, uses for each contingency, whereas the IEEE RTS-24 system, with 40 contingency states, uses for each contingency. In both cases, the complete set of operating-state probabilities sums to unity.
To facilitate reproducibility, the principal numerical assumptions used in both case studies are summarized in Table 8. The complete network data used in the simulations, including bus demand, generation limits and operating costs, existing transmission-corridor parameters, candidate expansion alternatives, and investment costs, are provided in Appendix A. The contingency sets are constructed directly from the transmission corridors considered in each test system, with one operating state representing the outage of each corridor. This information, together with the mathematical formulation presented in Section 3, provides the data required to reproduce the numerical experiments.
Table 8.
Main parameters and assumptions used in the case studies.
The simulations consider both the normal operating state and single transmission-corridor contingencies associated with the N–1 contingency analysis. Thus, for each stage of the planning horizon, the system’s capacity to meet demand is evaluated under normal operating conditions and under the individual unavailability of each transmission corridor included in the contingency set.
The proposed formulation simultaneously determines the transmission corridors to be added and the optimal time for their construction, minimizing the system’s expected total cost. As part of the evaluation, the resulting investment decisions, the temporal evolution of the expansion plan, and the behavior of the probabilistic reliability indicators ENS, EENS, LOLP, and LOLE are analyzed.
The results obtained for the Garver and IEEE RTS-24 systems allow for a comparison of the methodology’s performance in networks with different levels of complexity and an evaluation of the impact of incorporating reliability and operational security criteria into the transmission expansion planning process. A detailed analysis of these results is presented in the following section.
5. Results and Discussion
This section evaluates the performance of the proposed transmission expansion planning model, considering reliability and security criteria, by applying it to the 6-bus Garver system and IEEE RTS-24 test systems. For each system, two planning approaches are compared: a traditional TEP, based on minimizing investment and operating costs, and the proposed methodology, which incorporates the cost associated with Expected Energy Not Supplied (EENS) into the objective function and explicitly considers transmission contingencies under the N–1 criterion.
The comparison is based on the temporal evolution of expansion plans, generation dispatch, power flows in the main corridors, the value of the objective function, and the probabilistic reliability indicators EENS, LOLP, and LOLE. In this way, the analysis allows for the identification of the trade-off between increased planning costs and system performance in the face of the contingencies considered.
5.1. 6-Bus Garver System
The Garver system is analyzed first because its small size makes it possible to clearly identify the effect of reliability criteria on investment decisions. For both approaches, the same planning horizon is considered—divided into stages corresponding to years 0, 5, and 10—as well as the same demand growth conditions and operational constraints.
Figure 1 shows the evolution of the optimal expansion plan obtained for the Garver system. Panels (A)–(C) correspond to the traditional approach for years 0, 5, and 10, respectively, while panels (D)–(F) show the solutions obtained using the proposed methodology for the same stages. The colored lines identify the circuits added in each period and remain visible in subsequent stages, allowing for a cumulative representation of the evolution of the transmission infrastructure.
Figure 1.
Optimal transmission expansion plans for the Garver system: (A–C) the traditional TEP and (D–F) the reliability-constrained TEP in years 0, 5, and 10, respectively.
A comparison of the two strategies shows that incorporating the expected cost of energy not supplied and considering N–1 contingencies alters both the selection of corridors and the timing of investments. While traditional TEP selects reinforcements primarily based on the system’s economic and operational requirements, the proposed methodology modifies the location and timing of the incorporation of certain circuits in order to reduce the economic consequences associated with the considered contingencies.
These differences become more evident as the planning horizon extends and demand increases. Consequently, expansion decisions not only alter the final topology of the grid but also operating conditions, particularly generation dispatch and the distribution of power flows.
Figure 2 compares the generation dispatch obtained under both planning strategies. In the traditional TEP, unit G1 maintains a predominant contribution throughout the planning horizon, generating approximately 400 MW in years 0 and 10, while G2 and G3 provide the remaining power required to meet demand. In year 5, the dispatch is redistributed to approximately 368.1 MW, 313.0 MW, and 200.0 MW for G1, G2, and G3, respectively.
Figure 2.
Generation output of the Garver system under (a) the traditional TEP and (b) the reliability-constrained TEP over the planning horizon.
The reliability-constrained TEP produces a substantially different generation pattern. In year 0, G3 increases its output to approximately 568.4 MW, while G1 supplies approximately 191.6 MW. In years 5 and 10, G3 reaches 600 MW, whereas the contributions of G1 and G2 change according to the resulting network configuration. In particular, G2 decreases its output to approximately 21.4 MW in year 10. These results show that transmission expansion decisions modify the economically optimal generation dispatch by altering the transfer capability between different areas of the system.
Figure 3 shows the effect of expansion decisions on the total magnitude of power flow in the system’s main corridors. Significant differences can be observed between the two strategies, especially in the corridors connecting generation areas with major demand centers.
Figure 3.
Total power flow per transmission corridor for the Garver system under (a) the traditional TEP and (b) the reliability-constrained TEP over the planning horizon.
In the traditional approach, a significant portion of power transfers is concentrated in specific corridors, whose utilization changes as demand grows. The proposed methodology alters these patterns as a result of the additional circuits incorporated into the system. Some corridors experience higher power transfers due to the availability of new transmission routes, while others see their relative share decrease. Therefore, the effect of the proposed expansion is not necessarily to reduce all power flows, but rather to modify their spatial distribution in accordance with the new topology and the resulting dispatch.
This redistribution is relevant from the perspective of operational security, since the incorporation of alternative routes increases the possibilities for power transfer when any of the circuits considered in the N–1 analysis goes out of service.
Figure 4 compares the evolution of the objective function value for both strategies. As expected, the proposed methodology results in higher costs throughout the planning horizon, because the solution internalizes the expected cost of lost energy and may select additional investments to mitigate the economic consequences of contingencies.
Figure 4.
Evolution of the objective function for the Garver system under the traditional TEP and reliability-constrained TEP approaches over the planning horizon.
In year 0, the value of the objective function increases from approximately 214.4 MUSD for the traditional TEP to 301.9 MUSD with the proposed methodology. In year 5, the values reach approximately 290.4 and 379.4 MUSD, respectively. The difference widens toward the end of the horizon, where the cost rises from approximately 380.8 MUSD in the traditional approach to 573.2 MUSD in the proposed approach. In this final stage, the increase is approximately 192.4 MUSD, equivalent to 50.5% relative to the traditional TEP.
This increase represents the economic trade-off associated with an expansion strategy that explicitly considers the expected consequences of contingencies. However, the higher cost should not be interpreted in isolation but rather in conjunction with the reliability indicators presented in Table 9.
Table 9.
Reliability assessment of the Garver system under the reliability-constrained TEP approach.
Table 9 summarizes the reliability indicators obtained using the proposed methodology. In Year 0, no unsupplied load is recorded for the evaluated contingencies; therefore, EENS, LOLP, and LOLE are all equal to zero. This result indicates that the configuration obtained for the initial stage has sufficient capacity to meet demand under the analyzed conditions.
In year 5, the outage of corridor 4–6 constitutes the critical contingency and affects bus 5, resulting in an EENS of 60.094 MWh/year, an LOLP of 0.001, and an LOLE of 10.95 h/year. By year 10, demand growth increases the system’s vulnerability, and the outages of corridors 1–5 and 3–5 become the critical events. As a result, the EENS increases to 493.538 MWh/year, while the LOLP and LOLE reach 0.002 and 21.90 h/year, respectively.
These results show that, although the proposed methodology incorporates additional reinforcements, the reliability of the Garver system continues to deteriorate during periods of peak demand. Therefore, the solution obtained represents an economic trade-off between the cost of incorporating new infrastructure and the expected cost associated with lost energy, rather than imposing the complete elimination of load curtailment for all contingencies considered.
5.2. IEEE RTS-24 System
The second case study focuses on the IEEE RTS-24 system. With its greater number of buses, generation units, and transmission corridors, it allows for an evaluation of the proposed methodology’s performance in a larger-scale network with a more meshed transmission structure than that of the Garver system.
Figure 5 shows the evolution of the expansion plans obtained for the IEEE RTS-24. Panels (A)–(C) correspond to the traditional TEP for years 0, 5, and 10, respectively, while panels (D)–(F) show the solutions obtained using the proposed methodology for the same stages. As in the Garver system, the colors identify the stage at which each new circuit is incorporated and are retained in subsequent periods to represent the cumulative evolution of the network.
Figure 5.
Optimal transmission expansion plans for the IEEE RTS-24 system under (A–C) the traditional TEP and (D–F) the reliability-constrained TEP at years 0, 5, and 10, respectively.
A comparison of the two strategies reveals differences in both the location and timing of the addition of reinforcements. These differences become more evident toward the final stages of the horizon, when demand growth alters the transmission requirements between different areas of the system. The proposed methodology selects a different expansion path because the consequences associated with contingencies influence the economic evaluation of investment alternatives.
The greater initial connectivity of the IEEE RTS-24 allows some of the contingencies to be addressed through existing alternative routes. For this reason, the effect of incorporating reliability into the expansion must be analyzed in conjunction with the observed changes in dispatch and power flows.
Figure 6 compares the dispatch of generation units for both approaches at each stage of the horizon. Generally speaking, the units with the highest capacity continue to account for a significant fraction of total generation; however, the differences between the two strategies show that expansion decisions also affect the utilization of certain intermediate units.
Figure 6.
Comparison of the generation dispatch results obtained for the IEEE RTS-24 system using the traditional TEP approach and the reliability-constrained TEP approach in (a) year 0, (b) year 5, and (c) year 10.
In Year 0, the differences between the two approaches are concentrated in a small set of units, while a significant portion of the generators maintain similar dispatch levels. As demand increases, the differences become more apparent in units whose injection capacity is constrained by the transmission limits of nearby corridors. In year 10, a more pronounced redistribution of dispatch is observed in certain units, while the generators with the highest capacity maintain similar levels in both formulations.
Therefore, the results indicate that the effect of the proposed methodology is not merely to add transmission infrastructure. Changes in topology also alter the feasible space of the DC-OPF and, consequently, the economically optimal dispatch of the generation units.
Figure 7 shows the evolution of the total power flow magnitude in the main corridors of the IEEE RTS-24 system. For both strategies, it can be observed that the increase in demand alters the utilization of certain corridors over the planning stage horizon. However, the magnitude and evolution of these transfers differ as a result of the different expansion decisions.
Figure 7.
Total power flow magnitude in the main transmission corridors of the IEEE RTS-24 system under (a) the traditional TEP and (b) the reliability-constrained TEP over the planning horizon.
The differences are particularly evident in some of the corridors with the highest transfer levels. While certain corridors see an increase in utilization under the proposed methodology, others experience a reduction compared to the traditional TEP. This behavior confirms that the new circuits alter the economically preferred routes for power transmission and redistribute power exchanges within the grid.
From a security perspective, this redistribution provides additional routes to maintain supply in the event of the unavailability of certain components. However, the benefit associated with these modifications must be evaluated using probabilistic reliability indicators, since a reduction or increase in flow in an individual corridor does not, in and of itself, constitute a direct measure of reliability.
Figure 8 shows that both strategies exhibit a gradual increase in cost as the planning horizon progresses. In year 0, the objective function values are approximately 467.2 MUSD for the traditional TEP and 477.6 MUSD for the proposed methodology. In year 5, these values increase to approximately 548.9 and 572.1 MUSD, respectively, while in year 10 they reach approximately 629.0 and 696.0 MUSD.
Figure 8.
Evolution of the objective function for the IEEE RTS-24 system under the traditional TEP and reliability-constrained TEP approaches over the planning horizon.
Unlike the Garver system, the difference between the two planning strategies is relatively small during the initial stages of the IEEE RTS-24 case, which may be associated with its higher initial network connectivity. In year 0, incorporating reliability criteria increases the value of the objective function by approximately 2.2%, while in year 5 the increase is close to 4.2%. The gap widens toward the end of the horizon and reaches approximately 67.0 MUSD in year 10, equivalent to an increase of nearly 10.7% compared to the traditional TEP.
These results once again demonstrate the trade-off between economy and reliability. The proposed methodology requires a higher total cost, but the selected investments modify the grid’s response to contingencies. This effect is most clearly observed in the indicators presented in Table 10.
Table 10.
Reliability assessment of the IEEE RTS-24 system under the reliability-constrained TEP approach.
Table 10 presents the indicators obtained for the IEEE RTS-24. In the initial stage, the outage of transmission corridor 20–23 constitutes the critical contingency and results in unsupplied load on bus 19. For this condition, an EENS of 98.55 MWh/year, an LOLP of 0.001, and an LOLE of 10.95 h/year are obtained.
The behavior changes in subsequent stages. In years 5 and 10, the EENS, LOLP, and LOLE indicators are equal to zero for the set of contingencies evaluated. This indicates that, under the N–1 hypotheses and states considered in the model, the infrastructure available at these stages allows demand to be fully met without resorting to load shedding.
This result is particularly relevant when compared to the Garver case. Although both systems experience demand growth, the more meshed structure of the IEEE RTS-24, together with the selected reinforcements, makes it possible to eliminate the unserved load associated with the contingencies analyzed in stages 5 and 10. Therefore, the effect of incorporating reliability into the expansion problem depends not only on demand growth but also on the initial topology and the reinforcement alternatives available in each system.
It should be emphasized that the zero EENS, LOLP, and LOLE values obtained for the IEEE RTS-24 system in years 5 and 10 refer exclusively to the set of N–1 transmission-corridor contingencies explicitly represented in the proposed model. These results indicate that no load curtailment is required under the considered operating states, but they should not be interpreted as evidence of overall power-system adequacy or absolute reliability. Generation-unit outages, multiple simultaneous outages, correlated failures, common-mode events, and component-specific failure and repair characteristics are outside the scope of the present analysis. Therefore, the reported indices quantify reliability within the defined transmission-contingency space and the adopted operating-state probability model.
The results obtained in both systems show that incorporating the EENS into the objective function and explicitly considering N–1 contingencies alter the optimal expansion decisions compared to an approach based solely on traditional investment and operating costs. This change is reflected in the location and timing of new circuit construction and, subsequently, in generation dispatch and the distribution of power flows.
However, the magnitude of the effect depends significantly on the characteristics of the analyzed grid. In the Garver system, whose initial topology has less redundancy, the proposed methodology requires a considerable increase in planning costs. In year 10, the value of the objective function is approximately 50.5% higher than that obtained with the traditional TEP. Despite these additional investments, demand growth results in nonzero values for EENS, LOLP, and LOLE in stages 5 and 10, indicating that completely eliminating risk would require additional investments whose cost is not optimal under the adopted objective function.
In contrast, the IEEE RTS-24 features an initially more meshed structure. In this system, the cost difference between the two methodologies is smaller, reaching approximately 10.7% in year 10. At the same time, the selected reinforcements allow for zero values of EENS, LOLP, and LOLE in years 5 and 10 for the contingencies considered. This behavior shows that a network with greater initial redundancy can achieve significant reliability improvements through a more localized set of investments.
The two case studies also demonstrate that the increase in planning costs should not be analyzed in isolation. The incorporation of reliability introduces a trade-off between the cost of new infrastructure, the cost of operation, and the expected economic consequences of load loss. Consequently, the optimal solution does not necessarily seek to eliminate every possibility of an outage, but rather to determine the level of investment at which the marginal cost of new reinforcements balances with the expected reduction in the cost associated with unsupplied energy.
Taken together, the results validate the ability of the proposed MILP formulation to integrate, within a single multi-period planning framework, discrete expansion decisions, system operation using DC-OPF, the evaluation of transmission contingencies under the N–1 criterion, and the probabilistic quantification of reliability. The comparison between the Garver and IEEE RTS-24 systems also shows that the economic and operational impact of incorporating reliability depends on the network structure, demand growth, and available expansion alternatives.
5.3. Sensitivity Analysis of the Cost of Unsupplied Energy
To evaluate the robustness of the proposed expansion strategy with respect to the economic valuation of reliability, a sensitivity analysis was performed by varying the unit cost of unsupplied energy, . This parameter determines the economic contribution of EENS to the objective function and therefore controls the trade-off between additional transmission investment and the expected economic consequences of load curtailment. The sensitivity analysis was performed for both the Garver 6-bus and IEEE RTS-24 systems while maintaining the remaining technical, economic, and operating parameters unchanged.
Five values of , ranging from 500 to 10,000 USD/MWh, were considered. For each value, the transmission expansion problem was solved under the same contingency representation used in the proposed multi-period framework, including the normal operating state and the explicitly modeled N–1 transmission-corridor contingencies. The resulting solutions were compared in terms of transmission investment cost, EENS, and LOLE. This analysis makes it possible to determine whether changes in the economic valuation of unsupplied energy modify the optimal investment decisions or whether the expansion solution remains stable over the evaluated range.
The sensitivity results reveal different responses of the two test systems to the economic valuation of unsupplied energy; see Table 11. For the Garver 6-bus system, the expansion solution is sensitive to at low and intermediate values. At 500 and 1000 USD/MWh, the optimal solution requires an investment of 8 MUSD and results in an EENS of 1971.00 MWh/year and a LOLE of 21.90 h/year. When increases to 2500 USD/MWh, additional transmission reinforcement becomes economically justified, increasing the investment cost to 10 MUSD and reducing EENS to 876.00 MWh/year.
Table 11.
Sensitivity of the expansion solutions to the cost of unsupplied energy.
A more pronounced transition occurs at USD/MWh. At this value, the transmission investment increases to 14 MUSD and load curtailment is eliminated for all explicitly evaluated N–1 transmission-corridor contingencies, resulting in zero EENS and LOLE. A further increase in to 10,000 USD/MWh does not modify either the investment cost or the reliability indices. This behavior indicates the existence of a threshold beyond which additional increases in the economic penalty assigned to unsupplied energy no longer modify the optimal expansion solution.
The sensitivity behavior is consistent with the expansion topology obtained for the Garver system in the main multi-period analysis. The reliability-constrained solution concentrates transmission reinforcement on the corridors identified in the original expansion results, while the sensitivity analysis changes the economic preference for the extent of reinforcement within the set of available expansion alternatives. Therefore, varying does not introduce transmission alternatives outside the original candidate set, but changes the economic balance between additional network reinforcement and the expected consequences of contingency-induced load curtailment.
The IEEE RTS-24 system exhibits a different behavior under the evaluated condition. No additional transmission reinforcement is selected over the analyzed range of , and EENS and LOLE remain zero. Consequently, variations in the economic valuation of unsupplied energy do not modify the optimal solution within the considered range. This behavior can be attributed to the more meshed initial structure of the IEEE RTS-24 system and its ability to accommodate the explicitly evaluated N–1 transmission-corridor contingencies without load curtailment under the analyzed operating condition.
Overall, the sensitivity analysis confirms that acts as an economic trade-off parameter between transmission investment and the expected consequences of load curtailment. Its influence on the optimal expansion solution depends on the characteristics and redundancy of the transmission network. In the Garver system, increasing produces discrete changes in transmission investment until a stable solution is reached, whereas the IEEE RTS-24 system exhibits a more stable response over the analyzed range. These results highlight the importance of appropriately defining the economic value assigned to unsupplied energy when applying the proposed methodology to practical transmission planning studies.
6. Conclusions
This paper presented a multi-period methodology for planning the expansion of transmission systems that integrates economic, operational, and reliability criteria through a DC-OPF-based MILP formulation. Unlike the traditional TEP approach, the proposed methodology incorporates the cost associated with Expected Energy Not Supplied (EENS) into the objective function and explicitly models single transmission-corridor contingencies under the N–1 criterion. In this way, the model jointly determines the circuits to be added, their construction phase, and system operation for the different states considered, allowing the expected economic consequences of load loss to be factored into expansion decisions.
The results obtained for the 6-bus Garver system show that incorporating reliability modifies the location and timing of investments, as well as generation dispatch and the distribution of power flows. In year 10, the value of the objective function reaches approximately 573.2 MUSD using the proposed methodology, compared to 380.8 MUSD using the traditional TEP, representing an increase of nearly 50.5%. Despite the incorporated reinforcements, EENS values of 60.094 and 493.538 MWh/year are obtained in years 5 and 10, respectively. These results show that the economically optimal solution does not necessarily eliminate all load curtailment under the evaluated contingencies, but rather strikes a balance between the cost of incorporating new reinforcements and the expected economic consequences of unsupplied energy.
The sensitivity analysis further showed that the economic valuation assigned to unsupplied energy can influence the optimal transmission reinforcement strategy. This effect was more pronounced in the Garver 6-bus system, where increasing progressively favored additional transmission investment and reduced EENS until a stable expansion solution was reached. In contrast, the IEEE RTS-24 system exhibited a comparatively more stable response over the evaluated range. These results indicate that the influence of depends on the initial network configuration and redundancy and highlight the importance of appropriately defining this parameter in practical transmission planning applications.
In the IEEE RTS-24 system, the greater network redundancy leads to different behavior. In year 10, the objective function increases from approximately 629.0 MUSD with the traditional TEP to 696.0 MUSD with the proposed methodology, equivalent to an increase of approximately 10.7%. Although a critical contingency with an EENS of 98.55 MWh/year is identified in year 0, the selected reinforcements allow for zero values of EENS, LOLP, and LOLE in years 5 and 10 for the evaluated contingencies. The comparison between the two systems shows that the economic impact of incorporating reliability criteria depends significantly on the initial topology, the level of redundancy, and the expansion alternatives available in each grid.
Taken together, the analyzed cases show that explicitly incorporating reliability allows for the development of expansion plans that reflect the trade-off between investment, operation, and the risk of load loss, rather than treating reliability solely as a subsequent evaluation step. As an extension of this work, future research could incorporate AC power flow models, uncertainty associated with renewable generation and demand, and higher-order contingencies. Furthermore, the use of decomposition and scenario reduction techniques would allow the formulation to be extended to larger-scale systems while maintaining a computational load compatible with long-term planning problems.
Author Contributions
Conceptualization, D.C.; Methodology, M.A.; Formal Analysis, M.J.; Data Curation, M.J.; Writing—Original Draft, M.A.; Writing—Review & Editing, D.C. and M.J.; Supervision, D.C.; Project Administration, D.C.; Funding Acquisition, D.C. All authors have read and agreed to the published version of the manuscript.
Funding
This work was supported by Salesian Polytechnic University and GIREI-Smart Grid Research Group under the project “A platform for operational decision-making in power systems based on optimization and real-time data”, Resolution No.: 45-03-2026-04-15.
Data Availability Statement
The original contributions presented in this study are included in the article. The numerical input data required to reproduce the case studies are provided in Appendix A, including nodal demand, generation parameters, transmission-corridor data, candidate expansion alternatives, and the main reliability-assessment assumptions. Further inquiries can be directed to the corresponding author.
Conflicts of Interest
The authors declare no conflicts of interest.
Appendix A
Appendix A.1. Garver 6-Bus System Data
This appendix summarizes the principal input data used to reproduce the Garver 6-bus case study. The system data include the nodal demand, generation limits and operating costs, and the electrical and economic characteristics of the existing and candidate transmission corridors. The parameter denotes the number of circuits initially installed in corridor ; therefore, identifies candidate corridors available for expansion.
Table A1.
Base nodal demand of the Garver 6-bus system.
Table A2.
Generation data for the Garver 6-bus system.
The total base-case demand of the Garver system is 760 MW. The nodal demand values reported in Table A1 correspond to the initial operating condition. For each planning stage t, these values are updated using the demand-growth model defined in Equation (17).
Table A3.
Transmission-corridor data for the Garver 6-bus system.
For the reliability assessment, the operating-state set consists of the normal operating state and eight N–1 transmission-corridor contingencies. An aggregate contingency probability of is adopted. Consequently, the normal-state probability is , while the contingency probability is uniformly distributed among the eight N–1 states, resulting in for each contingency state.
Appendix A.2. IEEE RTS-24 System Data
The IEEE RTS-24 system is used as the larger benchmark to evaluate the proposed formulation. The system comprises 24 buses and 33 generating units. Transmission corridors are represented according to their reactance, thermal capacity, investment cost, and number of initially installed circuits. Parallel circuits belonging to the same pair of buses are represented through .
Table A4.
Base nodal demand of the IEEE RTS-24 system.
The total base demand of the IEEE RTS-24 system is 2850 MW. The nodal values in Table A4 are multiplied by the corresponding demand-growth factor for each planning stage.
Table A5.
Generation data for the IEEE RTS-24 system.
Table A6.
Transmission-corridor data for the IEEE RTS-24 system.
For the IEEE RTS-24 system, the operating-state set contains the normal state and 40 N–1 transmission-corridor contingencies. Using the same aggregate contingency probability , the normal-state probability is , and the contingency probability is uniformly distributed among the 40 corridor-outage states. Therefore, each contingency state is assigned .
The reliability indices reported in the case studies are calculated exclusively over these explicitly modeled operating states. Accordingly, the probabilities reported here are modeling assumptions used for the controlled numerical assessment and are not derived from component-specific historical failure rates or repair-time data.
References
- Latorre, G.; Cruz, R.D.; Areiza, J.M.; Villegas, A. Classification of Publications and Models on Transmission Expansion Planning. IEEE Trans. Power Syst. 2003, 18, 938–946. [Google Scholar] [CrossRef] [Scilit]
- Hemmati, R.; Hooshmand, R.A.; Khodabakhshian, A. State-of-the-Art of Transmission Expansion Planning: Comprehensive Review. Renew. Sustain. Energy Rev. 2013, 23, 312–319. [Google Scholar] [CrossRef] [Scilit]
- Mahdavi, M.; Sabillón Antúnez, C.; Ajalli, M.; Romero, R. Transmission Expansion Planning: Literature Review and Classification. IEEE Syst. J. 2019, 13, 3129–3140. [Google Scholar] [CrossRef] [Scilit]
- Li, C.; Conejo, A.J.; Liu, P.; Omell, B.P.; Siirola, J.D.; Grossmann, I.E. Mixed-Integer Linear Programming Models and Algorithms for Generation and Transmission Expansion Planning of Power Systems. Eur. J. Oper. Res. 2022, 297, 1071–1082. [Google Scholar] [CrossRef] [Scilit]
- Stott, B.; Jardim, J.; Alsac, O. DC Power Flow Revisited. IEEE Trans. Power Syst. 2009, 24, 1290–1300. [Google Scholar] [CrossRef] [Scilit]
- Soroudi, A. Power System Optimization Modeling in GAMS; Springer International Publishing: Cham, Switzerland, 2017. [Google Scholar] [CrossRef] [Scilit]
- Capitanescu, F. Critical Review of Recent Advances and Further Developments Needed in AC Optimal Power Flow. Electr. Power Syst. Res. 2011, 81, 1697–1711. [Google Scholar] [CrossRef] [Scilit]
- Wang, Z.Y.; Chiang, H.D. On the Feasibility of AC and DC Optimal Power Flow Models: Analytics and Comparison. In Proceedings of the 2021 IEEE Power & Energy Society General Meeting (PESGM), Washington, DC, USA, 26–29 July 2021; pp. 1–5. [Google Scholar] [CrossRef] [Scilit]
- Billinton, R.; Allan, R.N. Reliability Assessment of Large Electric Power Systems; Kluwer Academic Publishers: Boston, MA, USA, 1992. [Google Scholar] [CrossRef] [Scilit]
- Billinton, R.; Allan, R.N. Reliability Evaluation of Power Systems, 2nd ed.; Springer: Boston, MA, USA, 1996. [Google Scholar] [CrossRef] [Scilit]
- Choi, J. A Method for Transmission System Expansion Planning Considering Probabilistic Reliability Criteria. IEEE Trans. Power Syst. 2005, 20, 1606–1615. [Google Scholar] [CrossRef] [Scilit]
- Choi, J.; Mount, T.D.; Thomas, R.J.; Billinton, R. Probabilistic Reliability Criterion for Planning Transmission System Expansions. IEE Proc.-Gener. Transm. Distrib. 2006, 153, 719–727. [Google Scholar] [CrossRef] [Scilit]
- Aghaei, J.; Amjady, N.; Baharvandi, A.; Akbari, M.A. Generation and Transmission Expansion Planning: MILP-Based Probabilistic Model. IEEE Trans. Power Syst. 2014, 29, 1592–1601. [Google Scholar] [CrossRef] [Scilit]
- Da Costa, L.C.; Thomé, F.S.; Garcia, J.D.; Pereira, M.V.F. Reliability-Constrained Power System Expansion Planning: A Stochastic Risk-Averse Optimization Approach. IEEE Trans. Power Syst. 2021, 36, 97–106. [Google Scholar] [CrossRef] [Scilit]
- Mir, G.B.; Karatepe, E. Stochastic AC Transmission Expansion Planning: A Chance-Constrained Distributed Slack Bus Approach with Wind Uncertainty. IEEE Access 2022, 10, 56796–56812. [Google Scholar] [CrossRef] [Scilit]
- Gutiérrez-Alcaraz, G.; González-Cabrera, N.; Gil, E. An Efficient Method for Contingency-Constrained Transmission Expansion Planning. Electr. Power Syst. Res. 2020, 182, 106208. [Google Scholar] [CrossRef] [Scilit]
- Morquecho, E.G.; Torres, S.P.; Astudillo-Salinas, F.; Castro, C.A.; Ergun, H.; Van Hertem, D. Security-Constrained AC Dynamic Transmission Expansion Planning Considering Reactive Power Requirements. Electr. Power Syst. Res. 2023, 221, 109419. [Google Scholar] [CrossRef] [Scilit]
- Carrión, D.; Palacios, J.; Espinel, M.; González, J.W. Transmission Expansion Planning Considering Grid Topology Changes and N-1 Contingencies Criteria. In Lecture Notes in Electrical Engineering; Springer: Berlin/Heidelberg, Germany, 2021; Volume 762, pp. 266–279. [Google Scholar] [CrossRef] [Scilit]
- Pinzón, S.; Carrión, D.; Inga, E. Optimal Transmission Switching Considering N-1 Contingencies on Power Transmission Lines. IEEE Lat. Am. Trans. 2021, 19, 534–541. [Google Scholar] [CrossRef] [Scilit]
- Naderi, E.; Pourakbari-Kasmaei, M.; Lehtonen, M. Transmission expansion planning integrated with wind farms: A review, comparative study, and a novel profound search approach. Int. J. Electr. Power Energy Syst. 2020, 115, 105460. [Google Scholar] [CrossRef] [Scilit]
- Poubel, R.P.B.; Perpétuo, M.C.S.; Peres, W. Probabilistic Transmission Expansion Planning under Renewable and Load Uncertainty. IEEE Access 2025, 13, 151275–151288. [Google Scholar] [CrossRef] [Scilit]
- Ploussard, Q.; Olmos, L.; Ramos, A. A Search Space Reduction Method for Transmission Expansion Planning Using an Iterative Refinement of the DC Load Flow Model. IEEE Trans. Power Syst. 2020, 35, 152–162. [Google Scholar] [CrossRef] [Scilit]
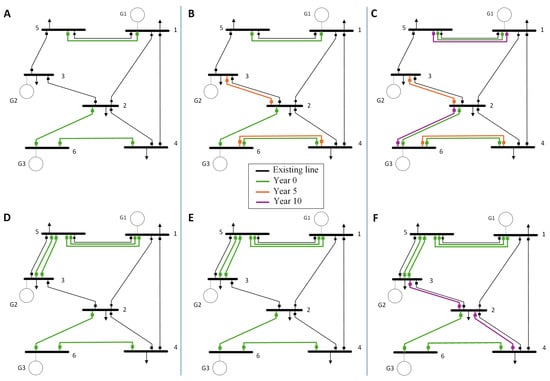
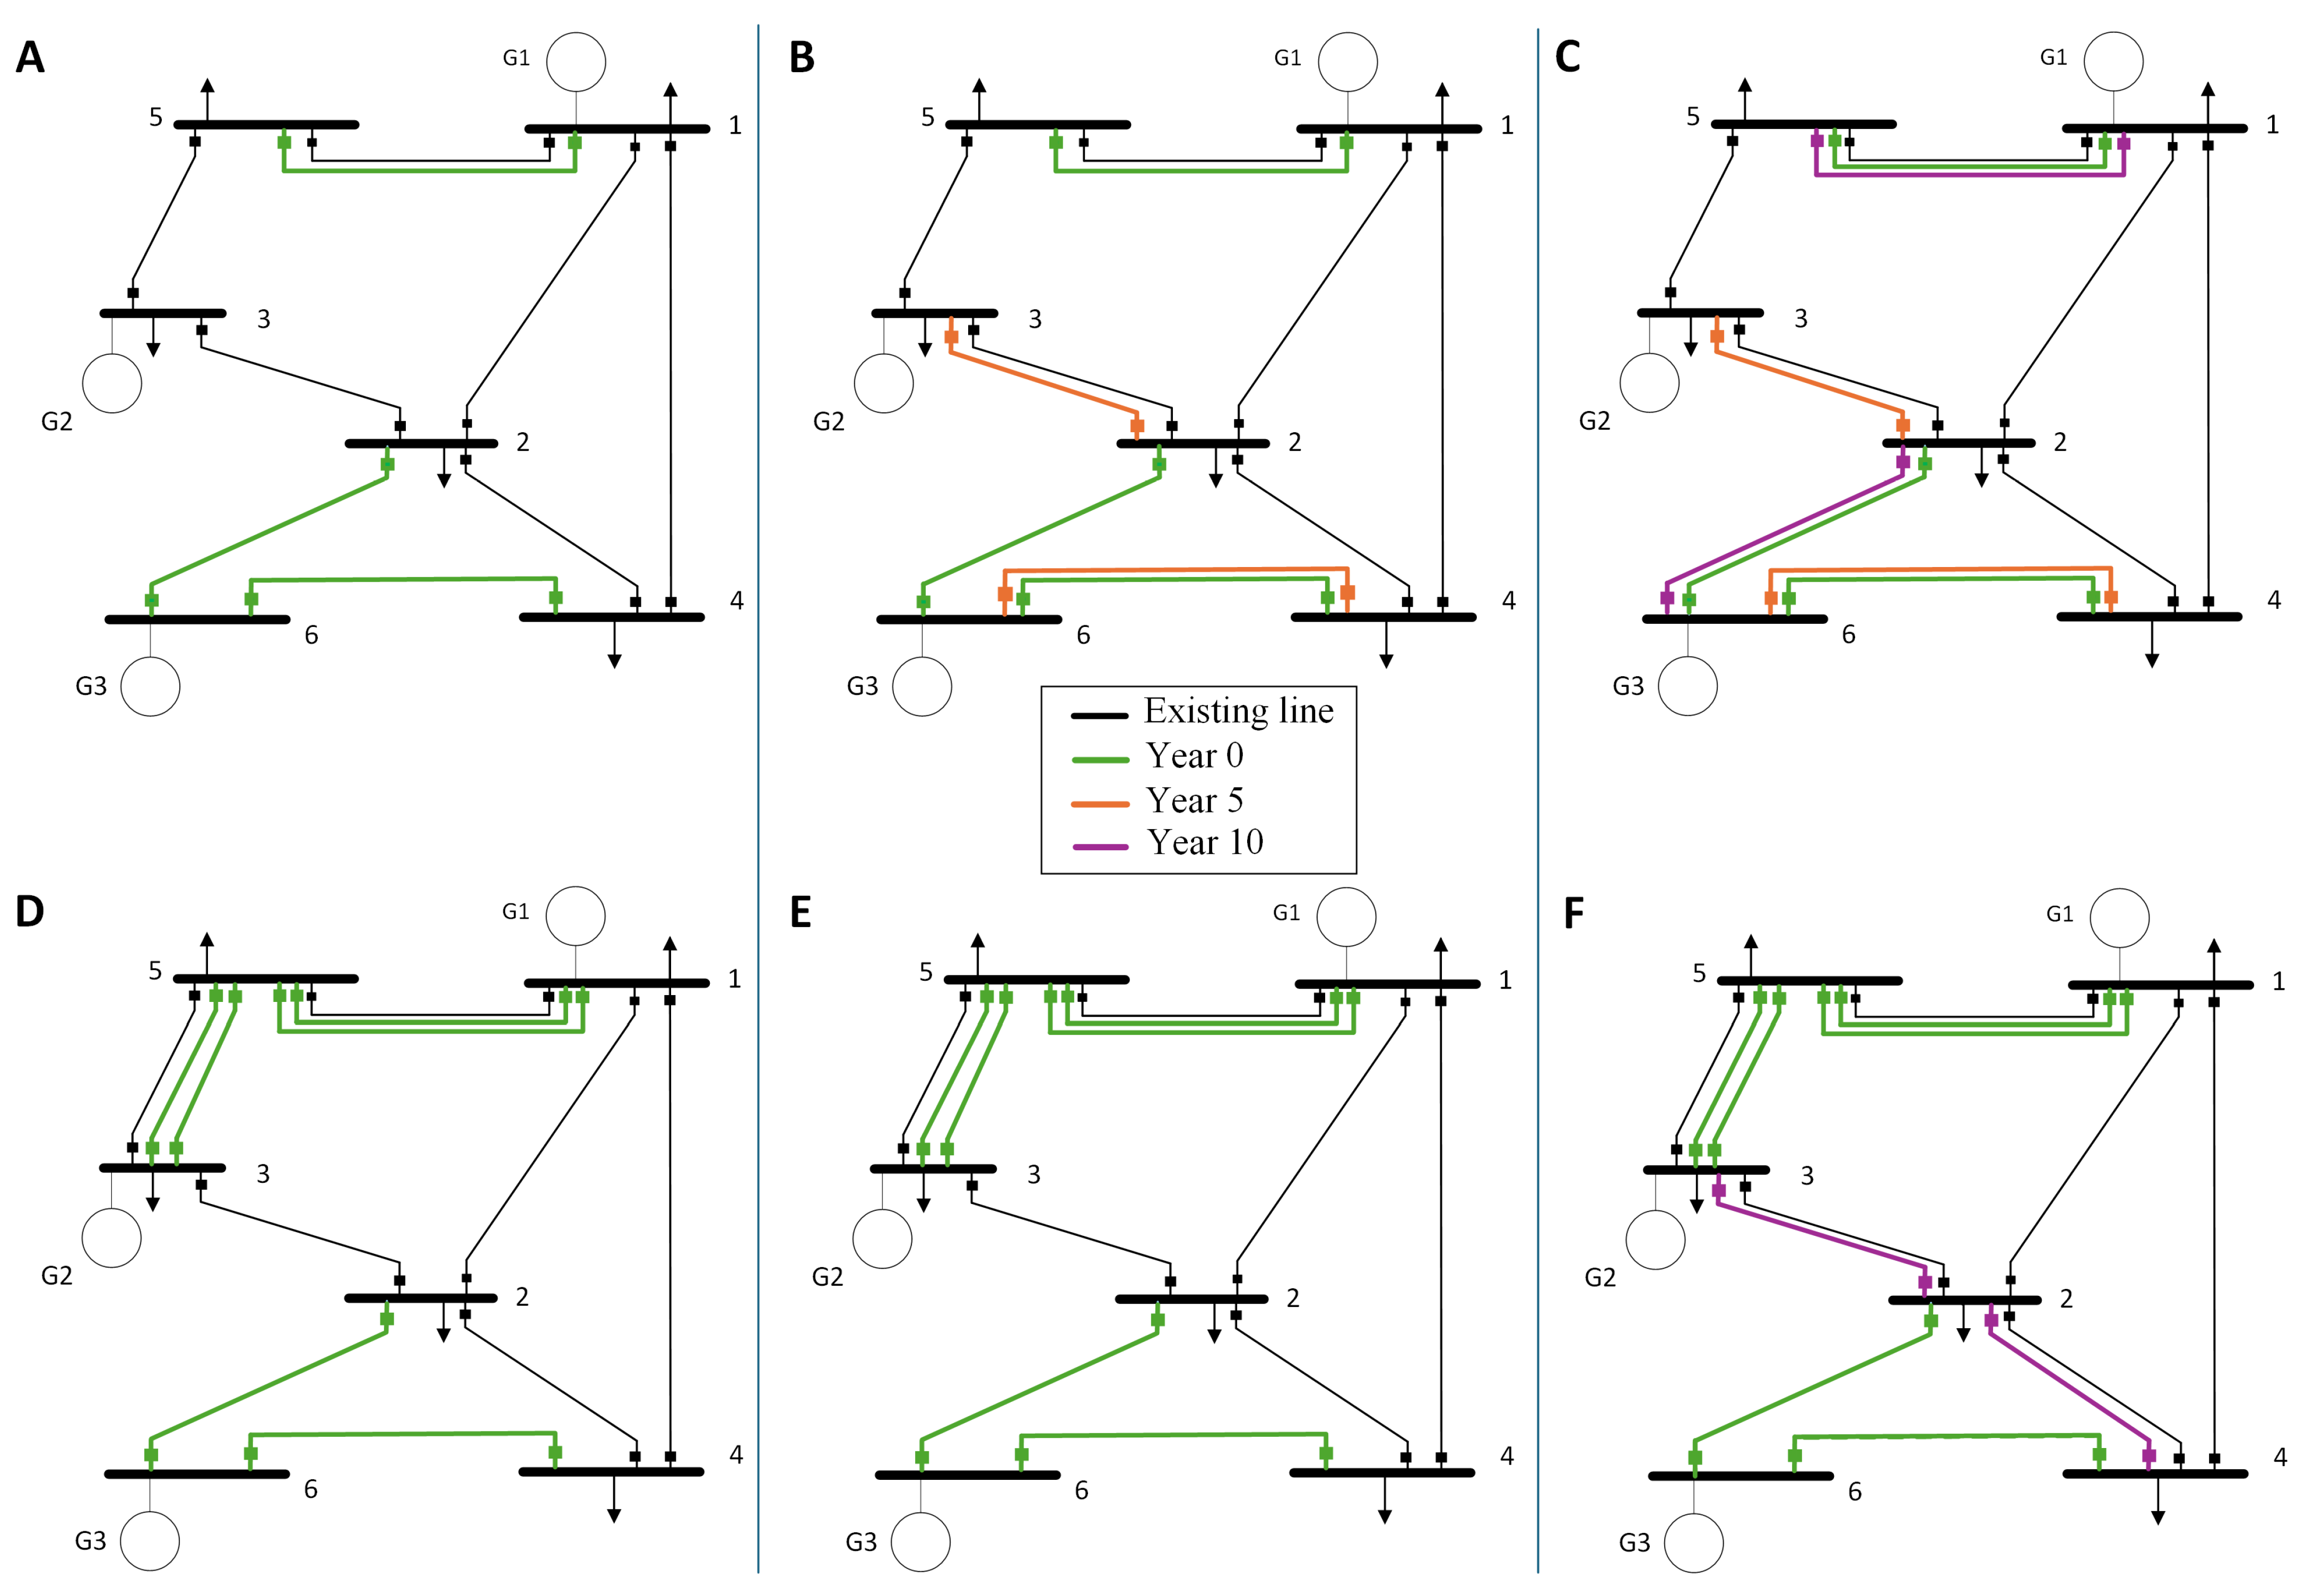
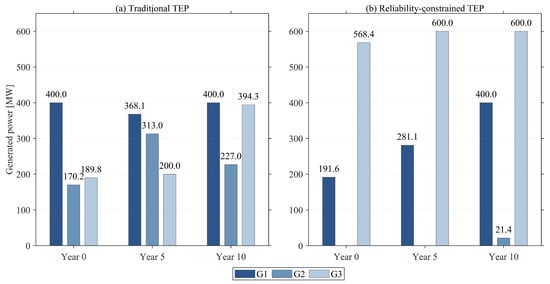
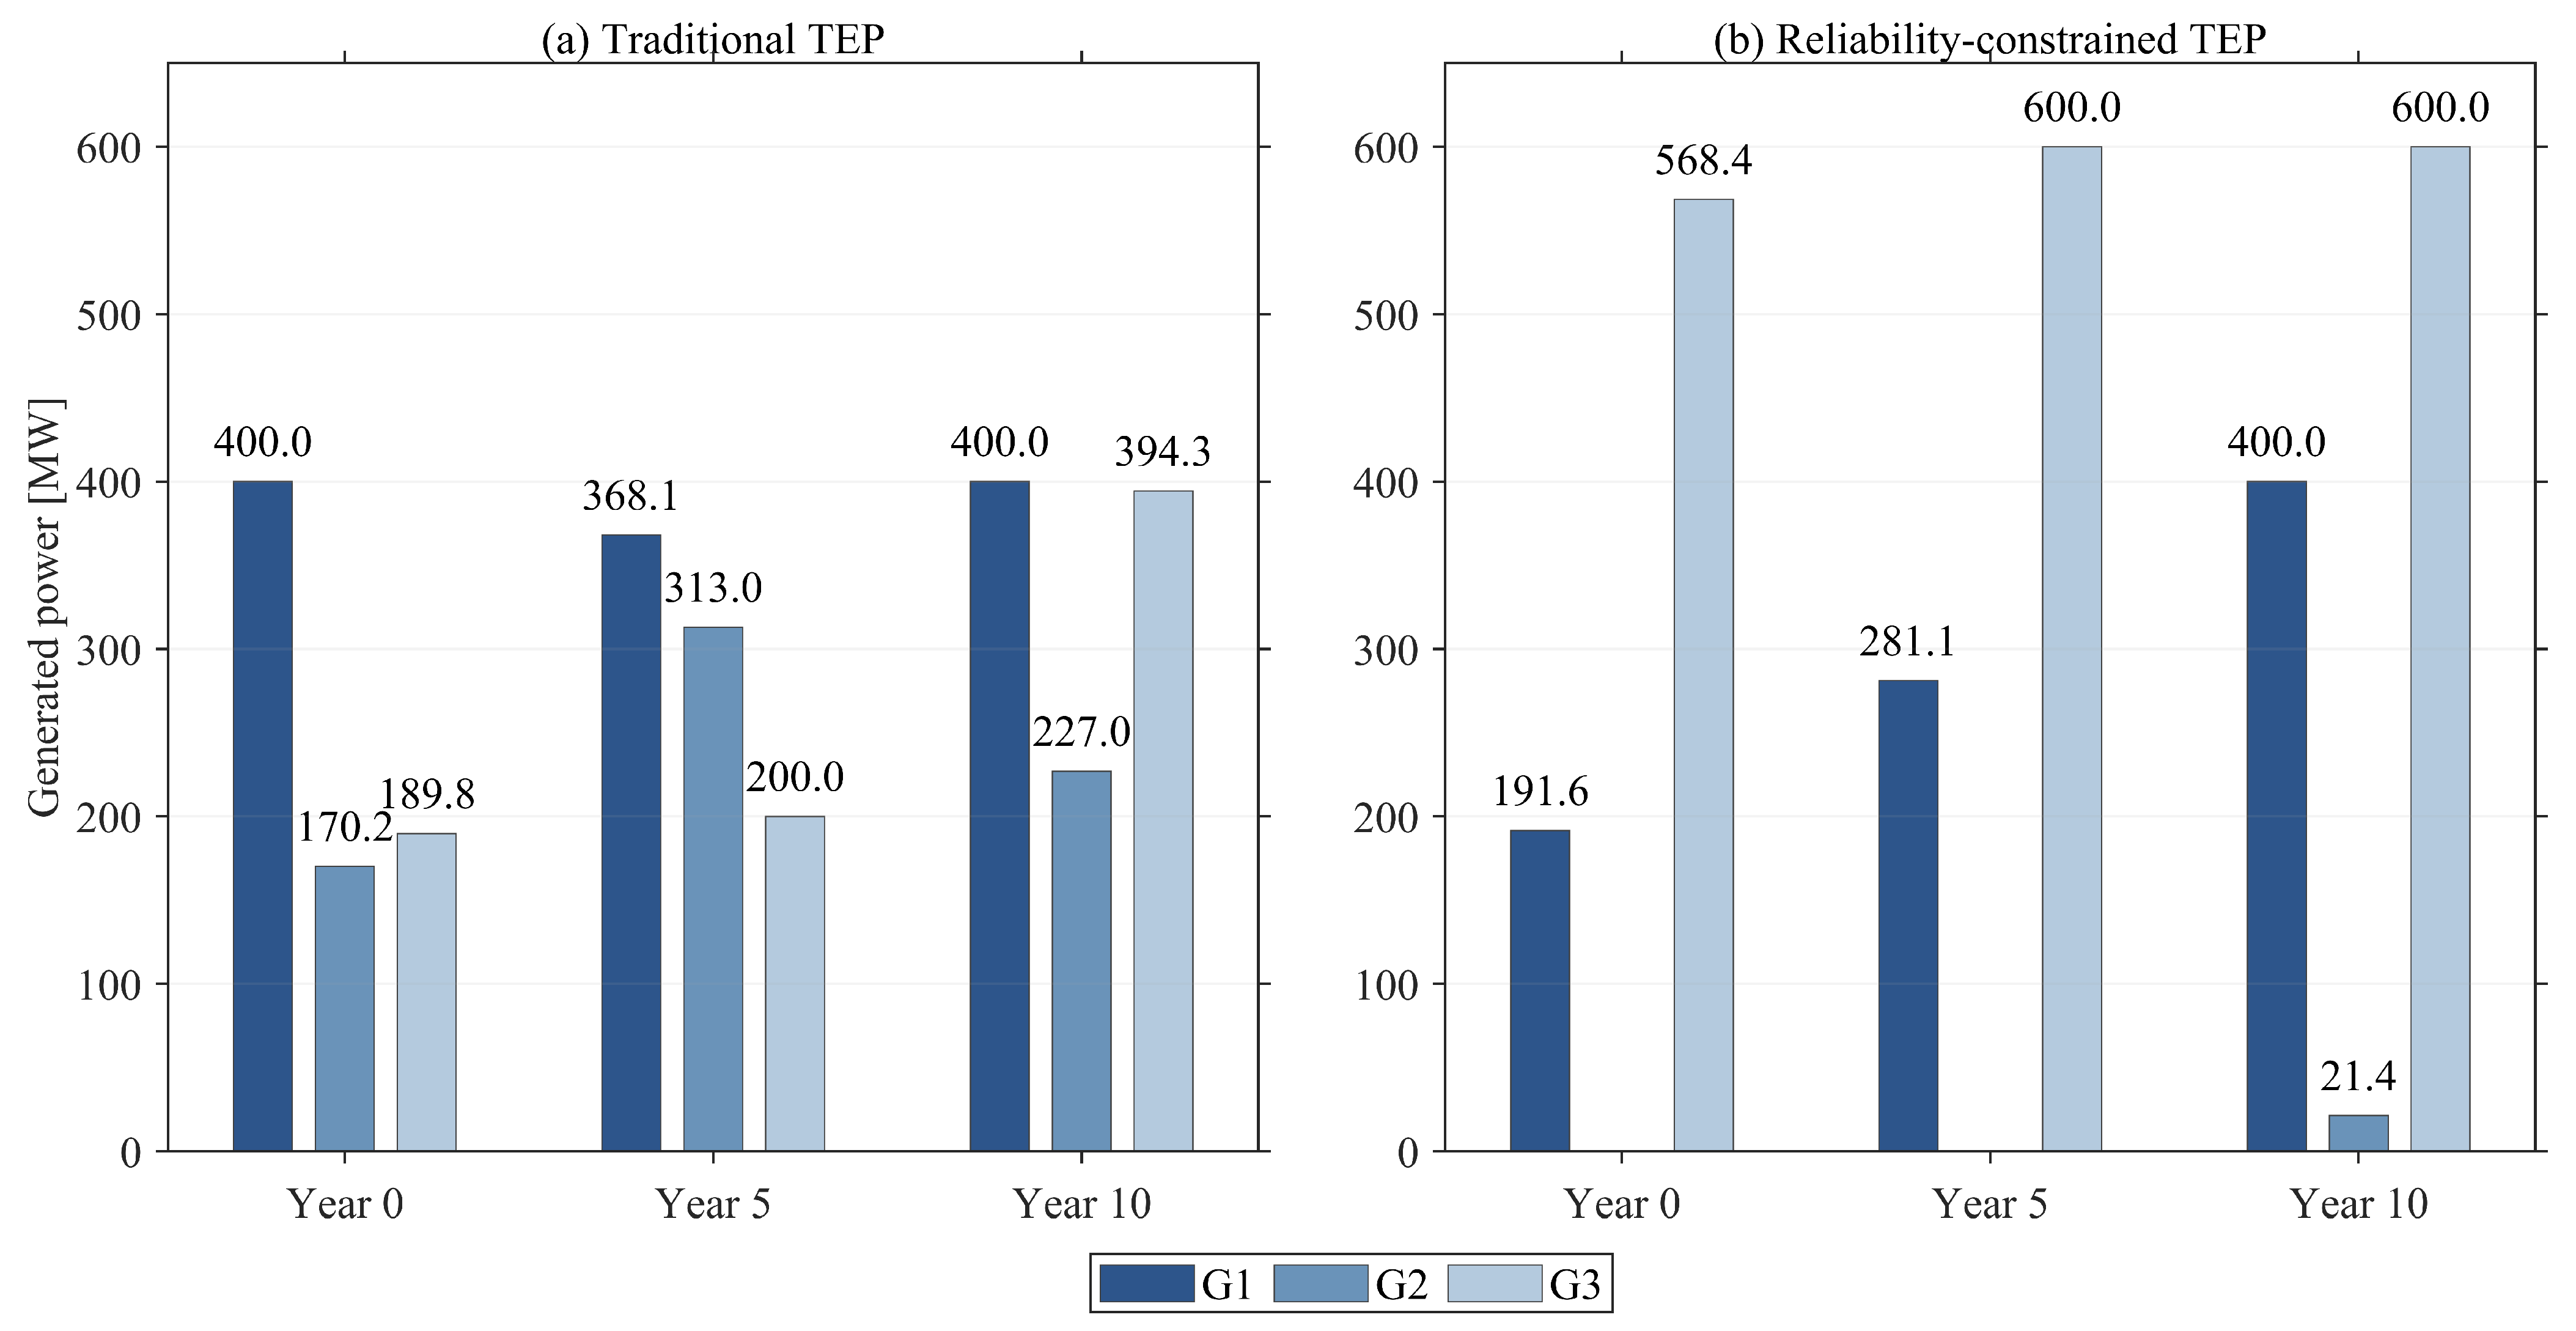
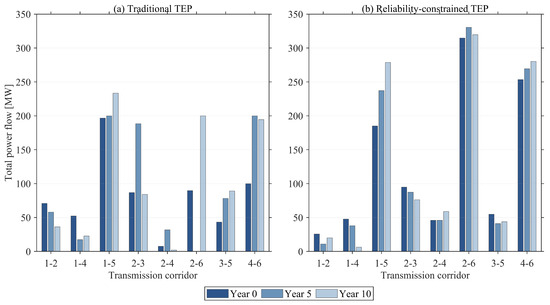
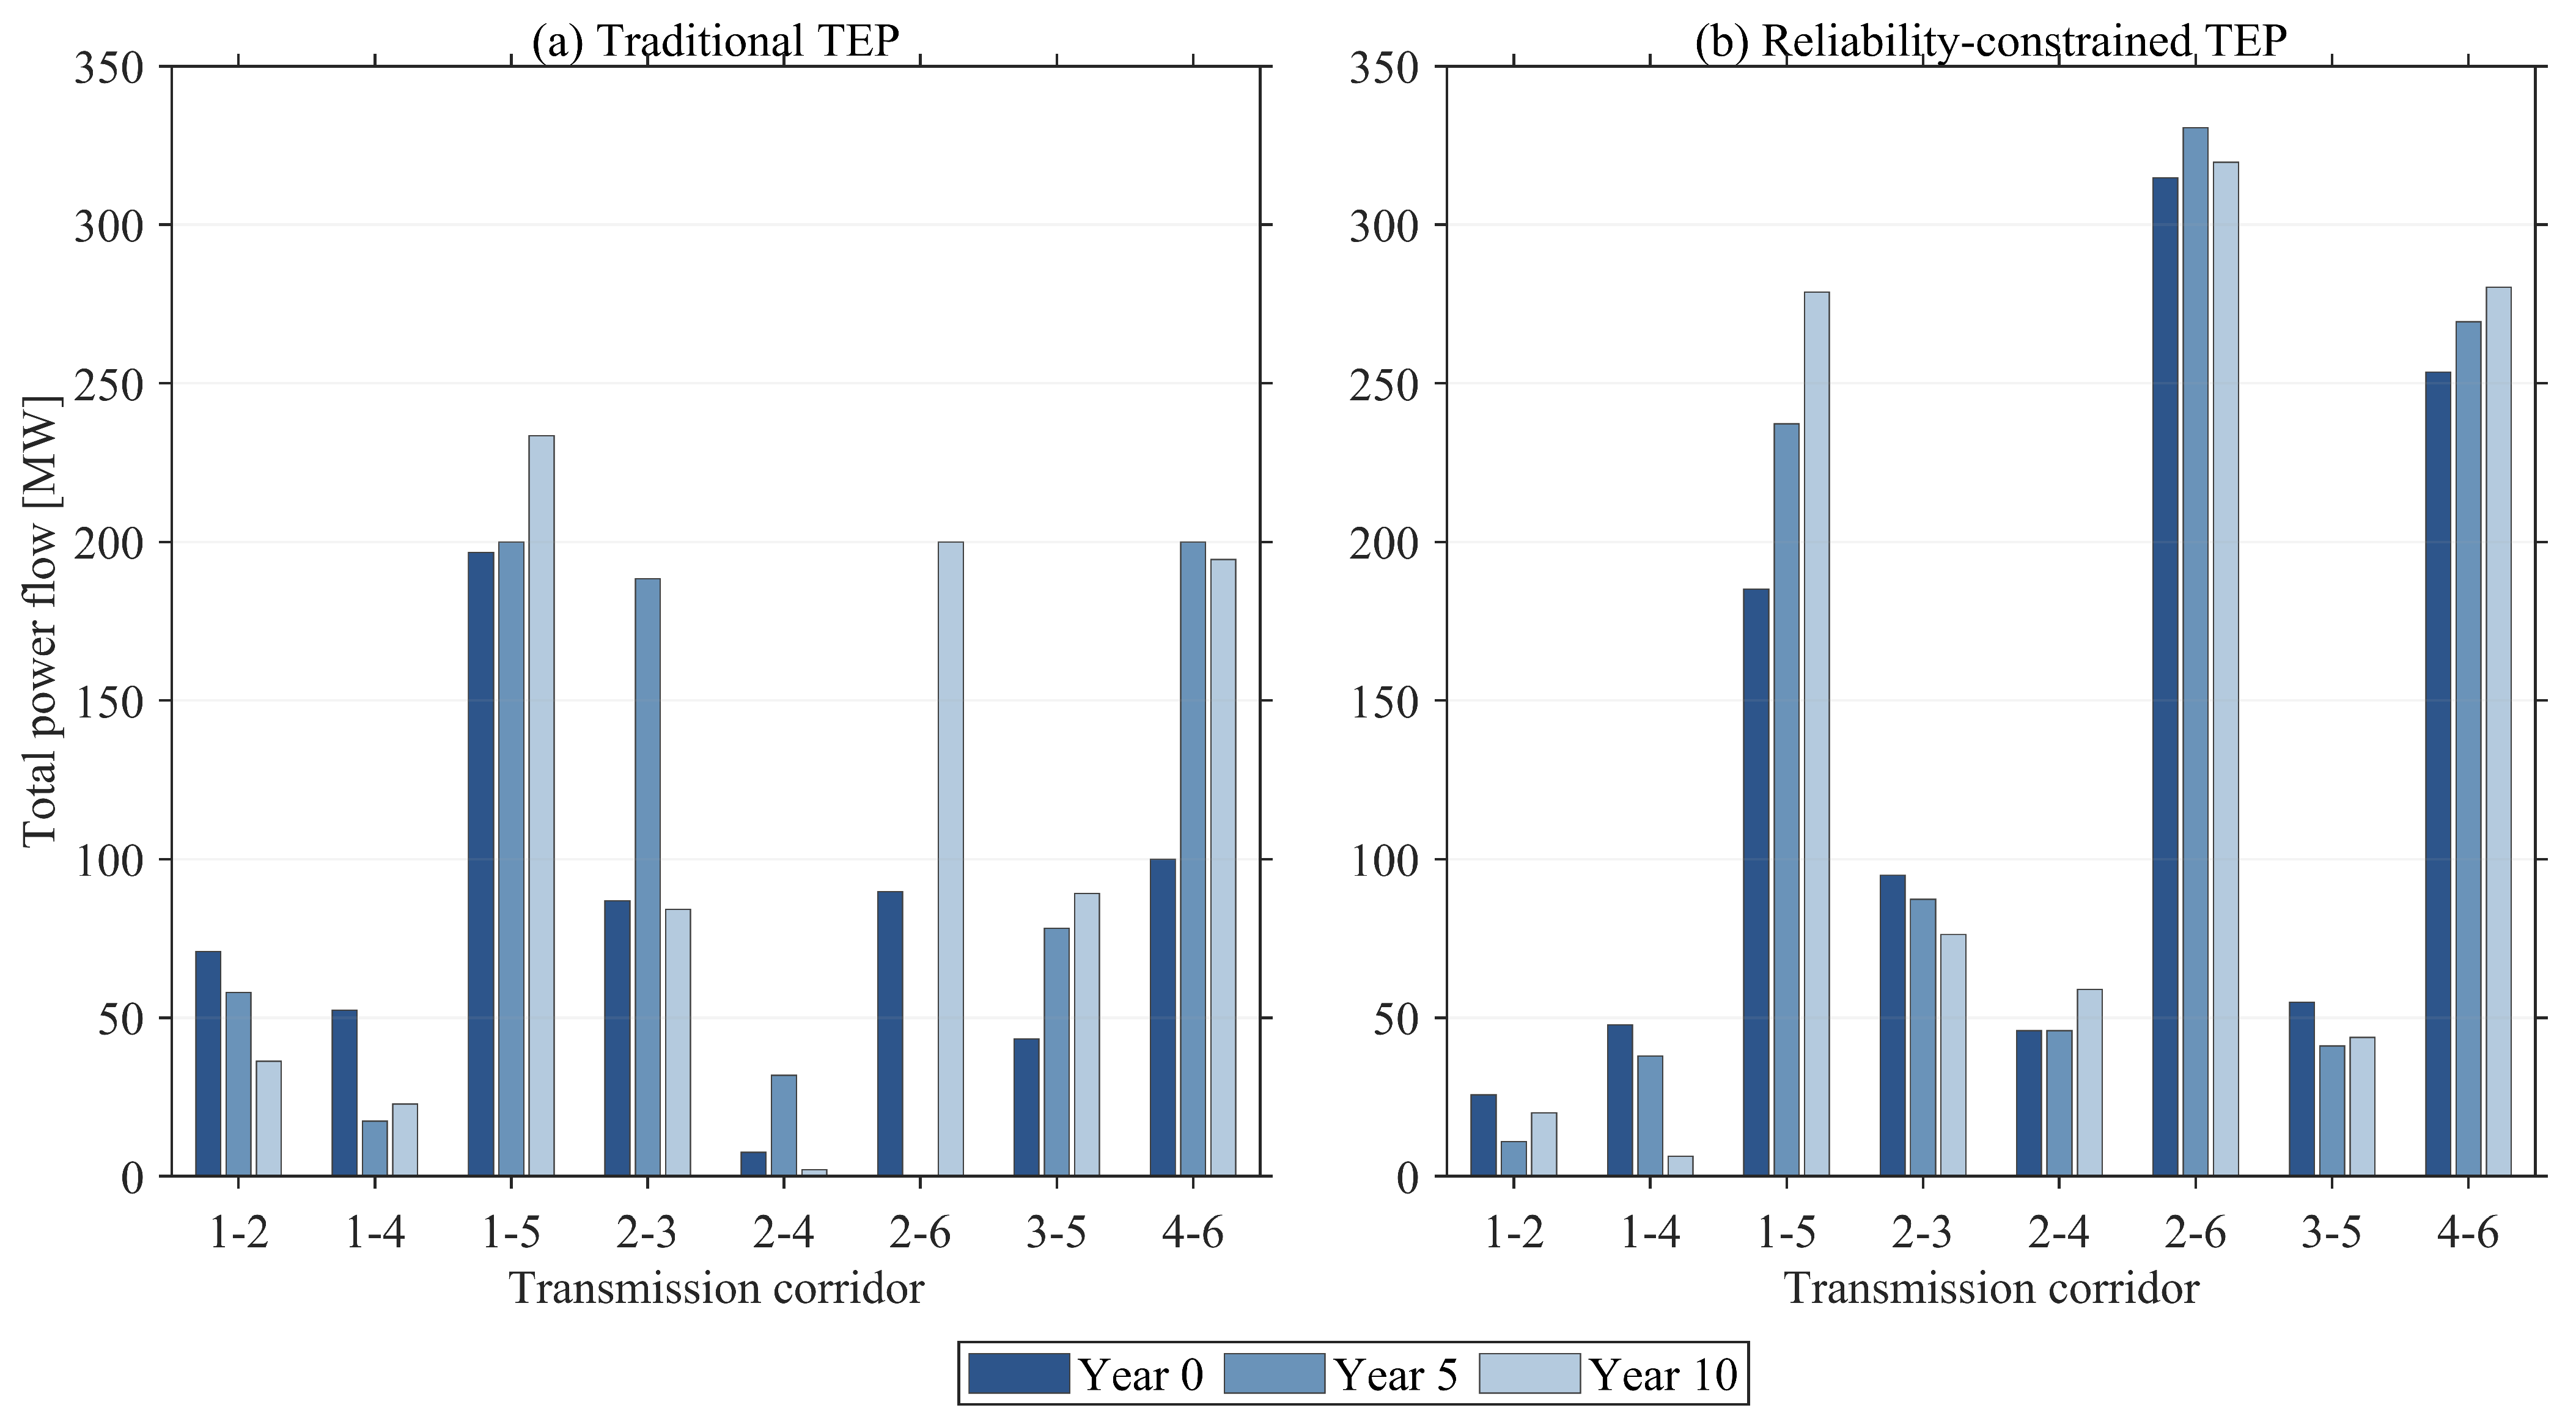
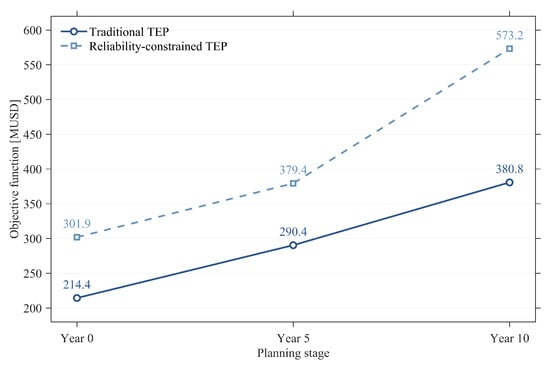
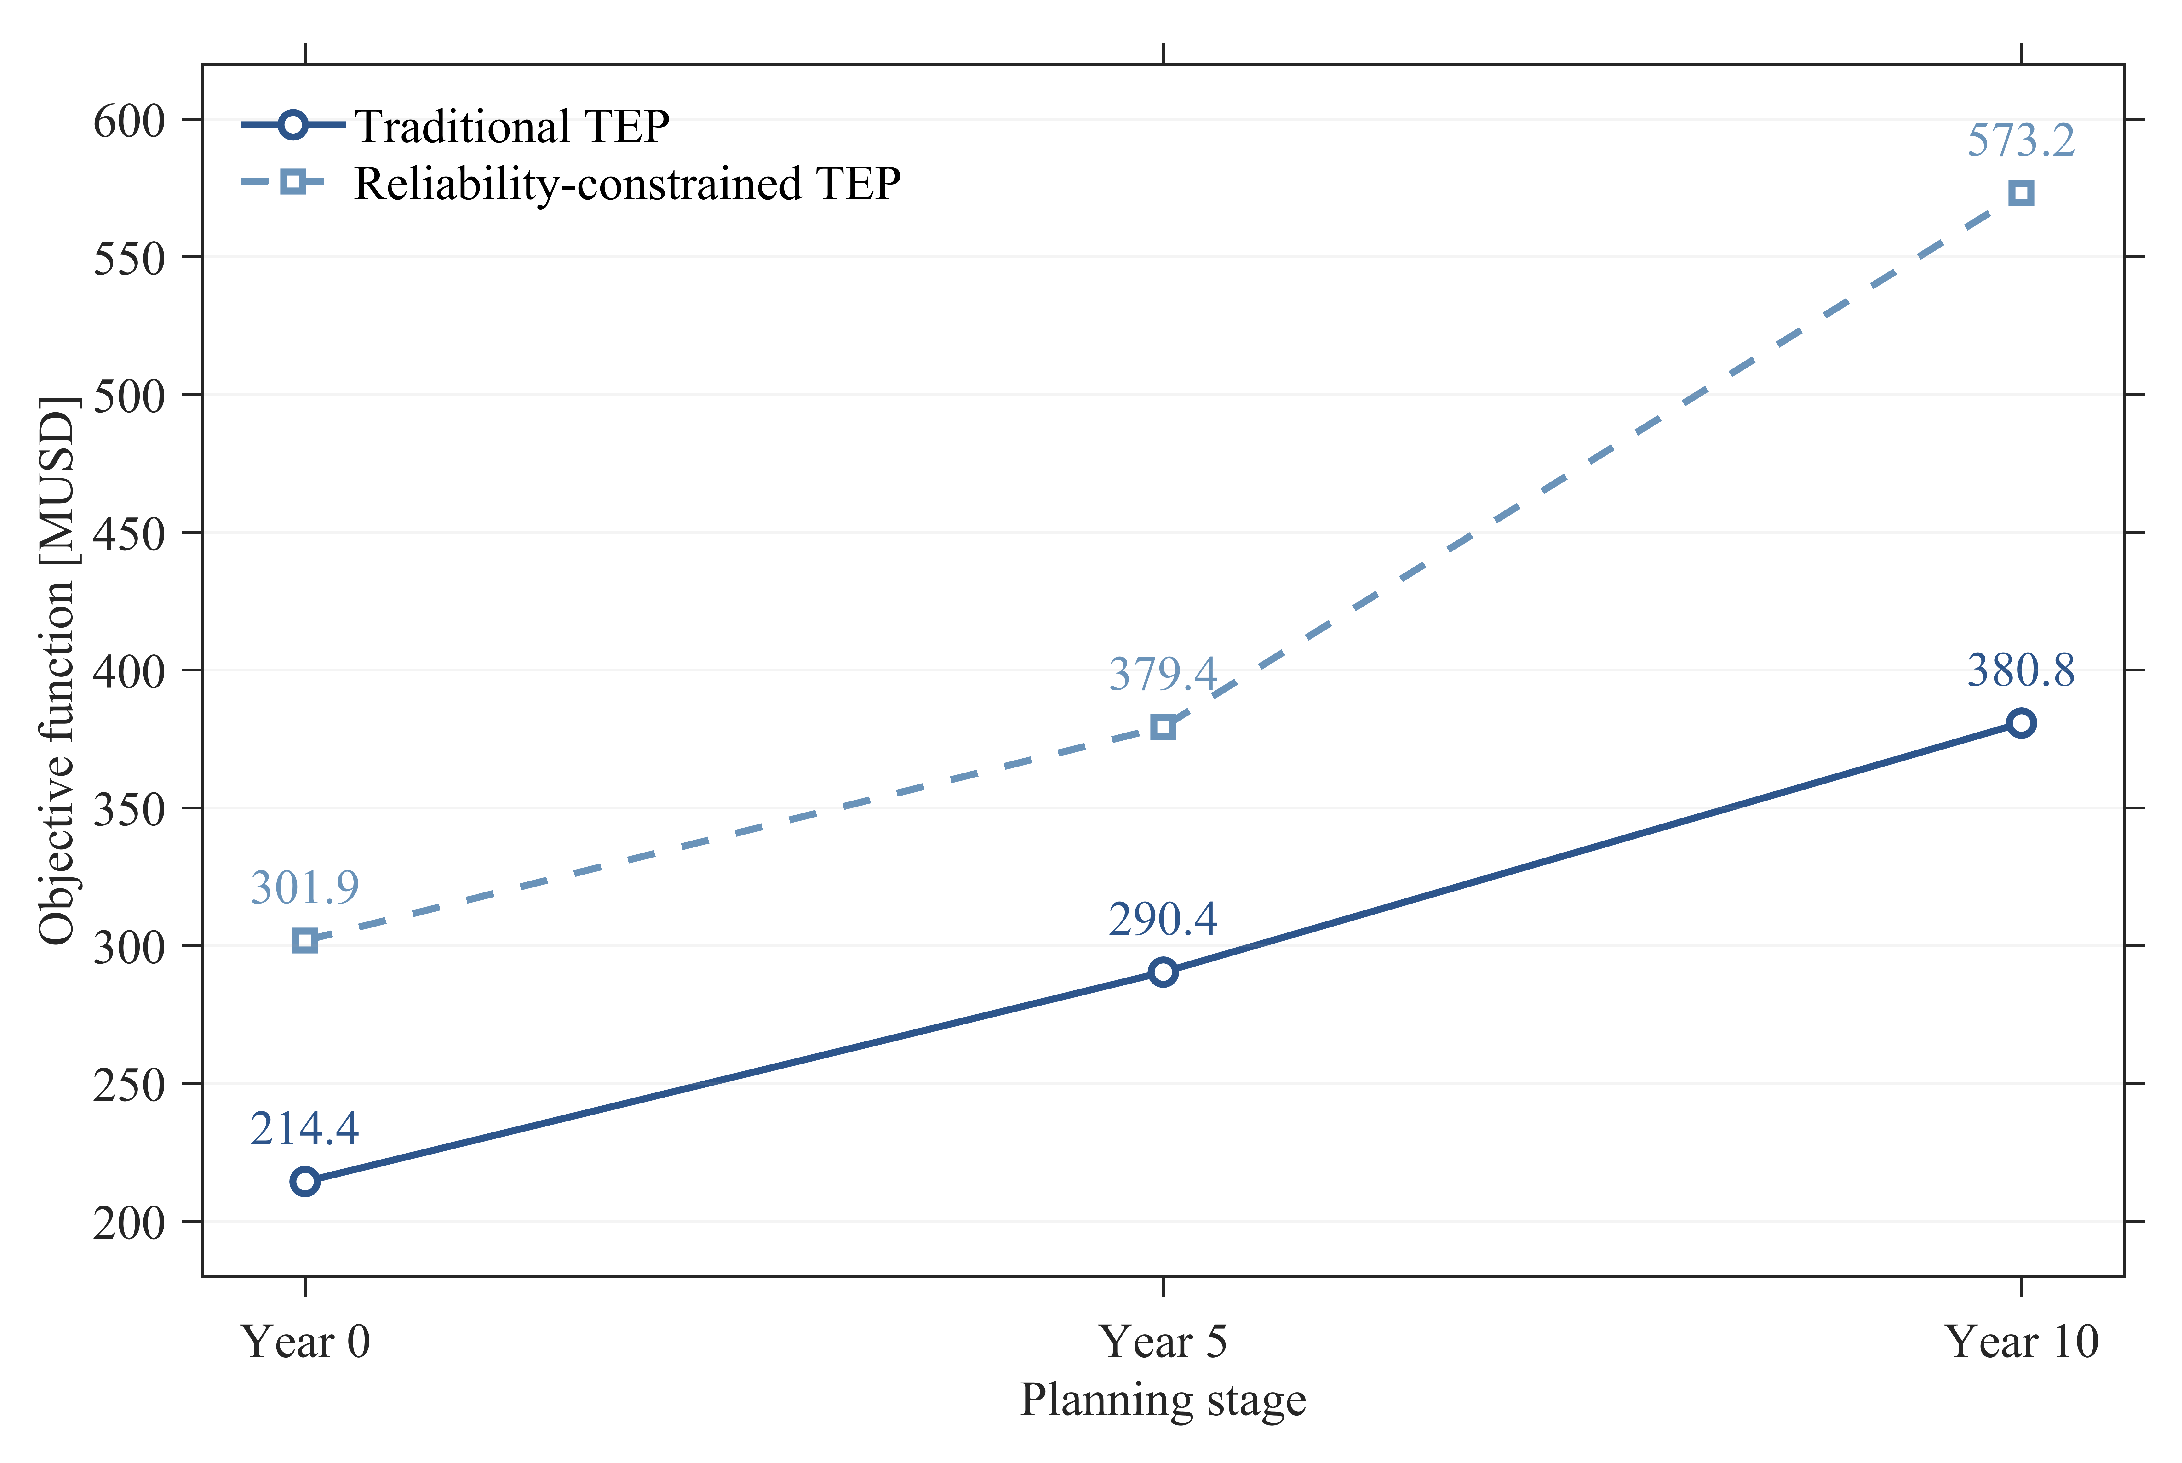
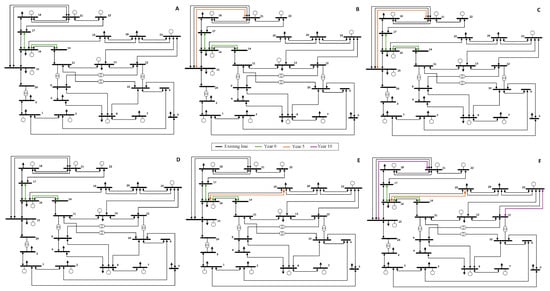
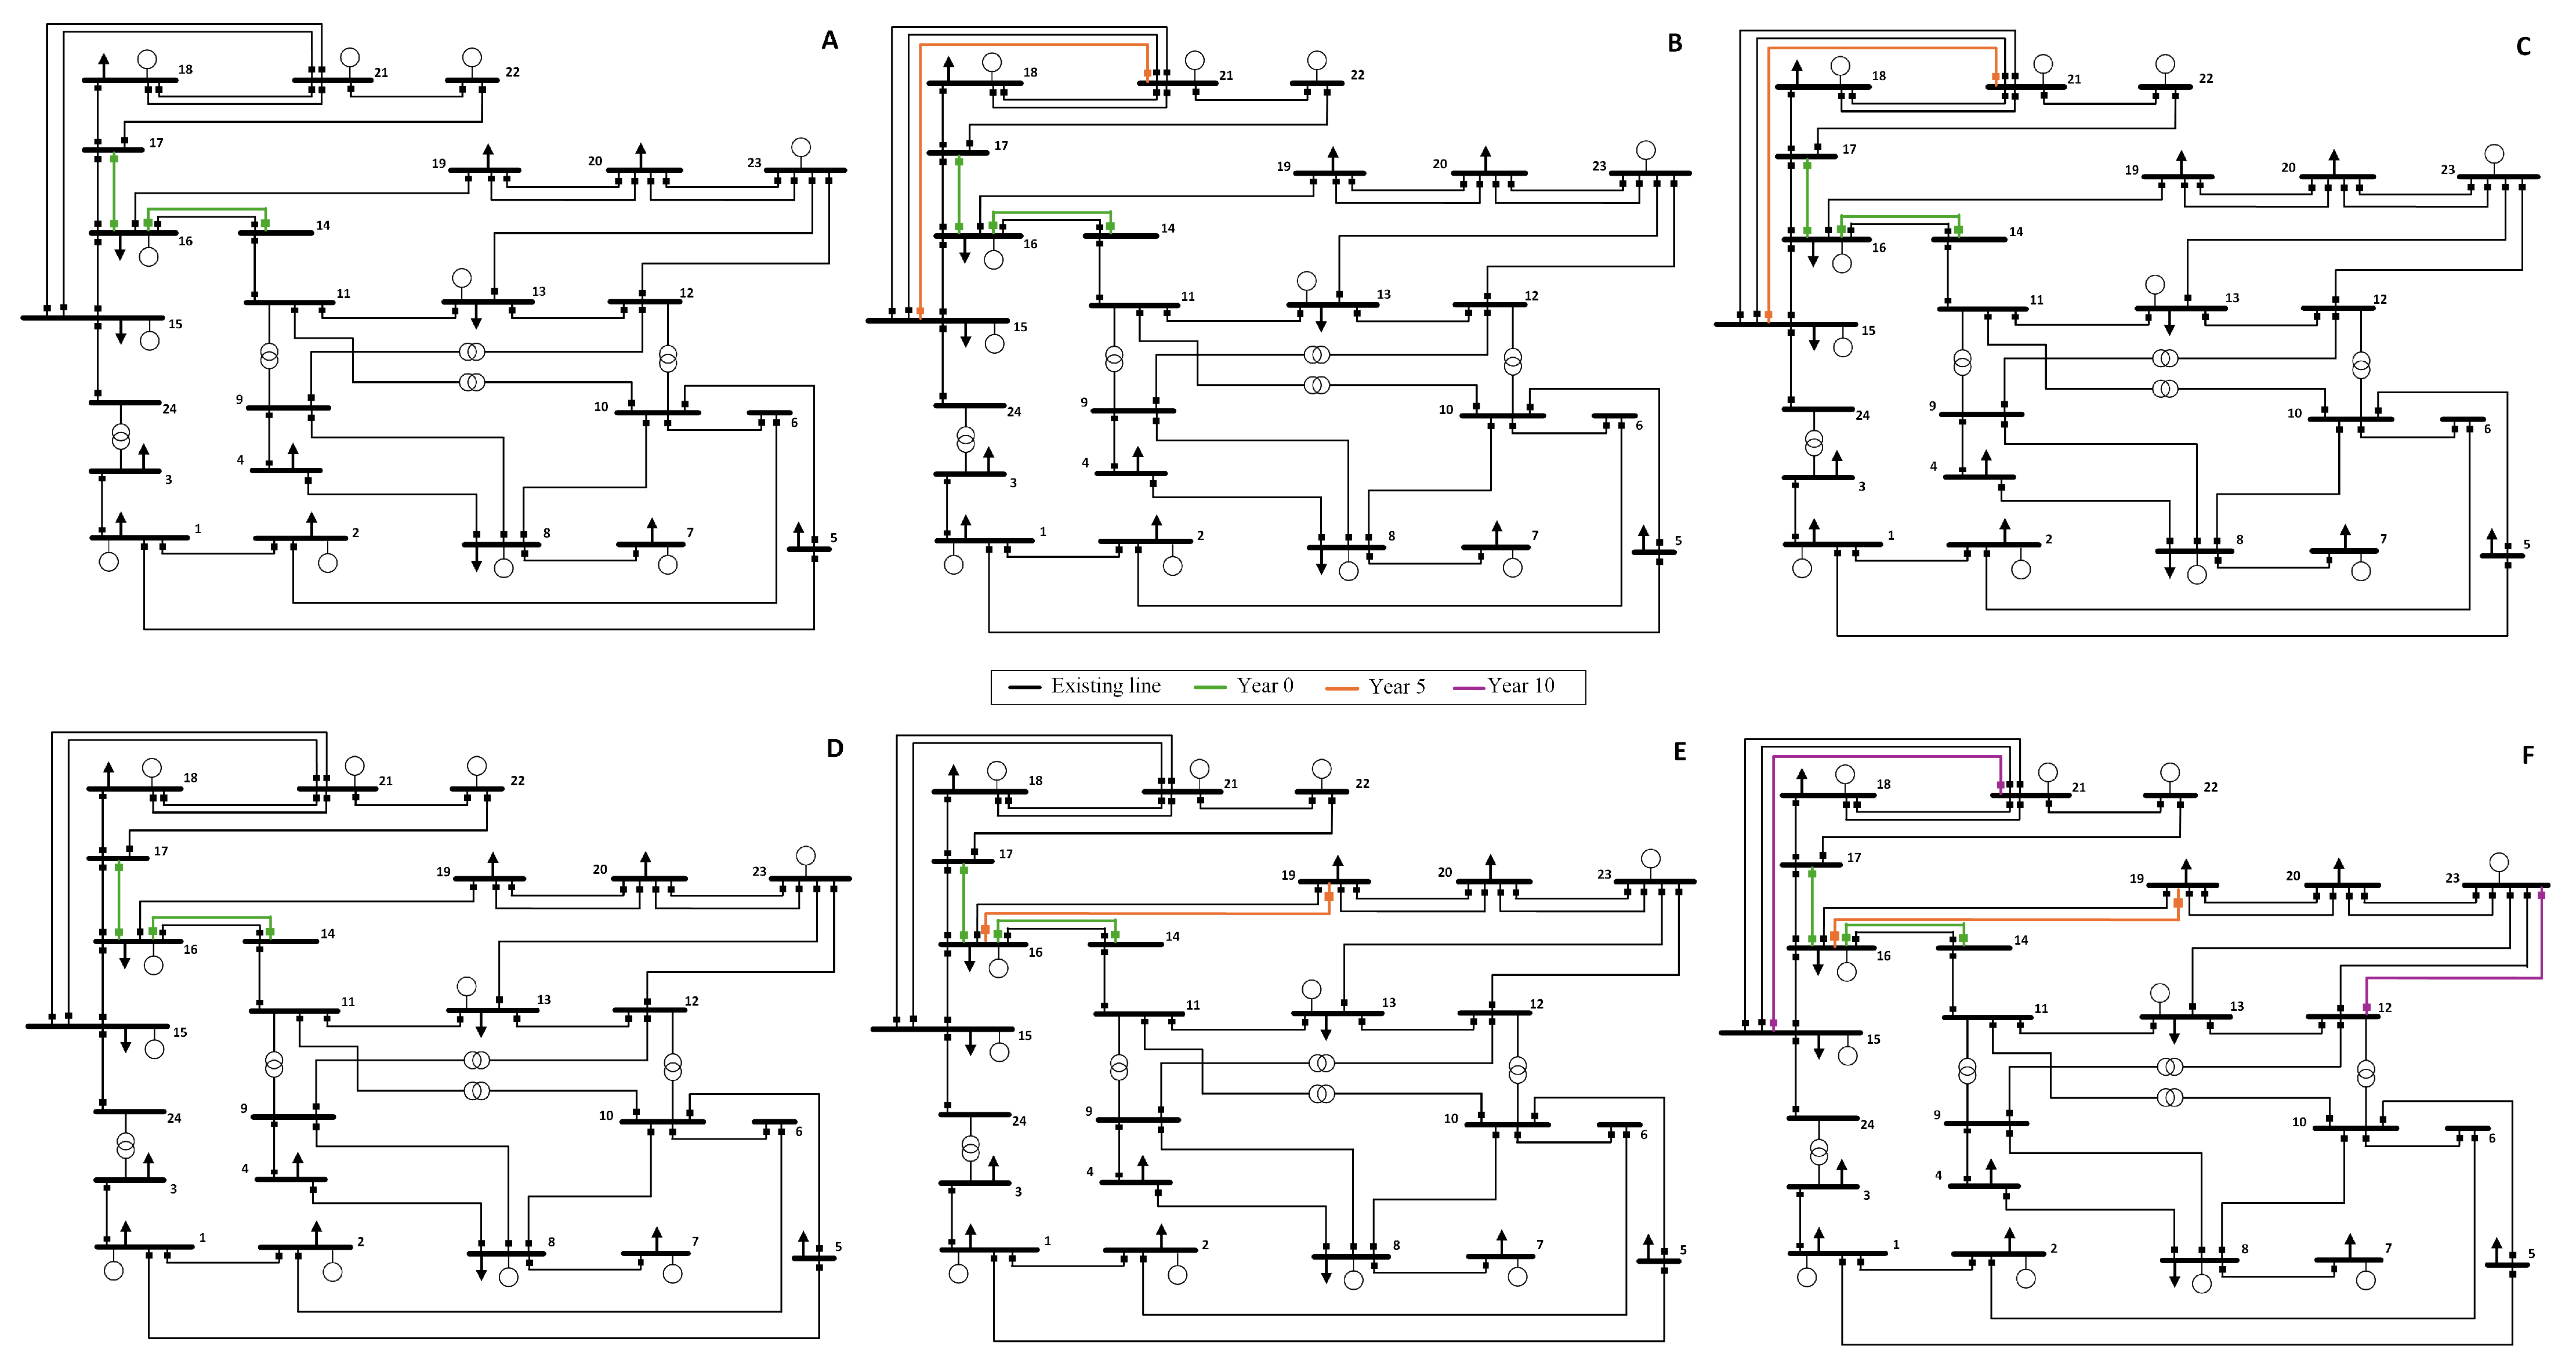
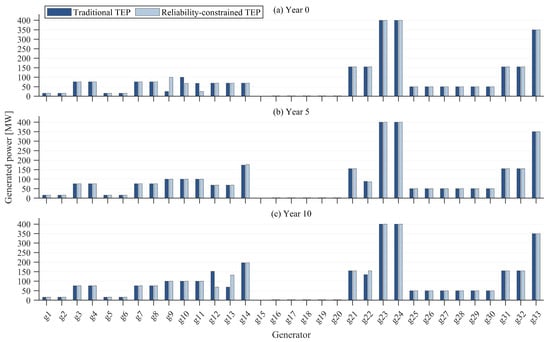
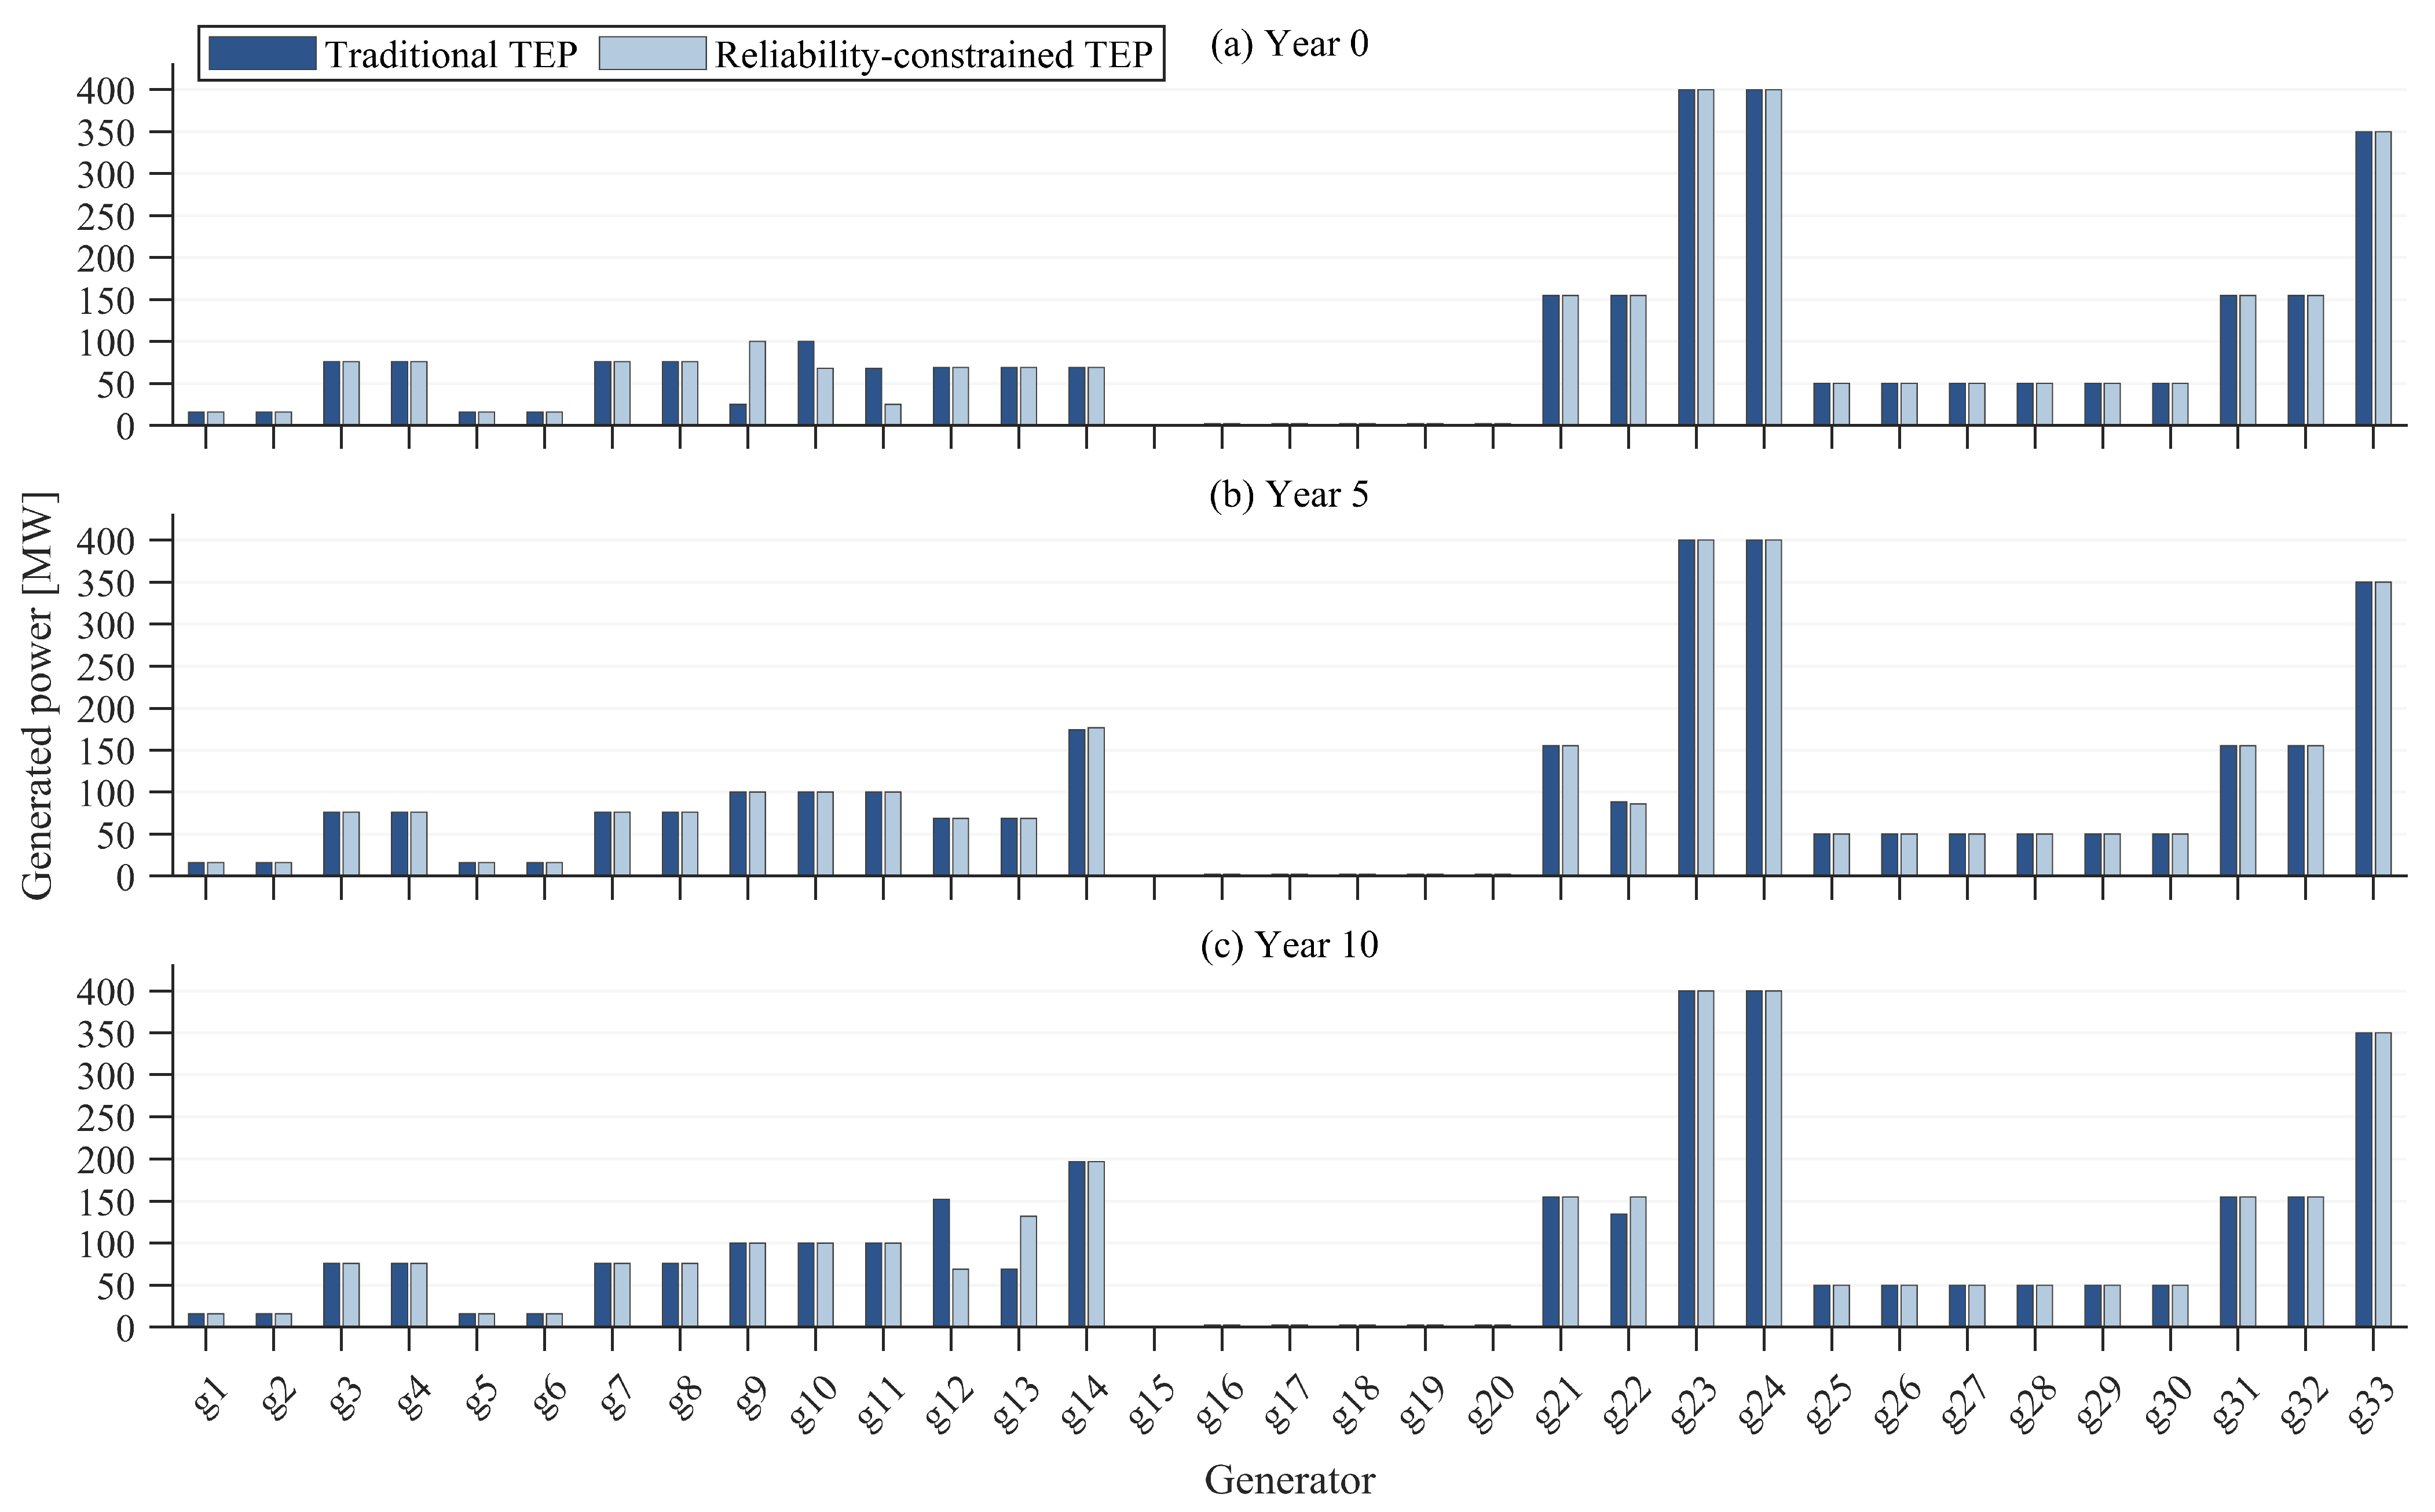
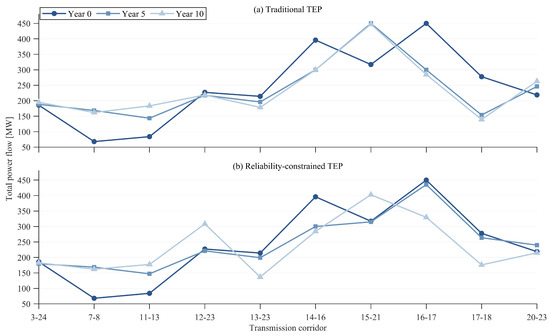
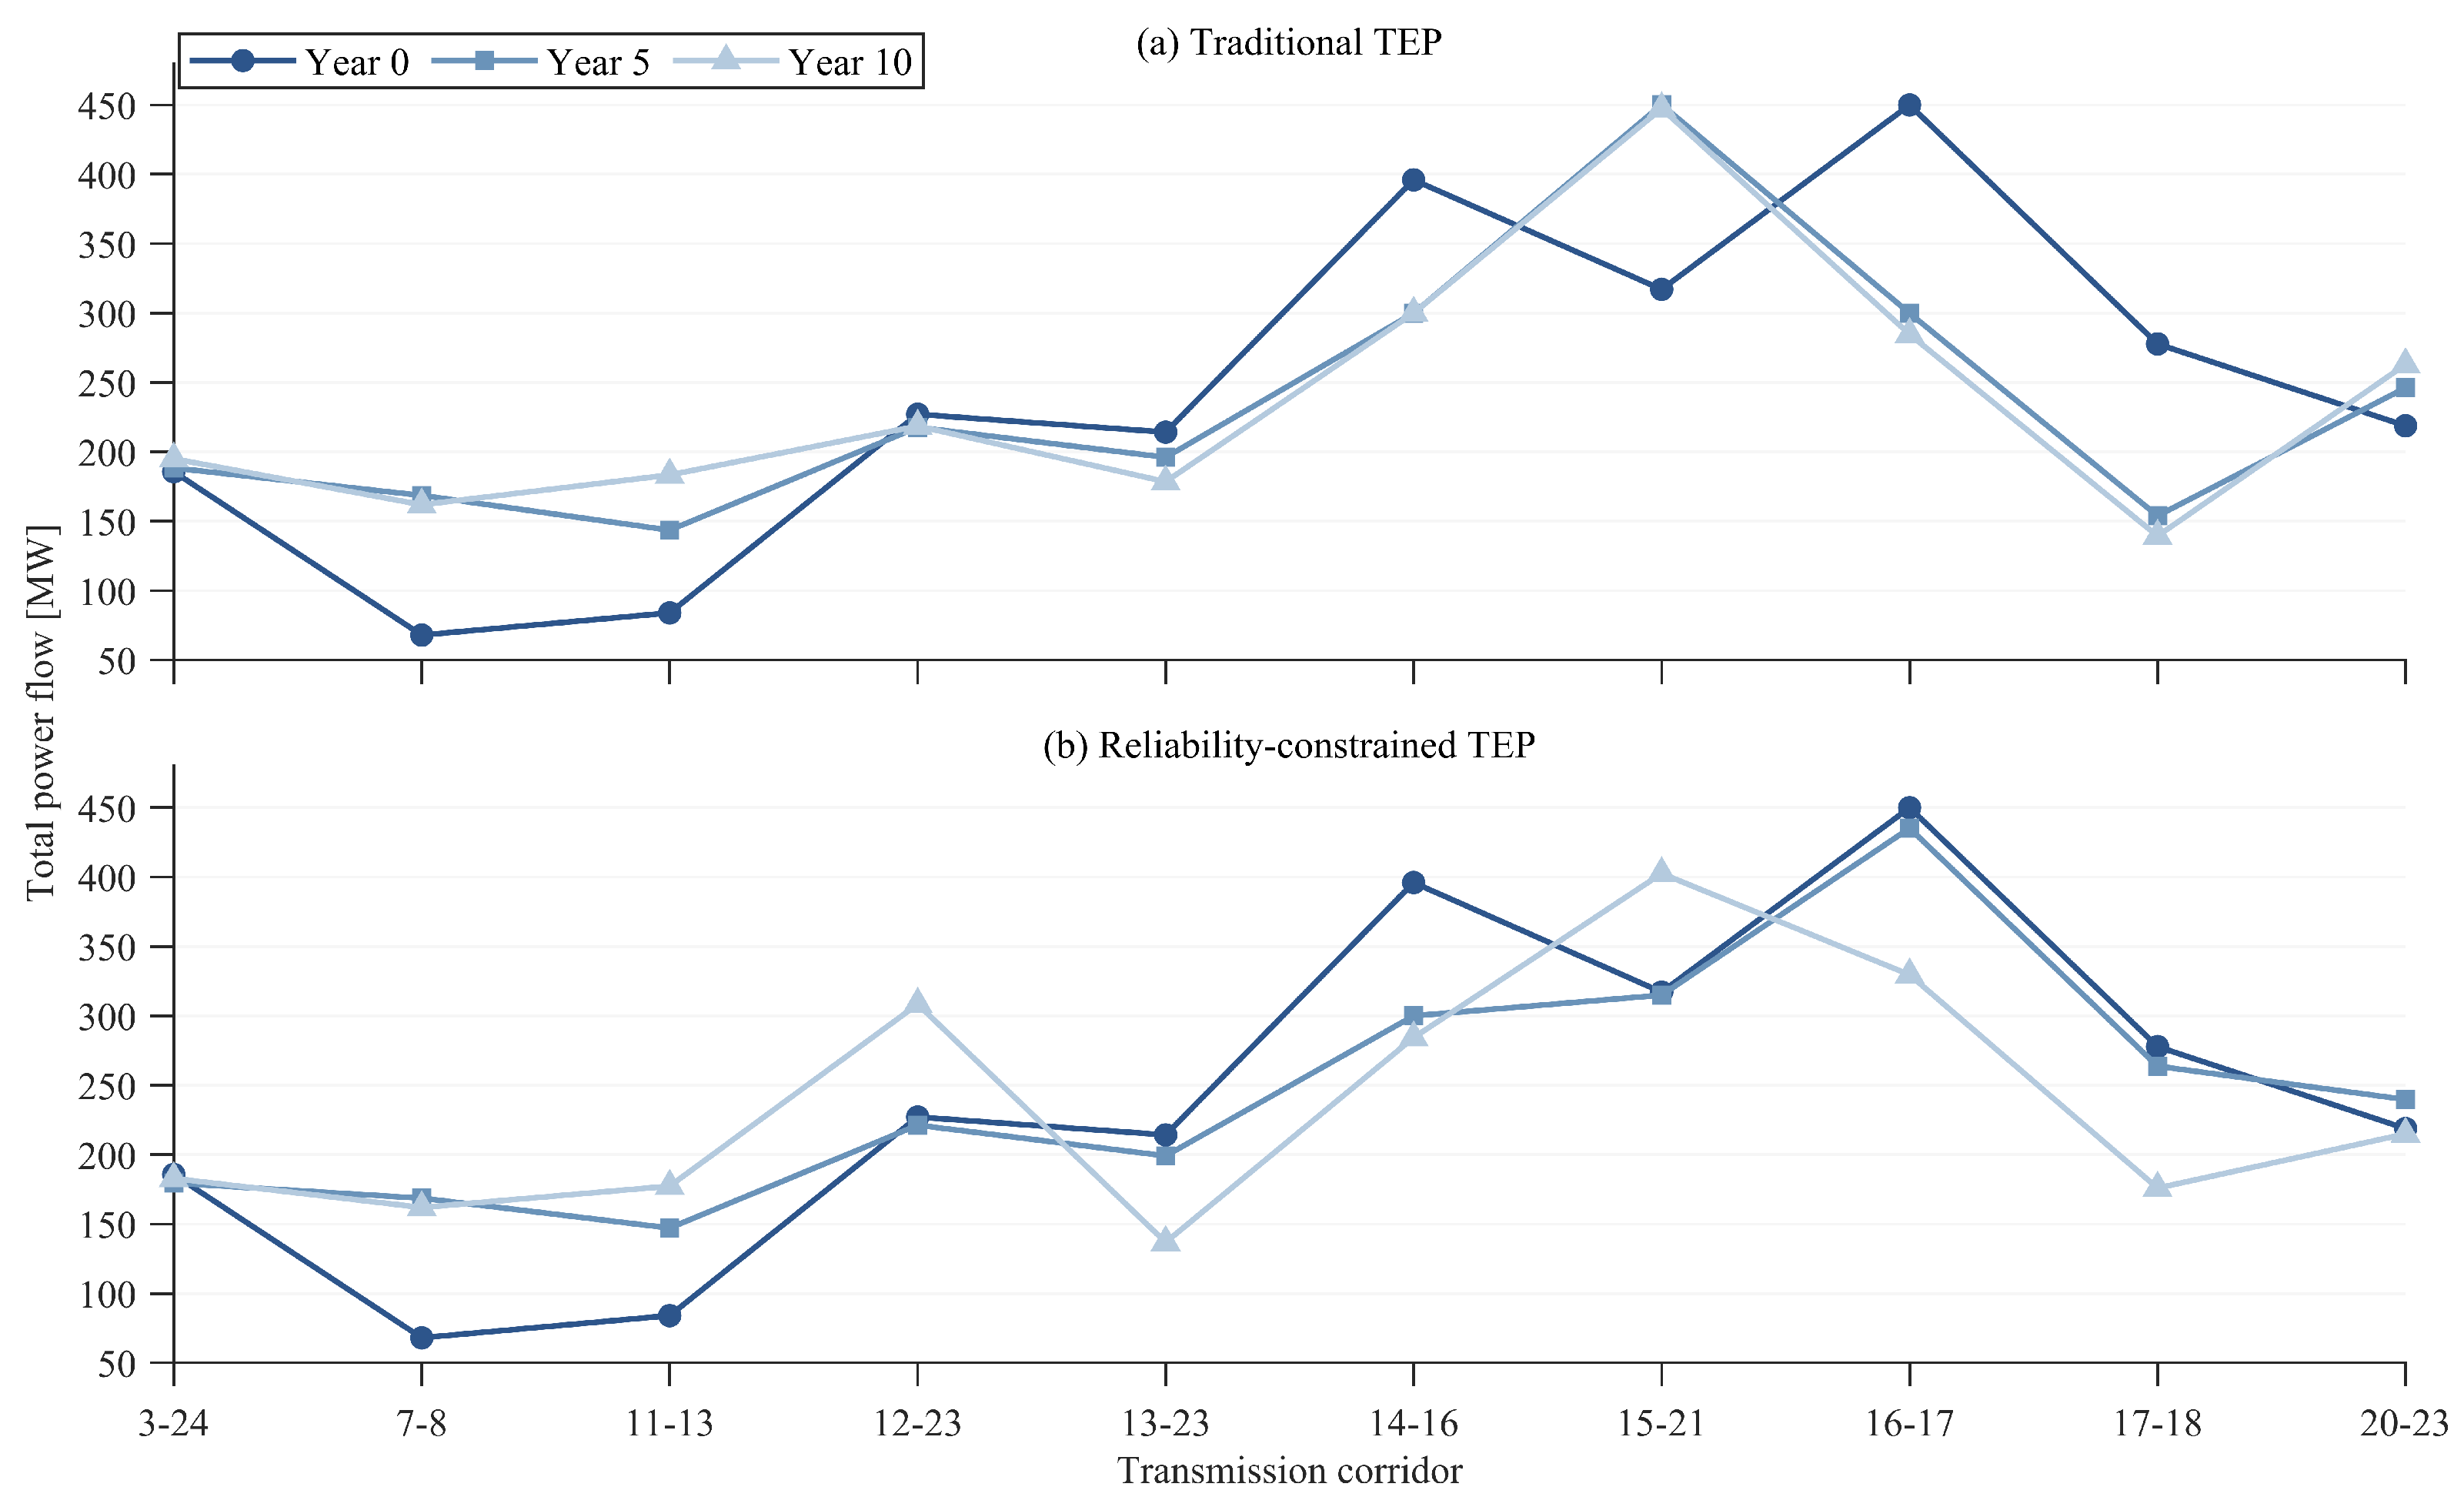
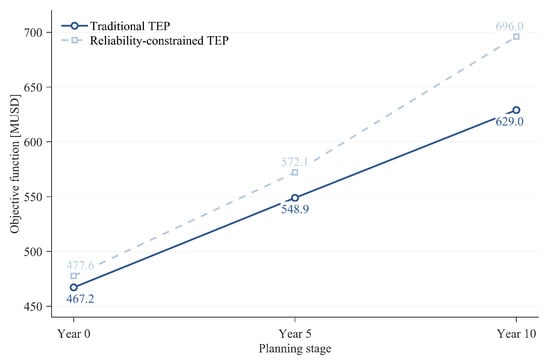
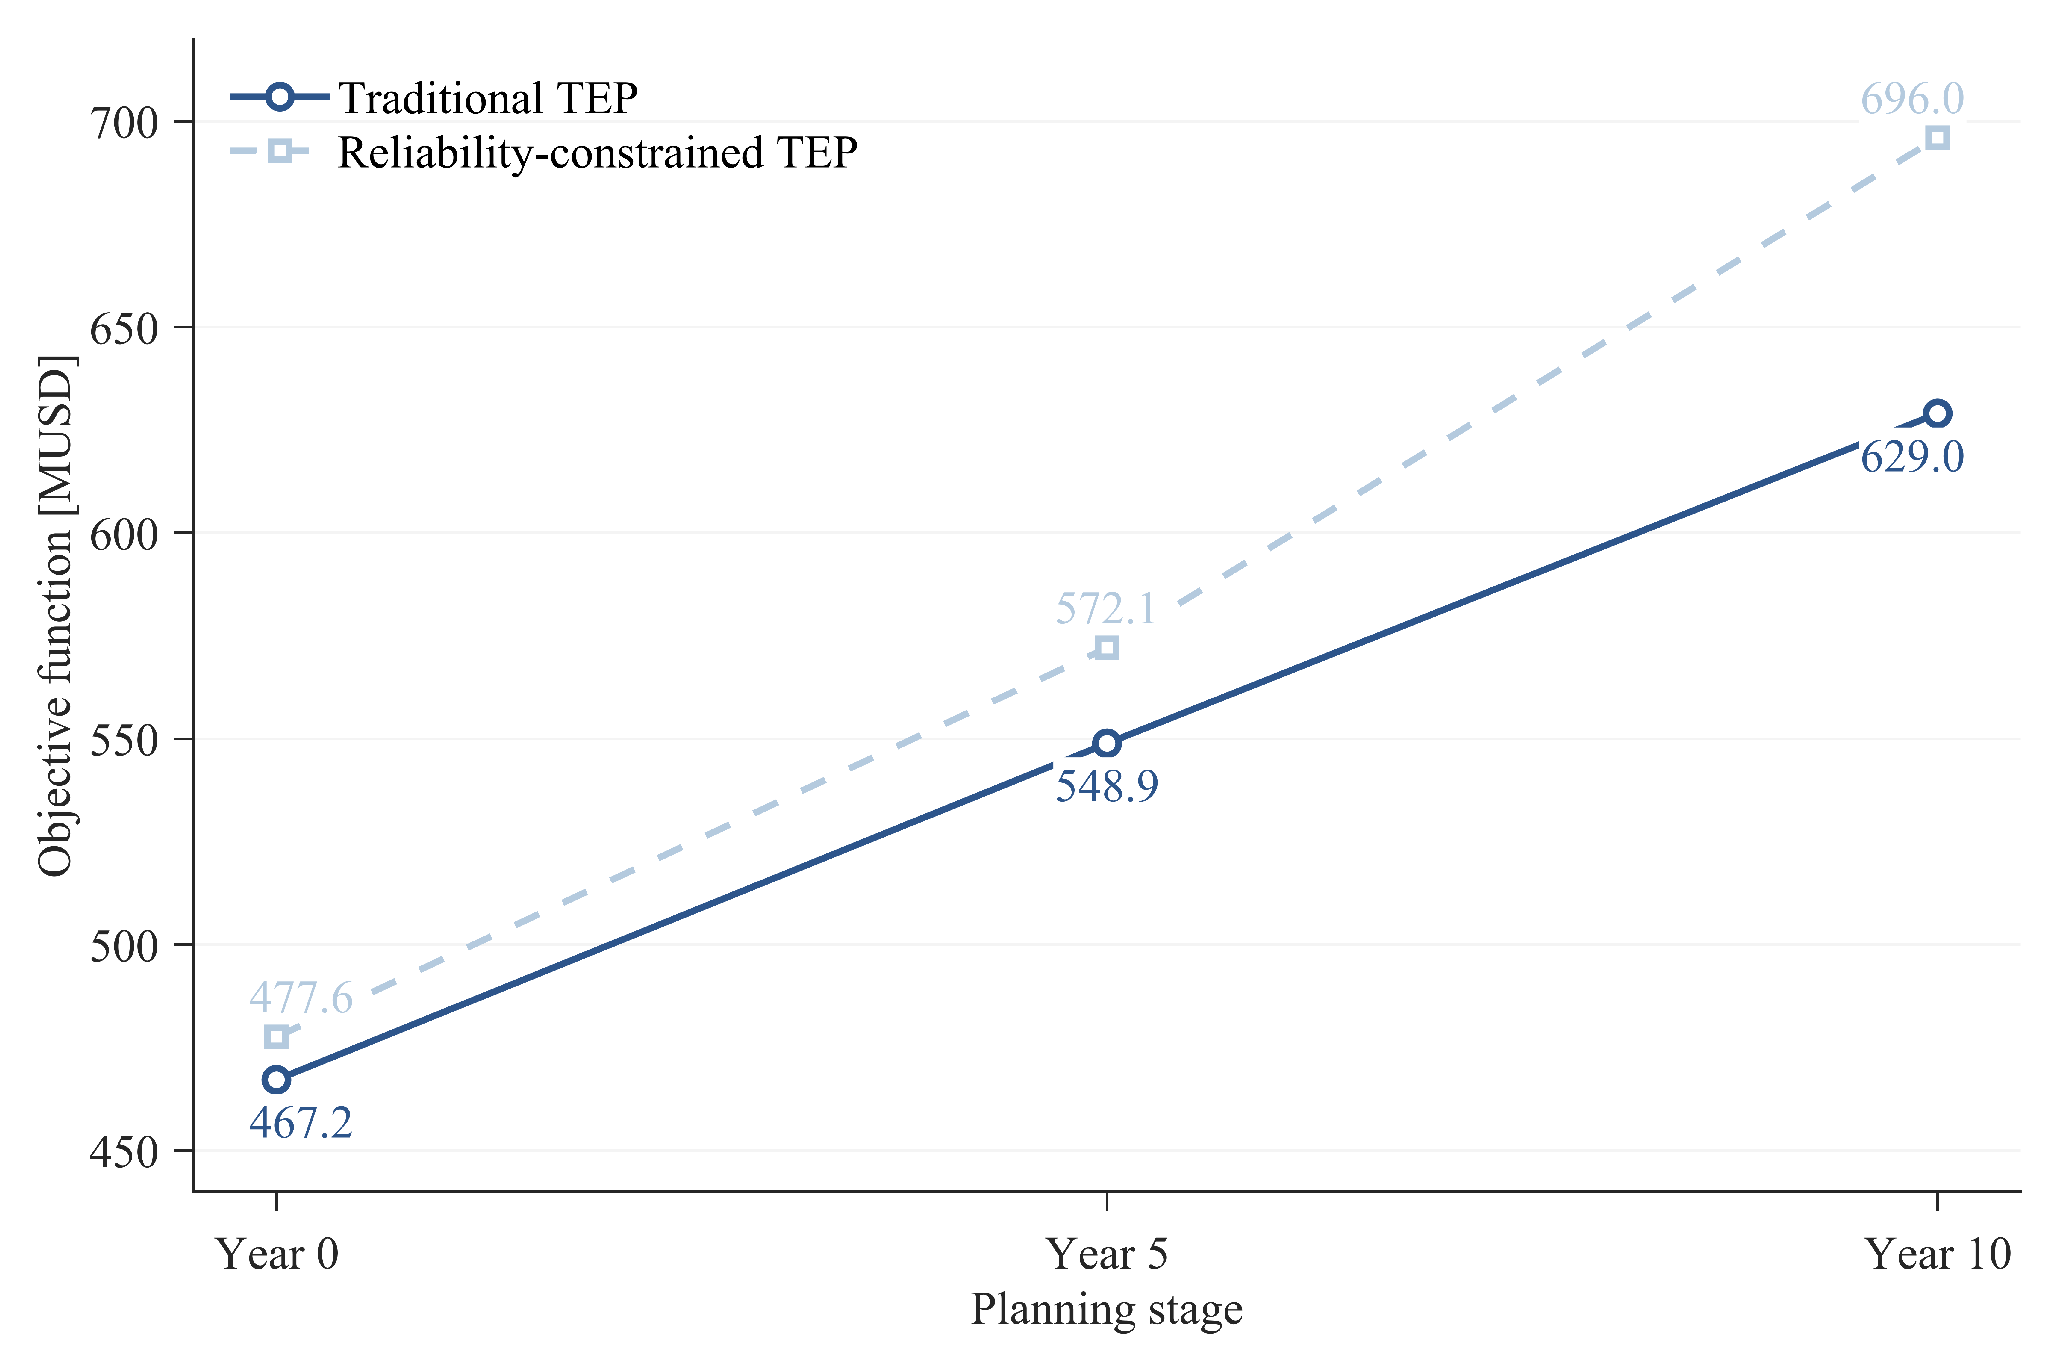

Disclaimer/Publisher’s Note: The statements, opinions and data contained in all publications are solely those of the individual author(s) and contributor(s) and not of MDPI and/or the editor(s). MDPI and/or the editor(s) disclaim responsibility for any injury to people or property resulting from any ideas, methods, instructions or products referred to in the content. |
© 2026 by the authors. Licensee MDPI, Basel, Switzerland. This article is an open access article distributed under the terms and conditions of the Creative Commons Attribution (CC BY) license.