


Abstract
Software aging and the corresponding need for system rejuvenation are well-established concepts in computer science. As virtualization technologies are increasingly adopted within electric power utility infrastructures, early investigation into Software Aging and Rejuvenation (SAR) models, aging indicators, and empirical data collection becomes essential. Given the critical role of the electric power grid and the high dependability requirements of the protection and control systems that support its operation, proactive research in this area is timely and necessary. Motivated by this need, this work proposes a hierarchical framework that integrates an SAR model into the Reliability Block Diagram (RBD) representation of a Digital Substation Automation System (DSAS). The analysis shows that, for the selected parameter set, incorporating SAR into the VPAC reliability model results in higher estimated failure rates and increased annual downtime relative to hardware-only models. When combined with substation primary system indices, however, the overall reliability indices remain largely unchanged, aside from reduced outage duration attributed to improved switching performance enabled by the DSAS architecture. Further examination reveals that the limited influence of SAR is primarily due to the lack of historical failure-mode data for the secondary system. Availability of such empirical data is expected to significantly affect combined reliability indices and improve the accuracy of reliability evaluations. This highlights the importance of systematic data collection and aging-indicator analysis as utility infrastructures transition toward virtualized and software-dependent architectures.
1. Introduction
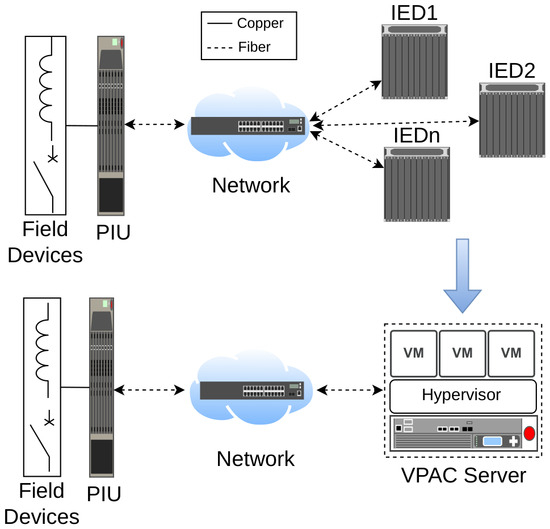
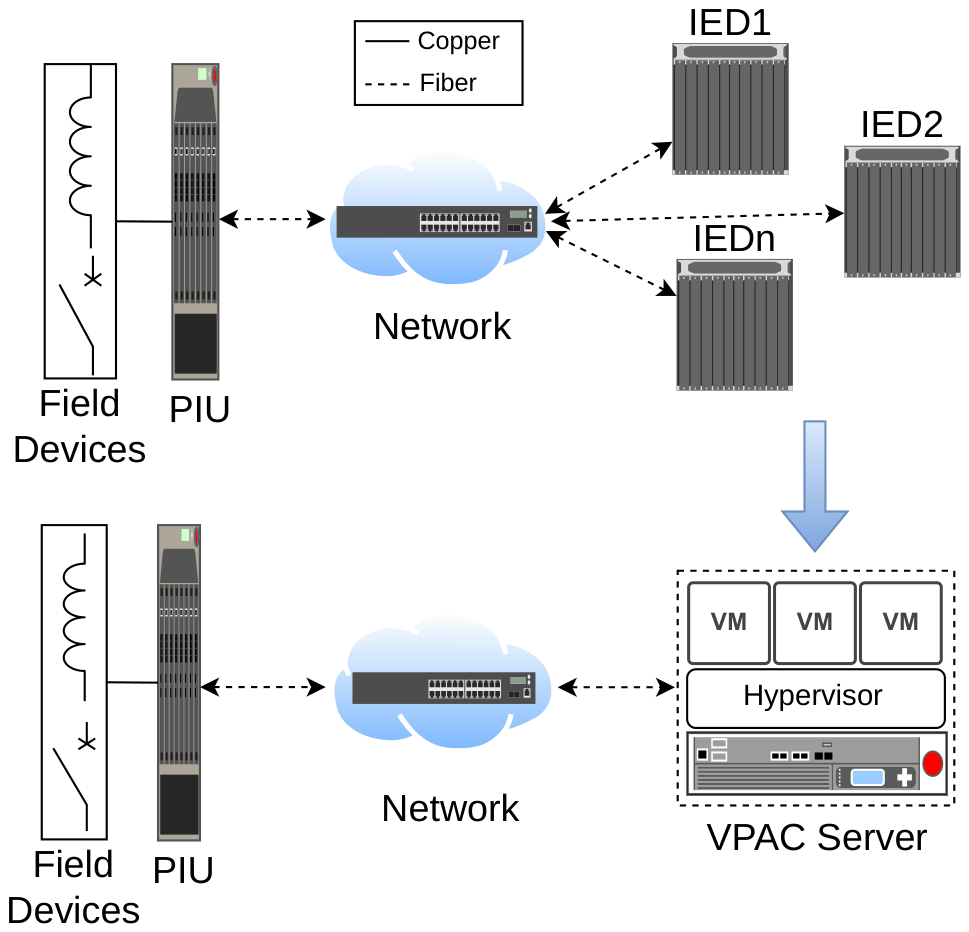
The power grid is undergoing a significant transformation toward a smart grid paradigm. Since substations are critical and vital nodes in a grid infrastructure where all the protection, control, and monitoring functions in a smart grid are predominantly executed, achieving overall grid reliability therefore fundamentally depends on the reliability of these substations. As the transition toward a net-zero energy system accelerates, digital substations (DSs), serving as critical nodes within this evolving infrastructure, are advancing to leverage modern developments in communication and computing technologies [1]. The secondary system of a digital substation consists of a Substation Automation System (SAS) and a Protection, Automation, and Control (PAC) system. The SAS typically manages higher-level functions within the substation, including communication with Supervisory Control and Data Acquisition (SCADA) systems, interfacing with the Human Machine Interface (HMI), and handling alarms. In contrast, the PAC system mainly provides protection for primary assets as well as real-time control and monitoring at the lower level. This complete secondary system in an automated substation is oftentimes referred to as DSAS in the literature. PAC functions, which were mainly distributed in the beginning (i.e., different Bay Control Units (BCUs) and Protection IEDs in a substation) [2], are transitioning towards a centralized and virtualized PAC system; see Figure 1. The transformation borrowed from the enabling technology of virtualization from the field of computer science has proved to be promising as a result of early performance investigations [3]. Traditionally, physical PAC devices comprised tightly integrated hardware and software layers, each designed and optimized for a specific set of protection and control functions. Because these devices were delivered as purpose-built units, their performance characteristics were predetermined and guaranteed by the manufacturer. With the introduction of virtualization, these layers are now decoupled, enabling the hardware platform to be selected independently of the PAC application. In this model, the vendor provides the PAC functionality as software, while utilities can deploy it on robust hardware computing platforms that meet their operational requirements and can be adapted as the grid evolves. This architectural separation offers utilities significant flexibility, as it allows them to mix and match components from different suppliers to construct a solution tailored to their needs. However, this increased freedom also introduces a critical challenge: ensuring that the independently sourced hardware and software components operate seamlessly and reliably together, an essential requirement given the stringent dependability expectations of power system infrastructure.
Figure 1.
Digital substation transition from distributed IEDs to centralized VPAC architecture.
Aging of the software layer in the virtualized architecture poses a critical performance [4] and reliability challenge for long-running systems, where prolonged execution leads to gradual performance degradation and increased failure likelihood. This degradation typically results from aging-related bugs that accumulate over time through mechanisms such as memory leaks, resource exhaustion, and corrupted internal states. These effects progress along the fault--error--failure chain and are often reflected in observable indicators, including rising resource consumption and reduced responsiveness [5]. To counter these effects, software rejuvenation provides a proactive recovery strategy that restores system health through controlled restarts or state refresh operations [6]. Rather than removing underlying defects, rejuvenation aims to release consumed resources and reset deteriorated system states, thereby postponing failures associated with cumulative errors. This technique is especially effective in continuously operating environments where planned rejuvenation can prevent unscheduled outages. Its effectiveness depends on determining an appropriate rejuvenation schedule that balances system availability with maintenance overhead, making timing decisions a central challenge [7]. Considering the pivotal role of dependability and performance aspects during the design and operation stages of the system life cycle, an exploration of model choices and system failure mechanisms during the pilot deployment stage [8] can build confidence prior to real-world deployments.
To the author’s knowledge, no work exists to date that addresses the Software Aging and Rejuvenation (SAR) model aspect and its impact on substation reliability indices; this may be due to the infancy of virtualization technology in digital substations. The phenomenon, however, is well understood and have been the topic of research in the field of computer science. Owing to this fact, we present here some important work of SAR pertinent to virtualization technology in the field of computer science. This background serves both as a relevant literature review and a brief introduction to the field for power system researchers.
In virtualized environments, software aging appears as performance degradation and resource exhaustion, exacerbated by the additional abstraction layers of virtualization. Aging analysis seeks to estimate the likely time to failure caused by these effects and enable timely rejuvenation [9]. Existing techniques fall into three main categories: model-based, measurement-based, and hybrid approaches [7]. Model-based techniques use analytical and stochastic models to derive optimal rejuvenation schedules. Common formalism examples include continuous time Markov process (CTMP) [10,11], semi-Markov process (SMP) [12,13,14], Markov regenerative process (MRGP) [15,16], Markov decision process (MDP) [17] and Petri-net-based models such as stochastic Petri-net (SPN) [18,19] and stochastic reward net (SRN) [20,21], applied across configurations involving single or multiple hosts and various Virtual Machine (VM) states (cold, warm, migrated, failover). These approaches enable systematic evaluation of alternative rejuvenation policies but often rely on simplifying assumptions that reduce accuracy in dynamic virtualized environments [7]. Measurement-based approaches rely on observable aging indicators at both the Virtual Machine Monitor (VMM) and VM layers. System-level metrics capture CPU, memory, storage, and network usage, while VM-level indicators include latency, throughput, and Service Level Agreement (SLA) compliance. Collected data can be analyzed using time-series forecasting [22,23,24], machine learning [25,26], or threshold-based methods [27,28], with dimensionality reduction or feature selection applied when indicators are correlated [29]. Although effective in revealing unanticipated aging patterns, these methods require extensive monitoring effort and often lack generalizability across systems. Hybrid strategies combine the strengths of both approaches by parameterizing analytical models with empirical data, thereby improving model fidelity and adaptability to real workloads [30,31,32]. Rejuvenation mechanisms operate at multiple layers of the virtualization stack [33,34]. At the VM layer, techniques include cold-VM restarts and failover [27]. At the VMM layer, options include cold- and warm-VM rejuvenation [35,36], suspend/resume or quick reboot [37], various VM migration [38] strategies (stop-and-copy, pre-copy, return-back, stay-on), and micro-reboots [39] of virtual infrastructure components. However, virtualization can introduce additional aging challenges, such as increased memory fragmentation, that accelerate degradation and complicate rejuvenation planning [40]. In recent years, machine learning (ML) techniques have been widely adopted to detect software aging patterns and to determine optimal rejuvenation strategies, with the goal of minimizing system downtime [41,42,43,44]. Given the diversity and operational trade-offs among these techniques and the nonexistence of mission-critical virtualized PAC systems in utility infrastructures, it is quite a challenge to propose a standard model at this stage. This challenge is further exacerbated due to unavailability of field data, lack of standardization at VMM or hypervisor and application level, and technology choices at the server hardware and network layer levels. This leaves the choice of model and analysis methodology selection completely open for VPAC-based DSAS. Therefore, there exist three challenges to the reliability or availability modeling of VPAC-based DSAS: SAR model choice, unavailability of data to populate the model, and integrating the SAR model into the secondary system or DSAS and deriving the overall reliability indices at substation level. This work addresses the third challenge while the other two challenges remain largely open. This work is thus deemed to be of an exploratory nature, with regard to SAR model, an impetus to draw electrical power system researchers’ attention to explore the modeling possibilities and further investigation in this emerging area. The work contributes by:
- extending a SAR model from existing literature and incorporating that into the availability model of a DSAS using a hierarchical modeling framework, and
- analyzing and evaluating the reliability indices of the primary and secondary systems of the substation and later deriving the combined substation indices.
The paper is organized as follows: Section 2 presents the primary system and secondary architecture chosen for the study and proposed modeling methodology. Section 3 presents, analysis of primary and secondary systems along with combined system evaluation model. Reliability indices of primary, secondary and combined system are derived with discussion in Section 4. Finally, the paper concludes with Section 5.
2. System Modeling and Methodology
2.1. Primary and Secondary Systems for Study
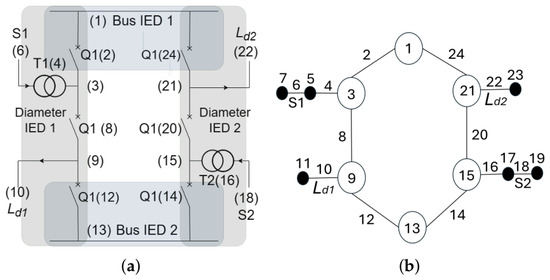
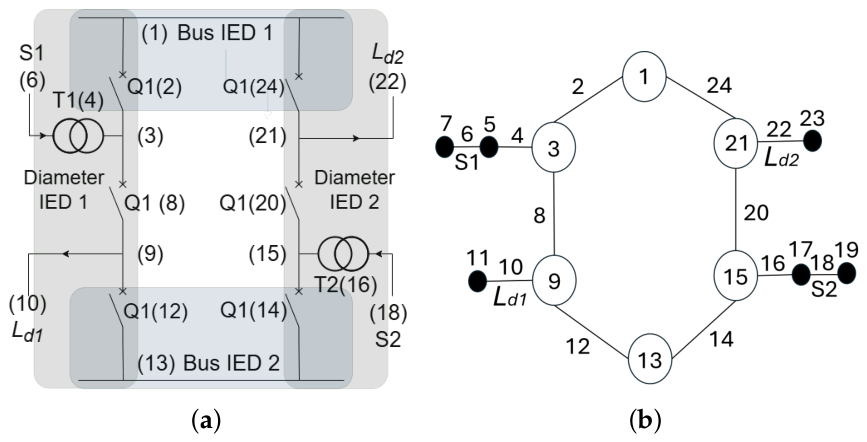
The primary system of a digital substation considered in this study is a breaker-and-a-half substation configuration, widely regarded as one of the most dependable high-voltage substation layouts [45]. The selected topology is partitioned into four protection zones, two bus zones and two diameter zones, as illustrated in Figure 2. All protection and control functions associated with these zones are hosted on a centralized virtualized VPAC system. These protection zones are not fixed and may be adapted according to the underlying protection philosophy.
Figure 2.
(a) CB-and-half scheme with protection zones and (b) corresponding graph [46].
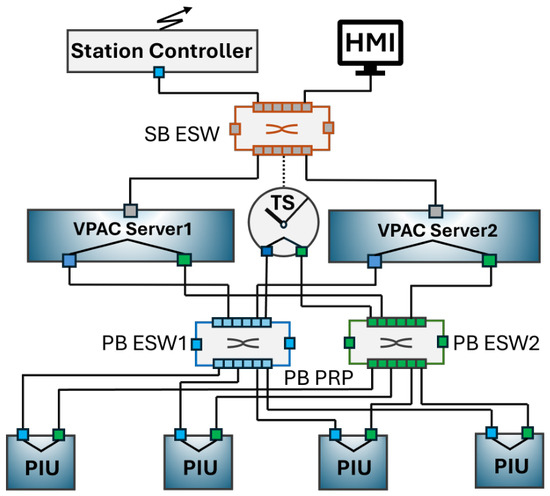
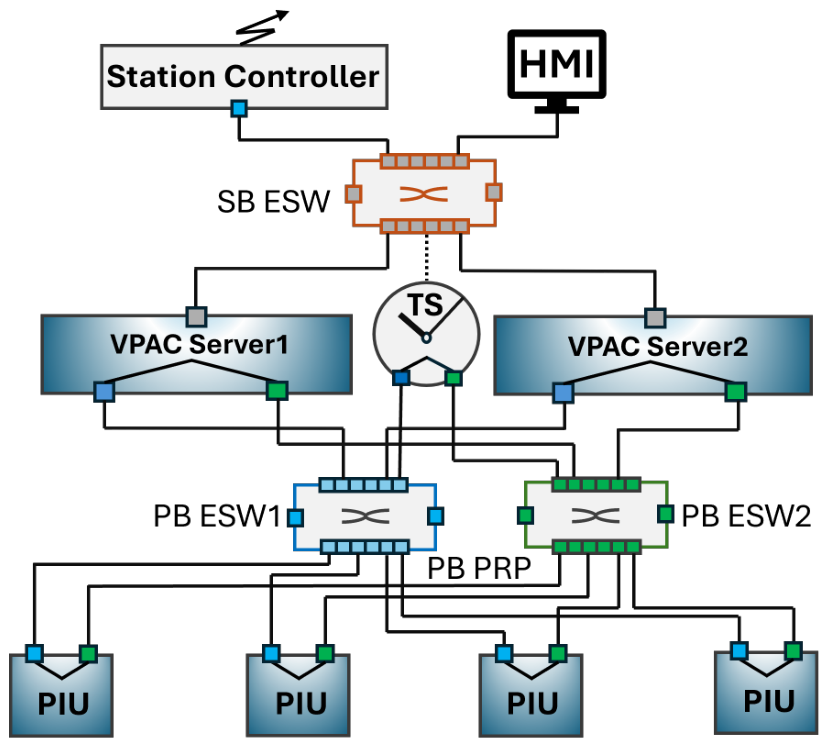
The secondary system architecture comprises two redundant VPAC servers interconnected through the Parallel Redundancy Protocol (PRP), an established standard for high-availability industrial communication [47,48,49]. The architecture and corresponding Reliability Block Diagram (RBD) are presented in Figure 3 and Figure 4, respectively. The RBD considers a single Power Supply (PS), a Time Source (TS), two VPAC servers, and four Process Interface Units (PIUs), with the Process Bus (PB) modeled as the PRP communication backbone. For the configuration shown in Figure 2, each VPAC server provides the complete substation protection, control, and monitoring functionality. Traditionally, these functions were implemented by multiple individual IEDs; therefore, deploying redundant VPAC servers significantly enhances the availability of these critical functions. Notably, commercial VPAC platforms are capable of managing protection and control functionalities for well over 100 bays within a single application. The PIUs provide the interface to the primary equipment by acquiring current, voltage, and binary status signals and by issuing control commands to circuit breakers and disconnectors. Both the PS and TS are required for the system to remain operational; the TS is essential for synchronized sampling, particularly for differential protection, and for maintaining consistent event timestamps across the substation. An n-out-of-n logic scheme is adopted for the PIUs. This choice reflects the requirements of certain fault conditions and control actions, where a number of GOOSE message exchanges may be necessary to convey tripping, status, and interlocking information at both the process and station bus levels. Typical examples include breaker failure protection and busbar fault scenarios, which involve coordinated signaling among multiple devices and thus require the availability of all the devices involved. The VPAC servers form the core of both the PB and station bus (SB) communication networks, enabling full remote control and monitoring capabilities as expected in a fully digital substation.
Figure 3.
Redundant VPAC-based PRP architecture.
Figure 4.
RBD of the VPAC-based redundant PRP architecture.
The availability of a system with n components in series is given by
while the availability of two components in parallel is
For a configuration requiring k out of n components to be operational, the availability is expressed as
The steady-state availability of a component having a failure and repair rate is defined as
where typically .
2.2. Proposed Methodology for Availability Modeling of VPAC-Based DSAS
2.2.1. Hierarchical Reliability Modeling of DSAS
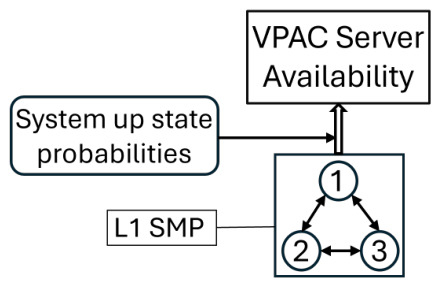
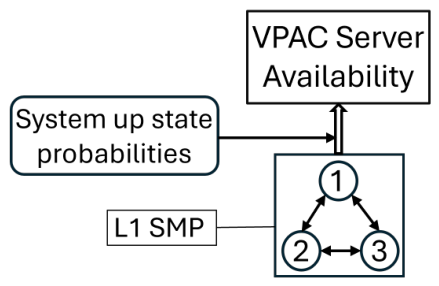
Although RBDs offer an efficient means of computing reliability indices, they are limited in their ability to represent complex system states and the dynamic interactions between hardware and software components. More expressive formalisms, such as Markov chains, Petri nets or Bayesian networks, are often used for such purposes. In this work, we employ Markov chains to capture the dynamics of SAR, owing to their closed-form steady-state solutions, memoryless property aligned with exponential failure and repair assumptions, and computational efficiency resulting from small, fixed-size transition matrices [50]. Model decomposition technique is used to manage system complexity and to integrate heterogeneous modeling approaches. Under this paradigm, a system is partitioned into subsystems whose outputs become inputs to higher-level models, forming a hierarchical structure that can be solved sequentially [50]. The VPAC-based DSAS adopts such a hierarchical modeling framework by embedding an SAR model within the RBD architecture shown in Figure 4. In this hierarchy, the availability of VPAC Servers 1 and 2 is received through a lower-level SMP model (L1-SMP). The limiting up state probabilities represent steady-state availability, as illustrated in Figure 5. The resulting VPAC subsystem, comprising two servers in parallel, can then be evaluated using (2). This hierarchical approach preserves the analytical simplicity of RBDs while enabling the SMP layer to capture system interactions and SAR-related dynamics, thereby encapsulating model complexity without compromising computational tractability.
Figure 5.
Hierarchical RBD Block with SMP.
2.2.2. Software Aging and Rejuvenation (SAR) Modeling
Software Rejuvenation Policy
Software rejuvenation in a VPAC-based virtualized system may be carried out as either a partial or full rejuvenation procedure. Partial rejuvenation refers to refreshing a specific VM hosted on the hypervisor. This process is comparatively fast and can mitigate performance degradation of the targeted VM without affecting co-located VMs or applications; however, it does not fully restore the VM to its most robust operational state. Full rejuvenation involves restarting the hypervisor (Type-1), including the underlying operating system and VMM. This proactive maintenance action halts all applications, optionally preserves selected VM/VMM states, and reinitializes the hypervisor to release all accumulated resource burdens. If resource exhaustion occurs before any rejuvenation action can be initiated, the system transitions into a crash state. Recovery then requires either an automatic post-crash reboot or manual intervention, both of which return the system to a fully restored state. The aging and rejuvenation dynamics are modeled using an extended version of the two-level SMP proposed in [50,51], shown in Figure 6, with an additional eighth state (F). A summary of the state definitions is provided below.
- State U (UP): The most robust and fully available state. The system returns to this state after full rejuvenation, a crash recovery, or hardware repair.
- State M (Medium-efficient): An available but moderately degraded state. The system enters this state from U due to performance decline or after completing partial rejuvenation.
- State L (Low-efficient): The least robust available state. Severe degradation triggers an alert, prompting a rejuvenation decision before the system transitions to a crash.
- State D (Decision): An instantaneous state where the system selects either partial (level-1) or full (level-2) rejuvenation. Its sojourn time is negligible.
- State P (Partial rejuvenation): The system executes level-1 rejuvenation.
- State R (Full rejuvenation): The system executes level-2 rejuvenation.
- State B (Reboot): Represents the crash-recovery process. The system reaches this state when degradation becomes critical, requiring a reboot to restore state U.
- State F (Server Failure): A hardware failure state that can be entered from any available state. All hardware-related failures of the server hosting the hypervisor, VPAC application, or other associated applications are aggregated here, whereas software aging dynamics are represented in the remaining states.
Figure 6.
SMP model for software rejuvenation, including server hardware.
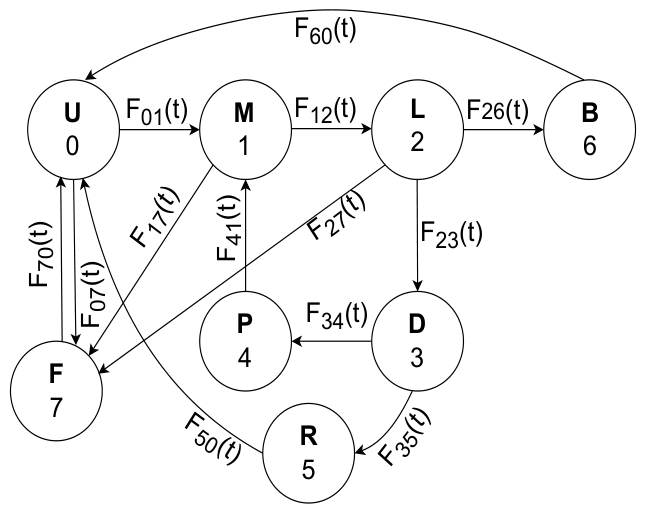
From a VPAC performance perspective, all states within the available set (U, M, L) are considered acceptable as long as the system continues to meet the most stringent protection performance requirements.
L1 SMP Modeling
To derive the availability of a VPAC server from the underlying SMP, only the steady-state solution of the SMP in Figure 6 is required. The analysis follows a two-step procedure in which the SMP is fully characterized by its kernel matrix [52,53]:
The kernel elements are defined as
Here, denotes the transition cumulative distribution function (CDF), while is its complementary form. The allowable transition set is
- Step 1. Embedded DTMC: The one-step transition probability matrix of the embedded Markov chain is:
The limiting state probabilities v of this embedded discrete time Markov chain (DTMC) are obtained from
- Step 2. SMP Steady-State Probabilities: The SMP steady-state probabilities are computed using the limiting state probabilities and the mean sojourn times :
The mean sojourn times for the SMP in Figure 6 are
Finally, VPAC availability is defined as the probability of the system residing in any of the three acceptable operational states (U, M, L), which correspond to States 0, 1, and 2:
3. Primary and Secondary System Analysis
3.1. Secondary System Architectures Analysis
The modeling methodology described in Section 2 is applied to the secondary system architecture shown in Figure 3, with the corresponding reliability parameters summarized in Table 1.
Table 1.
Failure rates and repair times of components [46].
Choice of Model Parameters
The objective of this work is to demonstrate how the SAR model can be integrated into the DSAS architectural reliability analysis. Accordingly, in the absence of any field data from utility, the parameter selection is solely based on reasonable assumptions rather than site-specific measurements.
State 0 represents the most robust operating condition, from which the system initiates operation after deployment or a full refresh. As utility DSAS environments are highly constrained, where system access and software updates occur infrequently, an exponential distribution with an assumed mean time to failure (MTTF) of one year is assigned, i.e., f/yr. This transition models the effect of updates or patches applied to the VPAC-VM, the VMM, or the host OS. The transition to State 1 reflects a moderate degradation phase and is assigned an increased failure rate f/yr. State 2 captures the more pronounced degradation phase and is modeled using a Weibull distribution with increasing failure rate (IFR) parameters , representing the accelerating impact of aging-related faults. State 3 is the decision state, in which the system is taken offline to select either level-1 or level-2 rejuvenation. This transition is modeled using a deterministic function , where r represents the scheduled rejuvenation time, consistent with maintenance policy or available downtime opportunities. Partial (level-1) and full (level-2) rejuvenation actions occur in States 4 and 5, respectively. These procedures can be executed remotely without physical site access, and are assigned fixed durations of h and h. In contrast, the crash recovery State 6 may require dispatching maintenance personnel, including logistics time; thus, a fixed duration of h is assumed.
Finally, State 7 models hardware failure of the server hosting the hypervisor, VPAC applications, or associated services. Hardware failure rates are typically provided by the manufacturer as MTTF values and are commonly represented using exponential distributions.
3.2. Primary System Analysis
Well-established analytical techniques exist for evaluating the reliability of primary substation busbar schemes. Among these, the minimal cut set method is widely applied and computationally efficient [54,55]. To automate this process, the procedure begins by assigning identifiers to all primary equipment in the bus scheme and constructing a Proposed Connection Matrix (PCM), derived from the topology illustrated in Figure 2. The PCM, together with the reliability parameters of the primary components, forms the complete input to the analysis program, which then automatically generates the minimal cut sets associated with loads and . Detailed descriptions of the minimal cut-set algorithm can be found in [56,57]. In this work, the following cut sets up to the second order are considered:
- First-Order Total Minimal Cut Sets (FOTMC),
- Second-Order Total Minimal Cut Sets (SOTMC),
- First-Order Active Minimal Cut Sets (FOAMC),
- Second-Order Minimal Cut Sets with Active + Total Failures (SOMCAT),
- Second-Order Minimal Cut Sets with Active + Active Failures (SOMCAA),
- First-Order Failure Events with Stuck Breaker (FOFES),
- Second-Order Failure Events with Stuck Breaker (SOFES).
These categories reflect different combinations of total failures, active failures, and switching-related events such as stuck breakers.
Analytical Method for Primary System
The analytical expressions used to compute the equivalent failure rate and repair rate r for each minimal cut set are summarized below. These expressions form the basis for the analytical results presented in Section 4.
- 1.
- FOTMC
- 2.
- SOTMC
- 3.
- FOAMC
- 4.
- SOMCAT
- 5.
- SOMCAA
- 6.
- FOFES
- 7.
- SOFES
Here, denotes the probability of a stuck breaker; , , , and represent total and active failure rates of the involved components; and , , , denote their corresponding repair and switching times. The reliability data listed in Table 2 for all primary components are taken from [57] with some modifications in the line and transformer data. A MATLAB (r2023b) implementation automated the entire process, generating minimal cut sets directly from the reliability dataset and the PCM matrix. Additional busbar configurations were also evaluated as test cases to validate the correctness and robustness of the developed tool.
Table 2.
Primary Equipment Reliability Data.
3.3. Evaluation of Combined Reliability Indices
Finally, the reliability contributions of the primary and secondary system models are integrated using the following relations. The overall system failure rate is obtained by summing the failure rates of all relevant minimal cut sets:
The system unavailability U is determined by combining the repair characteristics of the first and second order minimal cut sets with the availability of the secondary system architecture:
where and correspond to the failure and repair parameters of the minimal cut sets defined in (10)–(16). Here, and denote the unavailability and availability of the DSAS, respectively. Additionally, and represent the repair times associated with the FOTMC and SOTMC groups defined in (10) and (11), while represents the switching time attributable to the DSAS. The overall outage duration is then computed directly using:
which yields the complete reliability indices of integrated system.
4. Case Study for Combined System Reliability Indices
The reliability indices model for the individual primary, secondary and combined systems are presented in Section 3. The SAR models introduced in Section 2.2.2 enable the computation of the health and reliability attributes of the VPAC-based server through different software and hardware states. Correspondingly, the primary system failure modes are represented through the minimal cut sets summarized in Table 3.
Table 3.
Minimal cut sets of based on Figure 2.
All minimal cut sets obtained for load are presented in Table 3. Suffixes “A” and “S” denote conditions involving active failures and stuck breakers, respectively. To evaluate the overall system reliability, the primary and secondary models are integrated to determine the combined reliability indices for each load point. Either of the two load points or may be considered, as the methodology applies identically to both. The combined analysis focuses on quantifying:
- The failure rate of each load point, reflecting the contribution of both primary equipment failures and secondary system outages; and
- The interruption duration, determined by the combined repair and switching characteristics of the two subsystems.
An analytical framework is employed to evaluate these combined indices, enabling systematic incorporation of the failure modes and architectural characteristics of both the primary and secondary systems depicted in Figure 3.
4.1. Primary System Reliability Indices
The reliability indices associated with each minimal cut set, along with their aggregated contributions, are presented in Table 4. As expected, the results indicate that first-order cut sets dominate both the overall failure rate and the annual downtime of the primary system. These cut sets represent single-component failures that have a direct and immediate impact on load-point reliability, and thus constitute the primary contributors to system risk.
Table 4.
Reliability Indices of Breaker-and-half Scheme.
In the second stage of the analysis, the RBD models of the secondary system architecture shown in Figure 4 were evaluated using the equations introduced in Section 2. The architectural logic and corresponding availability expressions were implemented in MATLAB to compute the reliability indices of DSAS.
4.2. Secondary System Reliability Indices
The reliability indices for the VPAC-based DSAS architecture in Figure 3, computed with and without incorporating the SAR model, are summarized in Table 5. VPAC without SAR is selected as the baseline case in Table 5, and the percentage variation for the alternative architecture (VPAC with SAR), relative to this baseline, is provided alongside the corresponding computed values. The baseline case, which excludes SAR, considers only the hardware failure rate of the VPAC server irrespective of the failure modes associated with the software executed on the platform, reflecting the conventional assumption. Under the selected model parameters, this omission does not significantly influence the overall DSAS availability. However, when the SAR model is integrated, both the failure rate and annual downtime increase, capturing the impact of software aging processes.
Table 5.
Reliability Indices of VPAC-based DSAS (values in square brackets show percent increase or decrease in indices from VPAC without SAR model).
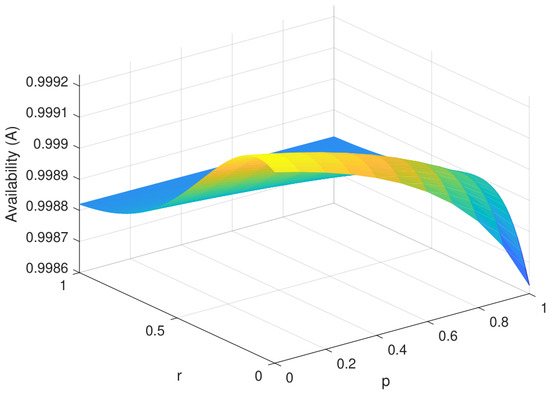
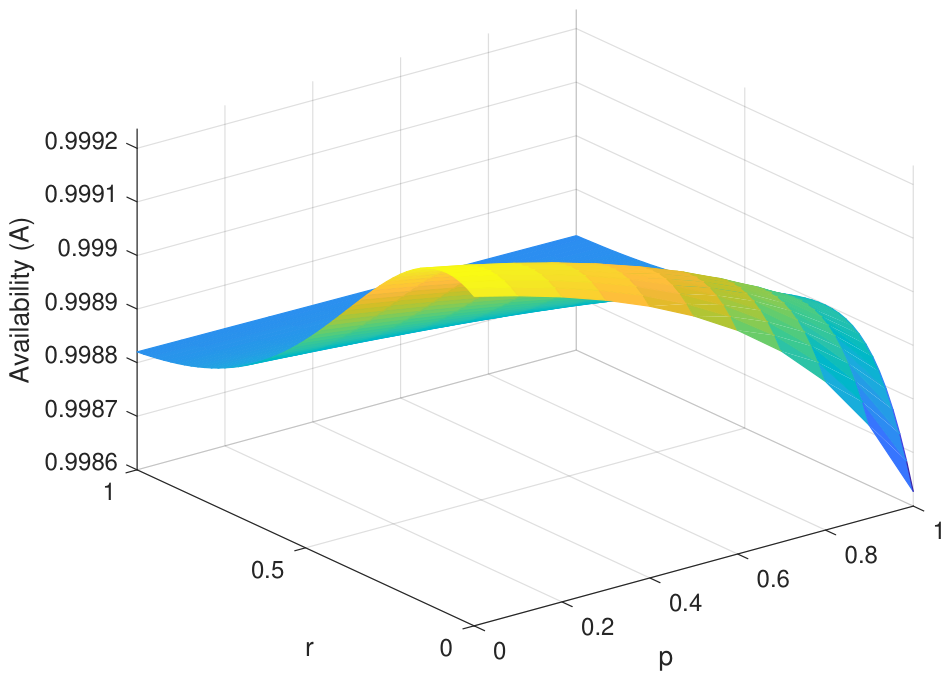
The resulting availability of the VPAC server, computed using (9) from the steady-state solution of the SMP in Figure 6, is illustrated in the 3D surface plot in Figure 7. The rejuvenation interval r is expressed in years, and the maximum availability occurs at yr and , corresponding to a full rejuvenation strategy. This maximum or optimum availability value, for given parameters, can be obtained analytically or numerically, as explained in [51]. The values of indices for VPAC-based SAR architecture in Table 5 are listed for the maximum availability value occurred in Figure 7.
Figure 7.
Three-dimensional plot of availability of SAR model for VPAC server.
These secondary system indices can then be combined with the primary system results from Table 4 using (17) –(19) from Section 3.3 to derive the final reliability indices for each load point.
4.3. Combined System Reliability Indices
For the combine system analysis, the analytical method introduced in Section 3.3 is adopted. The combined indices values presented in Table 6 are identical for the system with and without SAR model. This is examined further in the following sections.
Table 6.
Reliability Indices of CB-and-half Scheme with and without SAR Model.
4.3.1. Decrease in Annual Downtime Achieved Through DSAS
The indices in Table 4 were obtained assuming a manual switching time of h for restoring supply to load point in the absence of a DSAS. When a DSAS is available, this time is reduced to h in Table 6, owing to automatic, pre-defined switching sequences. However, during periods when the DSAS itself is unavailable, the switching time reverts to the manual value of 1 h. The improvement in the annual downtime occurred mainly due to the reclosing and partly due to the automatic switching sequence of DSAS in case of supply or source changeover or transfer. Additionally, it is assumed that approximately two-thirds of feeder faults are transient in nature [58], enabling rapid isolation and restoration through reclosing operations or protection actions; availability of these functions or actions, in turn, depends on the availability of the DSAS. The capability of the DSAS to automatically isolate feeder faults and to initiate swift switching actions significantly decreases both annual downtime and outage duration in the combined system results in Table 6 relative to the aggregated primary-system indices in Table 4. This demonstrates a clear operational advantage offered by the DSAS architecture. It is, however, to be noted that the failure rate value for the combined indices in Table 6 is identical to the aggregate primary system failure rate value in Table 4. This is discussed further in the next section.
4.3.2. Influence of DSAS Failure Modes
A comparison of the results in Table 6 with those in Table 4 shows that the overall failure rate remains unchanged. Moreover, no difference exists between combined indices with or without SAR architectures; see Table 6. This outcome follows directly from the evaluation methodology, which is based primarily on the failure modes of the primary system. Under the assumptions of this study, a failure within the secondary system does not directly interrupt supply to the load point and therefore does not alter the failure rate of the combined system which might be unrealistic.
Table 7 investigates this assumption further, where the “base case” refers to the architecture results obtained using the analytical method summarized in Table 6. The percentage variation in indices for other failure modes, relative to the base-case values, is also presented alongside the corresponding calculated values in Table 7. The result demonstrates how specific failure modes within a DSAS architecture can influence the reliability indices of load . For example, failure of the PS of a critical device such as a VPAC server or a PIU responsible for the protection and control of may force the primary system into a fail-safe state until the faulty component is repaired. This behavior reflects the operational philosophy commonly adopted by utilities, whereby failures in the secondary system result in either the shutdown of the primary system or a disruption of service at the affected load point, thereby contributing to increased interruption duration. Such an approach is justified, as partial or complete unavailability of the protection and control system may lead to unsafe operating conditions in the primary system; in the event of a fault, the resulting consequences could be severe.
Table 7.
Impact of incorporating various failure modes into the VPAC architecture on , in comparison with the results presented in Table 6-(Values in square brackets show percent increase or decrease in indices from Base case).
Table 8 introduces some other hypothetical failure modes pertinent to a VPAC server and shows how they influence the primary-side downtime. For clarity, only one failure mode is incorporated per row to highlight its isolated impact. In practice, however, multiple such failure modes may exist within a system, and their combined effects must be considered to accurately assess overall system reliability. This observation underscores the importance of collecting and analyzing historical reliability data for VPAC-based DSAS architectures. As these systems are almost non-existent in utility environments, empirical data on secondary system failure behavior is unavailable, yet such information is essential for comprehensive reliability modeling and fully capturing the interdependence between primary and secondary system failure modes.
Table 8.
Incorporation of hypothetical failure modes [59] into the VPAC architecture and their influence on , in comparison with the results presented in Table 6.
4.4. Sensitivity Analysis
This section presents the sensitivity of availability of DSAS with the variation of failure rate of each component in Table 1 and when each one of the DSAS components is made ideal. It should be noted that the availability variation of the VPAC server block in Figure 4 is derived from the solution of the L1 SMP shown in Figure 5. The influence of changes in the rejuvenation interval r and rejuvenation probability p on this block has already been analyzed and presented in Figure 7. Therefore, the results discussed in this section focus exclusively on the resulting block level availability as represented within the RBD of Figure 4.
4.4.1. Impact of Ideal Component on Availability
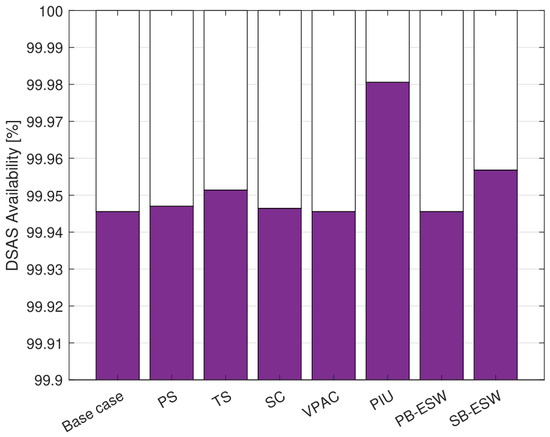
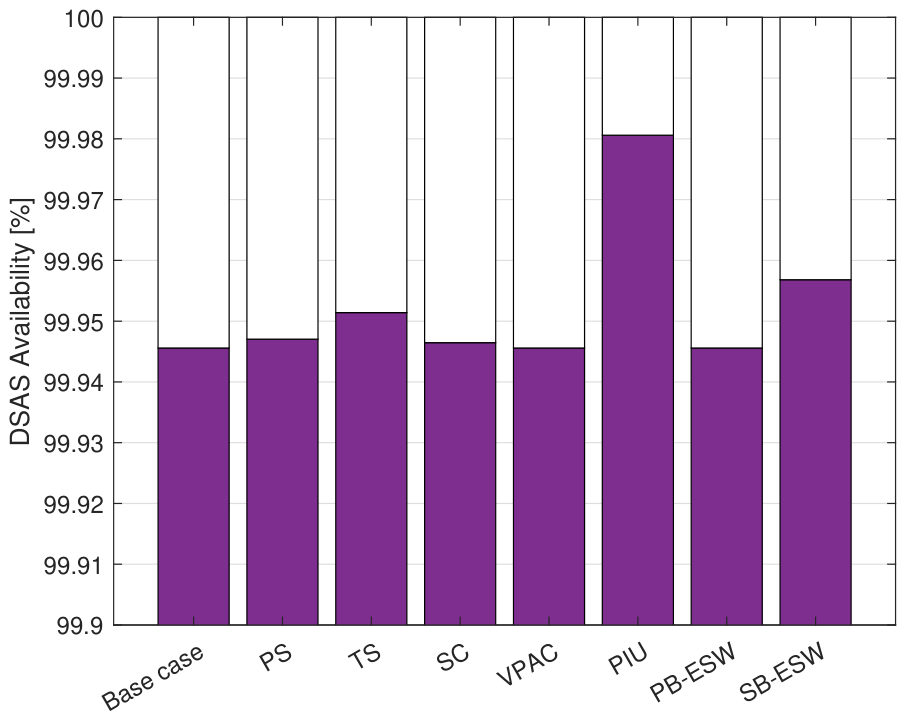
Figure 8 illustrates the sensitivity of the DSAS availability, shown in Figure 4, to variations in the failure rates of secondary system components listed in Table 1. To reflect the practical conditions of remotely located substations, an additional logistical delay of 12 h is incorporated into the repair times of both primary and secondary systems in the analysis presented in Figure 8. For substations located closer to maintenance facilities, this delay would be reduced, leading to a corresponding improvement in secondary system reliability indices.
Figure 8.
Impact of failure rate variation on DSAS availability.
The bar labeled represents the reference scenario, in which nominal failure rates from Table 1 are used without modification. Each subsequent bar corresponds to a hypothetical scenario in which the failure rate of a specific component is set to zero, allowing the contribution of individual components to the overall secondary system availability to be assessed. Among the evaluated components, the PIU exhibits the most pronounced improvement in availability, primarily due to its relatively high failure rate combined with the use of an n-out-of-n logic scheme. In contrast, components such as PS and SC show similar impact, as their failure rates are of low and comparable magnitude. Although VPAC and PB-ESW are associated with higher failure rates, their effect on overall availability remains limited due to the presence of redundancy. Furthermore, the availability gain achieved by idealising the SB-ESW is slightly greater than that observed for the TS, reflecting the difference in their respective failure rate values.
4.4.2. Impact of Failure Rate Variation on Availability
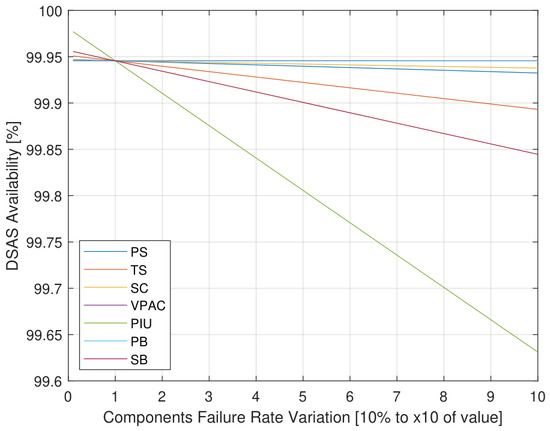
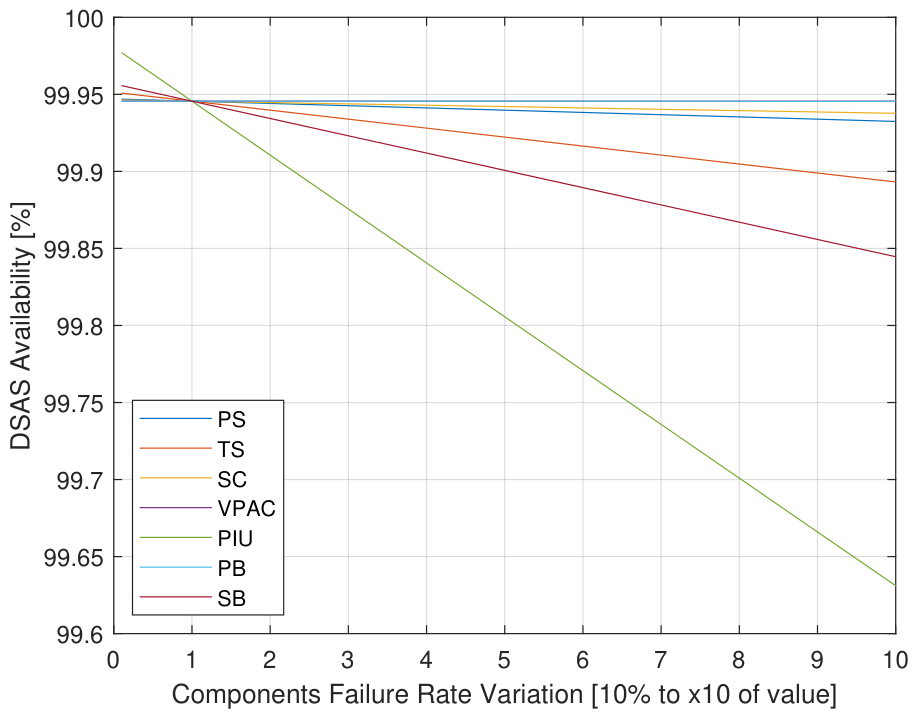
To evaluate the sensitivity of secondary system availability to component reliability assumptions, the failure rates illustrated in Figure 9 are systematically varied over a wide range, from 10% of their nominal values up to an order of magnitude higher than those reported in Table 1. The results presented in Figure 9 are consistent with the trends observed in Figure 8, reinforcing the conclusion that the PIU has the dominant influence on secondary system availability. This is followed, in decreasing order of impact, by the SB-ESW and the TS. In contrast, even substantial changes in the failure rates of the PS and SC result in only marginal variations in overall availability. Although both components are single, they contribute comparable levels of downtime, which can be attributed to their relatively low failure rates, approximately one order of magnitude smaller than those of other elements in the architecture. Similarly, variations in the failure rates of the VPAC and PB-ESW have a limited effect on availability, primarily due to the redundancy mechanisms embedded in the system design. This behavior highlights the inherent fault-tolerant characteristics of the proposed secondary system architecture.
Figure 9.
Impact of component failure rate variation on DSAS availability.
5. Discussion and Suggestion
This section discusses the advantages of the proposed hierarchical framework and challenges of choosing a model to represent SAR and necessary data to use for the model relevant to the digital substation in utility infrastructure.
The hierarchical modeling framework proposed in this work effectively integrates the complex dynamics of Software Aging and Rejuvenation (SAR) into the reliability block diagram (RBD) of the digital substation automation system (DSAS). This approach leverages the structural simplicity of RBDs while selectively incorporating the power of SMP to capture the part of system dynamics and dependencies where higher fidelity is necessary to improve accuracy. The hierarchical approach allows mixed formalism, where upper-level RBD is computationally inexpensive and the SAR model complexity in the context of matrix operations also does not increase the computational burden. This is due to the fact that the dimensions of the L1 SMP matrices stay the same for a VPAC server which represents the SAR core model, and the embedded DTMC and kernel matrix can be solved easily using a general-purpose PC having only seven states. Moreover, this SMP is merely used to demonstrate the use of a framework whose purpose and scope is limited to integrate the SAR model into the DSAS RBD of a substation.
As discussed in the introduction, selecting an appropriate modeling technique for capturing software aging dynamics and determining optimal rejuvenation intervals remains an open challenge. This is largely due to the fact that virtualization of PAC in a digital substation is an emerging technology, currently confined mostly to research environments with very limited pilot deployments and almost no adoption in utility infrastructures so far. State space-based modeling techniques such as Markov-based models provide a powerful means to represent aging behavior with a reasonable degree of accuracy, particularly in the presence of inherent uncertainties. Given that rejuvenation serves as a mitigation mechanism against software aging to reduce system downtime, intervening to improve degraded system performance and reducing the resulting operational costs, the effectiveness of the rejuvenation process is governed by several stochastic variables, including the time to aging, time to failure and recovery, and the duration of rejuvenation actions. Recently, there has been a rise in ML-based techniques to predict the aging trends and finding the optimal rejuvenation time under numerous variables.
In practice, modeling alone is insufficient without the availability of representative operational data to parameterize, validate, and improvement in the model, if needed. Consequently, the literature underscores the need for hybrid approaches to software aging prediction. Such approaches involve identifying meaningful aging indicators or system-level metrics that need to be measured and can reveal degradation trends over time. In newly deployed systems, the candidate metric space may be extensive, necessitating the application of techniques such as classification, feature selection, or dimensionality reduction to extract the most informative indicators. These selected metrics can then be analyzed using statistical or machine learning methods to enable early detection of aging effects. Once relevant indicators are established, a suitable model from the SAR literature can be employed and populated with the obtained data in order to estimate optimal rejuvenation intervals, assess model validity, and improve predictive accuracy.
Finally, the discussion emphasizes the critical importance of systematic data collection and measurement. Determining which data should be collected has already posed challenges for existing digital substations, despite several years of operational experience with the technology in utility infrastructures, as highlighted in [46] and a CIGRE survey [60]. The CIGRE survey, which involved participants from both utilities and vendors, identifies several persistent issues, including ambiguities in the interpretation of Mean Time Between Failure (MTBF) requirements, inconsistencies in reliability calculation approaches, insufficient data to support statistically meaningful analysis, and inadequate segregation of fault data. These challenges are further exacerbated by the near absence of virtualized PAC systems in operational utility grids, making data availability and validation even more limited. Nonetheless, identifying which data sources or performance metrics are most suitable for characterizing software aging in VPAC systems deployed in utility infrastructures remains an open research question. This challenge stems from the fundamental differences in application context and criticality between the operational technology (OT) domain and the information technology (IT) sector, where the majority of existing software aging research has been conducted, and for which no corresponding studies currently exist for utility-grade VPAC systems. Additional unresolved issues include determining appropriate data collection frequencies and selecting the most effective instrumentation layer, such as whether monitoring should be performed at the application or VM layer, at the hypervisor or VMM layer, or both. As an initial step, established methodologies from the IT domain can serve as useful guidance; however, these approaches must be carefully adapted to meet the stringent reliability, determinism, and safety requirements of mission-critical utility systems.
6. Conclusions
This paper presents a hierarchical modeling framework for integrating software aging dynamics into the RBD representation of a VPAC-based DSAS. The primary aim of this work is to stimulate early research into the selection of software aging models, identification of aging indicators, and deployment of appropriate instrumentation within the VMM/hypervisor and potential VPAC applications in utility grid to enable systematic data collection in laboratory environments or pilot installations. Using the selected parameters to populate the SMP model, the developed SAR model reliability indices showed an increase in failure rate and annual downtime compared to the model without SAR, i.e., to only account for server hardware in the model. Combined substation reliability indices with both these models did not show any influence on substation indices except reduction in downtime due to improvement in switching time as a result of DSAS employment. However, subsequent analysis revealed that this can be attributed to the unavailability of historical failure modes data, and availability of such data can impact the overall substation indices more significantly.
The integration of the SAR model into the RBD of DSAS improves the accuracy of DSAS reliability assessment and the resulting substation-level reliability indices. Consequently, system designs that initially fail to meet required reliability targets can be refined and optimized at the design stage. Moreover, continuous monitoring of aging phenomena during system operation enables reduced downtime and more effective maintenance planning. In contrast, reliance solely on conventional RBD-based modeling yields overly conservative reliability estimates, which may lead to unexpected system outages and reduced overall system dependability. Hybrid approaches to software aging prediction, based on selecting informative system-level metrics and leveraging established SAR models, offer an effective means for early aging detection and optimal rejuvenation planning.
Author Contributions
This framework was conceptualized and proposed by R.R.S. The paper is written by R.R.S. and H.K.H. supervised the work and edited the manuscript. All authors have read and agreed to the published version of the manuscript.
Funding
This work was funded by the ProDig—Power System Protection and Control in Digital Substations project, supported by the Research Council of Norway under Project No. 295034.
Institutional Review Board Statement
Not applicable.
Data Availability Statement
The original contributions presented in this study are included in the article.
Acknowledgments
During the preparation of this manuscript/study the author(s) used Microsoft 365 Copilot (Version number: 2.20260514.47.0) for language editing and improvement of academic writing style. All scientific content and interpretations were created and verified by the authors, and authors take fully responsibility for the content of this publication.
Conflicts of Interest
The authors declare no conflicts of interest.
Abbreviations
The following abbreviations are used in this manuscript:
| Failure Rate | |
| Repair Rate | |
| A | Availability |
| DS | Digital Substation |
| DSAS | Digital Substation Automation System |
| DTMC | Discrete Time Markov Chain |
| ESW | Ethernet Switch |
| IED | Integrated Electronic Device |
| MTTF | Mean Time To Failure |
| PAC | Protection Automation and Control |
| PB | Process Bus |
| PIU | Process Interface Unit |
| PRP | Parallel Redundancy Protocol |
| PS | Power Supply |
| RBD | Reliability Block Diagram |
| SAS | Substation Automation System |
| SAR | Software Aging and Rejuvenation |
| SB | Station Bus |
| SC | Station Controller |
| SMP | Semi-Markov Process |
| TS | Time Source |
| U | Unavailability |
| VM | Virtual Machine |
| VMM | Virtual Machine Monitor |
References
- IEC Standard 61850-7-1; Communication Networks and Systems for Power Utility Automation—Part 7-1: Basic Communication Structure—Principles and Models. IEC: Geneva, Switzerland, 2011.
- Valtari, J. Centralized Architecture of the Electricity Distribution Substation Automation: Benefits and Possibilities. Ph.D. Dissertation, Tampere University of Technology, Tampere, Finland, 2013. [Google Scholar]
- Kabbara, N. Virtualized Digital Substations: Exploring the Design, Simulation, and Validation of the Next-Generation Power System Backbone. Ph.D. Dissertation, Utrecht University, Utrecht, The Netherlands, 2025. [Google Scholar]
- Avritzer, A.; Weyuker, E.J. The role of modeling in the performance testing of e-commerce applications. IEEE Trans. Softw. Eng. 2004, 30, 1072–1083. [Google Scholar] [CrossRef]
- Avizienis, A.; Laprie, J.; Randell, B.; Landwehr, C. Basic concepts and taxonomy of dependable and secure computing. IEEE Trans. Dependable Secur. Comput. 1993, 1, 11–33. [Google Scholar] [CrossRef] [Scilit]
- Huang, Y.; Kintala, C.; Kolettis, N.; Fulton, N.D. Software rejuvenation: Analysis, model and applications. In Proceedings of the Twenty-Fifth International Symposium on Fault-Tolerant Computing, Pasadena, CA, USA, 27–30 June 1995; pp. 381–390. [Google Scholar]
- Dohi, T.; Avritzer, A.; Trivedi, K. Handbook of Software Aging and Rejuvenation: Fundamentals, Methods, Applications, and Future Directions; World Scientific Publishing Co., Pte. Ltd.: Singapore, 2020. [Google Scholar]
- Valtari, J.; Kulmala, A.; Schönborn, S.; Kozhaya, D.; Birke, R.; Reikko, J. Real-Life Pilot of Virtual Protection and Control: Experiences and Performance Analysis. In Proceedings of the 27th International Conference on Electricity Distribution (CIRED 2023), Rome, Italy, 12–15 June 2023; pp. 2268–2272. [Google Scholar] [CrossRef] [Scilit]
- Pietrantuono, R.; Russo, S. A survey on software aging and rejuvenation in the cloud. Softw. Qual. J. 2020, 28, 7–38. [Google Scholar] [CrossRef] [Scilit]
- Changa, X.; Zhang, Z.; Li, X.; Trivedi, K.S. Model-Based Survivability Analysis of a Virtualized System. In Proceedings of the 2016 IEEE 41st Conference on Local Computer Networks (LCN), Dubai, United Arab Emirates, 7–10 November 2016; pp. 611–614. [Google Scholar]
- Wang, N.; Machida, F. A CTMDP Modeling for Multi-Stage Software Aging and Rejuvenation. In Proceedings of the 2024 IEEE 35th International Symposium on Software Reliability Engineering Workshops (ISSREW), Tsukuba, Japan, 28–31 October 2024; pp. 394–401. [Google Scholar] [CrossRef] [Scilit]
- Machida, F.; Nicola, V.F.; Trivedi, K.S. Job Completion Time on a Virtualized Server with Software Rejuvenation. ACM Trans. Model. Comput. Simul. 2014, 10, 1. [Google Scholar] [CrossRef] [Scilit]
- Jiang, Y.; Chang, X.; Mišić, J.; Mišić, V.B.; Yao, Y.; Fan, J.; Ju, B. When Honest Nodes in PBFT Consensus Meet Software Aging: SMP-Based Performability Evaluation. In Proceedings of the ICC 2025—IEEE International Conference on Communications, Montreal, QC, Canada, 8–12 June 2025; pp. 2725–2730. [Google Scholar] [CrossRef] [Scilit]
- Bai, J.; Chang, X.; Machida, F.; Trivedi, K.S. Understanding Container-Based Services Under Software Aging: Dependability and Performance Views. IEEE Trans. Sustain. Comput. 2025, 10, 562–575. [Google Scholar] [CrossRef] [Scilit]
- Bai, J.; Chang, X.; Ning, G.; Zhang, Z.; Trivedi, K.S. Service Availability Analysis in a Virtualized System: A Markov Regenerative Model Approach. IEEE Trans. Cloud Comput. 2022, 10, 2118–2130. [Google Scholar] [CrossRef] [Scilit]
- Carnevali, L.; Paolieri, M.; Reali, R.; Scommegna, L.; Vicario, E. A Markov regenerative model of software rejuvenation beyond the enabling restriction. In Proceedings of the 2022 IEEE International Symposium on Software Reliability Engineering Workshops (ISSREW), Charlotte, NC, USA, 31 October–3 November 2022; pp. 138–145. [Google Scholar]
- Avritzer, A.; Janes, A.; Marin, A.; Trubiani, C.; van Hoorn, A.; Camilli, M.; Menasché, D.S.; Bondi, A.B. Software Aging Detection and Rejuvenation Assessment in Heterogeneous Virtual Networks. IEEE Trans. Emerg. Top. Comput. 2025, 13, 299–313. [Google Scholar] [CrossRef] [Scilit]
- Melo, M.; Araujo, J.; Matos, R.; Menezes, J.; Maciel, P. Comparative Analysis of Migration-Based Rejuvenation Schedules on Cloud Availability. In Proceedings of the 2013 IEEE International Conference on Systems, Man, and Cybernetics, Manchester, UK, 13–16 October 2013; pp. 4110–4115. [Google Scholar]
- Torquato, M.; Maciel, P.; Vieira, M. Software Rejuvenation Meets Moving Target Defense: Modeling of Time-Based Virtual Machine Migration Approach. In Proceedings of the 2022 IEEE 33rd International Symposium on Software Reliability Engineering (ISSRE), Charlotte, NC, USA, 31 October–3 November 2022; pp. 205–216. [Google Scholar] [CrossRef] [Scilit]
- Xu, J.; Li, X.; Zhong, Y.; Zhang, H. Availability Modeling and Analysis of a Single-Server Virtualized System with Rejuvenation. J. Softw. 2014, 9, 129–139. [Google Scholar] [CrossRef] [Scilit]
- Torquato, M.; Vieira, M. Interacting SRN Models for Availability Evaluation of VM Migration as Rejuvenation on a System under Varying Workload. In Proceedings of the 2018 IEEE International Symposium on Software Reliability Engineering Workshops (ISSREW), Memphis, TN, USA, 15–18 October 2018; pp. 300–307. [Google Scholar] [CrossRef] [Scilit]
- Araujo, J.; Matos, R.; Maciel, P.; Matias, R. Software aging issues on the eucalyptus cloud computing infrastructure. In Proceedings of the 2011 IEEE International Conference on Systems, Man, and Cybernetics, Anchorage, AK, USA, 9–12 October 2011; pp. 1411–1416. [Google Scholar]
- Liu, J.; Tan, X.; Wang, Y. CSSAP: Software Aging Prediction for Cloud Services Based on ARIMA-LSTM Hybrid Model. In Proceedings of the 2019 IEEE International Conference on Web Services (ICWS), Milan, Italy, 8–13 July 2019; pp. 283–290. [Google Scholar]
- Oliveira, F.; Araujo, J.; Matos, R.; Maciel, P. Software Aging in Container-based Virtualization: An Experimental Analysis on Docker Platform. In Proceedings of the 2021 16th Iberian Conference on Information Systems and Technologies (CISTI), Chaves, Portugal, 23–26 June 2021; pp. 1–7. [Google Scholar] [CrossRef] [Scilit]
- Alonso, J.; Belanche, L.; Avresky, D.R. Predicting Software Anomalies Using Machine Learning Techniques. In Proceedings of the 2011 IEEE 10th International Symposium on Network Computing and Applications, Cambridge, MA, USA, 25–27 August 2011; pp. 163–170. [Google Scholar]
- Tan, X.; Liu, J. ACLM: Software Aging Prediction of Virtual Machine Monitor Based on Attention Mechanism of CNN-LSTM Model. In Proceedings of the 2021 IEEE 21st International Conference on Software Quality, Reliability and Security (QRS), Hainan, China, 6–10 December 2021; pp. 759–767. [Google Scholar] [CrossRef] [Scilit]
- Silva, L.M.; Alonso, J.; Silva, P.; Torres, J.; Andrzejak, A. Using Virtualization to Improve Software Rejuvenation. In Proceedings of the Sixth IEEE International Symposium on Network Computing and Applications (NCA 2007), Cambridge, MA, USA, 12–14 July 2007; pp. 33–44. [Google Scholar] [CrossRef] [Scilit]
- Zhang, J.; Li, S.; He, P. A Multi-State Aperiodic Inspection Strategy Optimizing Method in Software Rejuvenation. In Proceedings of the International Conference on Wearables, Sports and Lifestyle Management (WSLM), Kunming, China, 14–16 January 2022; pp. 47–51. [Google Scholar] [CrossRef] [Scilit]
- DeCelles, S.; Kandasamy, N. Entropy-Based Detection of Incipient Faults in Software Systems. In Proceedings of the 2012 IEEE 18th Pacific Rim International Symposium on Dependable Computing, Niigata, Japan, 18–19 November 2012; pp. 70–79. [Google Scholar]
- Vaidyanathan, K.; Trivedi, K.S. A comprehensive model for software rejuvenation. IEEE Trans. Dependable Secur. Comput. 2005, 2, 124–137. [Google Scholar] [CrossRef] [Scilit]
- Liu, Y.; Liu, W.; Song, J.; He, H. An empirical study on implementing highly reliable stream computing systems with private cloud. Ad Hoc Netw. 2015, 35, 37–50. [Google Scholar] [CrossRef] [Scilit]
- Carnevali, L.; Paolieri, M.; Reali, R.; Scommegna, L.; Vicario, E. Cost-Effective Software Rejuvenation Combining Time-Based and Inspection-Based Policies. IEEE Trans. Emerg. Top. Comput. 2025, 13, 354–369. [Google Scholar] [CrossRef] [Scilit]
- Koutras, V.P.; Platis, A.N. Chapter 3: Software Rejuvenation: Key Concepts and Granularity. In Proceedings of the 2020 IEEE International Symposium on Software Reliability Engineering Workshops (ISSREW), Coimbra, Portugal, 12–15 October 2020; pp. 321–322. [Google Scholar] [CrossRef] [Scilit]
- Trivedi, K.S.; Grottke, M.; Lopez, J.A. Rethinking Software Fault Tolerance. IEEE Trans. Reliab. 2024, 73, 67–72. [Google Scholar] [CrossRef] [Scilit]
- Bovenzi, A.; Alonso, J.; Yamada, H.; Russo, S.; Trivedi, K.S. Towards fast OS rejuvenation: An experimental evaluation of fast OS reboot techniques. In Proceedings of the 2013 IEEE 24th International Symposium on Software Reliability Engineering (ISSRE), Pasadena, CA, USA, 4–7 November 2013; pp. 61–70. [Google Scholar] [CrossRef] [Scilit]
- Machida, F.; Kim, D.S.; Trivedi, K.S. Modeling and analysis of software rejuvenation in a server virtualized system with live VM migration. Perform. Eval. 2013, 70, 212–230. [Google Scholar] [CrossRef] [Scilit]
- Kourai, K.; Chiba, S. Fast Software Rejuvenation of Virtual Machine Monitors. IEEE Trans. Dependable Secur. Comput. 2011, 8, 839–851. [Google Scholar] [CrossRef] [Scilit]
- Machida, F.; Kim, D.S.; Trivedi, K.S. Modeling and analysis of software rejuvenation in a server virtualized system. In Proceedings of the 2010 IEEE Second International Workshop on Software Aging and Rejuvenation, San Jose, CA, USA, 2 November 2010; pp. 1–6. [Google Scholar]
- Le, M.; Tamir, Y. Applying Microreboot to System Software. In Proceedings of the 2012 IEEE Sixth International Conference on Software Security and Reliability, Gaithersburg, MD, USA, 20–22 June 2012; pp. 11–20. [Google Scholar]
- Alonso, J.; Matias, R.; Vicente, E.; Maria, A.; Trivedi, K.S. A comparative experimental study of software rejuvenation overhead. Perform. Eval. 2013, 70, 231–250. [Google Scholar] [CrossRef] [Scilit]
- Santos, M.; Neto, A.; Matos, R.; Araujo, J. Software Aging and Rejuvenation in Microservices: A Systematic Literature Mapping. In Proceedings of the 2023 18th Iberian Conference on Information Systems and Technologies (CISTI), Aveiro, Portugal, 20–23 June 2023; pp. 1–8. [Google Scholar] [CrossRef] [Scilit]
- Tan, X.; Liu, J. GRCEM: Generating Optimal Software Rejuvenation Strategies for Cloud-Edge Collaborative Systems Based on MADRL. In Proceedings of the 2025 IEEE 49th Annual Computers, Software, and Applications Conference (COMPSAC), Toronto, ON, Canada, 8–11 July 2025; pp. 1360–1369. [Google Scholar] [CrossRef] [Scilit]
- Liu, J.; Zhou, Q.; Chen, X.; Zhou, J.; Li, K. TiAD-DQR: Software Aging States Determination and Rejuvenation Decision Generation for Docker Platform. IEEE Trans. Serv. Comput. 2025, 18, 4248–4260. [Google Scholar] [CrossRef] [Scilit]
- Jia, K.; Yu, X.; Zhang, C.; Hu, W.; Zhao, D.; Xiang, J. Software Aging Prediction for Cloud Services Using a Gate Recurrent Unit Neural Network Model Based on Time Series Decomposition. IEEE Trans. Emerg. Top. Comput. 2023, 11, 580–593. [Google Scholar] [CrossRef] [Scilit]
- Li, D.D.; Wu, X.Y.; Deng, H.Z. Reliability Evaluation in Substations Considering Operating Conditions and Failure Modes. IEEE Trans. Power Deliv. 2012, 27, 309–316. [Google Scholar]
- Syed, R.R.; Høidalen, H.K. Investigating the Impact of Fault Handling Models on Reliability Indices of Digital Substation. IEEE Trans. Power Deliv. 2026, 41, 627–640. [Google Scholar] [CrossRef] [Scilit]
- IEC Standard 61850-90-4; Communication Networks and Systems for Power Utility Automation—Part 90-4: Network Engineering Guidelines. IEC: Geneva, Switzerland, 2020.
- IEC 62439-1; Industrial Communication Networks—High Availability Automation Networks: General Concepts and Calculation Methods. IEC: Geneva, Switzerland, 2017.
- IEC 62439-3; Industrial Communication Networks—High Availability Automation Networks: PRP and HSR. IEC: Geneva, Switzerland, 2017.
- Trivedi, K.S.; Bobbio, A. Reliability and Availability Engineering: Modeling, Analysis, and Applications; Cambridge University Press: Cambridge, UK, 2017. [Google Scholar]
- Xie, W.; Hong, Y.; Trivedi, K. Analysis of a two-level software rejuvenation policy. Reliab. Eng. Syst. Saf. 2005, 87, 13–22. [Google Scholar] [CrossRef] [Scilit]
- Sahner, R.A.; Trivedi, K.S.; Puliafito, A. Performance and Reliability Analysis of Computer Systems; Kluwer Academic Publishers: Boston, MA, USA, 1996. [Google Scholar]
- Limnios, N.; Oprişan, G. Semi-Markov Processes and Reliability; Birkhäuser: Basel, Switzerland, 2012. [Google Scholar]
- Billinton, R.; Allan, R.N. Reliability Evaluation of Engineering Systems; Pitman: New York, NY, USA, 1992. [Google Scholar]
- Allan, R.N.; Billinton, R.; De Oliveira, M.F. An Efficient Algorithm for Deducing Minimal Cuts and Reliability Indices. IEEE Trans. Reliab. 1976, 25, 226–233. [Google Scholar] [CrossRef] [Scilit]
- Grover, M.S.; Billinton, R. A Computerized Approach to Substation Reliability Evaluation. IEEE Trans. Power Appar. Syst. 1974, 93, 1488–1497. [Google Scholar] [CrossRef] [Scilit]
- Hajian-Hoseinabadi, H. Computerized Algorithm for Deducing Minimal Cut Sets. Int. Trans. Electr. Energy Syst. 2014, 25, 573–588. [Google Scholar] [CrossRef] [Scilit]
- Dent, C.; Bialek, J.; Zachary, S. Fundamental SQSS Review: Planning and Operational Contingency Criteria; Working Group 4 Report; National Grid Electricity Transmission: London, UK, 2010. [Google Scholar]
- Falahati, B.; Chua, E. Failure Modes in IEC61850-enabled Substation Automation Systems. In Proceedings of the 2016 IEEE/PES Transmission and Distribution Conference and Exposition (T&D), Dallas, TX, USA, 3–5 May 2016. [Google Scholar]
- CIGRE WG B5.42. Experience Concerning Availability and Reliability of Digital Substation Automation Systems (DSAS); CIGRE Technical Brochure TB687; CIGRE: Paris, France, 2017. [Google Scholar]



Disclaimer/Publisher’s Note: The statements, opinions and data contained in all publications are solely those of the individual author(s) and contributor(s) and not of MDPI and/or the editor(s). MDPI and/or the editor(s) disclaim responsibility for any injury to people or property resulting from any ideas, methods, instructions or products referred to in the content. |
© 2026 by the authors. Licensee MDPI, Basel, Switzerland. This article is an open access article distributed under the terms and conditions of the Creative Commons Attribution (CC BY) license.