


Abstract
Hybrid hydro–solar microgrids offer a practical electrification option for remote and weak-grid communities by combining run-of-river hydropower with photovoltaic generation. However, their performance depends strongly on coordinated decisions across three layers: (i) system sizing and architecture, (ii) turbine selection and rating under variable river flow, and (iii) operational energy dispatch under time-varying solar resource and demand. This paper develops an optimization-driven planning framework for a run-of-river hydro–PV microgrid that co-optimizes component capacities and turbine-related design choices while enforcing time-series operational feasibility. Physics-based component models translate river discharge into hydroelectric output via turbine efficiency characteristics and operating limits, and compute PV generation and storage trajectories under dispatch and state-of-charge constraints. The planning problem is formulated as a multi-objective optimization that quantifies trade-offs among life-cycle cost, supply reliability (e.g., unmet-load metrics), and sustainability indicators (e.g., diesel-free operation or emissions when backup generation is present). A Pareto-optimal set of designs is obtained using a population-based multi-objective algorithm, and representative knee-point (balanced) solutions are selected to illustrate how turbine choice and dispatch strategy interact with seasonal hydrology and solar variability. The proposed approach supports transparent and robust design decisions for hybrid hydro–solar microgrids.
1. Introduction
Electrification of remote and weak-grid communities remains constrained by high fuel logistics costs and the operational fragility of single-source generation [1]. Diesel-based systems are also affected by fuel price variability, which introduces uncertainty in operational costs and system planning [2]. Hybrid renewable energy systems (HRESs) have therefore become a dominant pathway for resilient and low-carbon rural supply, but their planning and operation must explicitly address resource intermittency, component degradation, and reliability requirements under realistic variability in demand and renewable inputs [3].
Among renewable options, run-of-river (RoR) hydropower is attractive for decentralized microgrids because it can provide relatively predictable energy without large reservoirs [4], often offering higher capacity factors than solar PV alone [5]. However, RoR output is fundamentally constrained by hydrological conditions and seasonal flow variability, which directly affect generation availability [4]. Consequently, RoR-based microgrids require careful coordination with complementary resources (e.g., PV and storage) to maintain supply adequacy [5] and avoid excessive system sizing under variable resource conditions [4]. Recent studies show that coordinated hydro–PV operation can reduce renewable energy curtailment by improving temporal complementarity between resources [6]. Moreover, hybrid dispatch strategies enhance renewable utilization and improve short-term operational stability in integrated systems [7].
A persistent challenge is that design and dispatch are strongly coupled, since component sizing (e.g., PV, battery, and converters) directly determines the feasible operating range of the microgrid [3]. At the same time, dispatch decisions influence component cycling, system losses, and long-term performance, thereby affecting lifecycle cost and emissions [2]. Consequently, microgrid planning is increasingly formulated as a multi-objective optimization problem that simultaneously minimizes cost while improving reliability metrics such as loss of power supply probability (LPSP) [8] and reducing environmental impacts including emissions [2]. Multi-objective formulations are especially appropriate for RoR hydro–PV systems because river-flow variability introduces significant uncertainty in generation availability [9], which creates tradeoffs between installing higher capacity (to ensure reliability) and avoiding excessive capital investment [5].
However, despite extensive research on hybrid microgrid optimization, turbine selection is often treated as a secondary design parameter or assumed implicitly within hydropower resource models [10]. Turbine operating efficiency fundamentally depends on head and discharge conditions, which define the feasible operating range and performance of the turbine [11]. Mismatches between seasonal flow regimes and turbine operating characteristics can reduce energy conversion efficiency and overall system yield [12]. This, in turn, increases reliance on complementary resources such as storage or diesel backup to maintain supply adequacy [13]. Recent turbine-focused studies emphasize the importance of selecting turbine types suitable for low-head and variable-flow conditions typical of RoR systems [10], supported by hydrodynamic performance evaluation [11] and sustainability-oriented assessments [12]. In parallel, broader reviews highlight that adding operational flexibility through storage or hybridization enhances the system value of hydropower under increasing renewable penetration [13].
Motivated by these gaps, this study presents a unified framework for multi-objective optimization of a hybrid RoR hydro–solar microgrid that explicitly couples system sizing and design constraints with operational decision variables [14], RoR turbine operating-region selection consistent with site-specific head and flow conditions [15], and energy dispatch under time-varying solar irradiance and seasonal river-flow profiles [16]. The proposed approach evaluates tradeoffs among economic performance, supply reliability, and environmental impact using Pareto-optimal solution sets [14], enabling the identification of representative compromise solutions for practical implementation [15]. By integrating turbine feasibility and dispatch realism into planning, the framework supports site-grounded and reproducible microgrid design for rural electrification contexts [16].
Compared with conventional hybrid microgrid sizing studies that assume simplified or implicitly feasible hydropower availability [3,5], the proposed framework embeds turbine operating envelopes and flow feasibility screening directly within the hourly simulation used for objective evaluation. This enables turbine-related design parameters to be explicitly co-optimized with component capacities under dispatch constraints, linking hydropower operability with cost–reliability–emissions trade-offs across the Pareto solution space.
The main contributions of this study are summarized as follows:
- Development of a hybrid microgrid sizing framework that explicitly incorporates turbine feasibility constraints under seasonal river-flow variability.
- Integration of turbine selection and operating-region constraints within a multi-objective optimization framework using MOPSO.
- Quantitative evaluation of the influence of turbine selection on system reliability, cost, and diesel usage through analysis of representative Pareto-optimal configurations.
The remainder of this paper is organized as follows. Section 2 describes the system configuration, component modeling, and optimization framework. Section 3 presents the results of the multi-objective optimization and dispatch analysis. Section 4 discusses the implications of the findings and design trade-offs. Section 5 provides sensitivity analysis to evaluate the robustness of the proposed system under varying conditions. Finally, Section 6 summarizes the key findings and concludes the study.
2. Materials and Methods
2.1. System Configuration and Component Modeling
2.1.1. Hybrid Hydro–Solar Microgrid Architecture
This study considers an islandable hybrid microgrid composed of a run-of-river (RoR) small hydropower plant, a photovoltaic (PV) array, an optional battery energy storage system (BESS), and an optional diesel generator (DG) used solely as backup to satisfy reliability requirements. The RoR plant provides a resource-synchronous and conditionally controllable supply limited by river discharge and turbine operating limits, while PV contributes diurnal energy that can complement hydropower output depending on seasonal patterns and irradiance conditions [5,17]. The microgrid is operated to meet an electrical demand profile at a fixed time step (hourly unless otherwise stated), and the dispatch problem enforces instantaneous power balance:
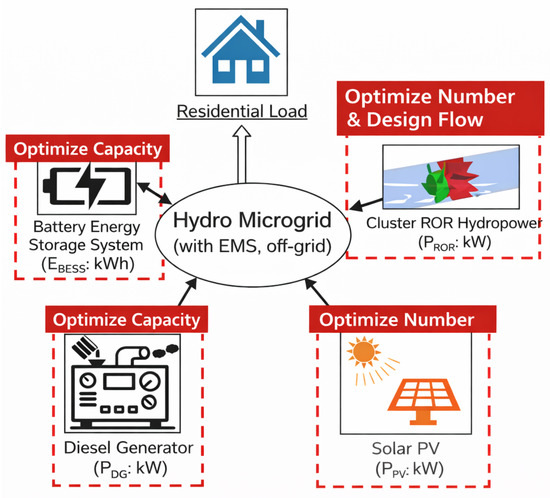
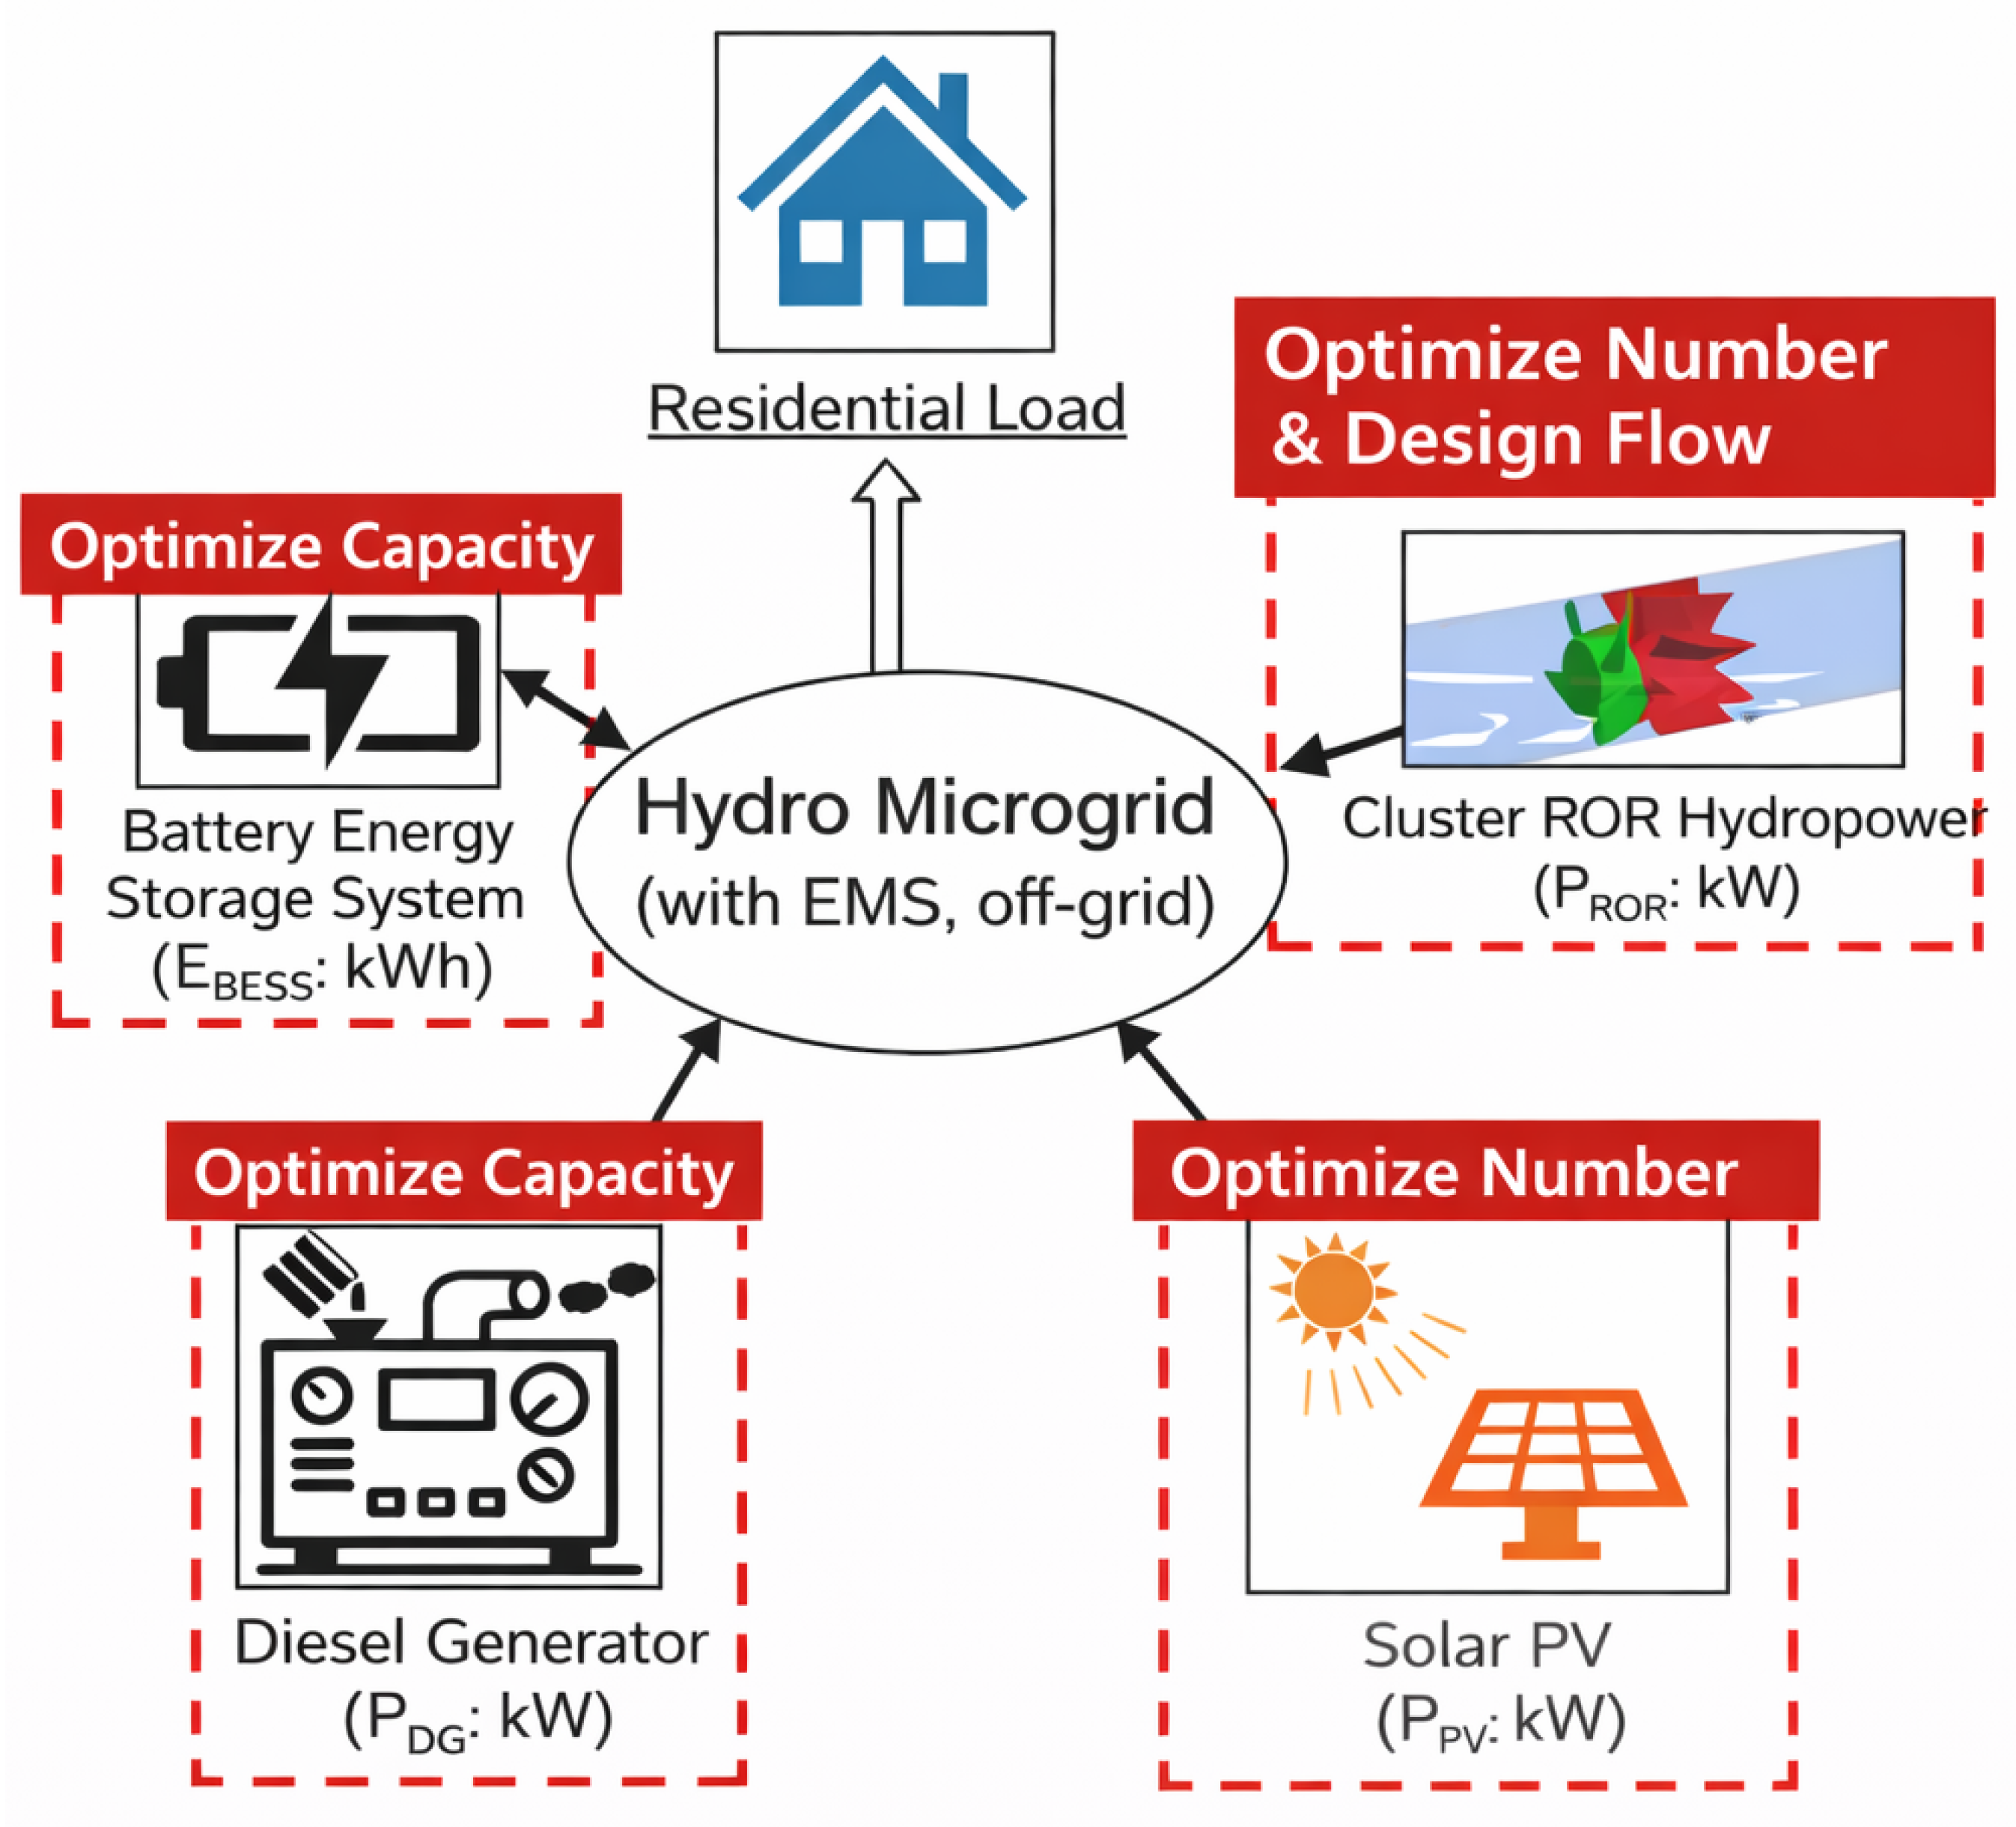
where is RoR hydropower output, is PV generation, is DG output, and are BESS charging and discharging powers, and captures curtailed renewable energy. This formulation is consistent with widely used microgrid steady-state component-coupling approaches in hybrid renewable systems [18,19]. The overall configuration and power-flow relationships of the proposed hybrid microgrid are illustrated in Figure 1.
Figure 1.
Hybrid RoR hydropower–PV microgrid configuration and power-flow structure.
2.1.2. Resource and Input Data
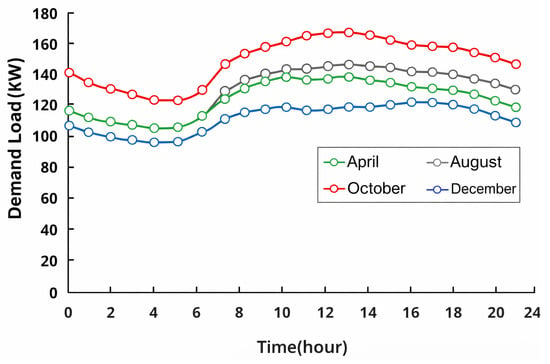
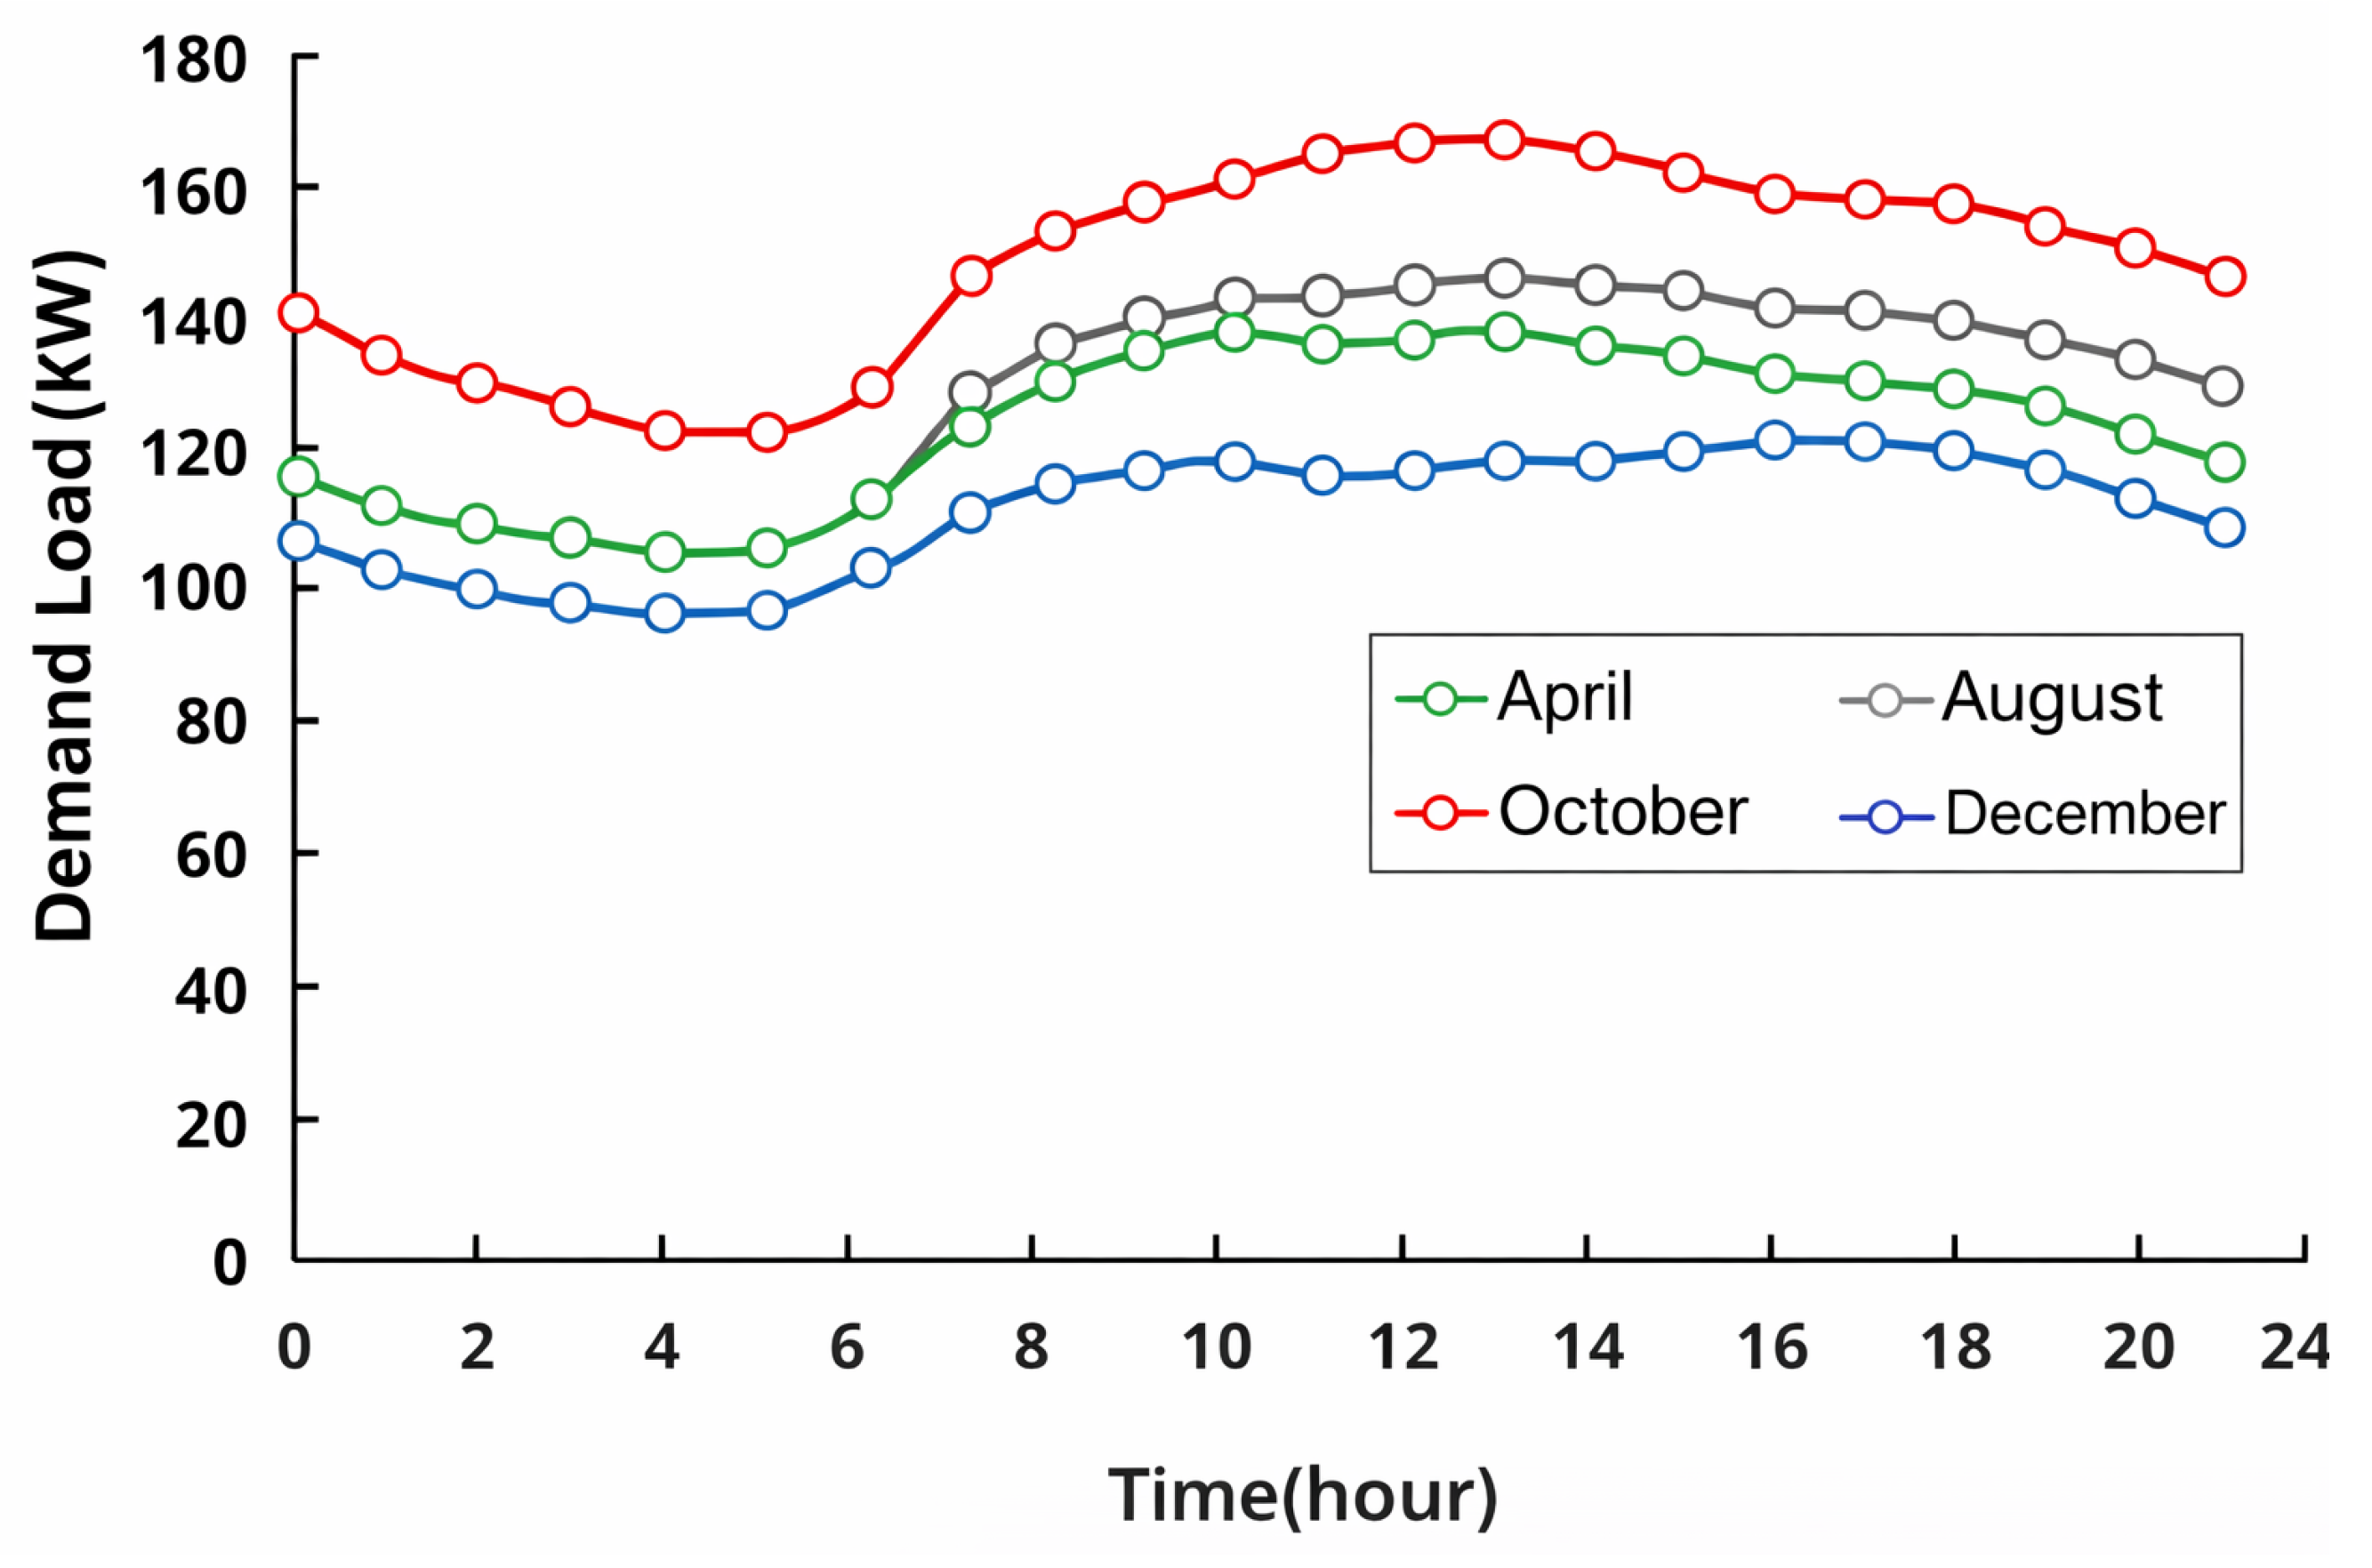
The input dataset comprises (i) electrical demand time series , (ii) river discharge (and head information where available), and (iii) solar resource variables (e.g., global horizontal irradiance and ambient temperature) used to estimate PV output. Because RoR generation is directly constrained by instantaneous discharge, seasonal flow variability strongly influences hydropower availability and the complementary role of PV and storage in the microgrid supply portfolio [17,20]. A representative daily electricity demand is shown in Figure 2.
Figure 2.
Representative daily electricity demand profiles by season/month.
2.1.3. Run-of-River Hydropower Model and Turbine Operating Constraints
RoR hydropower output is modeled using a quasi-steady conversion from hydraulic power to electrical power:
where is water density, g is gravitational acceleration, is turbine flow, is net head, and aggregates turbine, drivetrain, and generator efficiencies. In RoR applications, is limited by river discharge and turbine admissible flow region:
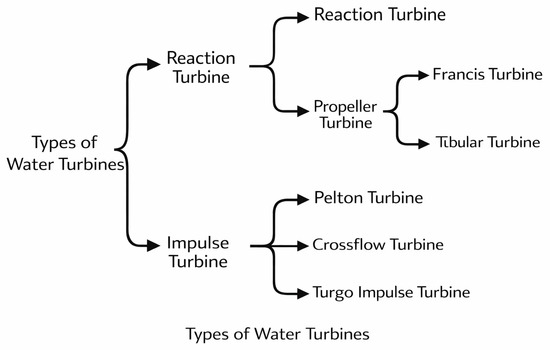
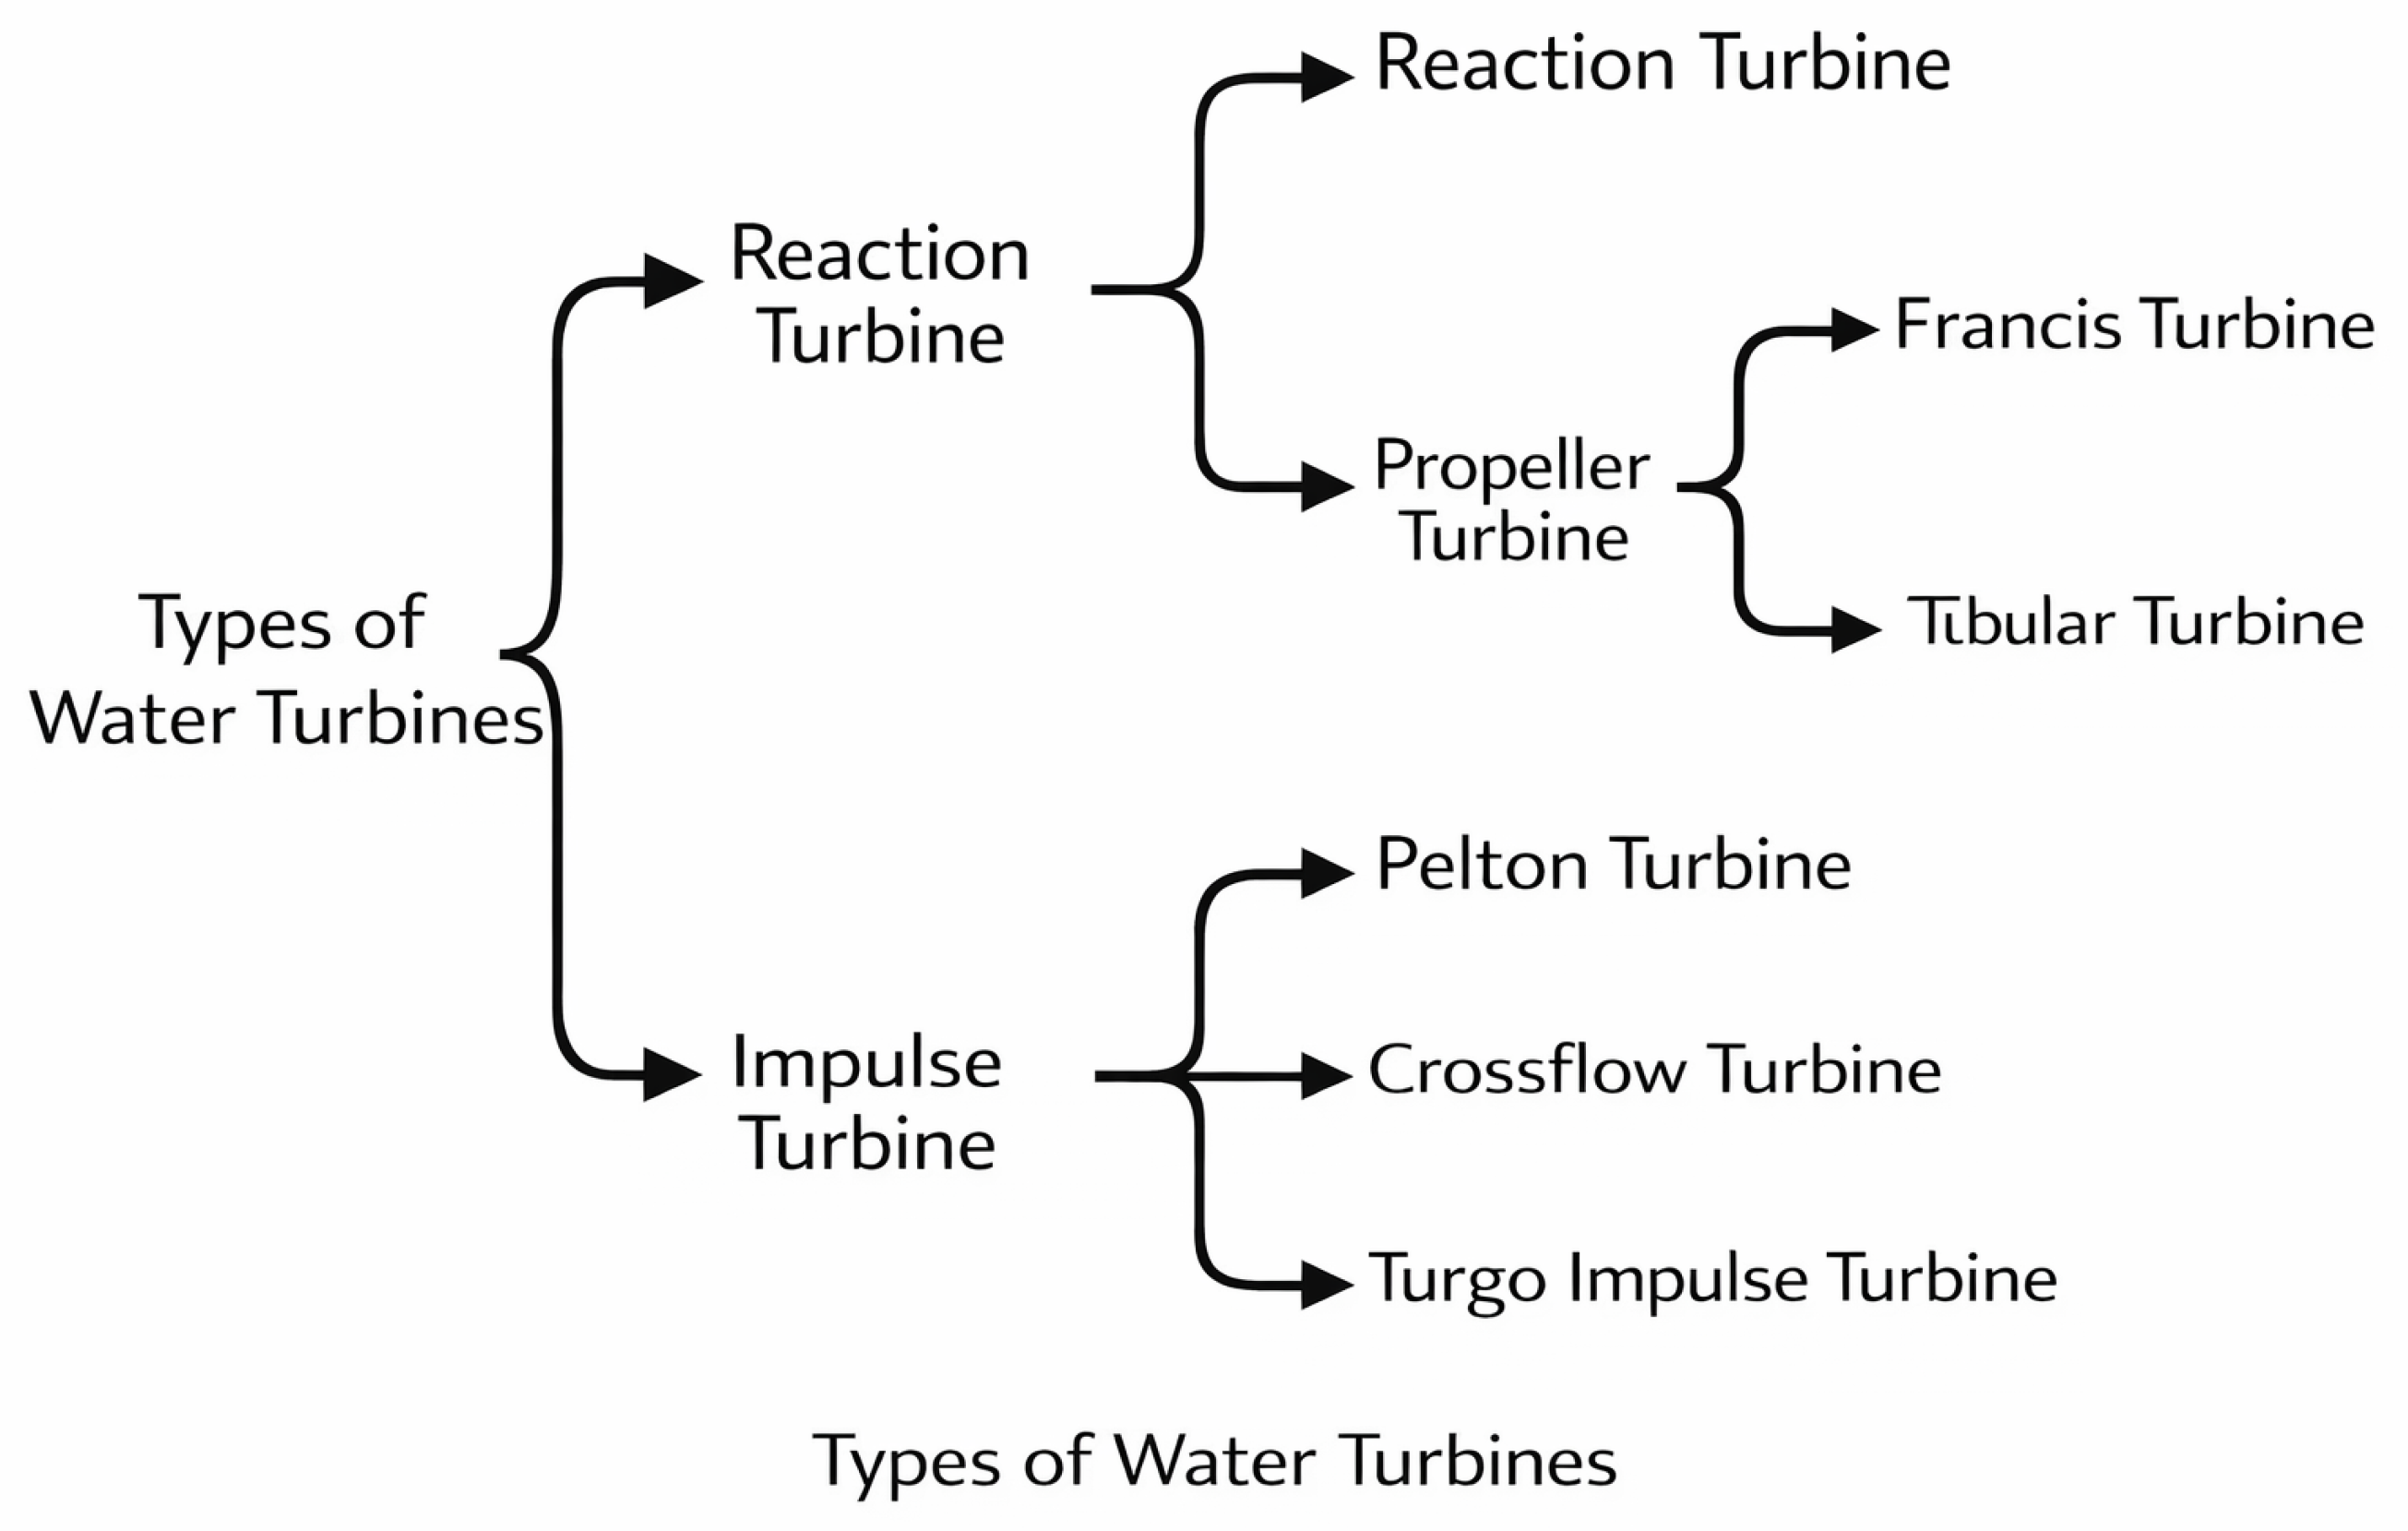
The minimum technical flow and maximum flow depend on turbine design and selection. Turbine suitability for small hydropower is strongly tied to head–flow regimes; cross-flow and propeller/Kaplan-type turbines are common choices for low-to-medium head RoR sites, and their operating envelopes can be captured as feasibility bounds within the optimization [10,21,22,23]. Recent studies highlight that turbine efficiency and stability vary significantly across operating conditions, particularly in RoR systems with seasonal flow variability, motivating explicit representation of turbine operating constraints rather than assuming constant efficiency [11,21,22]. Different classifications for the water turbines are shown in Figure 3.
Figure 3.
Classification of water turbines by operating principle, distinguishing reaction turbines and impulse turbines and their representative turbine types.
2.1.4. Flow Allocation Across Multiple Turbines and Spill Treatment
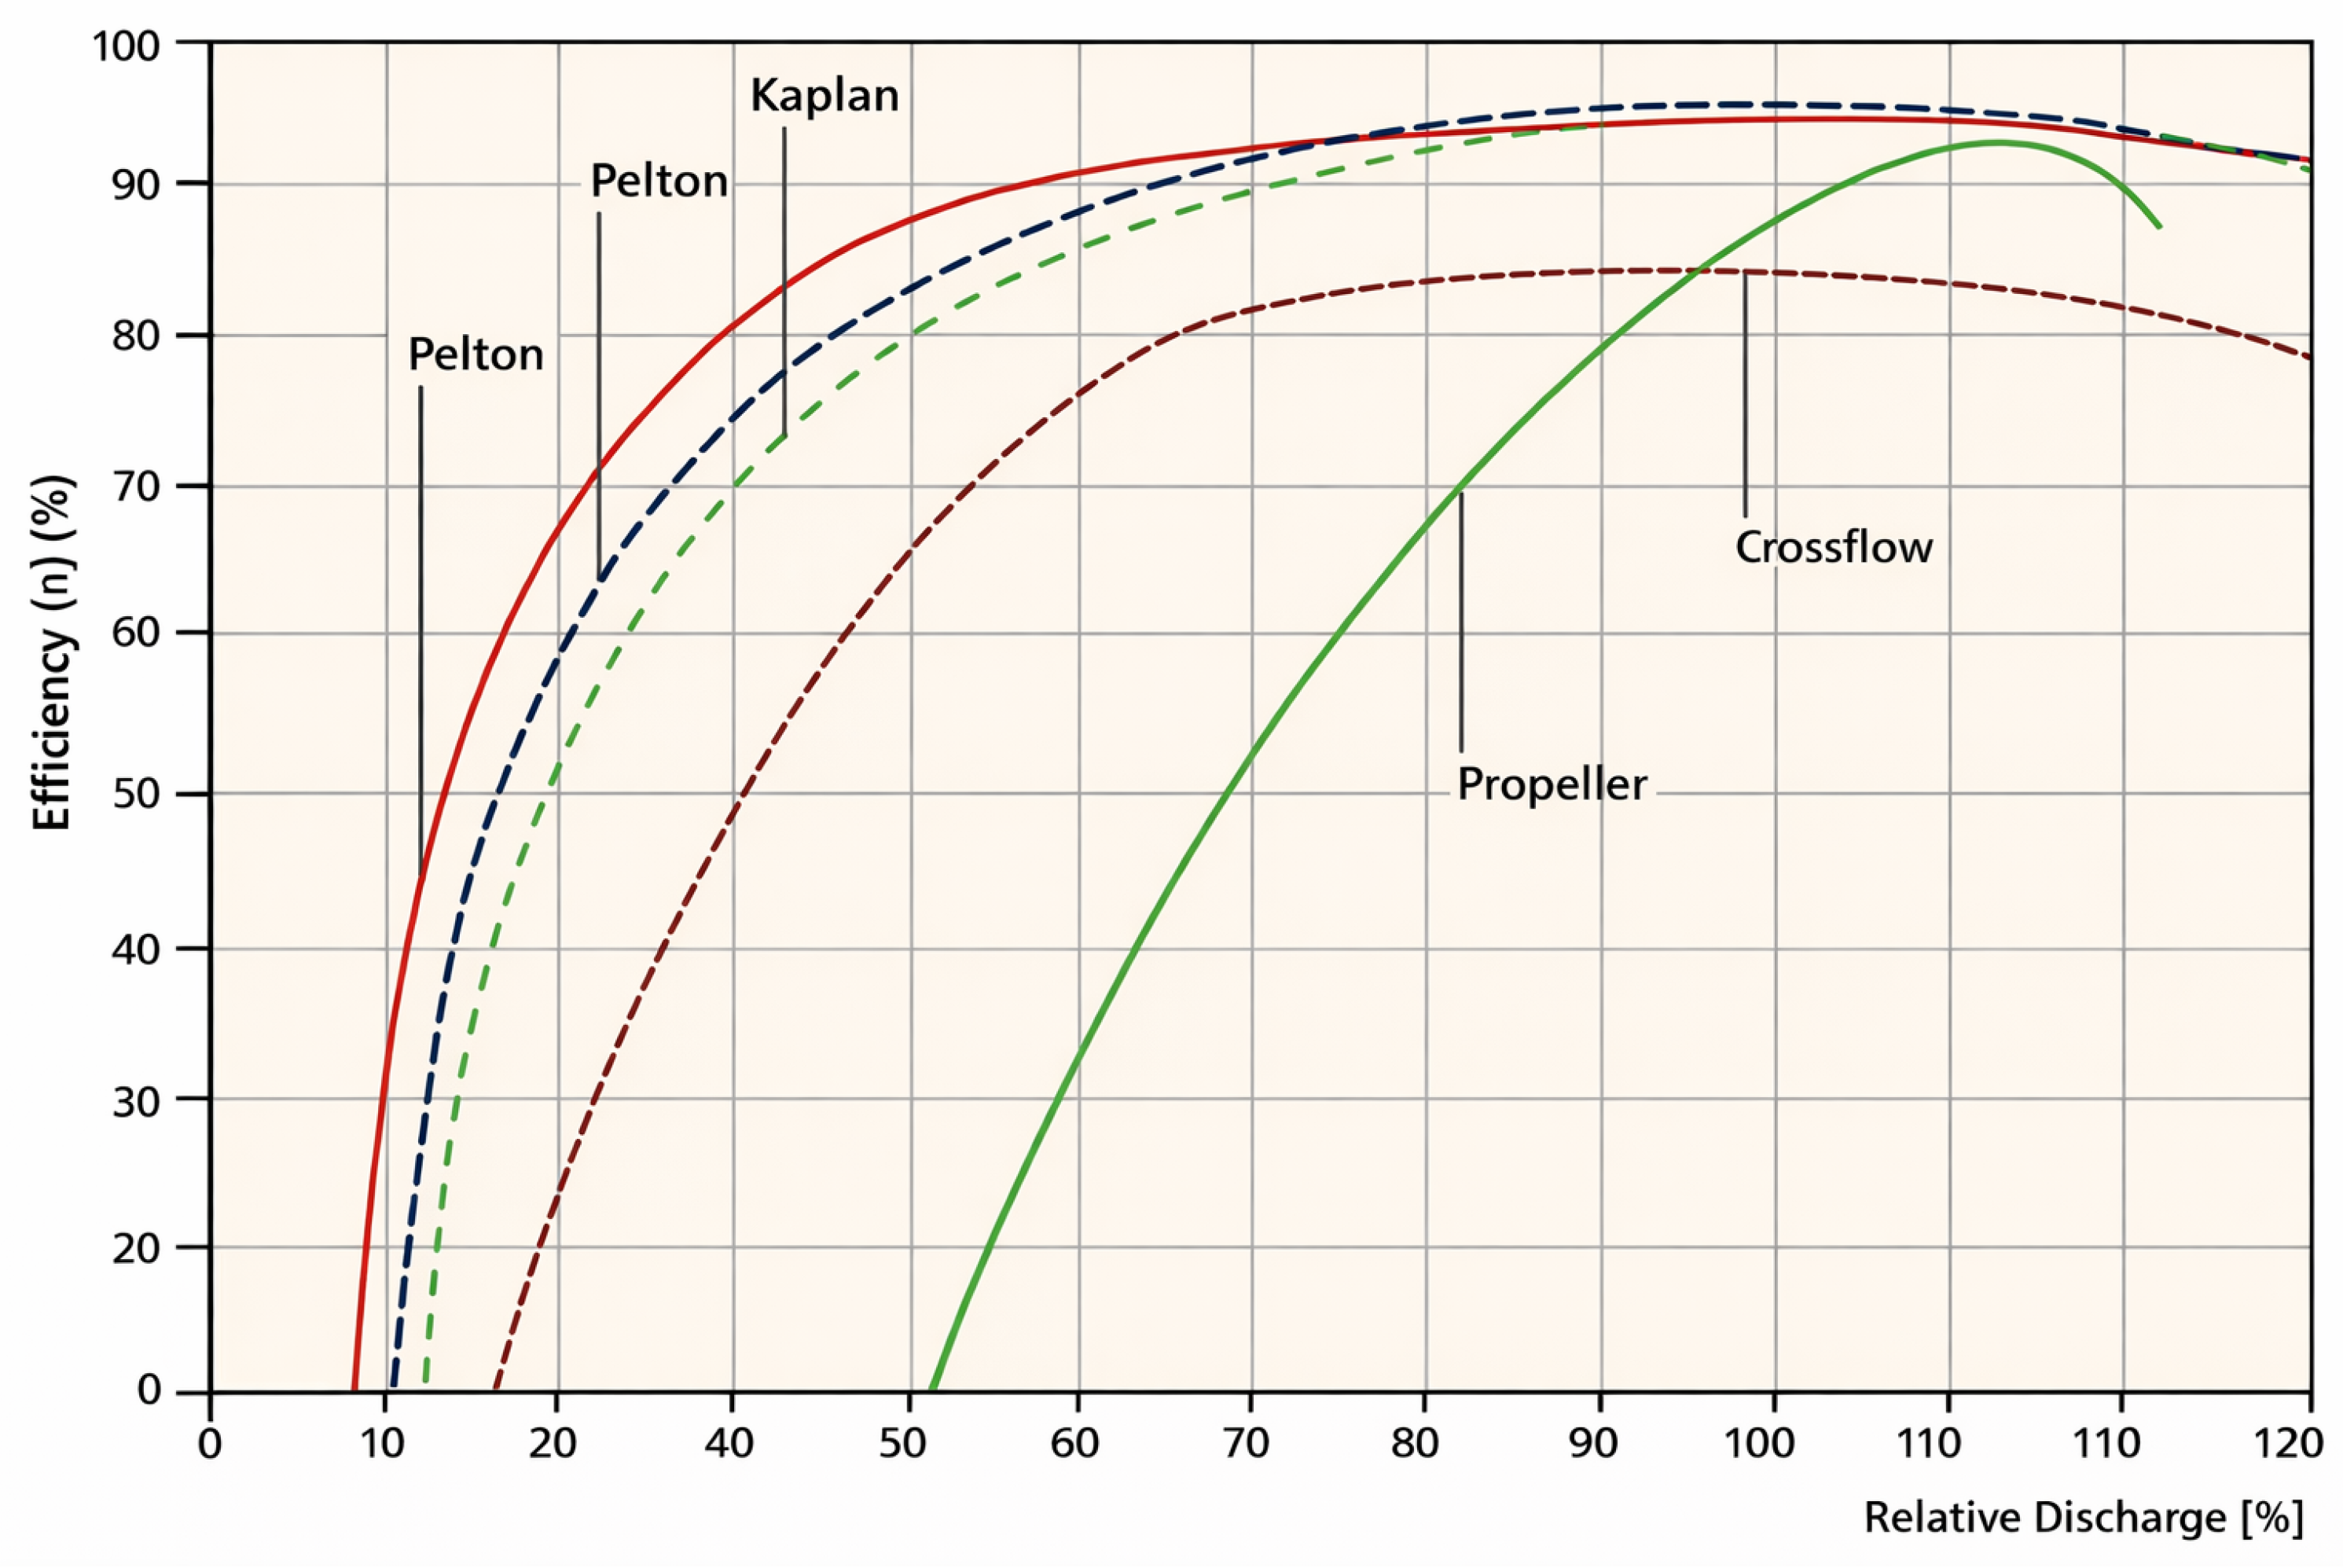
At each time step, the measured river discharge is allocated across installed turbines subject to their admissible operating ranges. A turbine of type operates only if , with and (Table 1). Flow is first assigned to crossflow units (to preserve low-flow generation) up to their admissible capacity, and any remaining discharge is then assigned to propeller units. Any discharge that exceeds the total admissible capacity of the installed turbines is treated as spill (unused flow) and does not contribute to power generation.
Table 1.
Hydropower and turbine operating parameters used in the simulation.
Figure 4.
Efficiency curves as a function of relative discharge for representative turbine types, used to define turbine performance characteristics and operating regions in the run-of-river hydropower model.
2.1.5. PV Generation Model
PV output is modeled using an irradiance- and temperature-adjusted performance relation:
where is PV rated capacity, is plane-of-array irradiance, , is the temperature coefficient, and is cell temperature estimated from ambient conditions and irradiance. This class of steady-state PV modeling is commonly used in hybrid microgrid sizing and dispatch studies and is adequate when the dispatch time step is hourly [2,5,14].
2.1.6. Battery Energy Storage Model
If BESS is included, the state of charge (SOC) is updated as:
with SOC bounds:
Charging/discharging powers are limited by inverter and battery ratings:
and simultaneous charging/discharging is prevented by standard complementarity logic (binary or penalized continuous formulations depending on the solver). Because sizing and dispatch results can be sensitive to degradation assumptions, battery degradation-aware modeling is considered when evaluating lifecycle and replacement impacts, following the observation that degradation models can materially change optimal energy management decisions [2,24].
2.1.7. Diesel Generator Model (Optional Backup)
The DG is modeled as a backup supply with minimum loading and capacity limits:
where is the DG rated power and is the commitment variable. Fuel consumption is approximated using a linear heat-rate form:
where a and b are fitted coefficients. Such DG models are standard in microgrid dispatch and energy management studies and provide an appropriate tradeoff between fidelity and tractability for multi-objective optimization [18,19].
2.1.8. Decision Variables and Feasibility Bounds
The design variables for system sizing include PV capacity , BESS energy and power ratings when applicable, DG rating when applicable, and turbine-related variables that encode turbine class selection and feasible operating ranges . Dispatch variables include , , , curtailment , and turbine flow (or if expressed in power). Explicit feasibility bounds are imposed to ensure physically meaningful operation (e.g., RoR flow screening and turbine envelope constraints), consistent with recommendations from turbine design and RoR operation literature emphasizing realistic admissible regions across variable conditions [10,11,21,22]. The lifecycle practicality of turbine choices (including suitability for remote deployment and sustainability considerations) is also informed by recent assessments of micro water turbines in remote generation contexts [12].
2.2. Energy Management and Dispatch Strategy
To evaluate system performance under realistic operating conditions, a time-series energy management and dispatch strategy is implemented to translate candidate design variables into operational decisions at each simulation time step. In hybrid microgrids, dispatch strongly affects (i) reliability and unmet demand, (ii) renewable utilization and curtailment, and (iii) cycling intensity of storage and fuel-based generation, which ultimately drive cost and emissions objectives [18,25]. Accordingly, we implement a rule-based, case-driven dispatch algorithm consistent with widely adopted practical EMS structures for isolated and weak-grid microgrids, while remaining compatible with optimization-based planning workflows [26,27,28].
At each discrete time step t (e.g., hourly), the controller receives: load demand , PV available power , run-of-river hydro available power (bounded by river flow and turbine operating constraints), and the battery state-of-charge . Dispatch determines the supplied powers , , , , and , together with curtailment and unmet load. This structure aligns with recent literature where deterministic priority rules are combined with feasibility constraints to support robust, interpretable operation under renewable variability [5,29].
2.2.1. Dispatch Objectives and Priority Rules
The dispatch policy prioritizes reliable supply while maximizing renewable utilization and limiting excessive storage cycling. Diesel generation is used only as a last-resort backup when renewable resources and storage cannot meet demand [30,31,32].
The dispatch priority is established as follows (unless constrained):
- Run-of-river hydro as a primary firm renewable source within turbine operating bounds;
- PV as a non-dispatchable renewable source (must take up to load and charging limits);
- BESS to absorb surplus (charge) and cover deficits (discharge), subject to SOC and power limits;
- Diesel generator (DG) as optional backup when renewable+BESS cannot meet demand;
- Unmet load only if all supply options are infeasible.
This structure is consistent with hybrid microgrid EMS design reported across recent studies, including PV–storage–DG dispatch and extended hybrid configurations [26,27,33].
2.2.2. Case-Based Dispatch Logic (Hydro–PV–BESS–DG)
Define the net renewable balance:
The EMS applies a case-based logic similar to practical rule-based systems used for standalone operation and planning-oriented simulation [7,28]:
- Case 1: Surplus renewable power ().
Hydro and PV meet the load. Surplus is directed to battery charging (if and within limits); remaining surplus is curtailed.
Curtailment can be attributed to PV spillage and/or hydro spillage, depending on turbine and PV operational priorities and constraints [32].
- Case 2: Renewable deficit covered by BESS ( and BESS available).
If renewables are insufficient, the battery discharges to cover the deficit up to its discharge power limit and SOC floor:
- Case 3: Remaining deficit covered by DG (optional).
If a deficit remains after BESS discharge, and DG is enabled, DG supplies:
with standard minimum loading and ramp constraints applied if modeled [26,29].
- Case 4: Unmet load (insufficient supply).
If DG is not enabled or cannot cover the remaining deficit, the unmet load power is:
- Case 5: Forced curtailment due to constraints.
Even when , curtailment may occur due to BESS saturation, hydro minimum operating limits, turbine operating region limits, or inverter constraints, which are explicitly enforced to preserve feasibility [5,7].
2.2.3. Unmet Load, Curtailment, and Reliability Metrics
The EMS produces time-series energy quantities used to evaluate reliability and renewable utilization:
A standard planning-level reliability index is the loss of power supply probability (LPSP), computed on an energy basis:
LPSP and related indices remain widely used in recent microgrid planning and optimization studies because they directly link dispatch feasibility to design adequacy [30,34].
In addition to LPSP, three complementary reliability indicators are computed from the same hourly unmet-load time series. Expected energy not served (EENS) over the simulation horizon is
The loss-of-load probability (LOLP) is defined as the fraction of hours in which any unmet load occurs:
where is the number of time steps and is the indicator function. Finally, the maximum hourly unmet-load power (peak deficit) is
2.2.4. Operational Constraints and Implementation Details
Operational feasibility is ensured through constraint enforcement at each step:
- Hydro constraints: , with turbine-class operating regions and minimum loading where applicable [5,35].
- PV usage and curtailment: ; excess PV is curtailed once load and charging limits are satisfied [32].
- BESS SOC dynamics: The SOC dynamics follow Equation (5), while operational constraints enforce SOC bounds and charging/discharging power limits [28,29].
- DG constraints (if enabled): , with optional minimum-loading constraints to avoid inefficient low-load operation [26].
The EMS is implemented as a deterministic mapping from system states to dispatch decisions. Specifically, the mapping considers , enabling reproducible evaluation across optimization candidates and facilitating Pareto-based planning studies [18,25].
2.3. Optimization Problem Formulation
This study formulates the planning and operation of a hybrid run-of-river (RoR) hydro-solar microgrid as a constrained multi-objective optimization problem, where component sizing, turbine selection parameters, and dispatch-related design variables are simultaneously optimized under hydrological and meteorological variability. The formulation follows common practices in multi-objective microgrid planning, where techno-economic criteria are optimized alongside reliability and sustainability indicators [36,37,38,39].
2.3.1. Decision Variables (Sizing + Turbine Selection Parameters)
Let the decision vector be:
where (kW) is the PV installed capacity, (kWh) is the battery energy capacity, and (kW) is the optional diesel generator rated capacity. The turbine-selection variable is modeled as a discrete index representing the candidate turbine family/type (e.g., cross-flow vs. propeller/axial), while denotes continuous turbine parameters used for feasibility/efficiency modeling (e.g., nominal discharge range, runner/impeller diameter proxy, or rated mechanical power). The vector groups operational design parameters that affect dispatch feasibility and reliability (e.g., minimum allowable SOC, reserve margin policy, or curtailment/unmet-load penalty weights), consistent with planning frameworks that jointly tune design and operational parameters [9,14,40].
Turbine feasibility is enforced through an admissible operating region derived from RoR head–flow constraints, ensuring that the selected turbine and rated hydro power remain operable over the range of river-flow conditions. Similar turbine-feasibility screening is widely recommended to avoid solutions that are optimal only under nominal conditions but infeasible under seasonal flow variability [14,41].
2.3.2. Objective Functions (Cost–Reliability–Sustainability)
The optimization adopts three primary objectives aligned with microgrid planning literature:
- (1)
- Cost objective.
A life-cycle cost metric is minimized, expressed as net present cost (NPC) or levelized cost of energy (LCOE):
where NPC aggregates discounted capital, replacement, O&M, and fuel costs (if DG is included). Such cost objectives are standard for hybrid microgrid sizing [36,37,39].
- (2)
- Reliability objective.
Reliability is represented by an unmet-load indicator such as LPSP (loss of power supply probability) or expected energy not served (EENS):
Reliability-driven planning is commonly coupled with cost minimization to prevent under-sized systems [37,42].
- (3)
- Sustainability objective.
Sustainability is captured via life-cycle or operational emissions (e.g., from DG fuel use), renewable fraction, or both:
where is the emissions factor and is DG energy production. Environmental objectives are frequently included in multi-objective hybrid system design [14,30,39].
- Economic Objective Formulation
To ensure transparency and reproducibility of the economic objective, both an overnight investment metric (total system cost, TSC) and a life-cycle metric (net present cost, NPC) are formally defined. The formulation explicitly accounts for capital investment, replacement costs, operation and maintenance (O&M), fuel expenditures, discount rate, and project lifetime parameters. The total system cost is
Unit-cost assumptions for PV, inverter/PCS, BESS, and DG are summarized in Table 2, while the hydropower CAPEX model is reported separately in Table 3. Hydropower cost includes civil works and electromechanical components and is computed using the head.
Table 2.
Unit-cost assumptions for non-hydropower components used in the economic objective.
Table 3.
Empirical cost correlations for estimating RoR hydropower CAPEX components.
For life-cycle reporting, the net present cost over a project horizon of N years at a real discount rate i is
where is the initial investment, is operation and maintenance cost, is diesel fuel cost computed from the dispatch simulation when DG is enabled, accounts for scheduled component replacements, and is the salvage value at year N.
A linear pro-rata salvage model is adopted:
where is the lifetime of component k and is the most recent installation/replacement year.
The capital recovery factor and levelized cost of electricity are
All financial assumptions (e.g., N, i, component lifetimes, and fuel price) are listed in Table 4. All costs are evaluated in real terms; fuel price escalation is set to unless stated otherwise.
Table 4.
Economic and financial parameters used for life-cycle cost evaluation.
2.3.3. Constraints (Technical, Resource, and Service Constraints)
The solution must satisfy constraints across all time steps t:
- Power balance.
- RoR hydro constraints.
Hydro output is bounded by the available discharge and turbine feasibility window:
where is river flow and H is effective head. Feasibility limits are enforced using the turbine operating region and minimum-flow cut-in considerations, consistent with hydro–PV coordinated operation studies [40,43,44].
- PV constraints.
PV power is limited by irradiance and temperature-dependent performance:
where accounts for temperature effects. PV performance constraints are important when comparing seasonal or representative-day scenarios [45,46].
- BESS constraints.
SOC dynamics and bounds:
and power bounds , . Battery constraints ensure dispatch feasibility and avoid unrealistic cycling, which is critical for cost–reliability trade-offs [39,42].
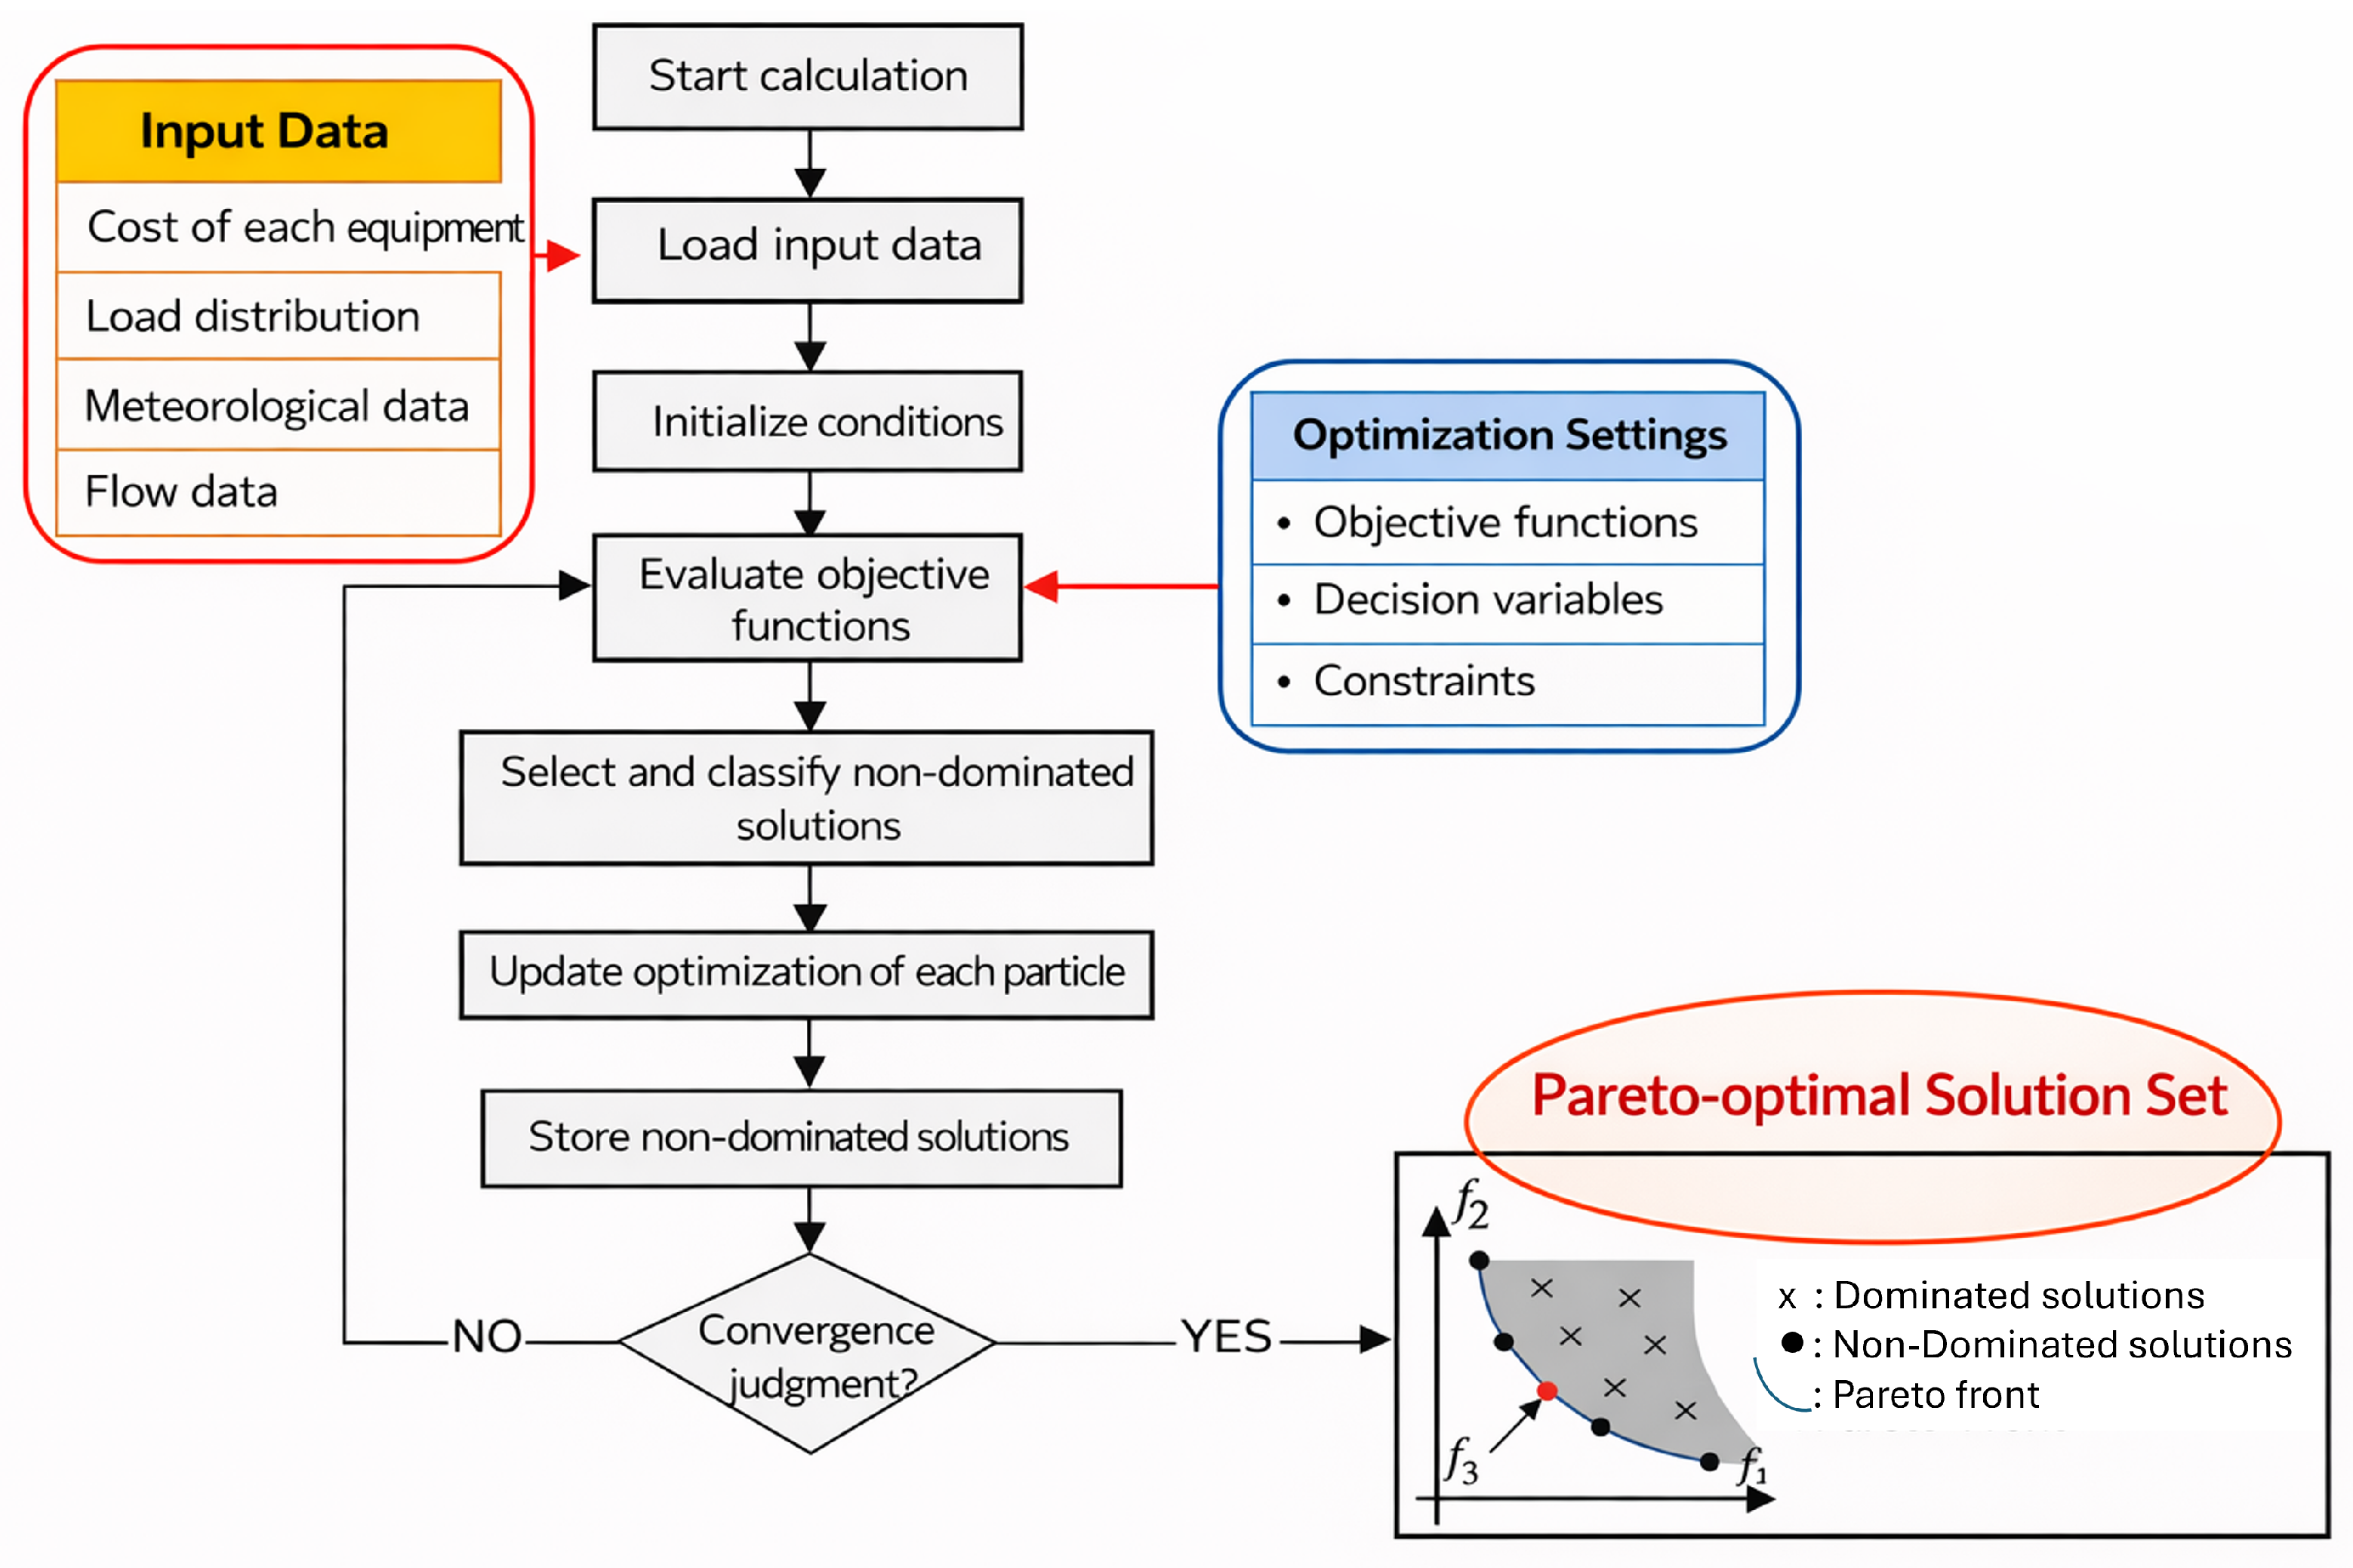
2.3.4. Solution Method and Algorithm Settings (e.g., MOPSO/PSO)
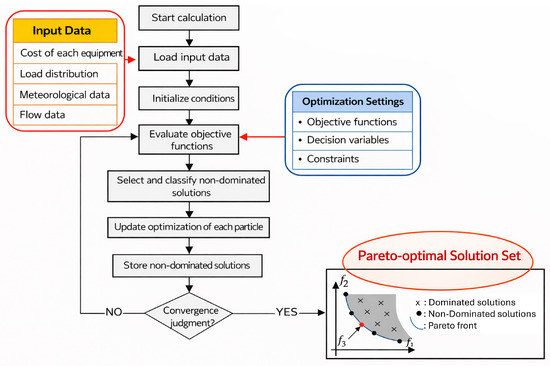
A Pareto-based metaheuristic is used to solve the constrained multi-objective problem. This work adopts multi-objective particle swarm optimization (MOPSO) because of its proven performance in sizing hybrid energy systems with non-linear constraints and mixed decision spaces [9,36,38]. The workflow, shown in Figure 5, indicates that the particles encode candidate designs , and each evaluation performs a time-series simulation of dispatch under resource/load data to compute while enforcing feasibility via constraint handling (e.g., repair operators or penalty functions).
Figure 5.
Workflow of the proposed minimization process.
Algorithm settings (population size, iteration count, inertia and acceleration coefficients, repository size, and mutation/perturbation rates) are selected to balance convergence and diversity. Parameter tuning is guided by common recommendations in recent MOPSO/PSO microgrid studies [37,39]. These settings are shown in Table 5.
Table 5.
MOPSO settings and convergence assessment protocol.
To evaluate stability and reproducibility, the MOPSO procedure was repeated over 10 independent runs with different random seeds. Convergence was assessed by tracking the hypervolume (HV) indicator of the non-dominated archive at each iteration, reporting the mean and standard deviation across runs, and verifying that HV improvements plateaued under the stopping criterion in Table 5.
Each candidate design (particle) is evaluated using the full hourly time series over one year () for load, river discharge, irradiance, and temperature; no representative-day subset is used in objective evaluation.
2.3.5. Best-Compromise Solution Selection Method
Because MOPSO yields a set of non-dominated solutions, a best-compromise design is selected for reporting and implementation. This study applies a normalized membership-based compromise selection, where each objective is scaled to and aggregated via a weighted utility score:
with weights reflecting stakeholder priorities (cost, reliability, sustainability). Alternative Pareto-to-single-point selection approaches such as R-method ranking and MCDM tools (e.g., TOPSIS/VIKOR) are widely used for energy planning [47,48] and can be adopted as sensitivity checks.
2.4. Case Study Description and Scenarios
This section describes the site context and scenario design used to evaluate the proposed hybrid RoR hydro–solar microgrid. Scenario-based analysis is essential because river flow and solar resources vary seasonally and stochastically, influencing turbine feasibility, renewable contribution, storage utilization, and unmet-load risk [40,43,44,49].
2.4.1. Site/Load Context and Assumptions
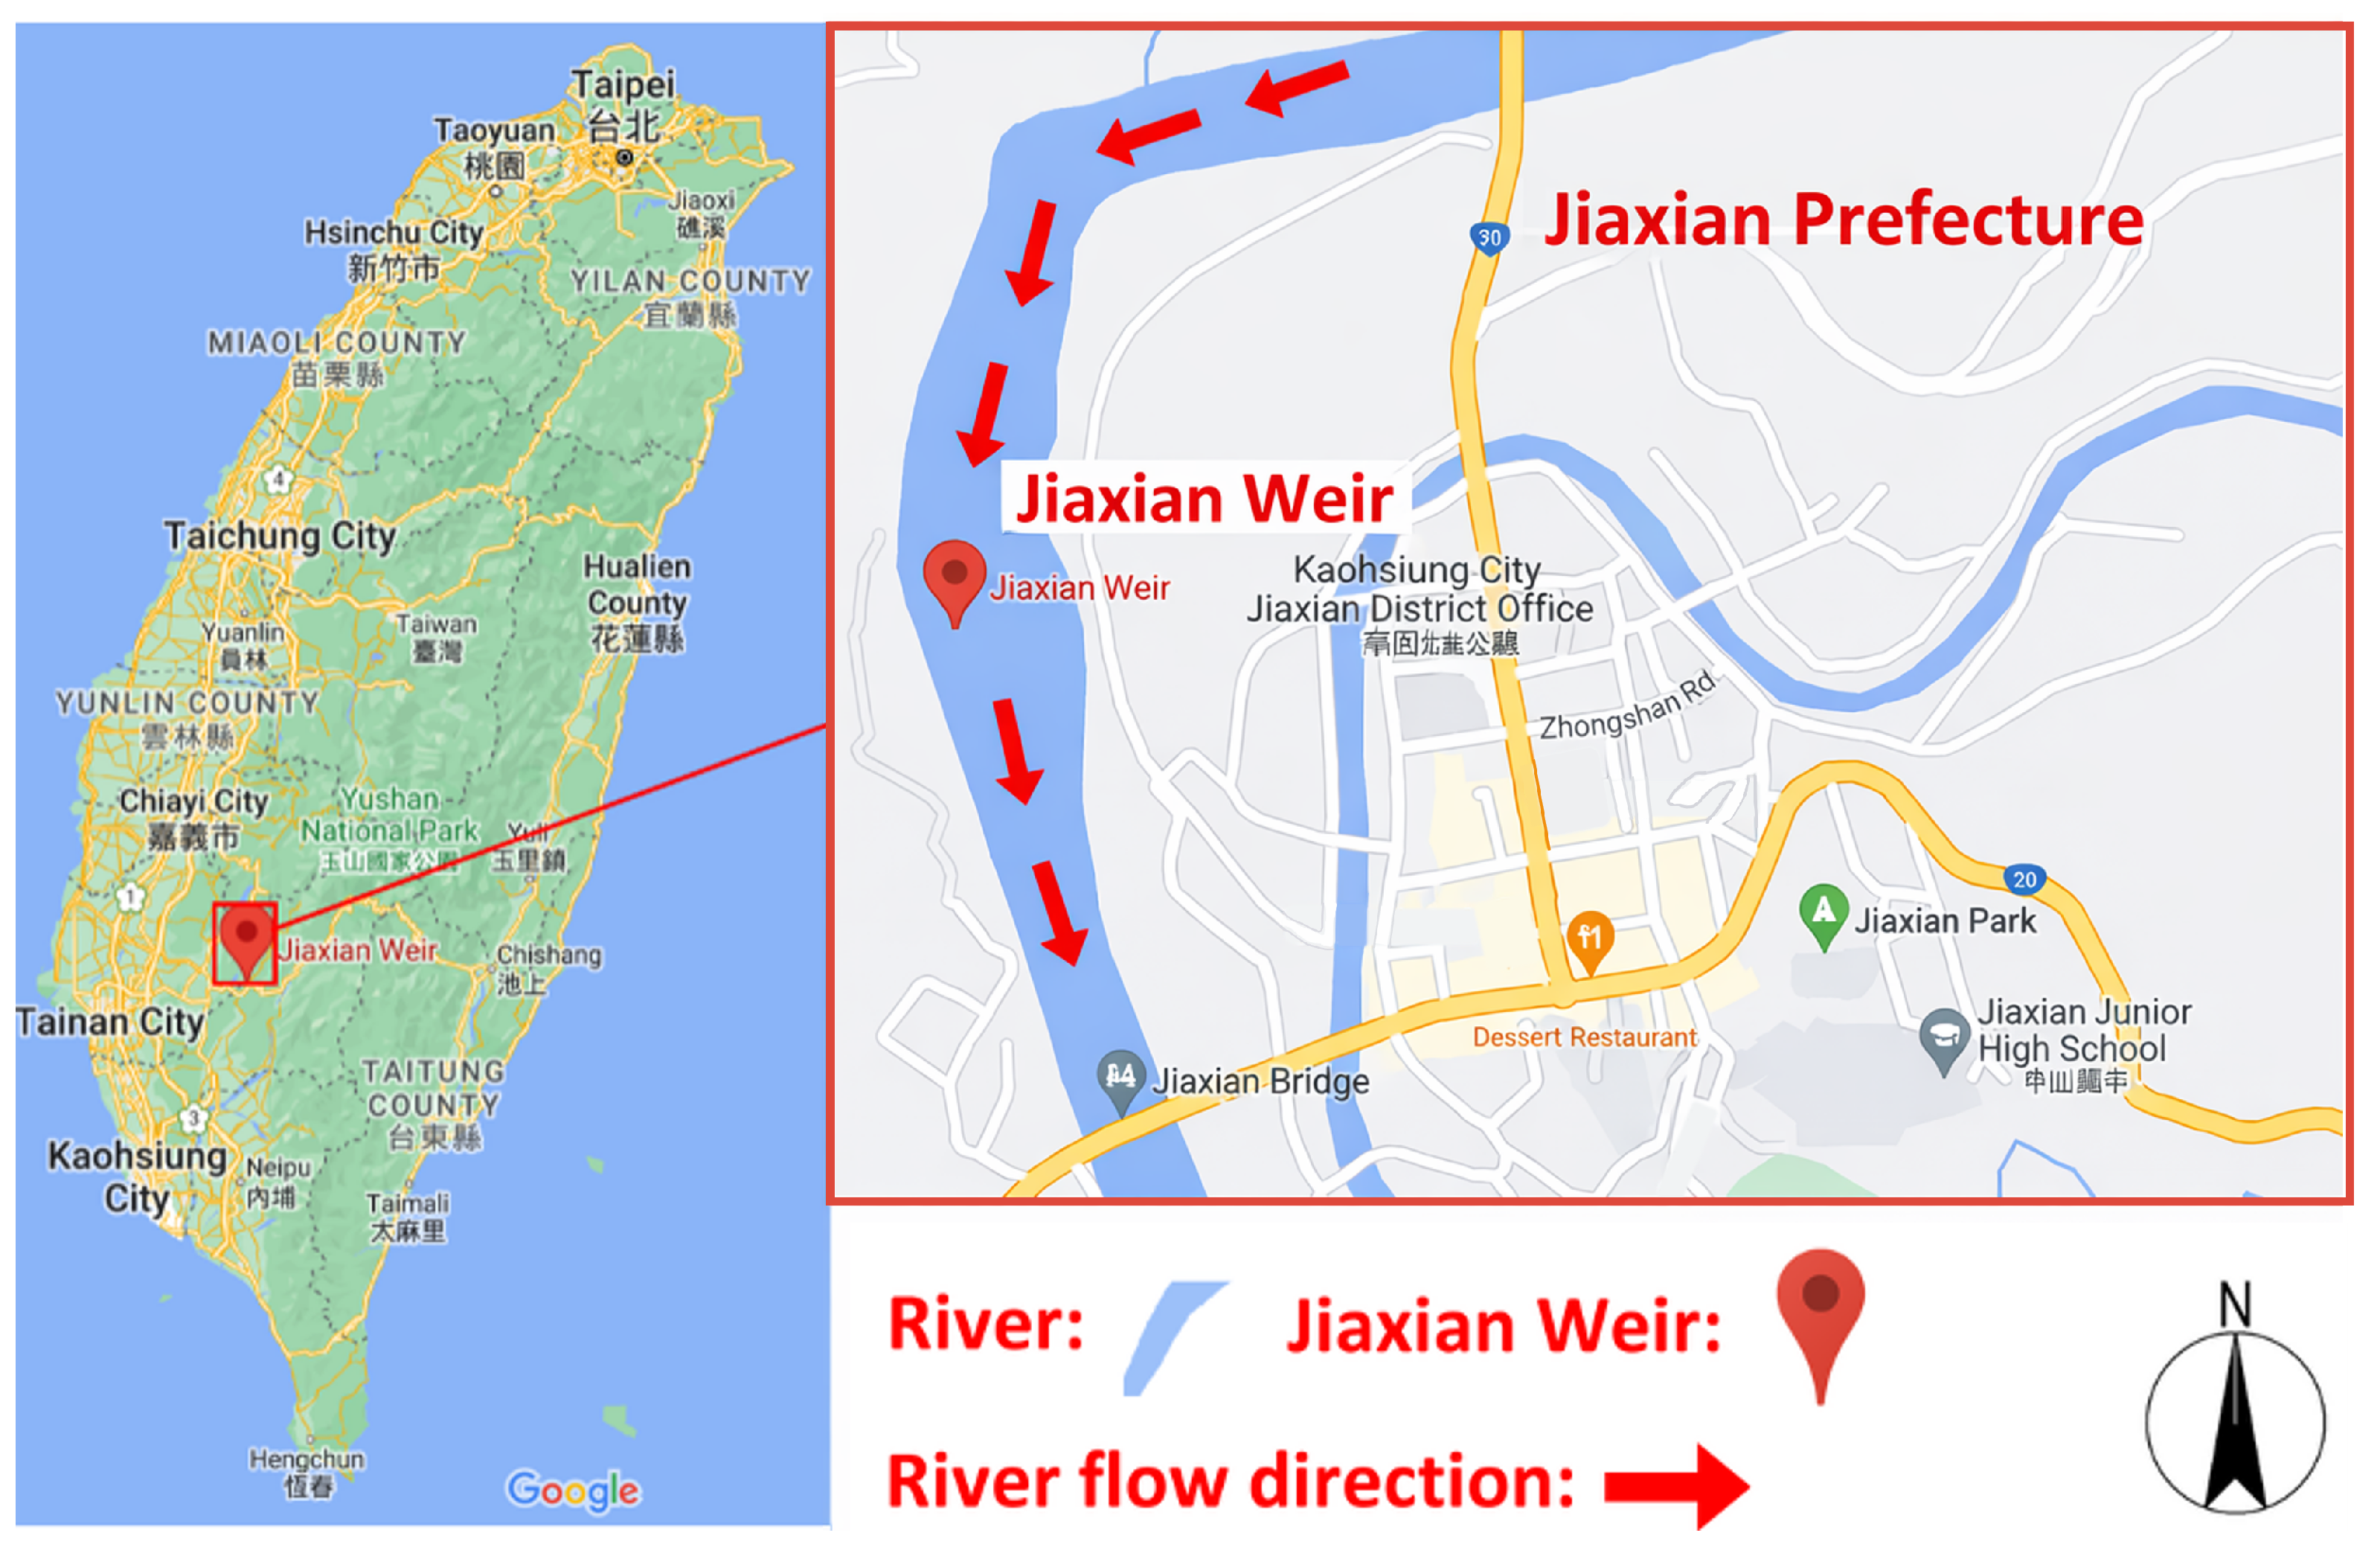
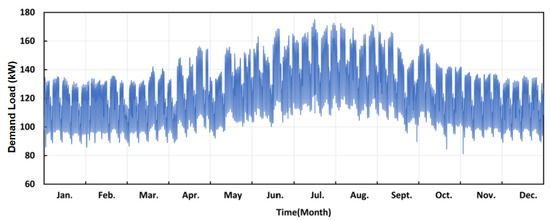
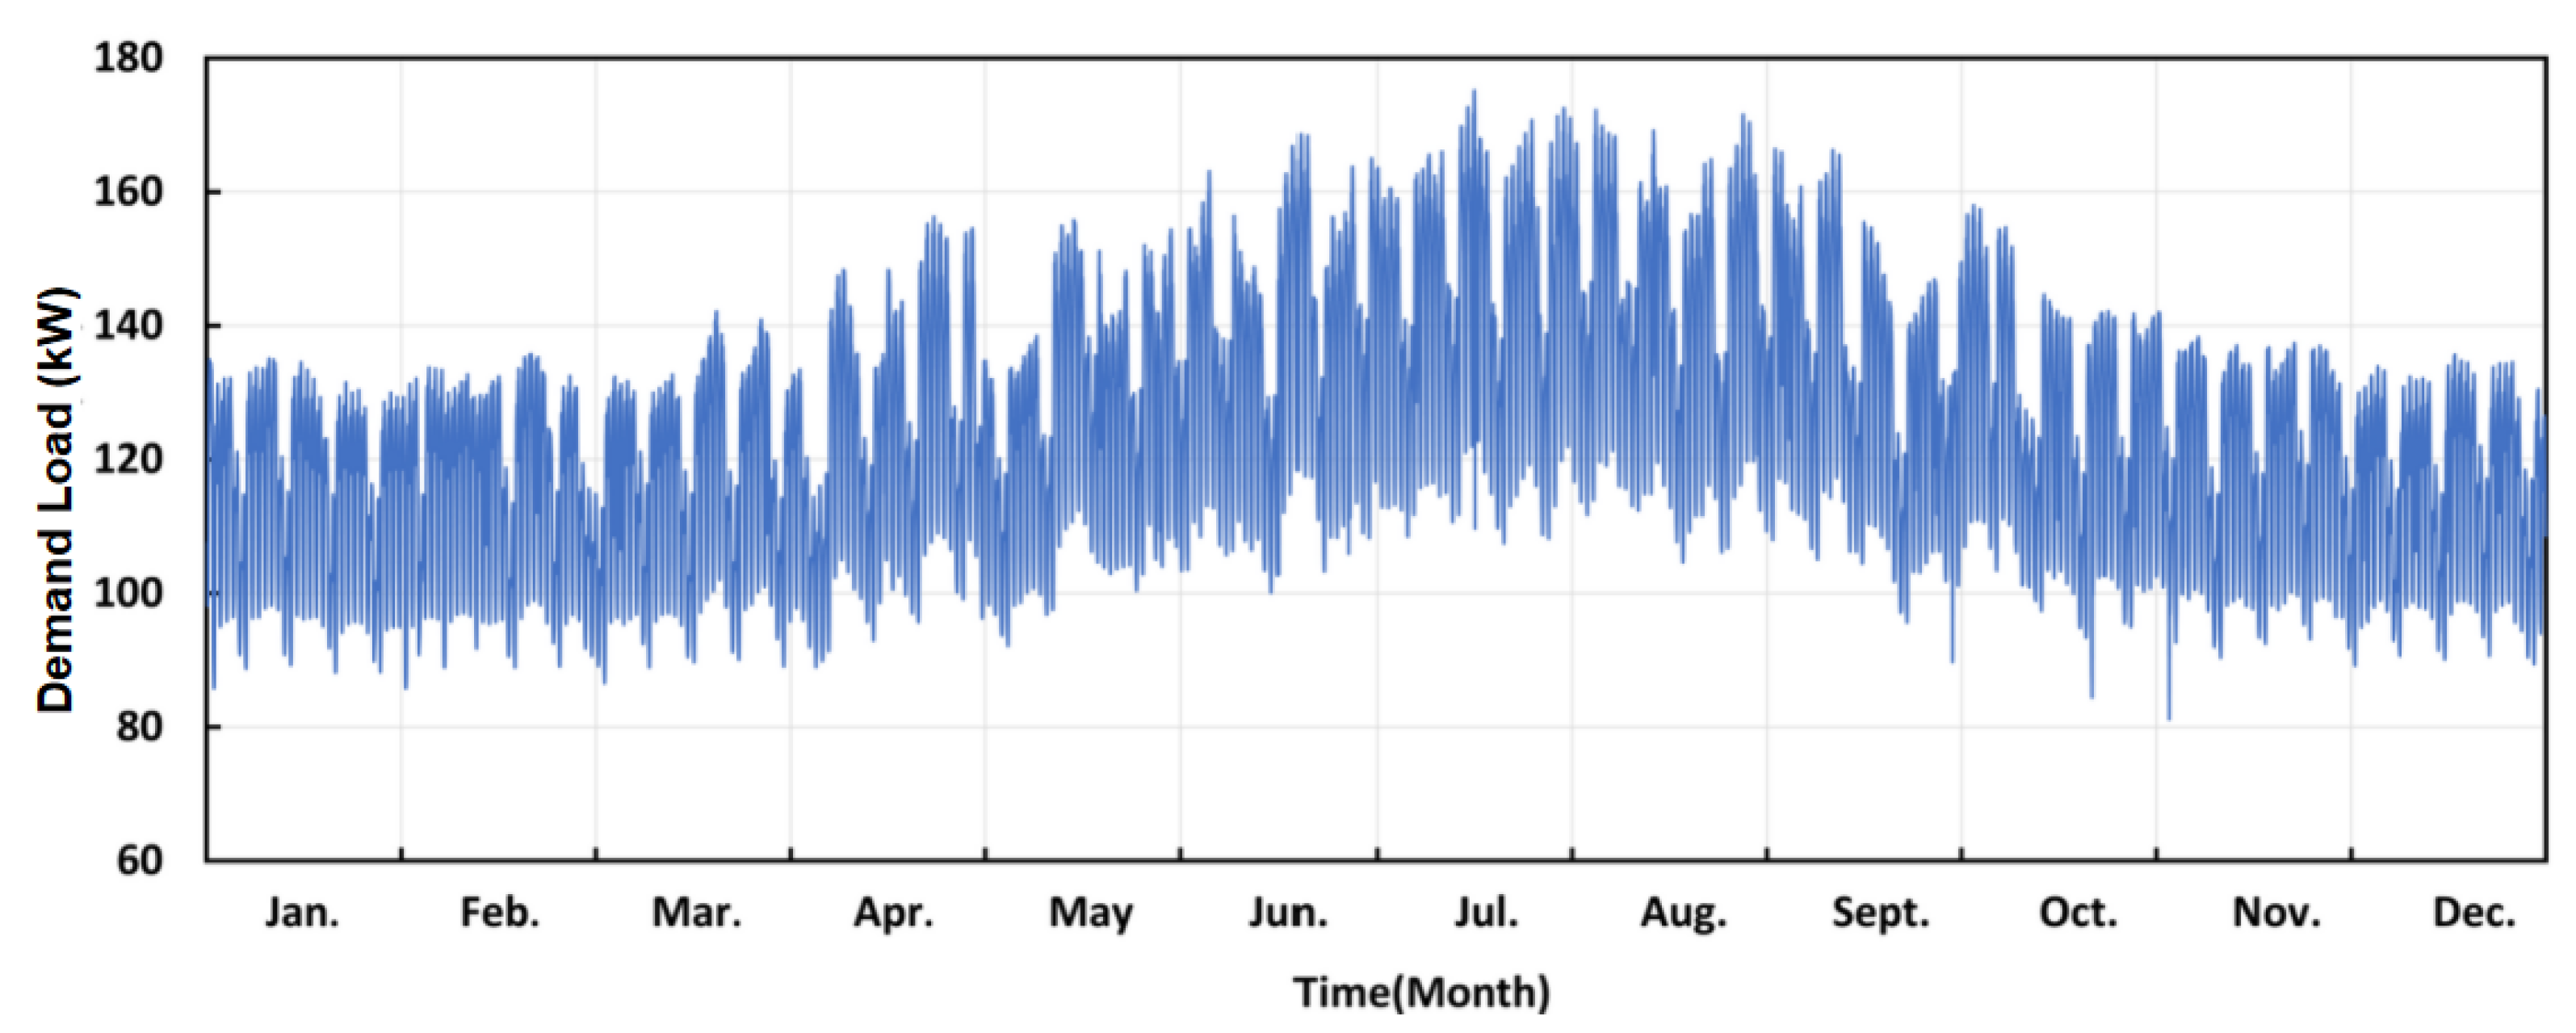
The case study corresponds to the study site as shown in Figure 6, located in a rural, mountainous context where RoR hydropower is viable and PV provides complementary daytime generation. The load data, shown in Figure 7, capture daily and seasonal variability relevant to microgrid sizing. Standard planning assumptions are applied: (i) a fixed simulation time step (hourly), (ii) component availability and conversion efficiencies as specified in the component models, and (iii) dispatch priority consistent with the system’s operational objectives (renewable-first with reliability safeguards). Such assumptions are consistent with contemporary off-grid microgrid planning practice [30,37,39].
Figure 6.
Location of the study area and river flow direction at Jiaxian Weir, Kaohsiung City, Taiwan.
Figure 7.
Hourly annual electrical demand profile used for simulation (8760 h).
2.4.2. Seasonal River-Flow Scenarios
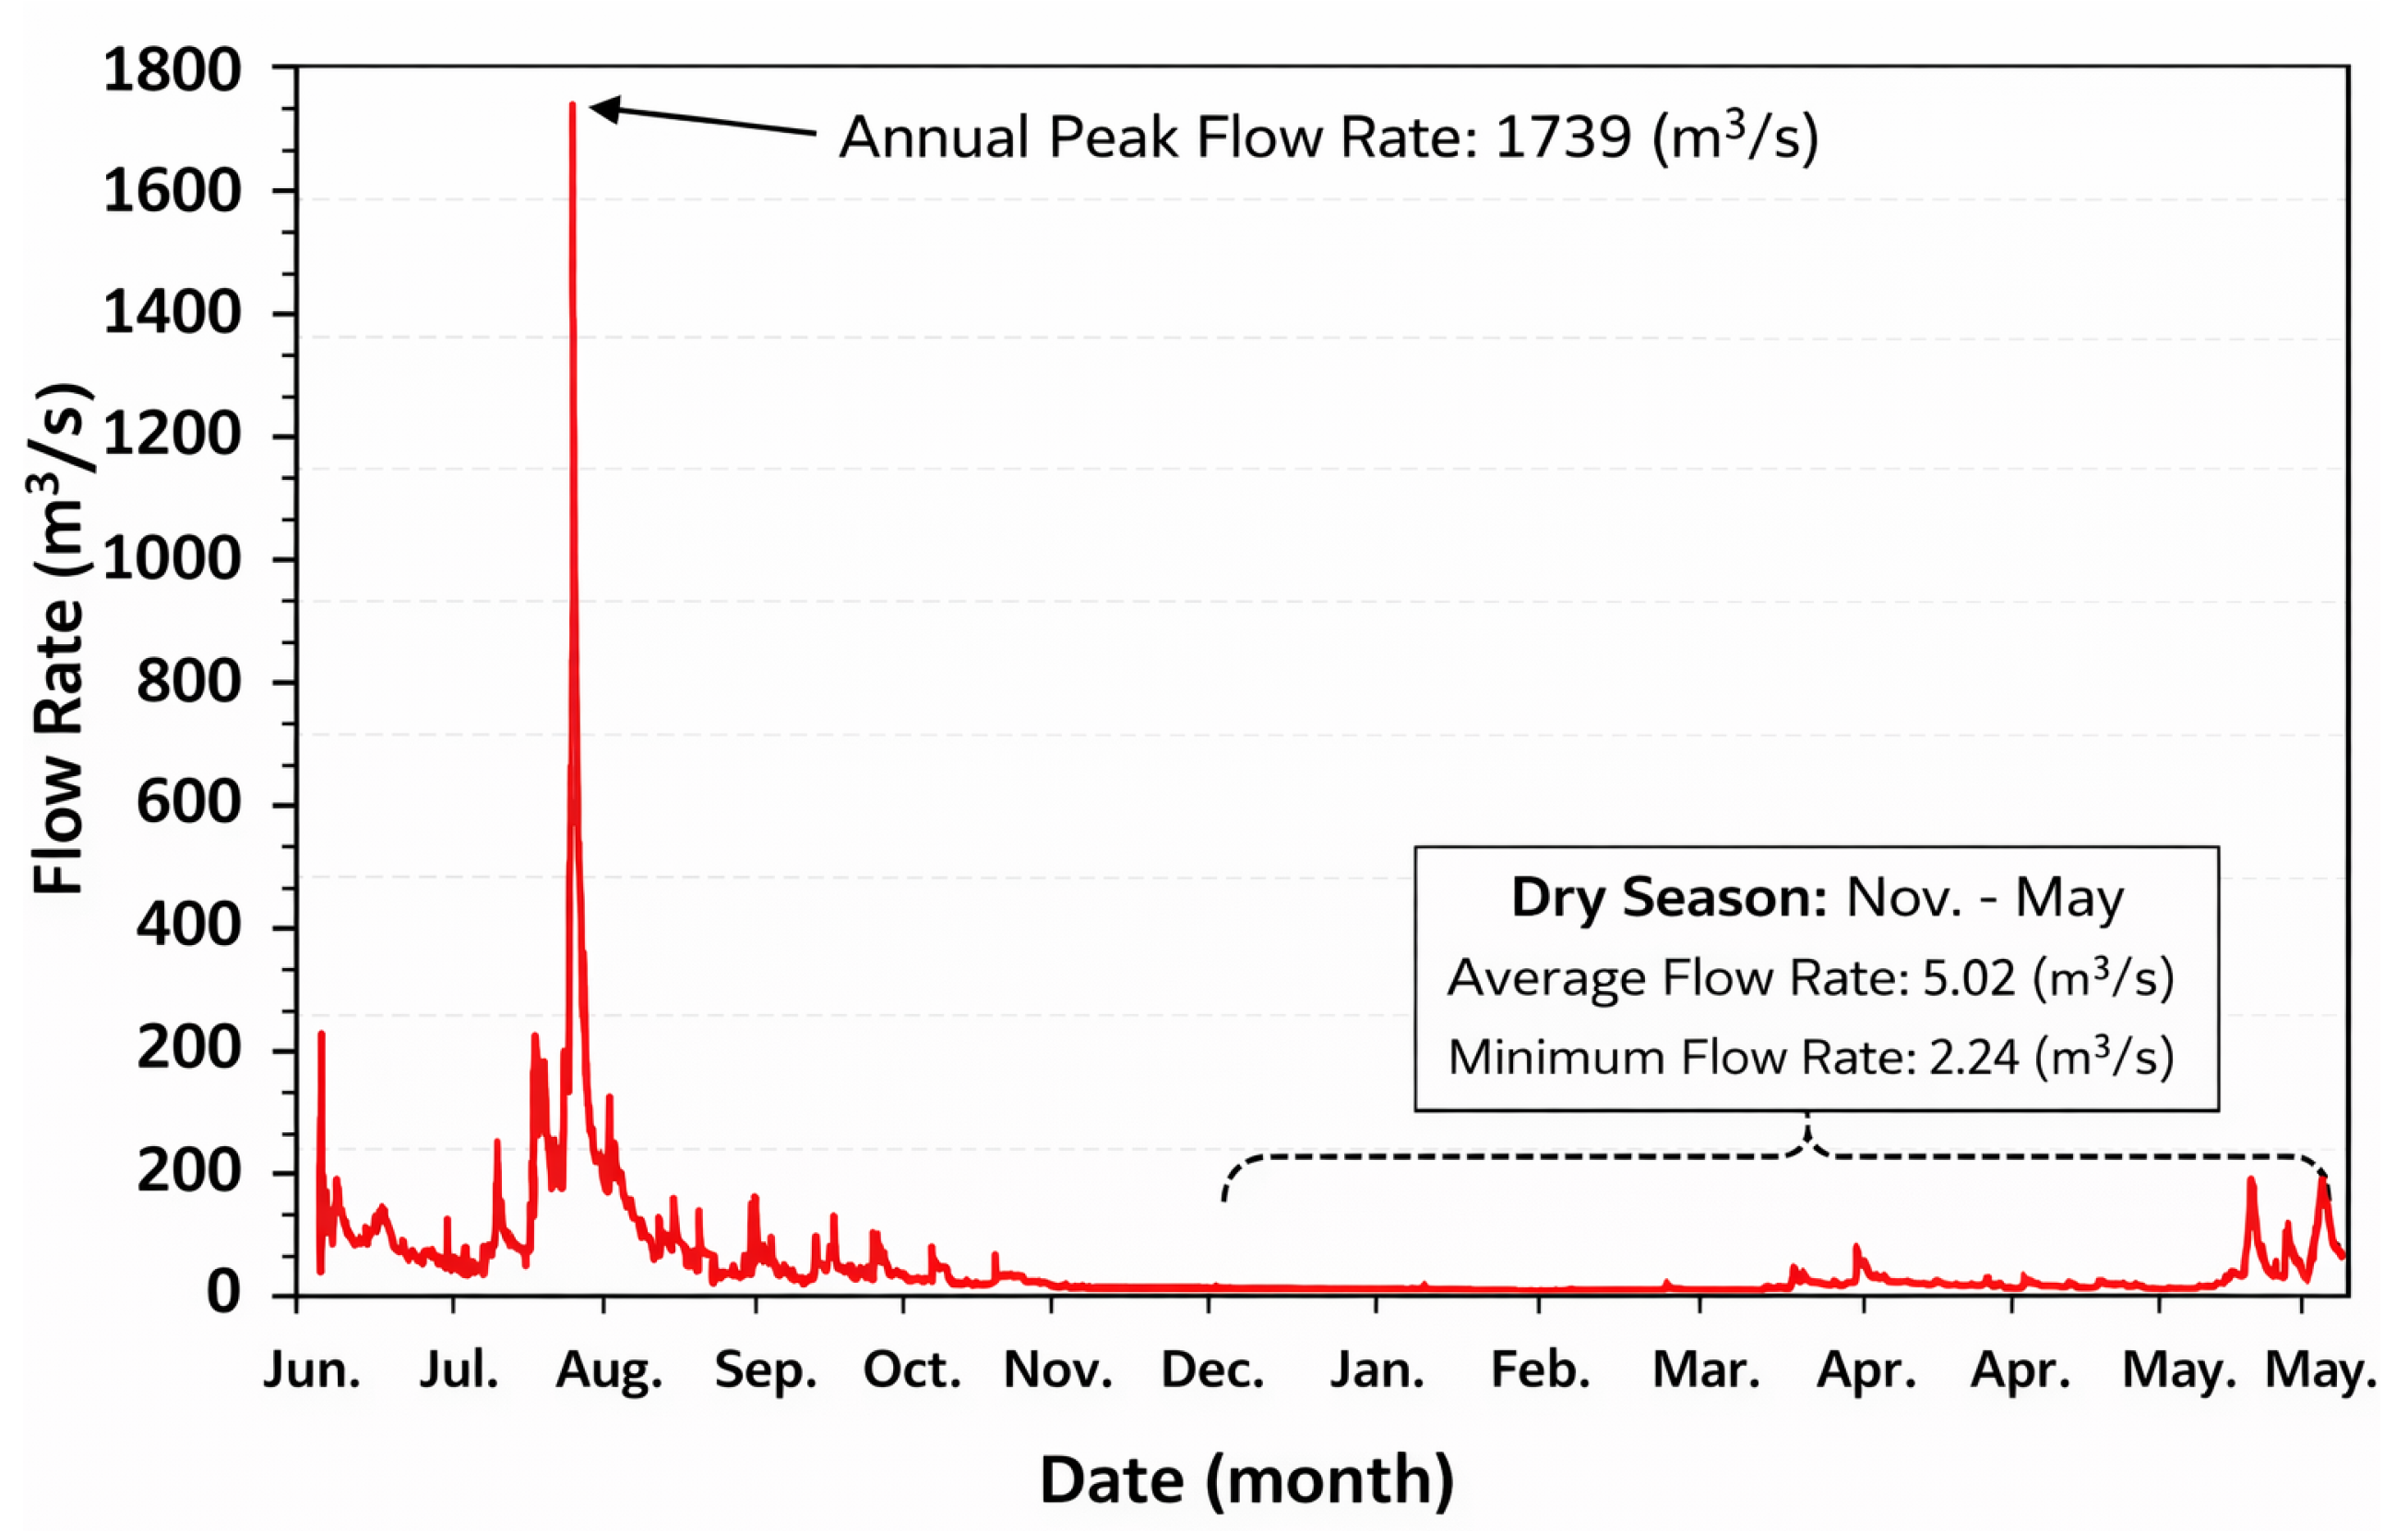
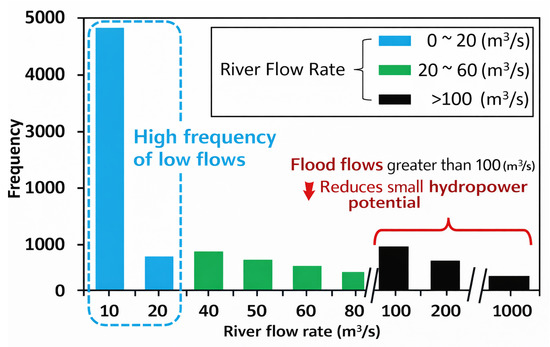
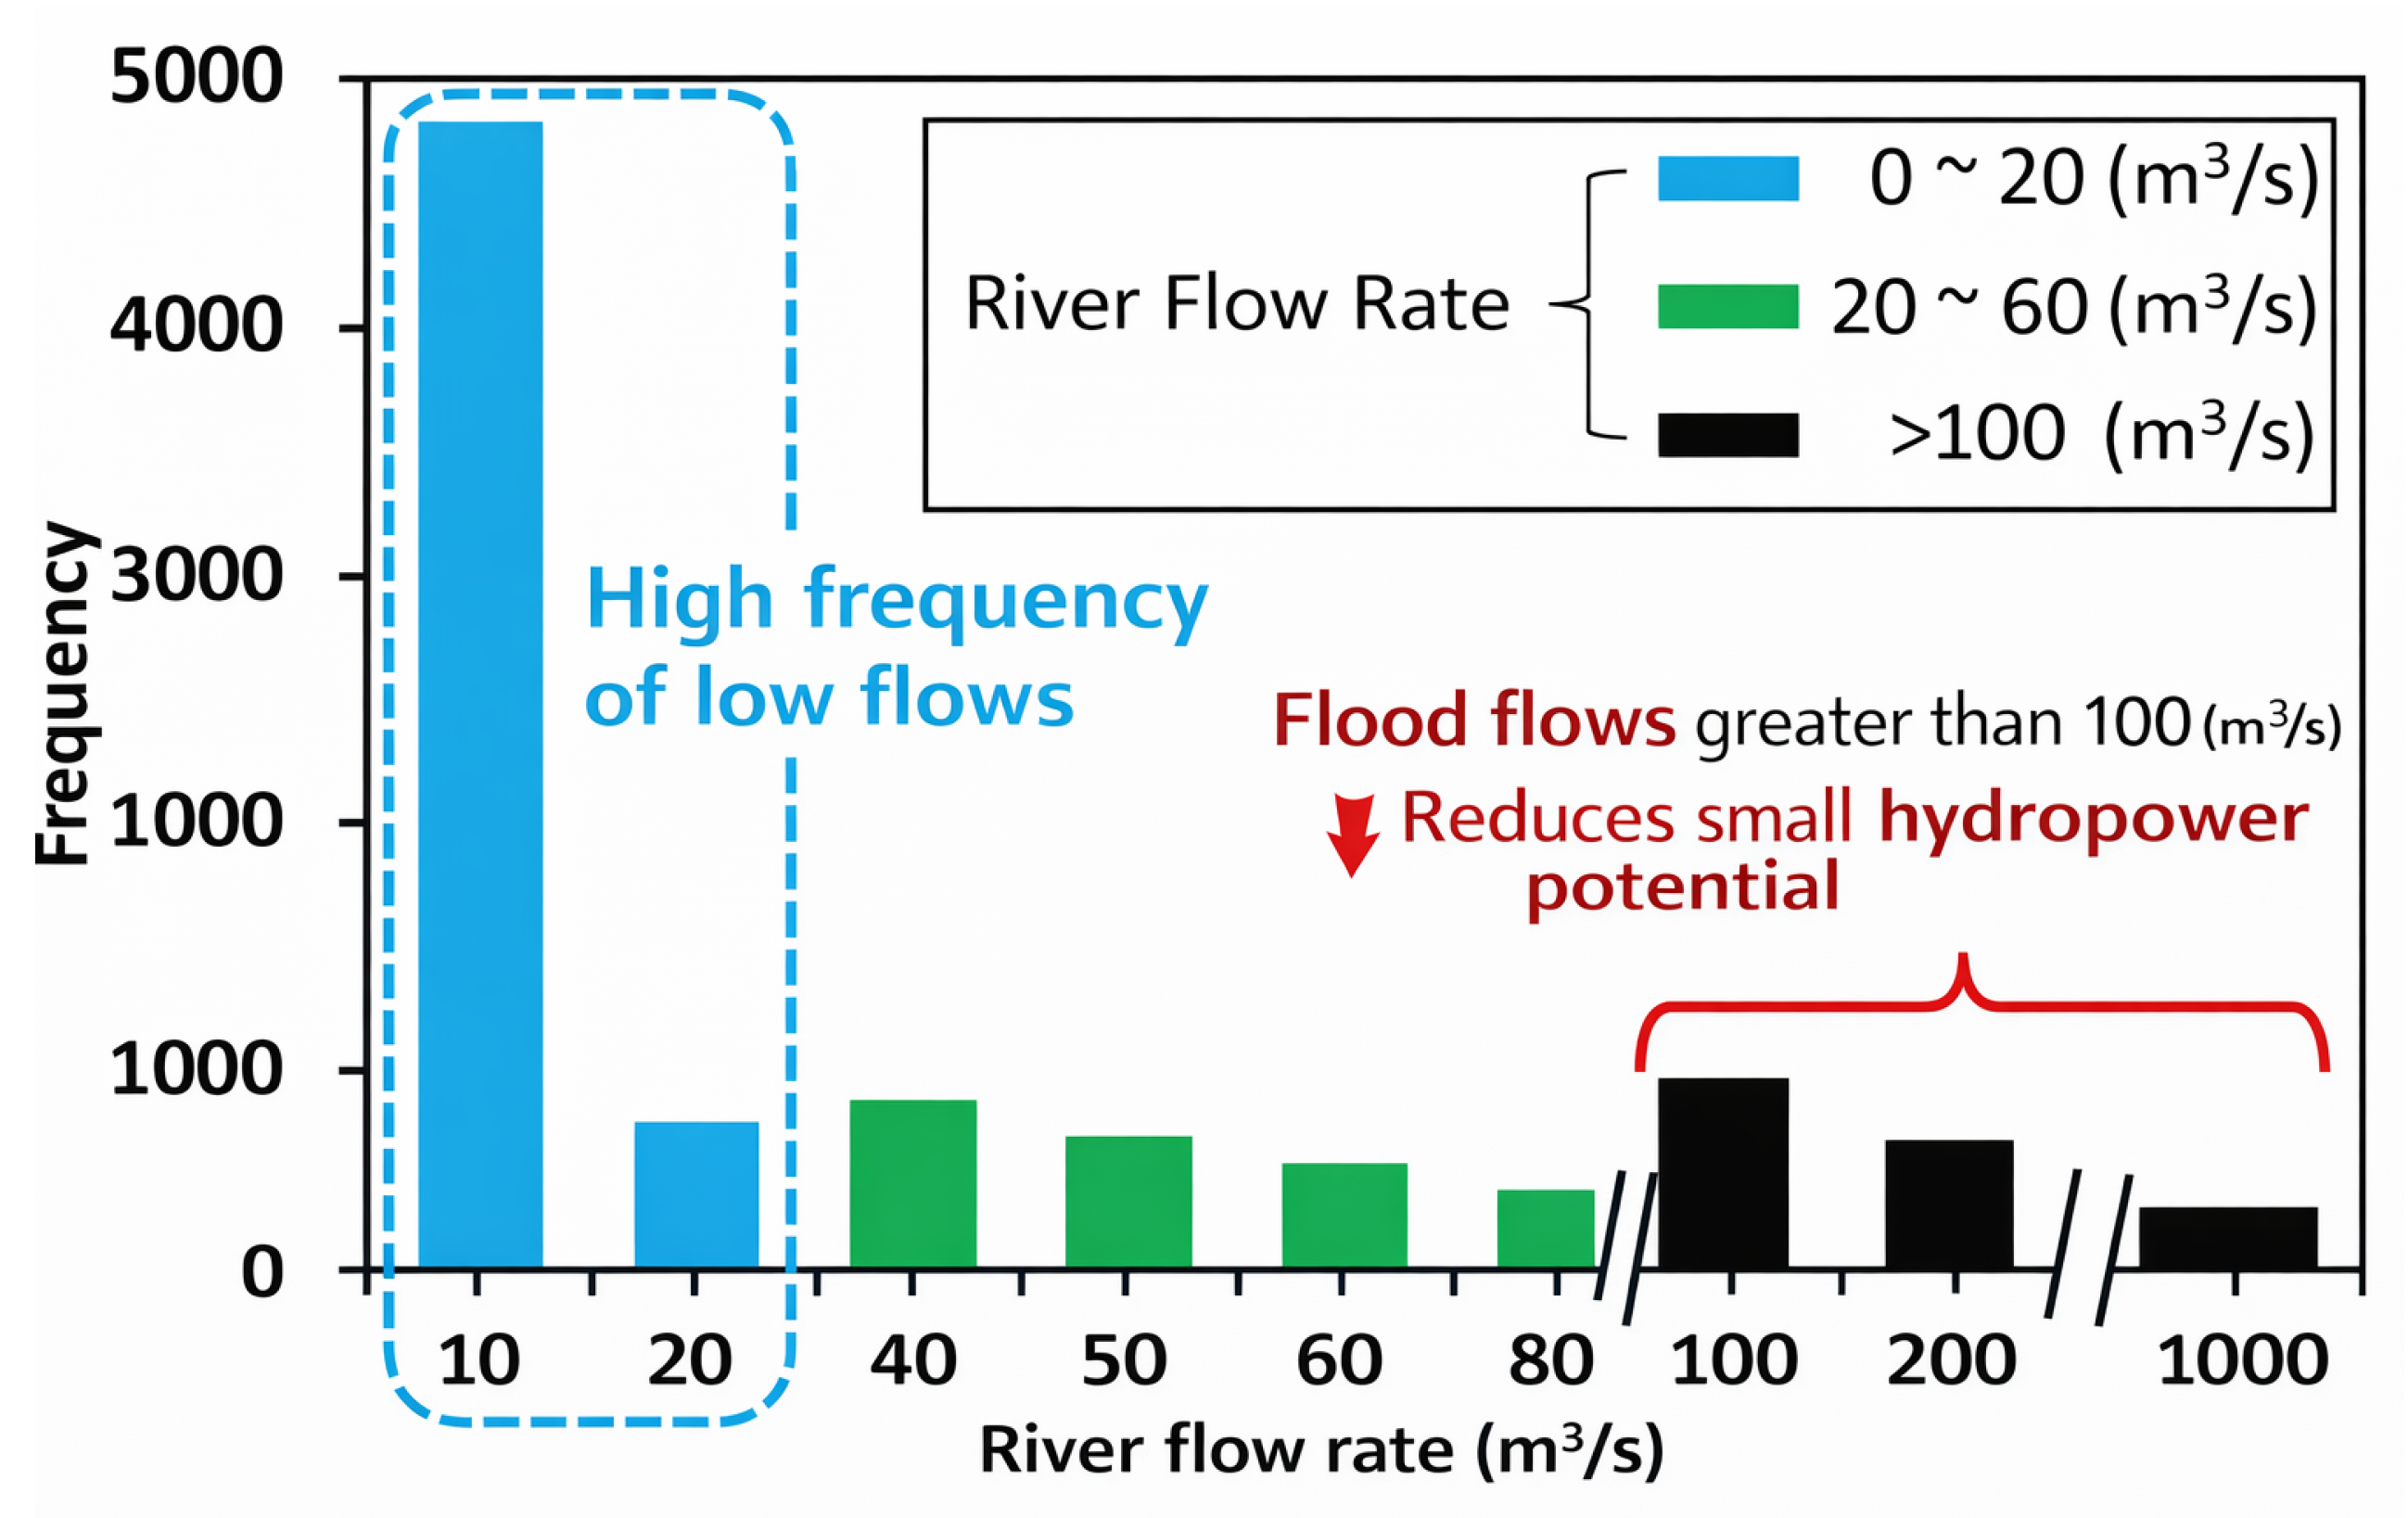
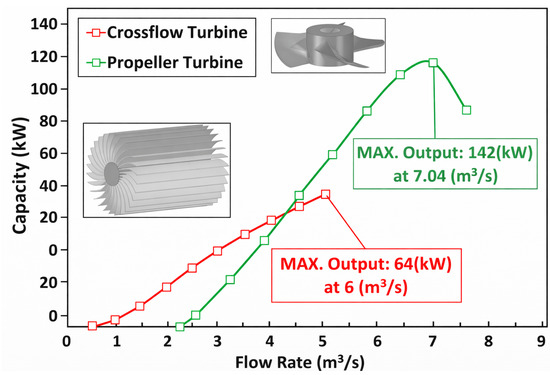
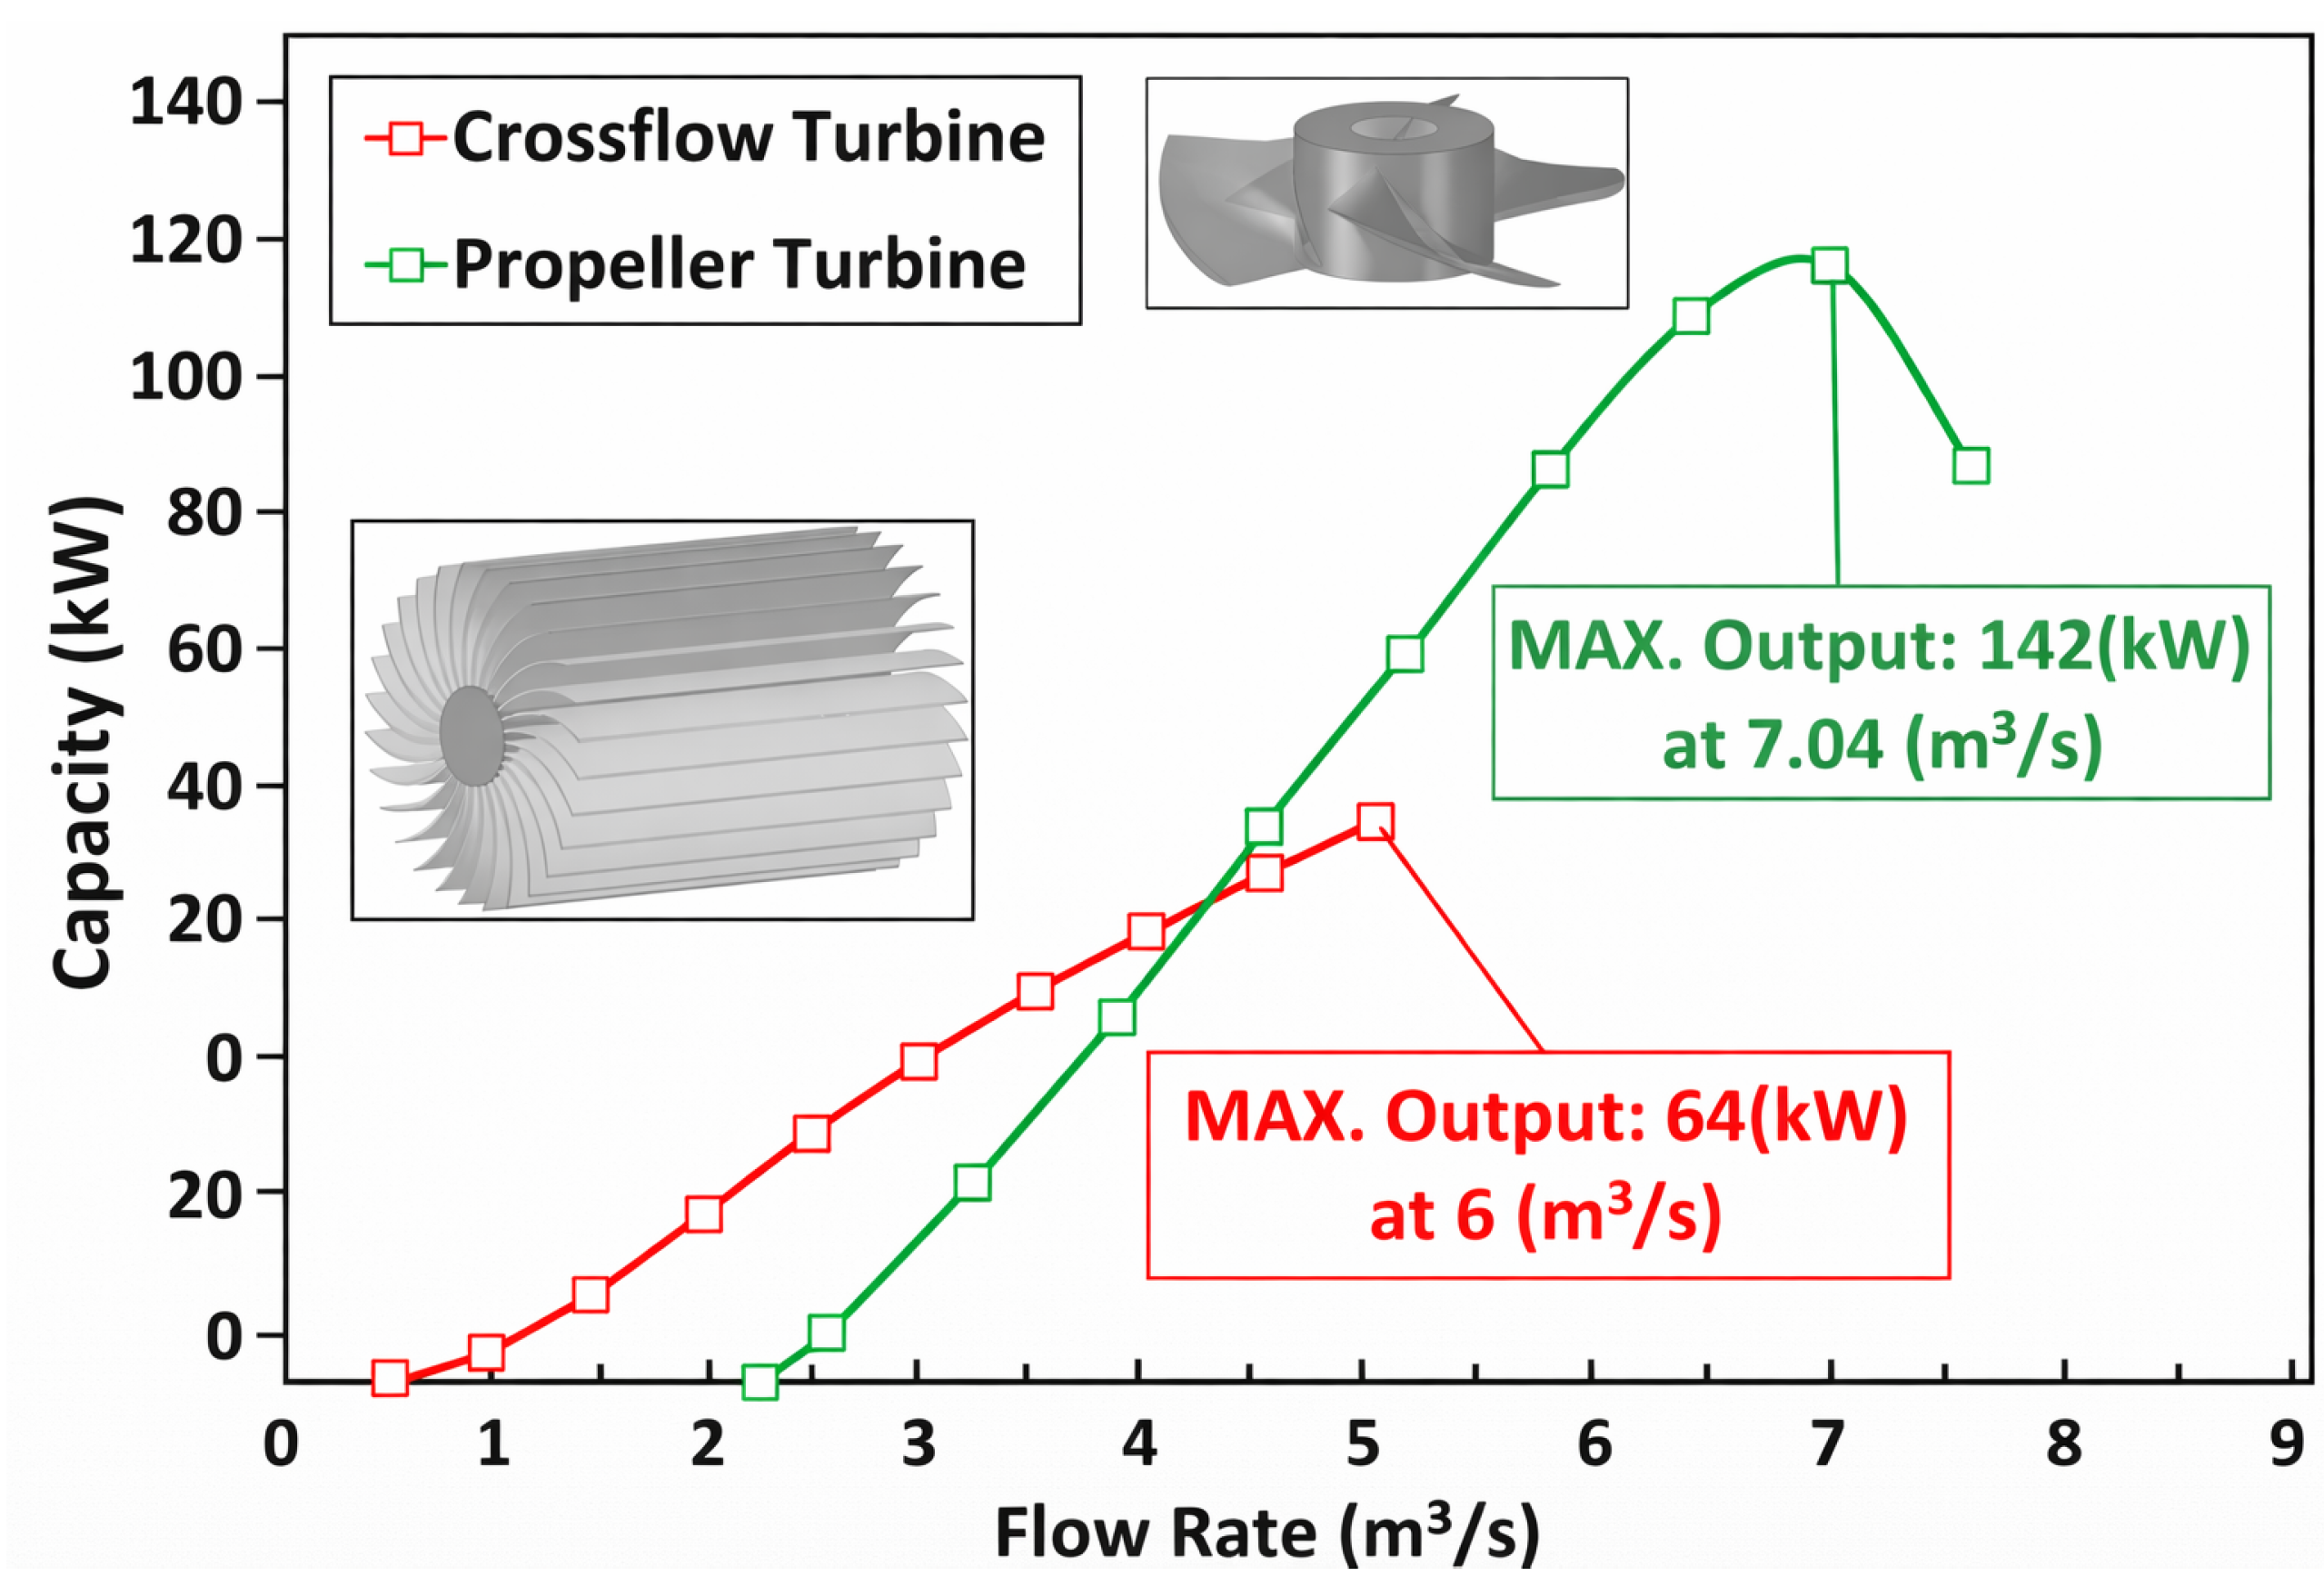
River-flow time-series data, as shown in Figure 8, are processed into representative seasonal scenarios (e.g., wet vs. dry season) and/or quantile-based scenarios derived from the flow distribution as illustrated in Figure 9. Each scenario provides a time series , which drives the hydro module constraints and turbine operability (Figure 10). This approach supports robust sizing by ensuring feasibility across low-flow conditions that often govern reliability outcomes in RoR systems [14,41,49].
Figure 8.
Observed hourly river discharge time series over one hydrological year (m3/s).
Figure 9.
Frequency distribution of annual river discharge after statistical processing, highlighting the prevalence of low-flow conditions and the occurrence of high-flow (flood) events.
Figure 10.
Power output characteristics of crossflow and propeller turbines as a function of flow rate.
2.4.3. PV Resource Scenarios and Temperature Effects
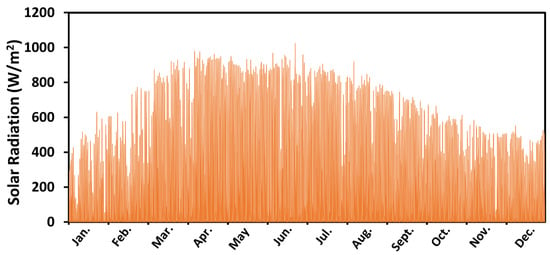
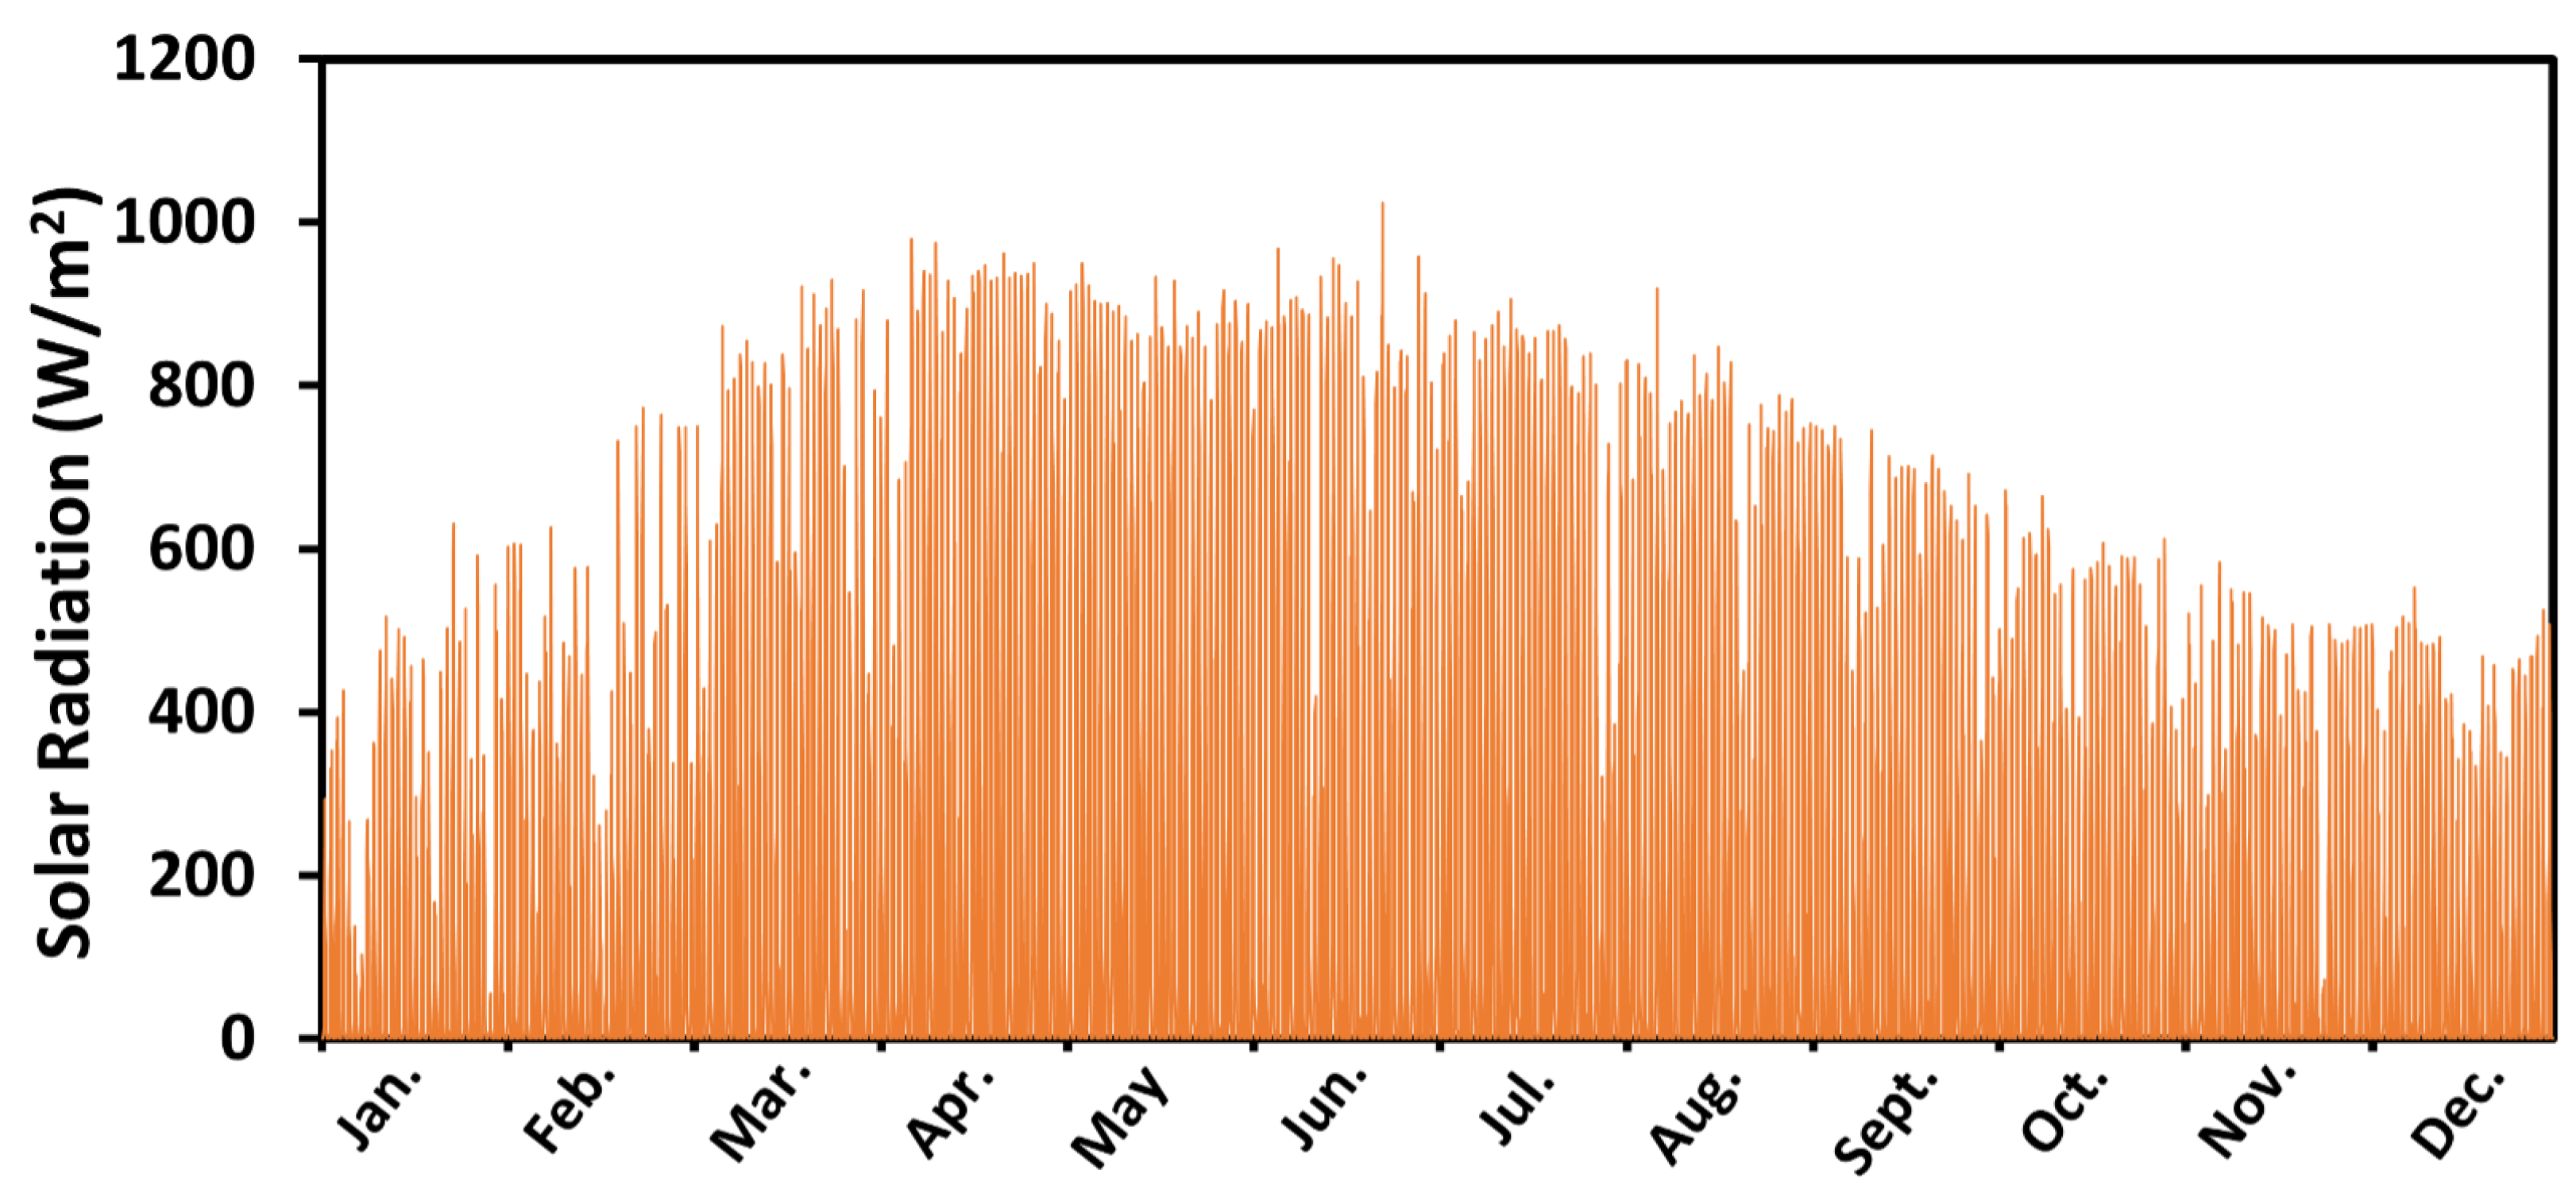
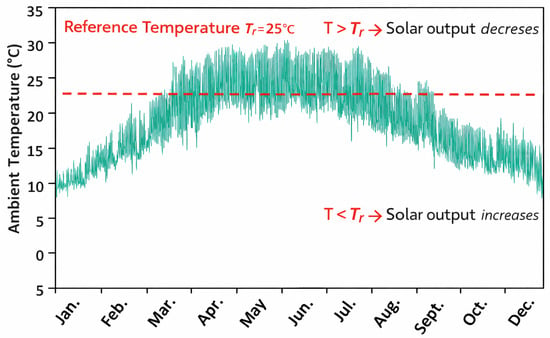
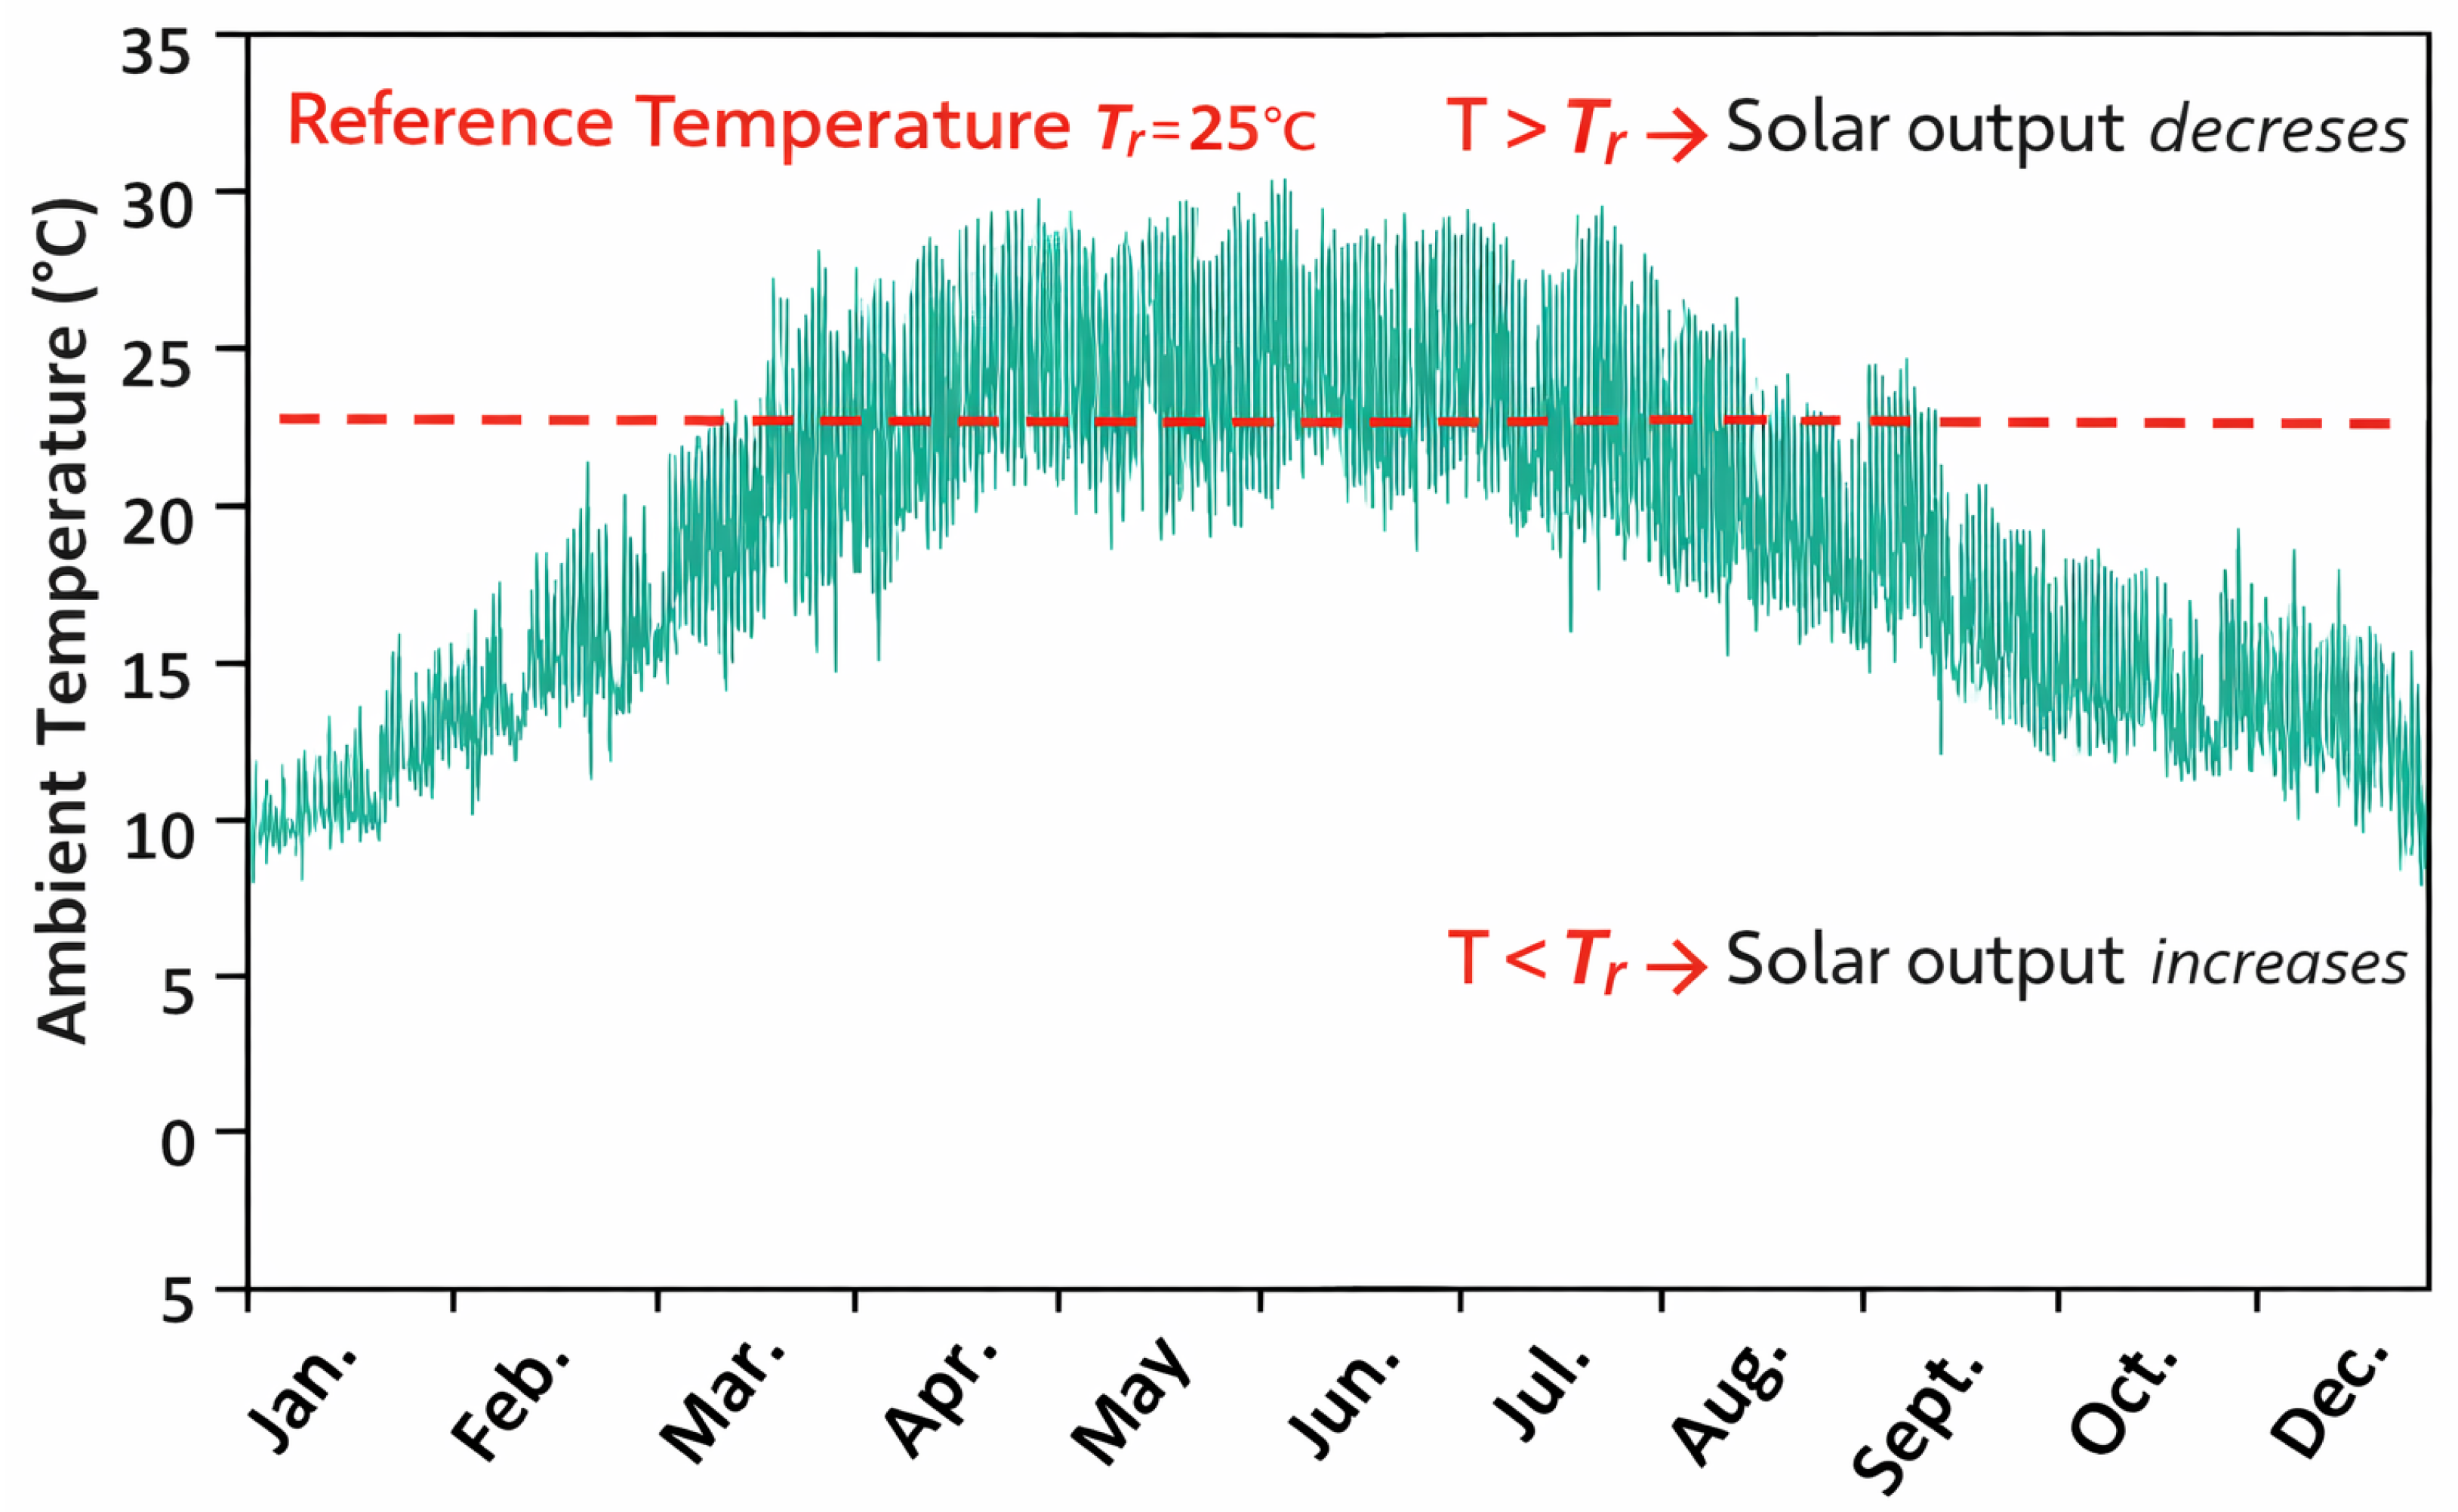
Solar resource scenarios are constructed using irradiance and ambient temperature characterizations provided in Figure 11 and Figure 12. For each scenario s, the PV model computes using irradiance-dependent conversion and temperature-adjusted efficiency. Including temperature effects improves realism in seasonal comparisons and avoids optimistic PV yield estimates, particularly in hot seasons where module temperature reduces conversion efficiency [45,46]. The PV scenarios are paired with river-flow scenarios to reflect hydro–solar complementarity, which has been shown to improve supply adequacy and reduce curtailment in hybrid planning [40,41,43,44].
Figure 11.
Hourly solar irradiance time series over a full year (8760 h) for the study area, used as the PV resource input for generation modeling and dispatch simulations.
Figure 12.
Hourly ambient temperature time series over a full year (8760 h) for the study area, with the reference temperature indicated for PV temperature-derating calculations.
2.4.4. Baseline Configurations for Comparison
To quantify the benefit of joint sizing and optimized dispatch, baseline configurations are defined in Table 6 and Table 7. At a minimum, the baselines include: (i) hydro-only (RoR with turbine feasibility constraints), (ii) hydro+PV without storage, (iii) hydro+PV+BESS (and optional DG backup). Each baseline is simulated under identical load and resource scenarios, enabling consistent comparisons of LCOE/NPC, LPSP/EENS, renewable fraction, curtailment, and emissions. Baseline benchmarking is standard in recent hybrid microgrid design studies and supports transparent performance attribution [30,36,37,39].
Table 6.
Decision variables for the selected solutions.
Table 7.
Objective-function values for the selected solutions.
2.5. Scenario Construction
Scenario sets were constructed deterministically from the baseline hourly time series of river discharge , irradiance , ambient temperature , and load . Each scenario s is defined by a tuple of scaling factors and/or seasonal selections applied to the baseline signals:
where represents flow severity (drought/wet-year stress), represents load-growth stress, and represents PV resource variability (optional). Ambient temperature is retained as measured for each hour, and PV output is computed using the temperature-dependent PV model.
In addition to scalar stress scenarios, seasonal scenarios were defined by restricting attention to specific month sets while preserving the original intra-day variability. The dry-season months were defined as November–May and the wet-season months as June–October. For seasonal reporting, metrics (e.g., LPSP, diesel energy, curtailment) were computed both annually and by season using:
where and are the hourly index sets of dry and wet months, respectively. Unless otherwise stated, equal weights were assigned to stress scenarios when summarizing robustness.
3. Results
3.1. Input Data Characterization and Model Checks
This section summarizes the key input datasets (load, hydrology, solar resource, and ambient temperature) and verifies that preprocessing and model interfaces are consistent with the hourly simulation horizon (8760 h). The electrical demand profile is represented as an hourly annual series for the target community, preserving seasonal and diurnal variability. The hydrological dataset exhibits strong seasonality and extreme wet-season events; therefore, both the hourly flow series and its statistical distribution are used to characterize operating regimes and verify that turbine limits correctly screen infeasible conditions (e.g., shutdown when flow exceeds the allowable operating envelope). The solar irradiance and ambient temperature series are likewise checked for continuity, physical bounds, and consistency with the PV temperature-derating formulation used in the PV yield model.
Model checks. The following checks were performed prior to optimization: (i) completeness of all hourly vectors (no missing timestamps across 8760 h), (ii) non-negativity and physical bounds for irradiance, flow, and demand, (iii) turbine feasibility screening consistent with the turbine operating envelopes as shown in Figure 10, and (iv) dispatch bookkeeping consistency (energy balance at each hour with explicit accounting of unmet load and curtailment).
3.2. Optimization Convergence and Pareto Front
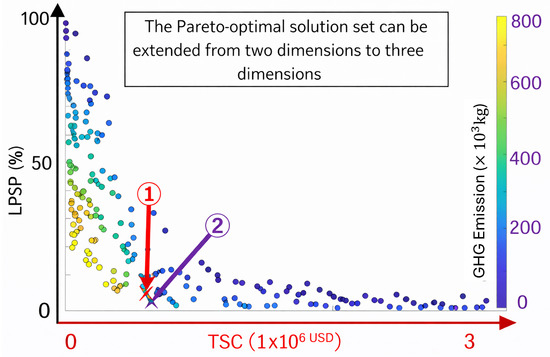
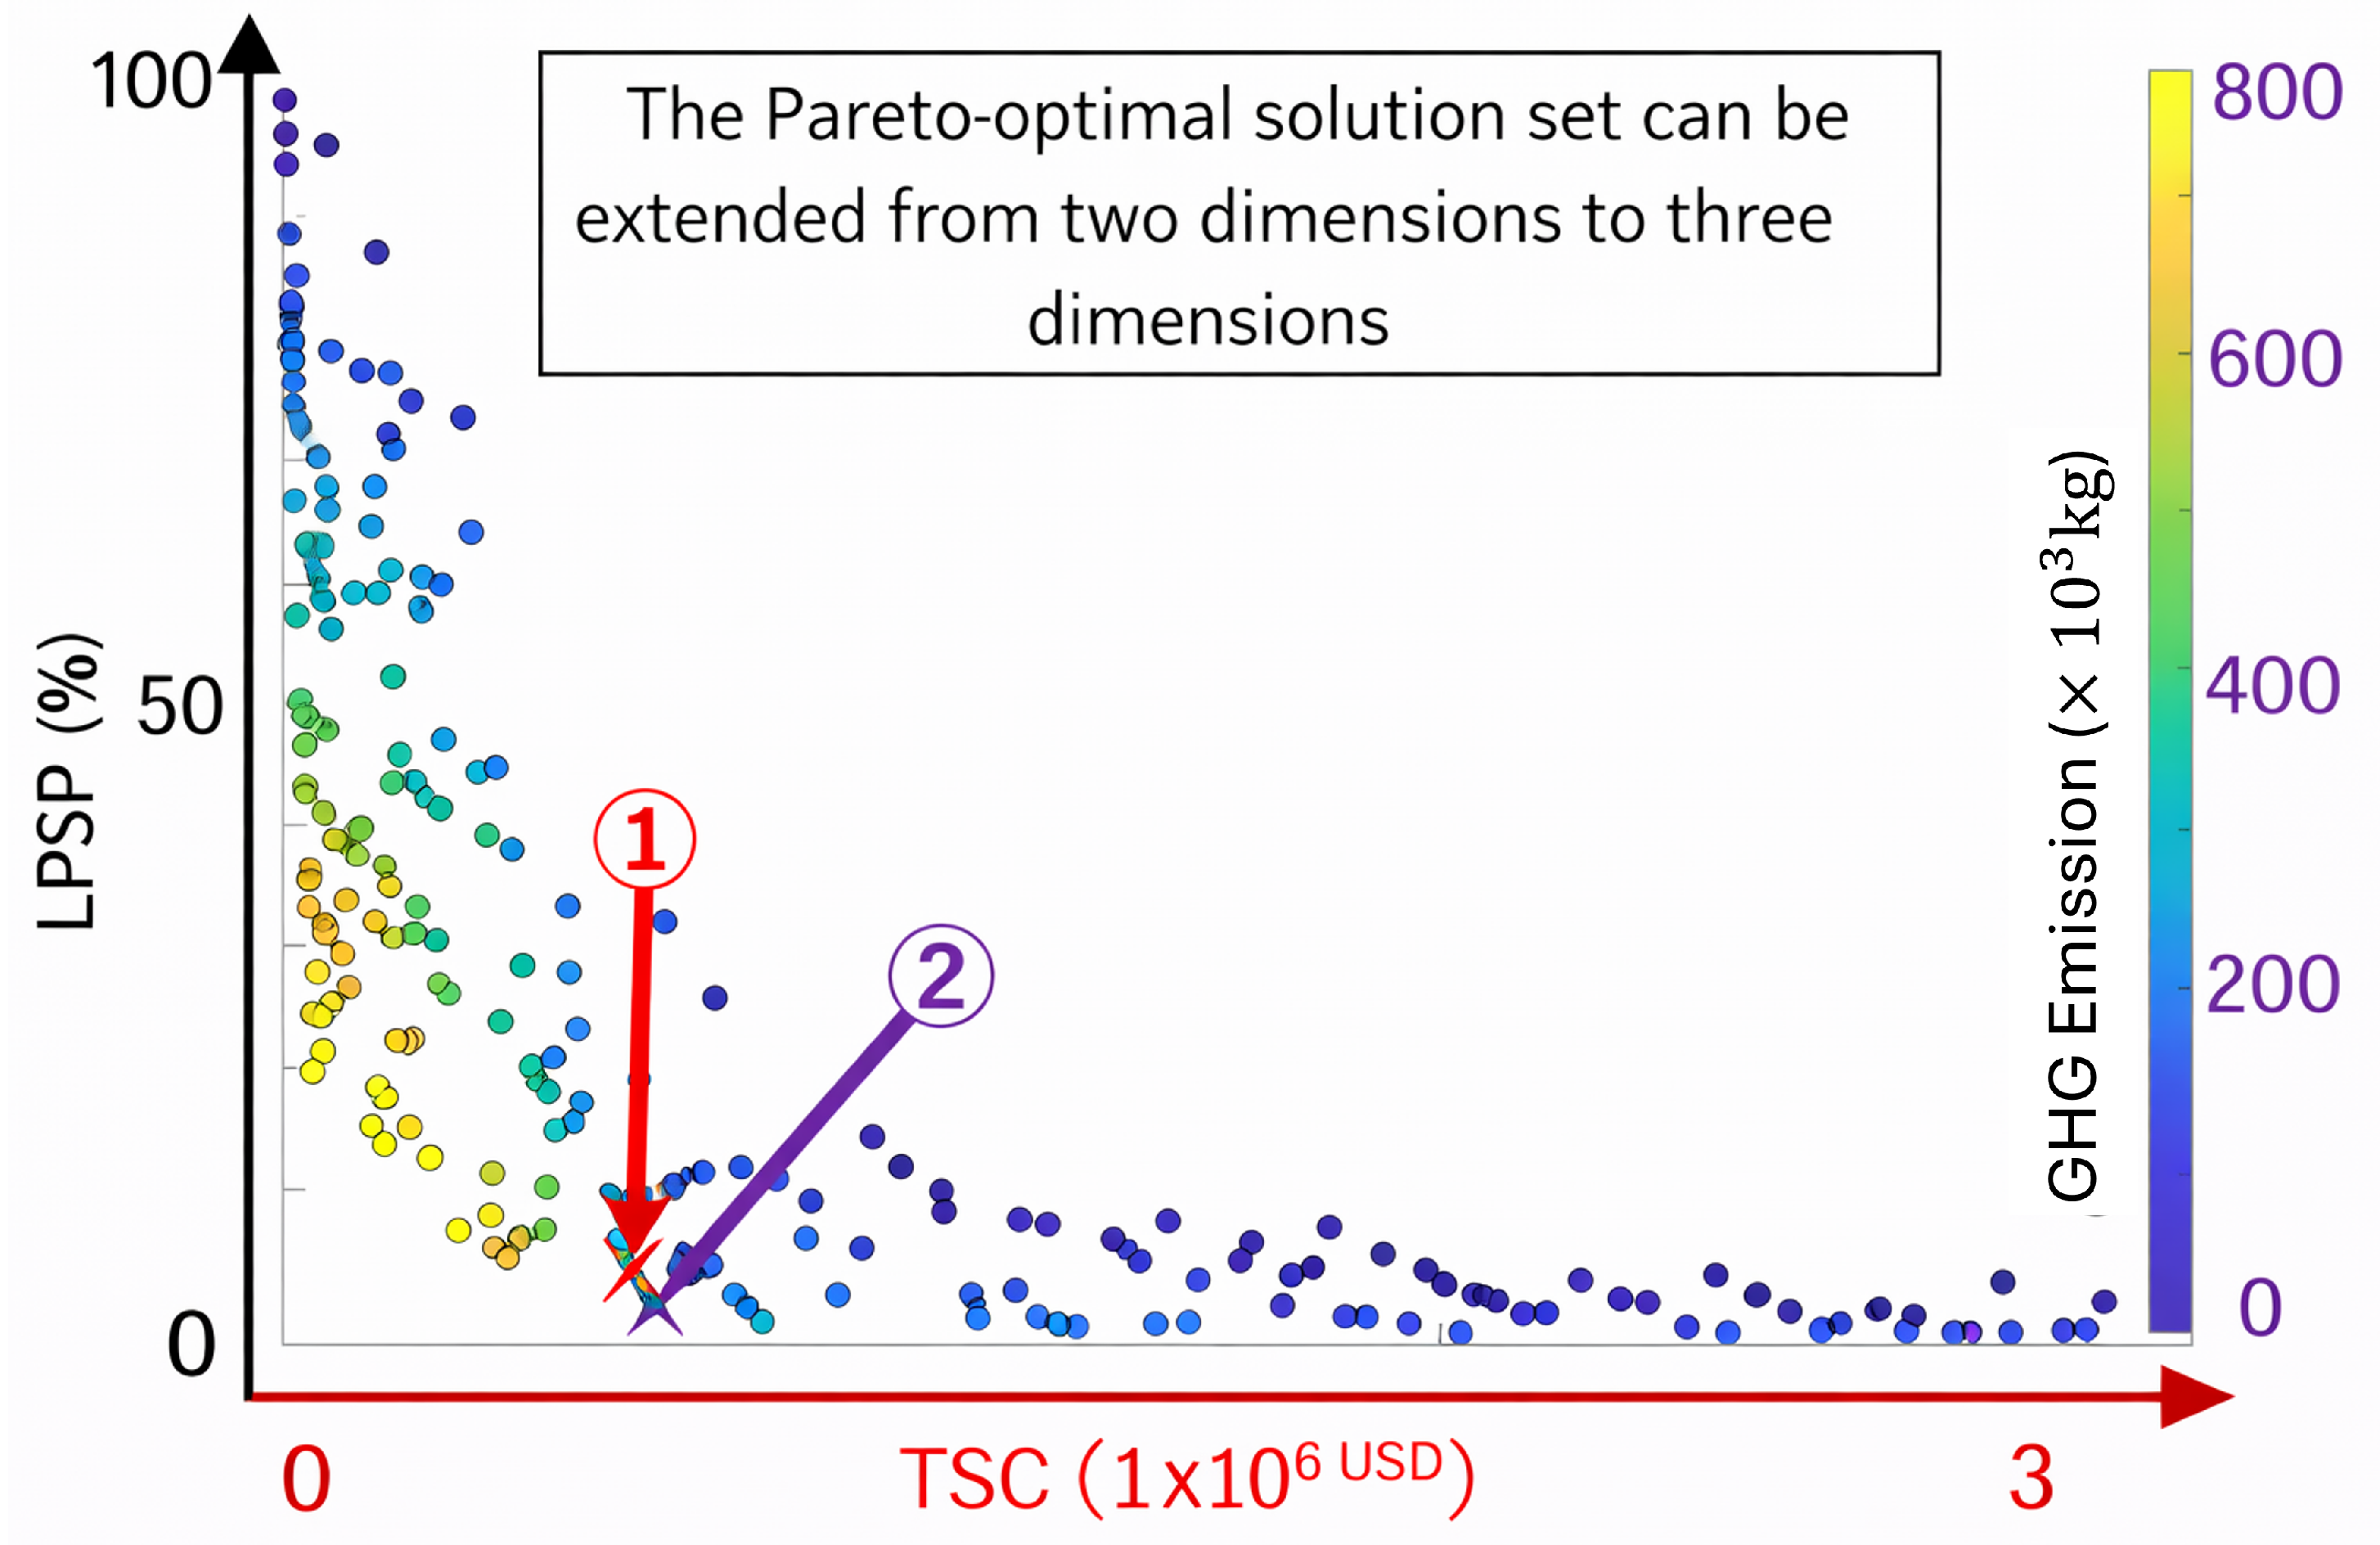
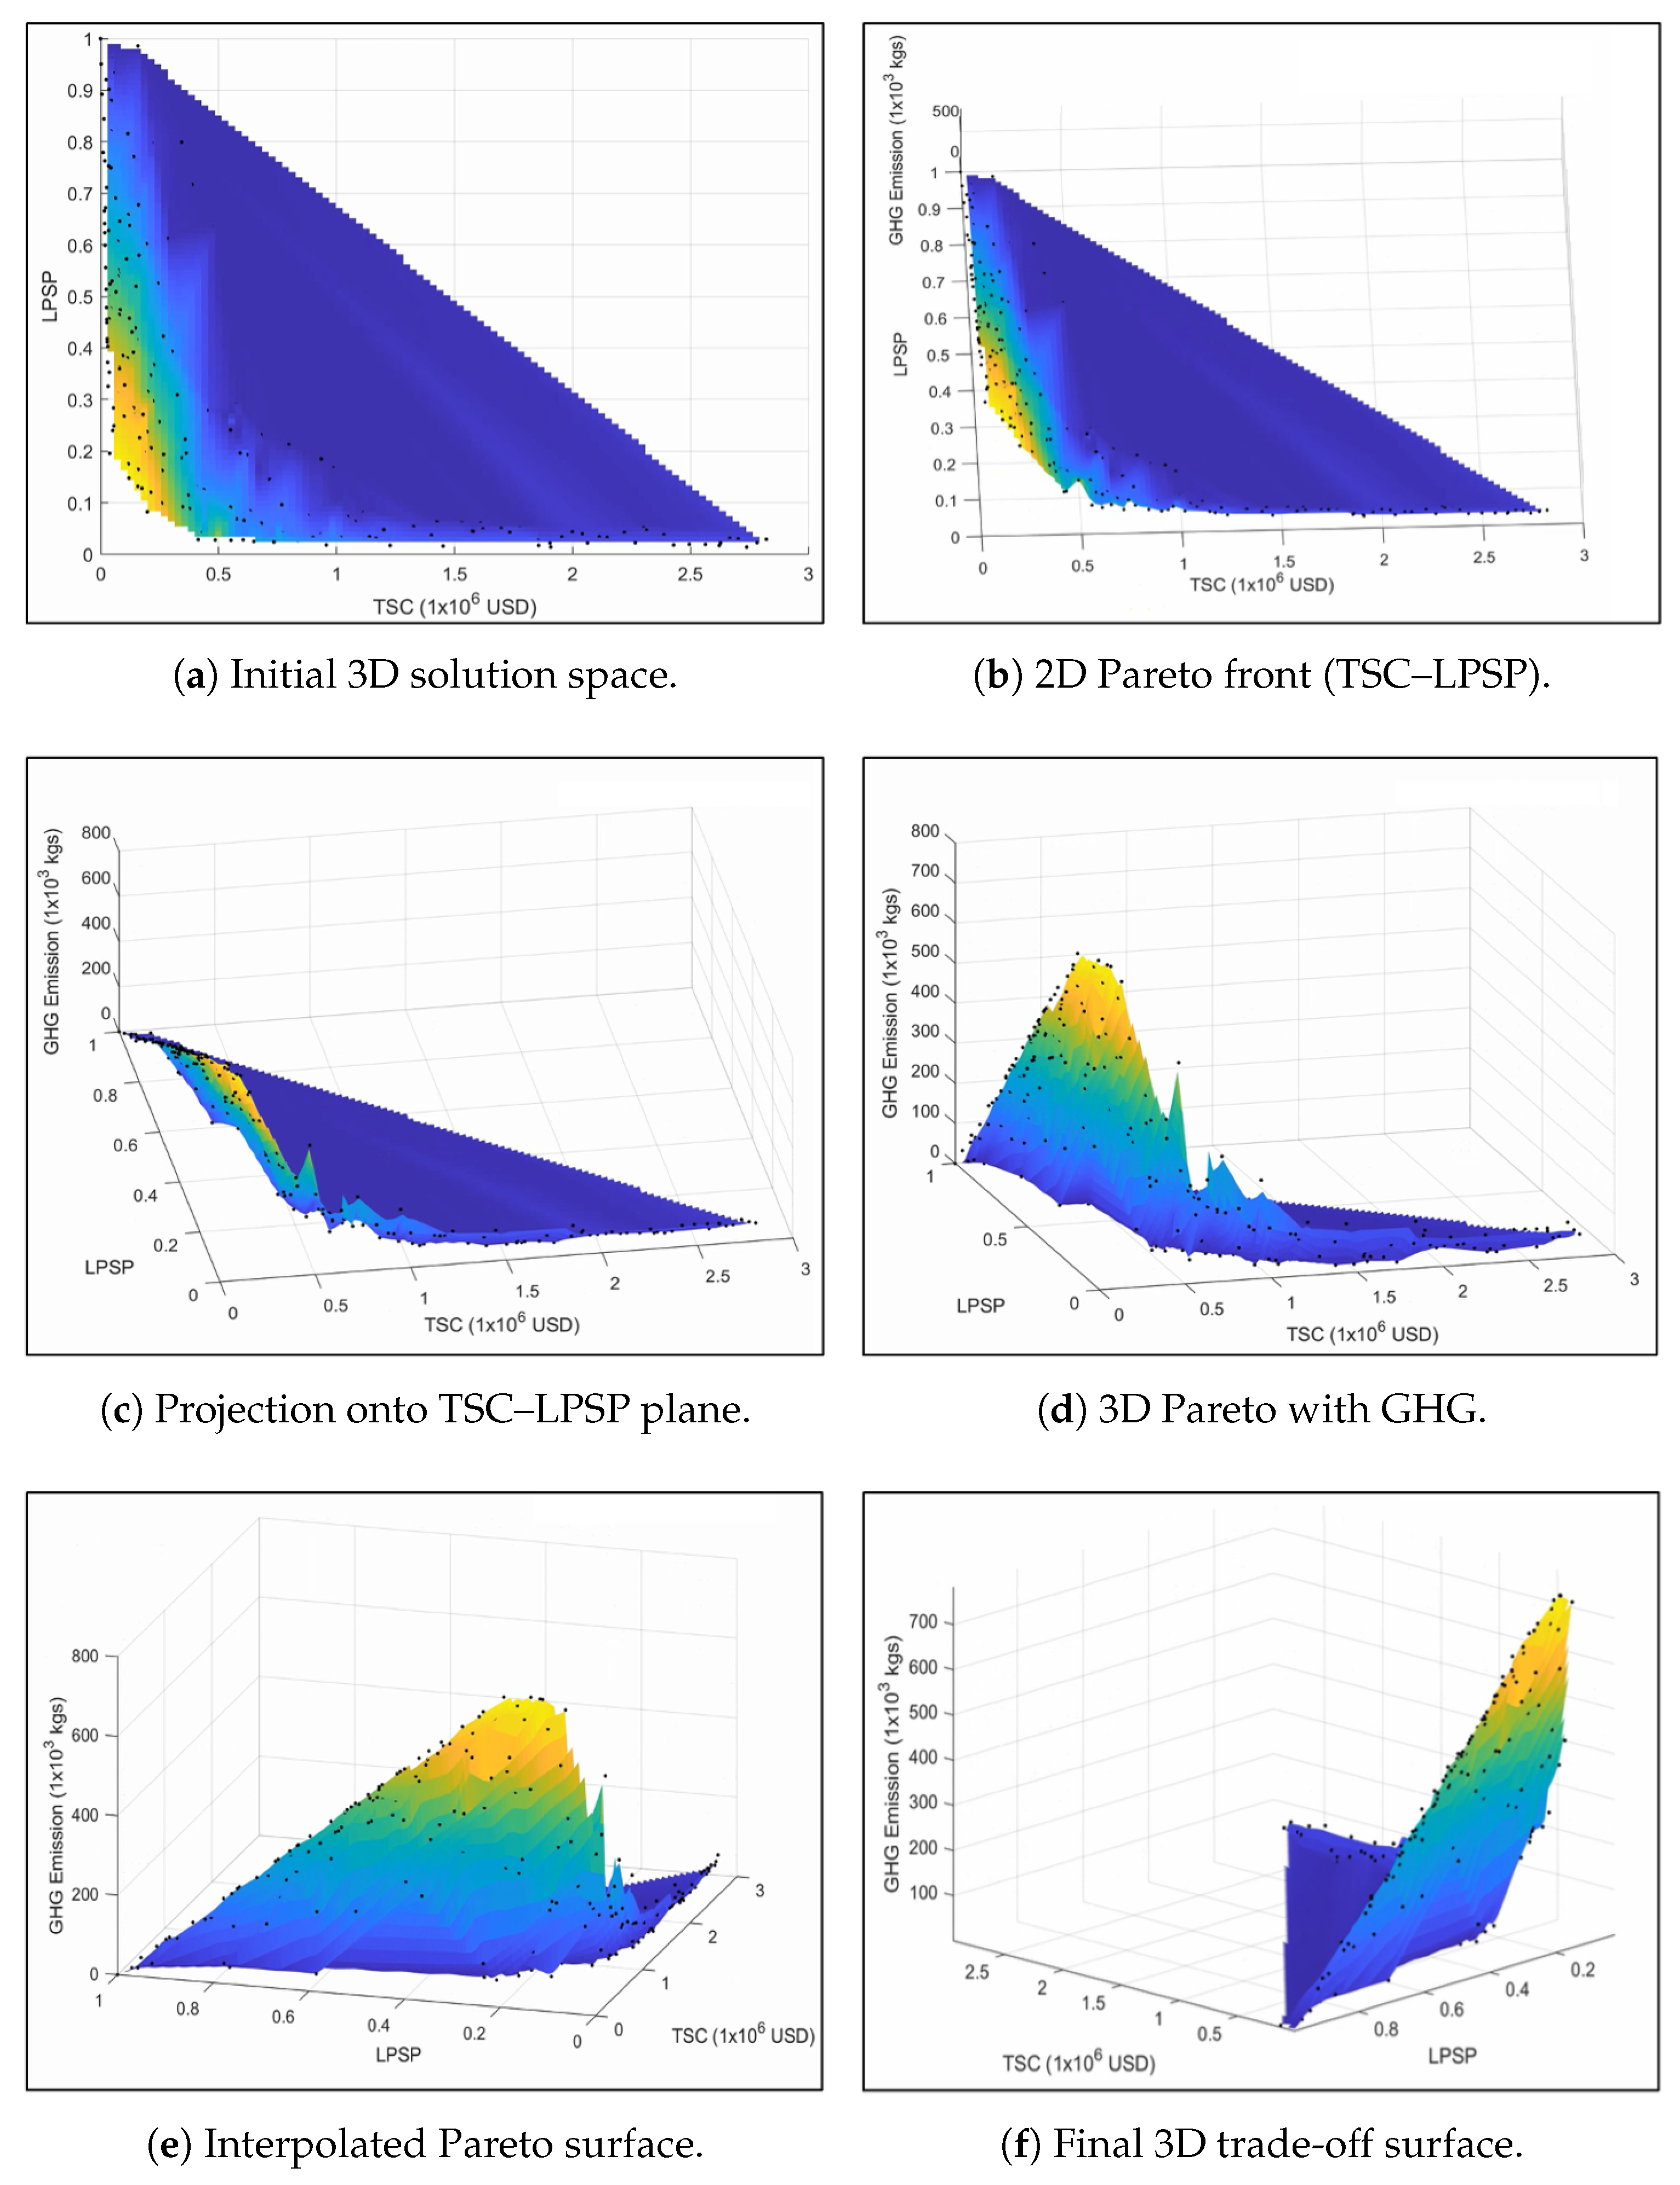
The multi-objective optimization yields a Pareto set capturing trade-offs among total system cost (TSC), reliability (LPSP), and sustainability (GHG emissions). The two-dimensional Pareto front highlights the cost–reliability trade-off, while color-coding indicates the relative level of GHG emissions. Extending the Pareto set into three dimensions provides a direct visualization of the feasible trade-off surface and supports the selection of representative solutions for detailed dispatch analysis.
The Pareto-optimal solution set obtained from the MOPSO algorithm illustrates the trade-off between system economic cost (NPC) and reliability performance (LPSP). Each point on the Pareto front represents a feasible microgrid configuration for which no other solution simultaneously improves both objectives.
A key contribution is that turbine selection is not treated as a fixed technology choice but as an explicit design dimension evaluated under hourly dispatch feasibility. By enforcing admissible flow regions, the analysis quantifies how seasonal high-flow and low-flow episodes translate into forced shutdowns or reduced hydro contribution, which then propagates to storage utilization, diesel activation, and unmet-load risk. This mechanism-level linkage between hydraulic feasibility and operational outcomes provides a quantitative basis to differentiate turbine choices beyond annual energy comparisons.
3.3. System Design Results (Component Sizes and Turbine Selection)
Representative solutions are selected from the Pareto set to clarify the implications of turbine selection and seasonal flow variability on system performance. Table 8 reports the decision variables (component sizes and turbine design-flow parameters) and the achieved objective values. In particular, Pareto Solution 1 employs only crossflow turbines (no propeller turbine operation), while Pareto Solution 2 combines crossflow and propeller turbines.
Table 8.
Representative solutions: decision variables and objective outcomes.
A hypothetical upper-bound reference case is also reported for context, in which the RoR hydropower output is assumed constant throughout the year. This benchmark does not represent a physically realizable operating condition under seasonal river-flow variability and turbine operating constraints. Instead, it is included solely as a theoretical upper bound to illustrate the performance that could be achieved in the absence of hydrological variability. Consequently, the results of this reference case should not be interpreted as a feasible design but rather as an analytical benchmark used to quantify the performance gap introduced by seasonal river-flow fluctuations and turbine feasibility limits.
The annual turbine operating hours reported in Table 9 are consistent with the flow distribution of the study site. The river discharge remains within the feasible operating range of the turbines for a large portion of the year. Periods where the discharge falls outside the admissible range correspond to turbine shutdown events, which are reflected in the dispatch simulations and annual output profiles.
Table 9.
Annual turbine operating hours of representative solutions.
Figure 13 presents the two-dimensional Pareto-optimal set in the cost–reliability space, where GHG emissions are indicated through the color scale. The results show that lower cost solutions are generally associated with higher LPSP and emissions, highlighting the inherent trade-off among the objectives. Selected representative solutions are identified along the Pareto front. Two representative solutions are highlighted: the solution labeled 1 corresponds to a lower-cost, crossflow-only configuration with higher LPSP, while the solution labeled 2 represents a higher-cost design incorporating a propeller turbine, reducing LPSP but increasing emissions. This reflects the trade-offs among cost, reliability, and environmental performance along the Pareto front.
Figure 13.
Two-dimensional Pareto-optimal set in the cost–reliability plane with emissions indicated by color scale.
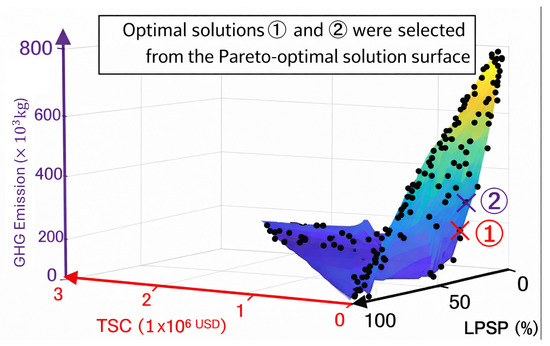
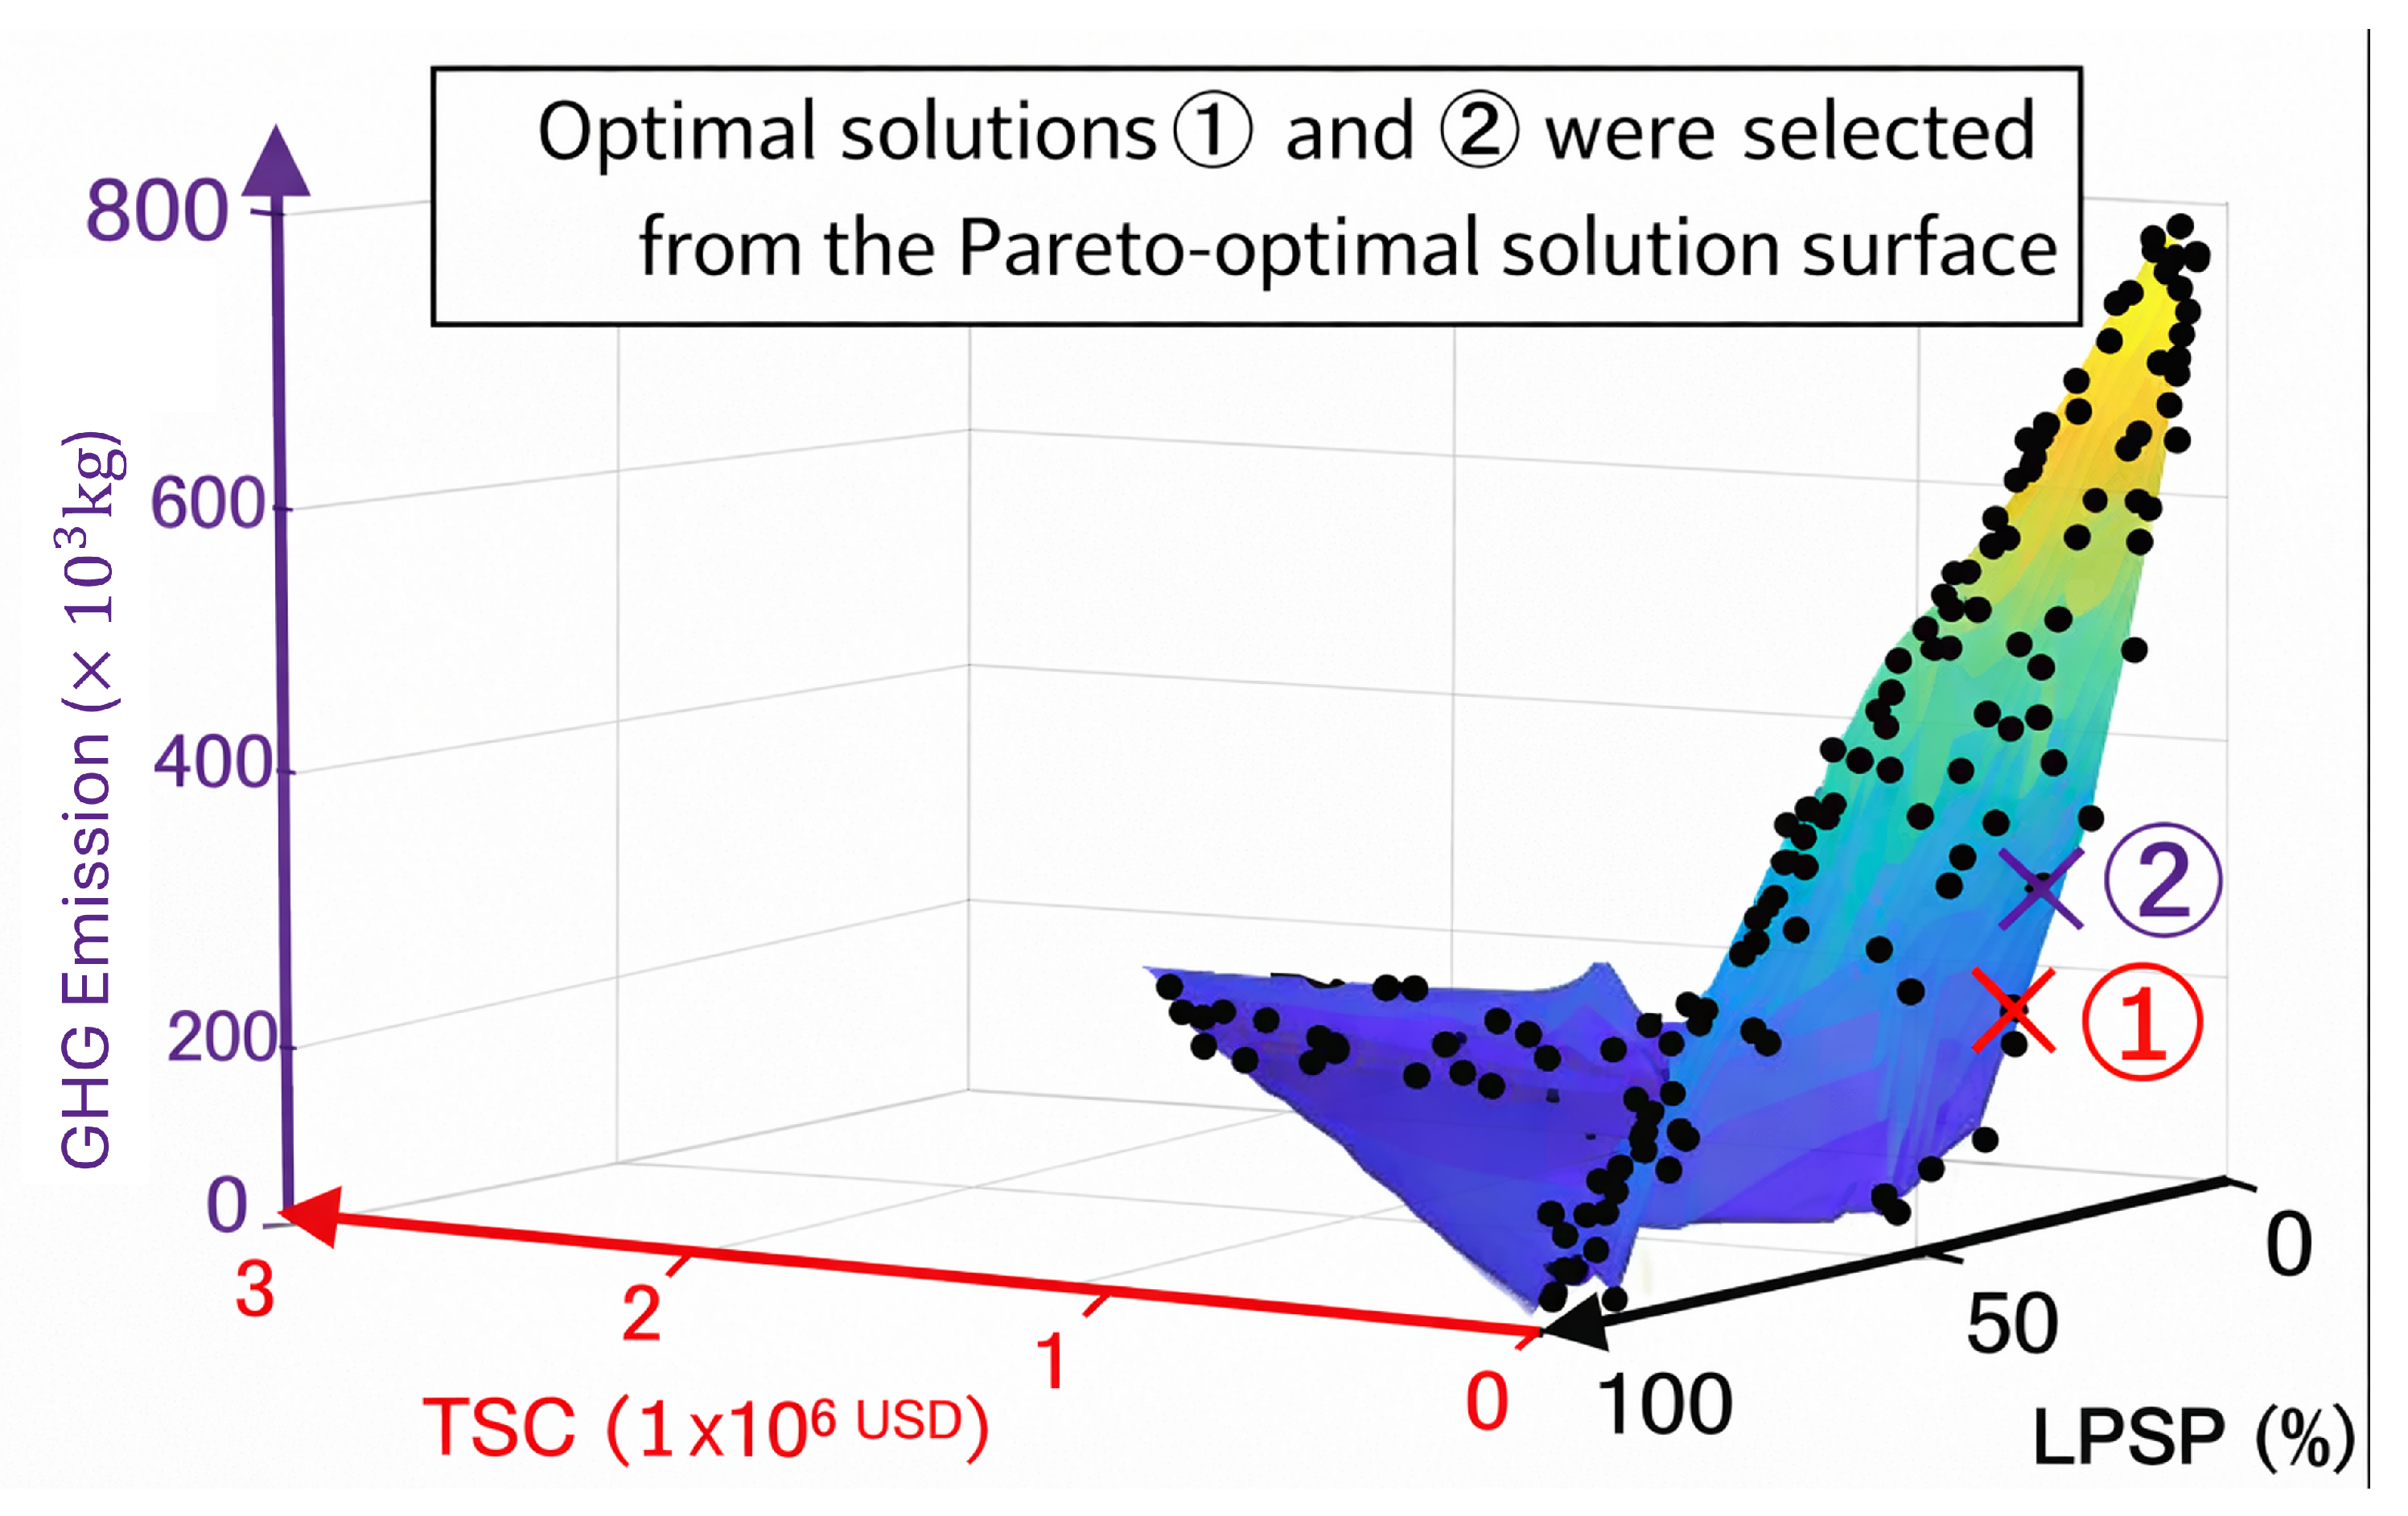
Figure 14 extends this analysis into three dimensions, where GHG emissions are explicitly incorporated to form a trade-off surface. This representation provides a more comprehensive view of the interaction among cost, reliability, and environmental impact, from which optimal solutions can be selected.
Figure 14.
Three-dimensional Pareto-optimal trade-off surface (TSC–LPSP–GHG).
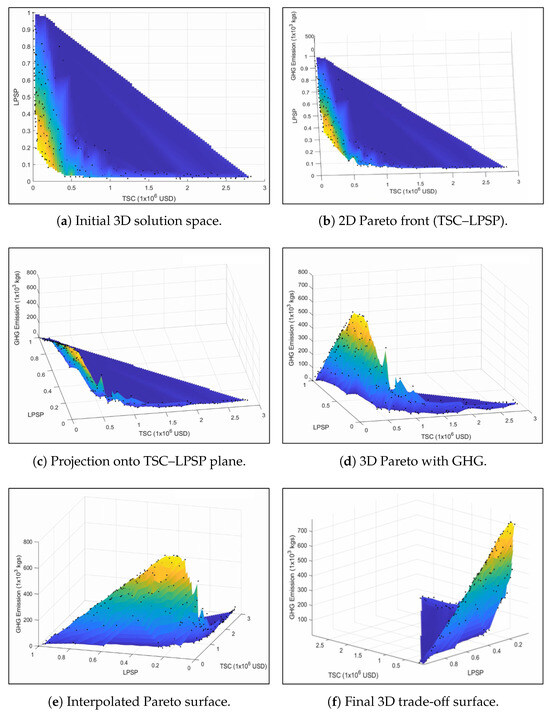
Building on this, Figure 15 illustrates the transformation of the Pareto front into a 3D cost–reliability–GHG trade-off surface. Figure 15a shows the initial distribution of solutions across cost, reliability, and emissions, providing the full solution space. Figure 15b identifies the Pareto-optimal front in the cost–reliability plane, capturing the best trade-offs between these two objectives. Figure 15c projects these optimal solutions onto the TSC–LPSP plane to clearly define the front structure. Figure 15d then reintroduces GHG emissions, extending the Pareto front into three dimensions. Finally, Figure 15e presents the resulting surface, which highlights the interaction among cost, reliability, and environmental impact.
Figure 15.
Illustration of the 2D-to-3D Pareto set unfolding process used to visualize the trade-off surface. Color gradient indicates GHG emission levels.
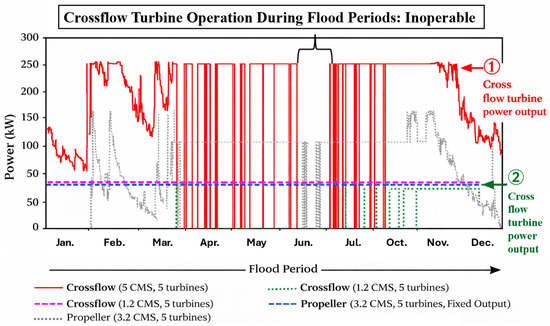
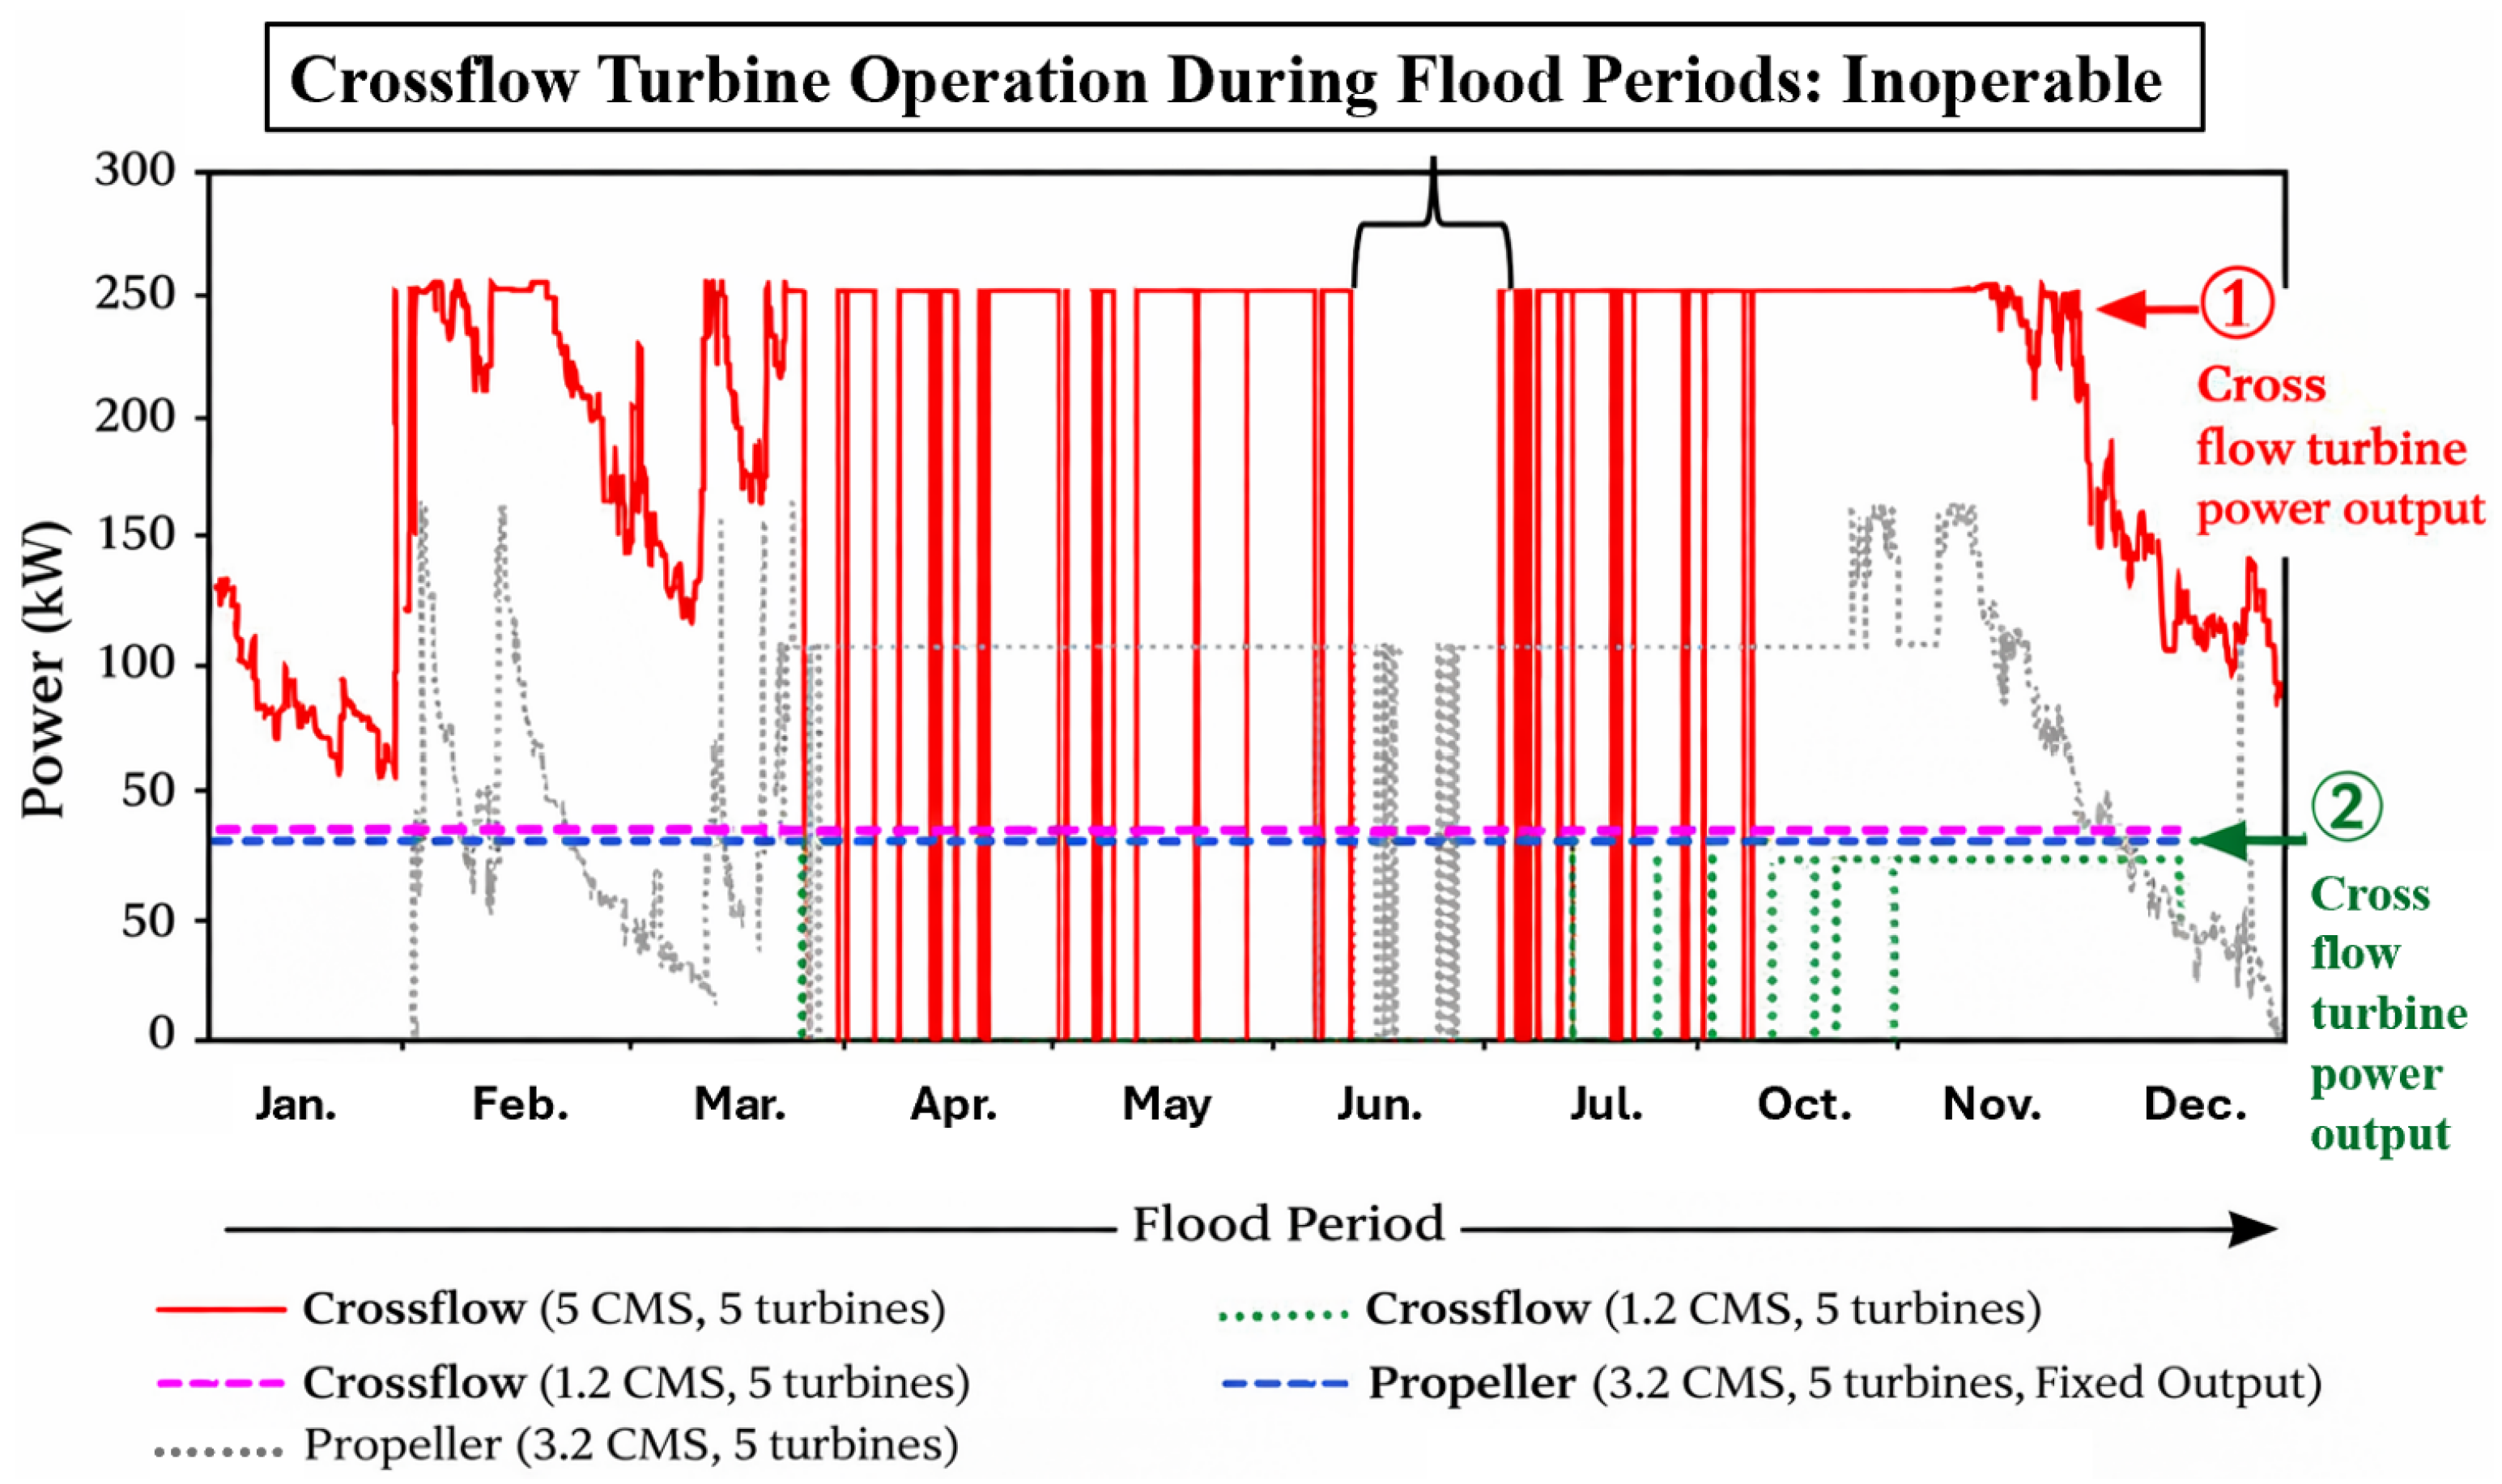
To interpret turbine selection under seasonal variability, Table 9 compares annual turbine operating hours, and Figure 16 visualizes the annual hydropower output profiles for the representative cases. Notably, the crossflow-only solution exhibits forced stoppages during extreme high-flow periods when the operating flow exceeds the allowable range, whereas adding a propeller turbine expands operability in higher-flow regimes.
Figure 16.
Annual hydropower output distributions for the representative solutions under seasonal flow variability.
While the optimization framework uses the loss of power supply probability (LPSP) as the primary reliability objective, additional reliability indicators are evaluated to provide a more comprehensive assessment of system performance. All reliability metrics are computed from the same 8760-h dispatch simulation and correspond exactly to the Pareto-optimal configurations reported in Table 7. In particular, LPSP is calculated using a consistent energy-based definition, ensuring full numerical consistency across all tables.
To further examine reliability performance, Table 10 summarizes key indicators for selected Pareto solutions, including the loss of load probability (LOLP), expected energy not served (EENS), and maximum unmet load. The results show a clear improvement from Solution 1 to Solution 3, with reductions in both the frequency and magnitude of unmet demand, ultimately achieving a fully reliable configuration with zero unmet load.
Table 10.
Comprehensive reliability indicators for representative Pareto solutions.
The results reveal clear differences in reliability performance among the evaluated Pareto solutions. Pareto Solution 1 exhibits the lowest reliability, with an LPSP of approximately 5.07%, indicating a higher proportion of unmet demand over the annual time horizon. Pareto Solution 2 shows improved reliability, with LPSP reduced to approximately 1.51%, while Pareto Solution 3 achieves near-zero unmet demand with negligible unmet load.
These findings are further supported by the corresponding LOLP and EENS values, which decrease significantly from Solution 1 to Solution 3. This trend confirms the expected trade-off between cost, emissions, and system reliability across the Pareto-optimal configurations. Minor numerical differences between tables are due only to rounding, while all values are derived from identical simulation outputs.
3.4. Dispatch Performance of Representative Solutions
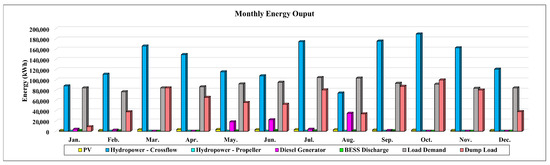
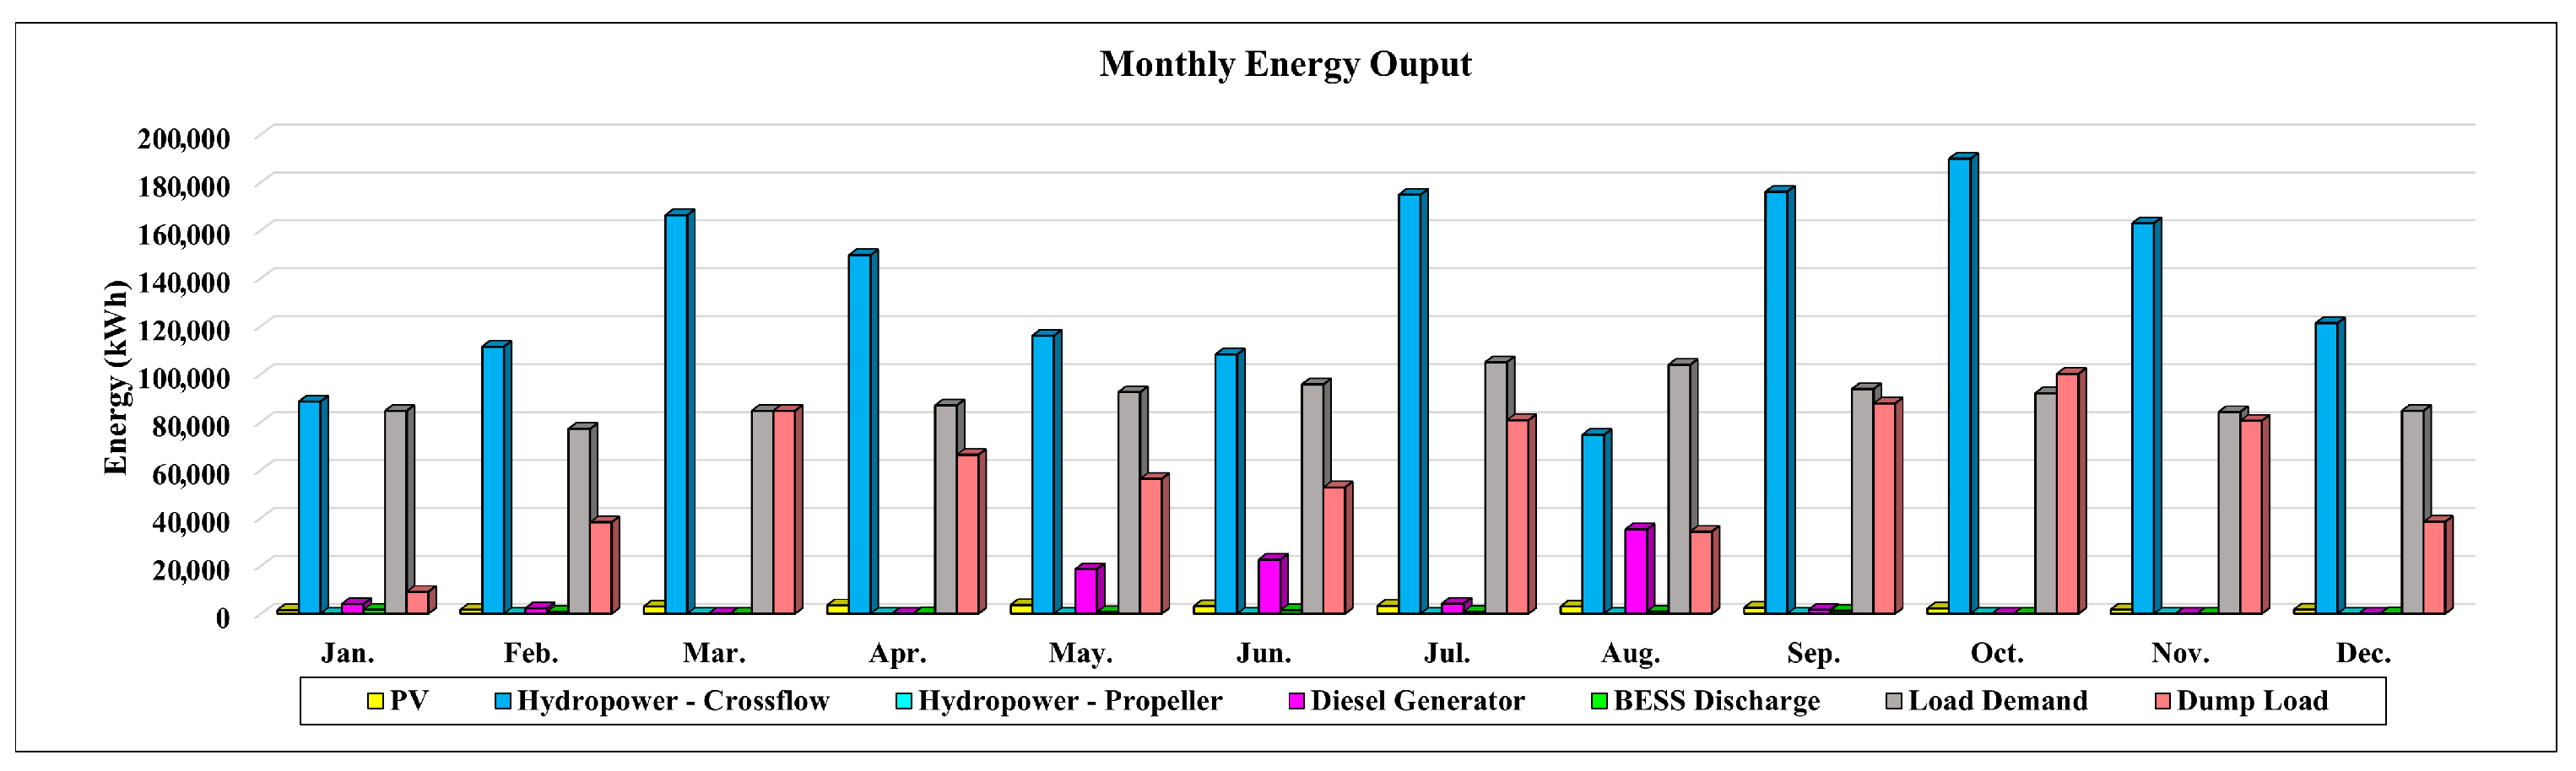
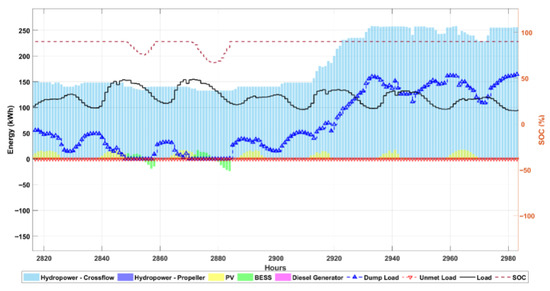
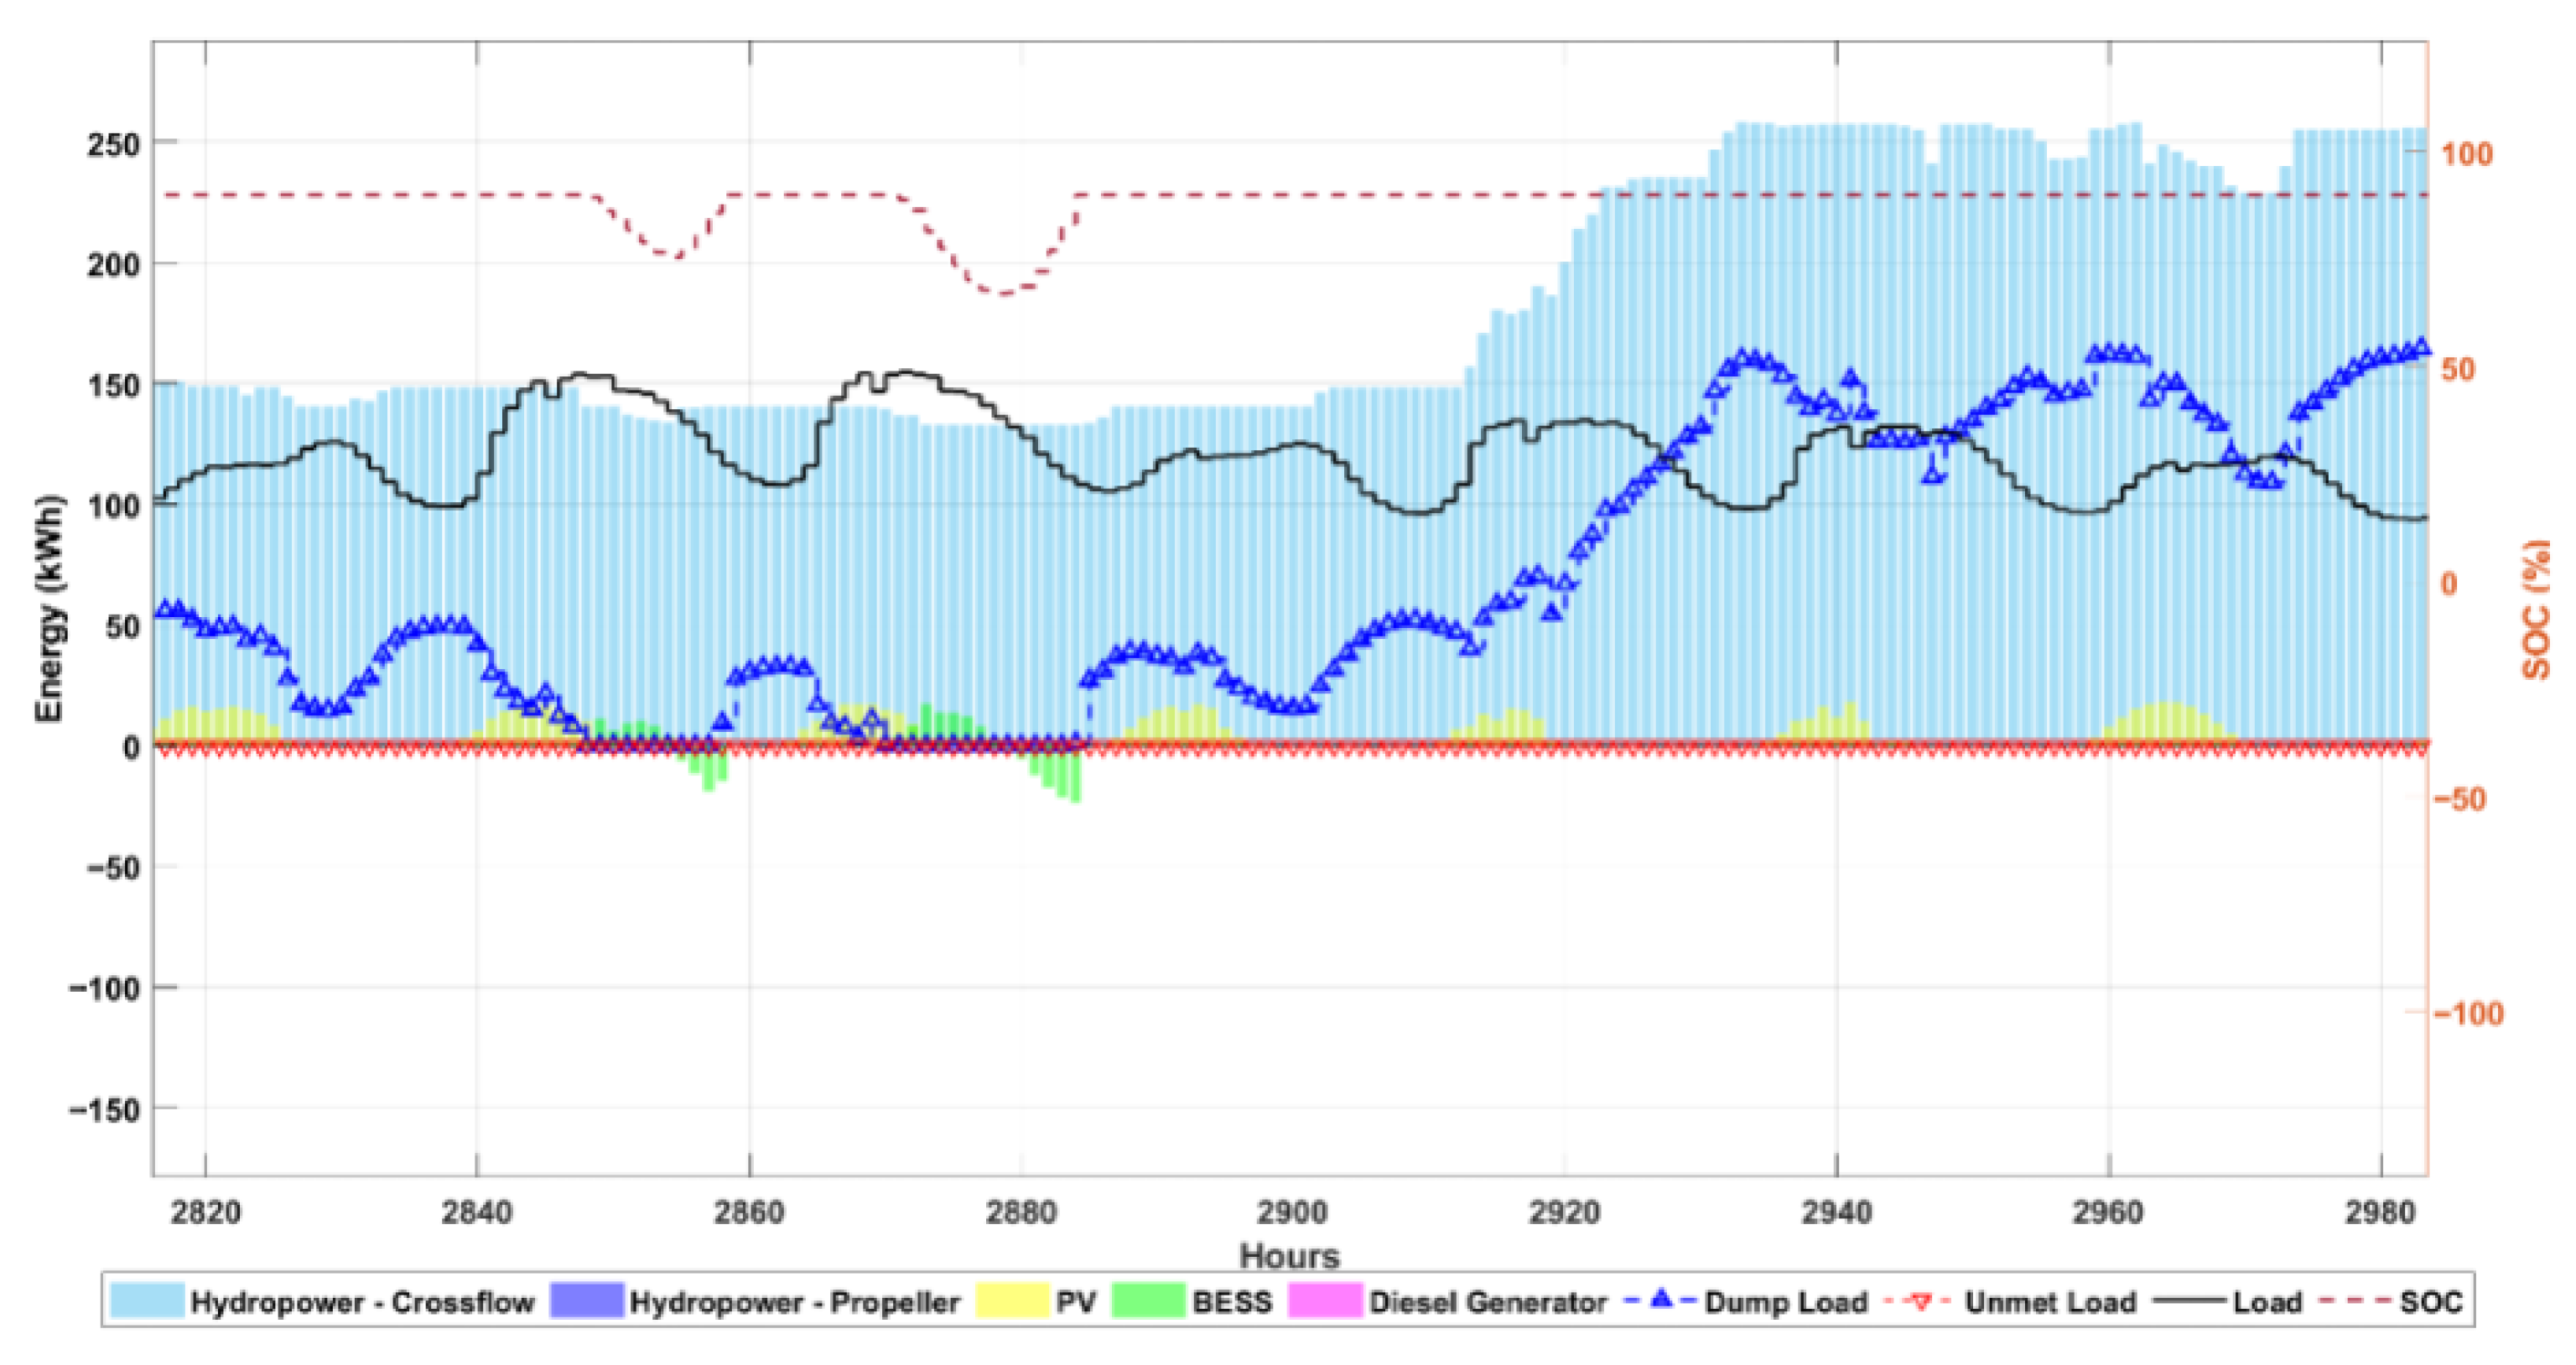
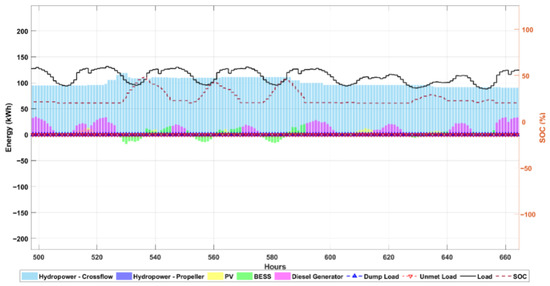
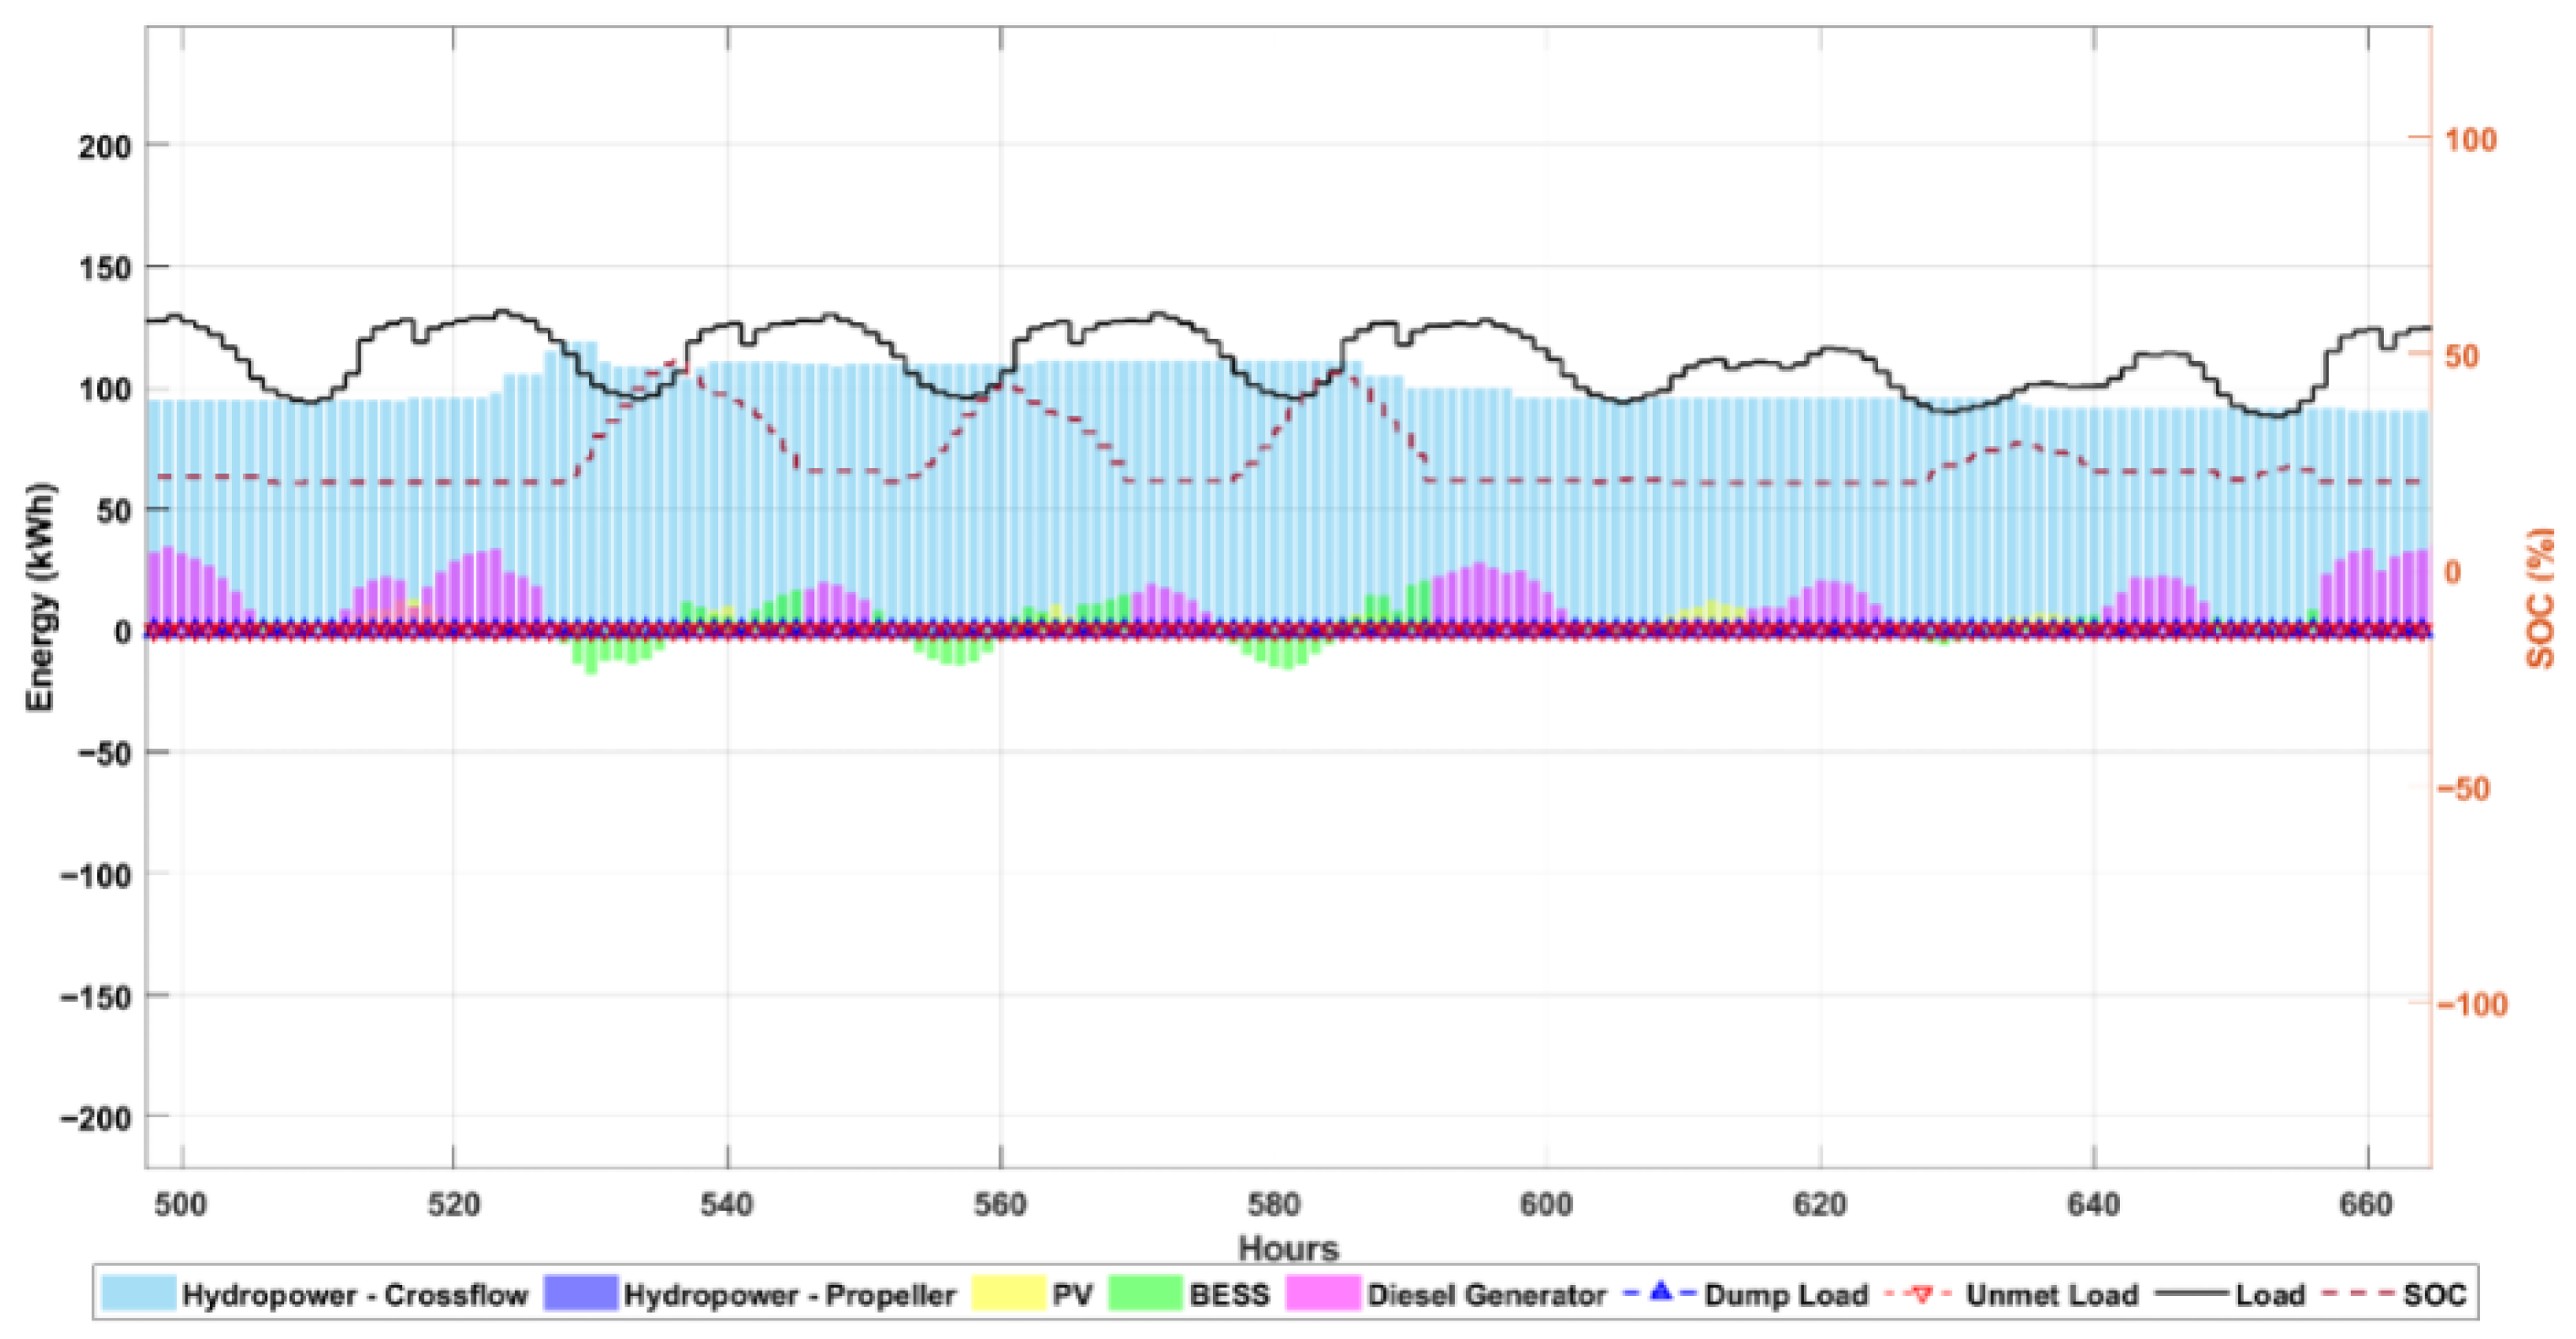
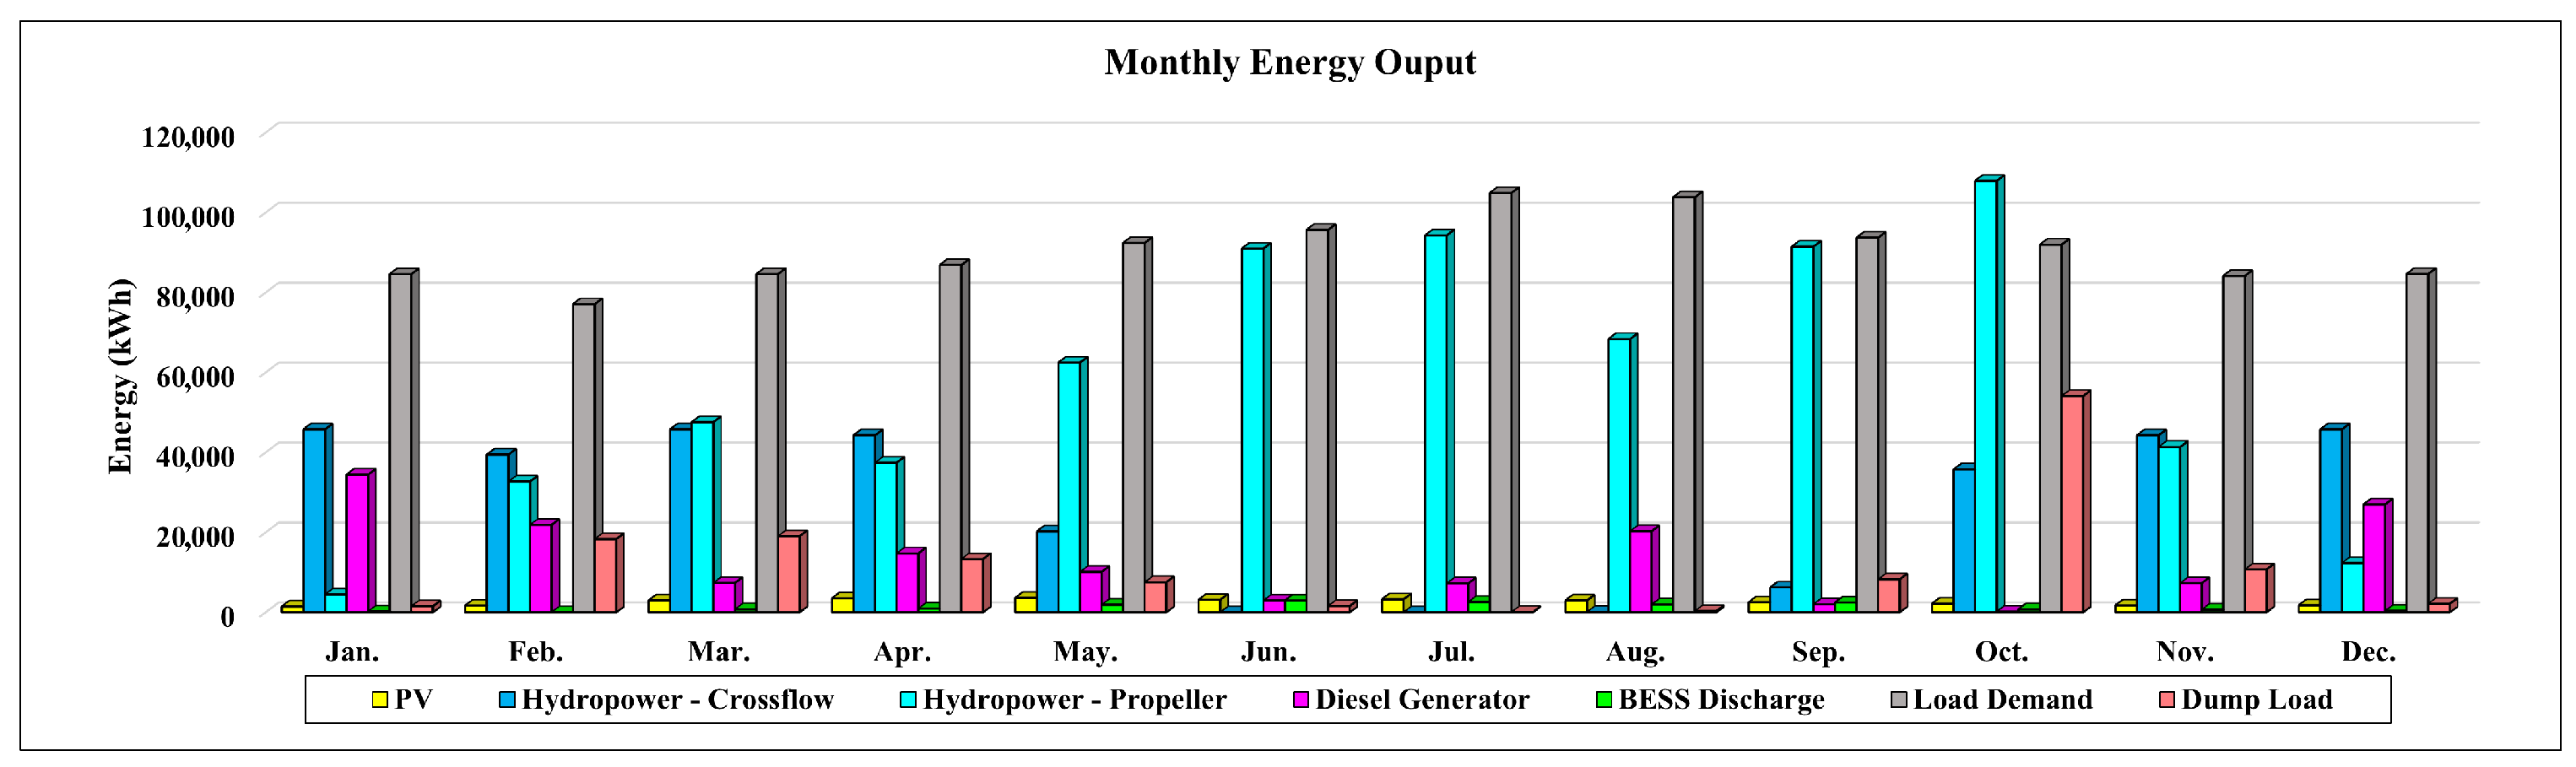
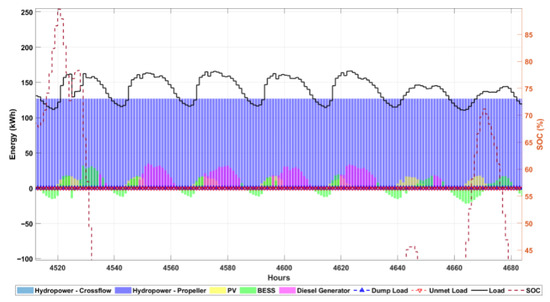
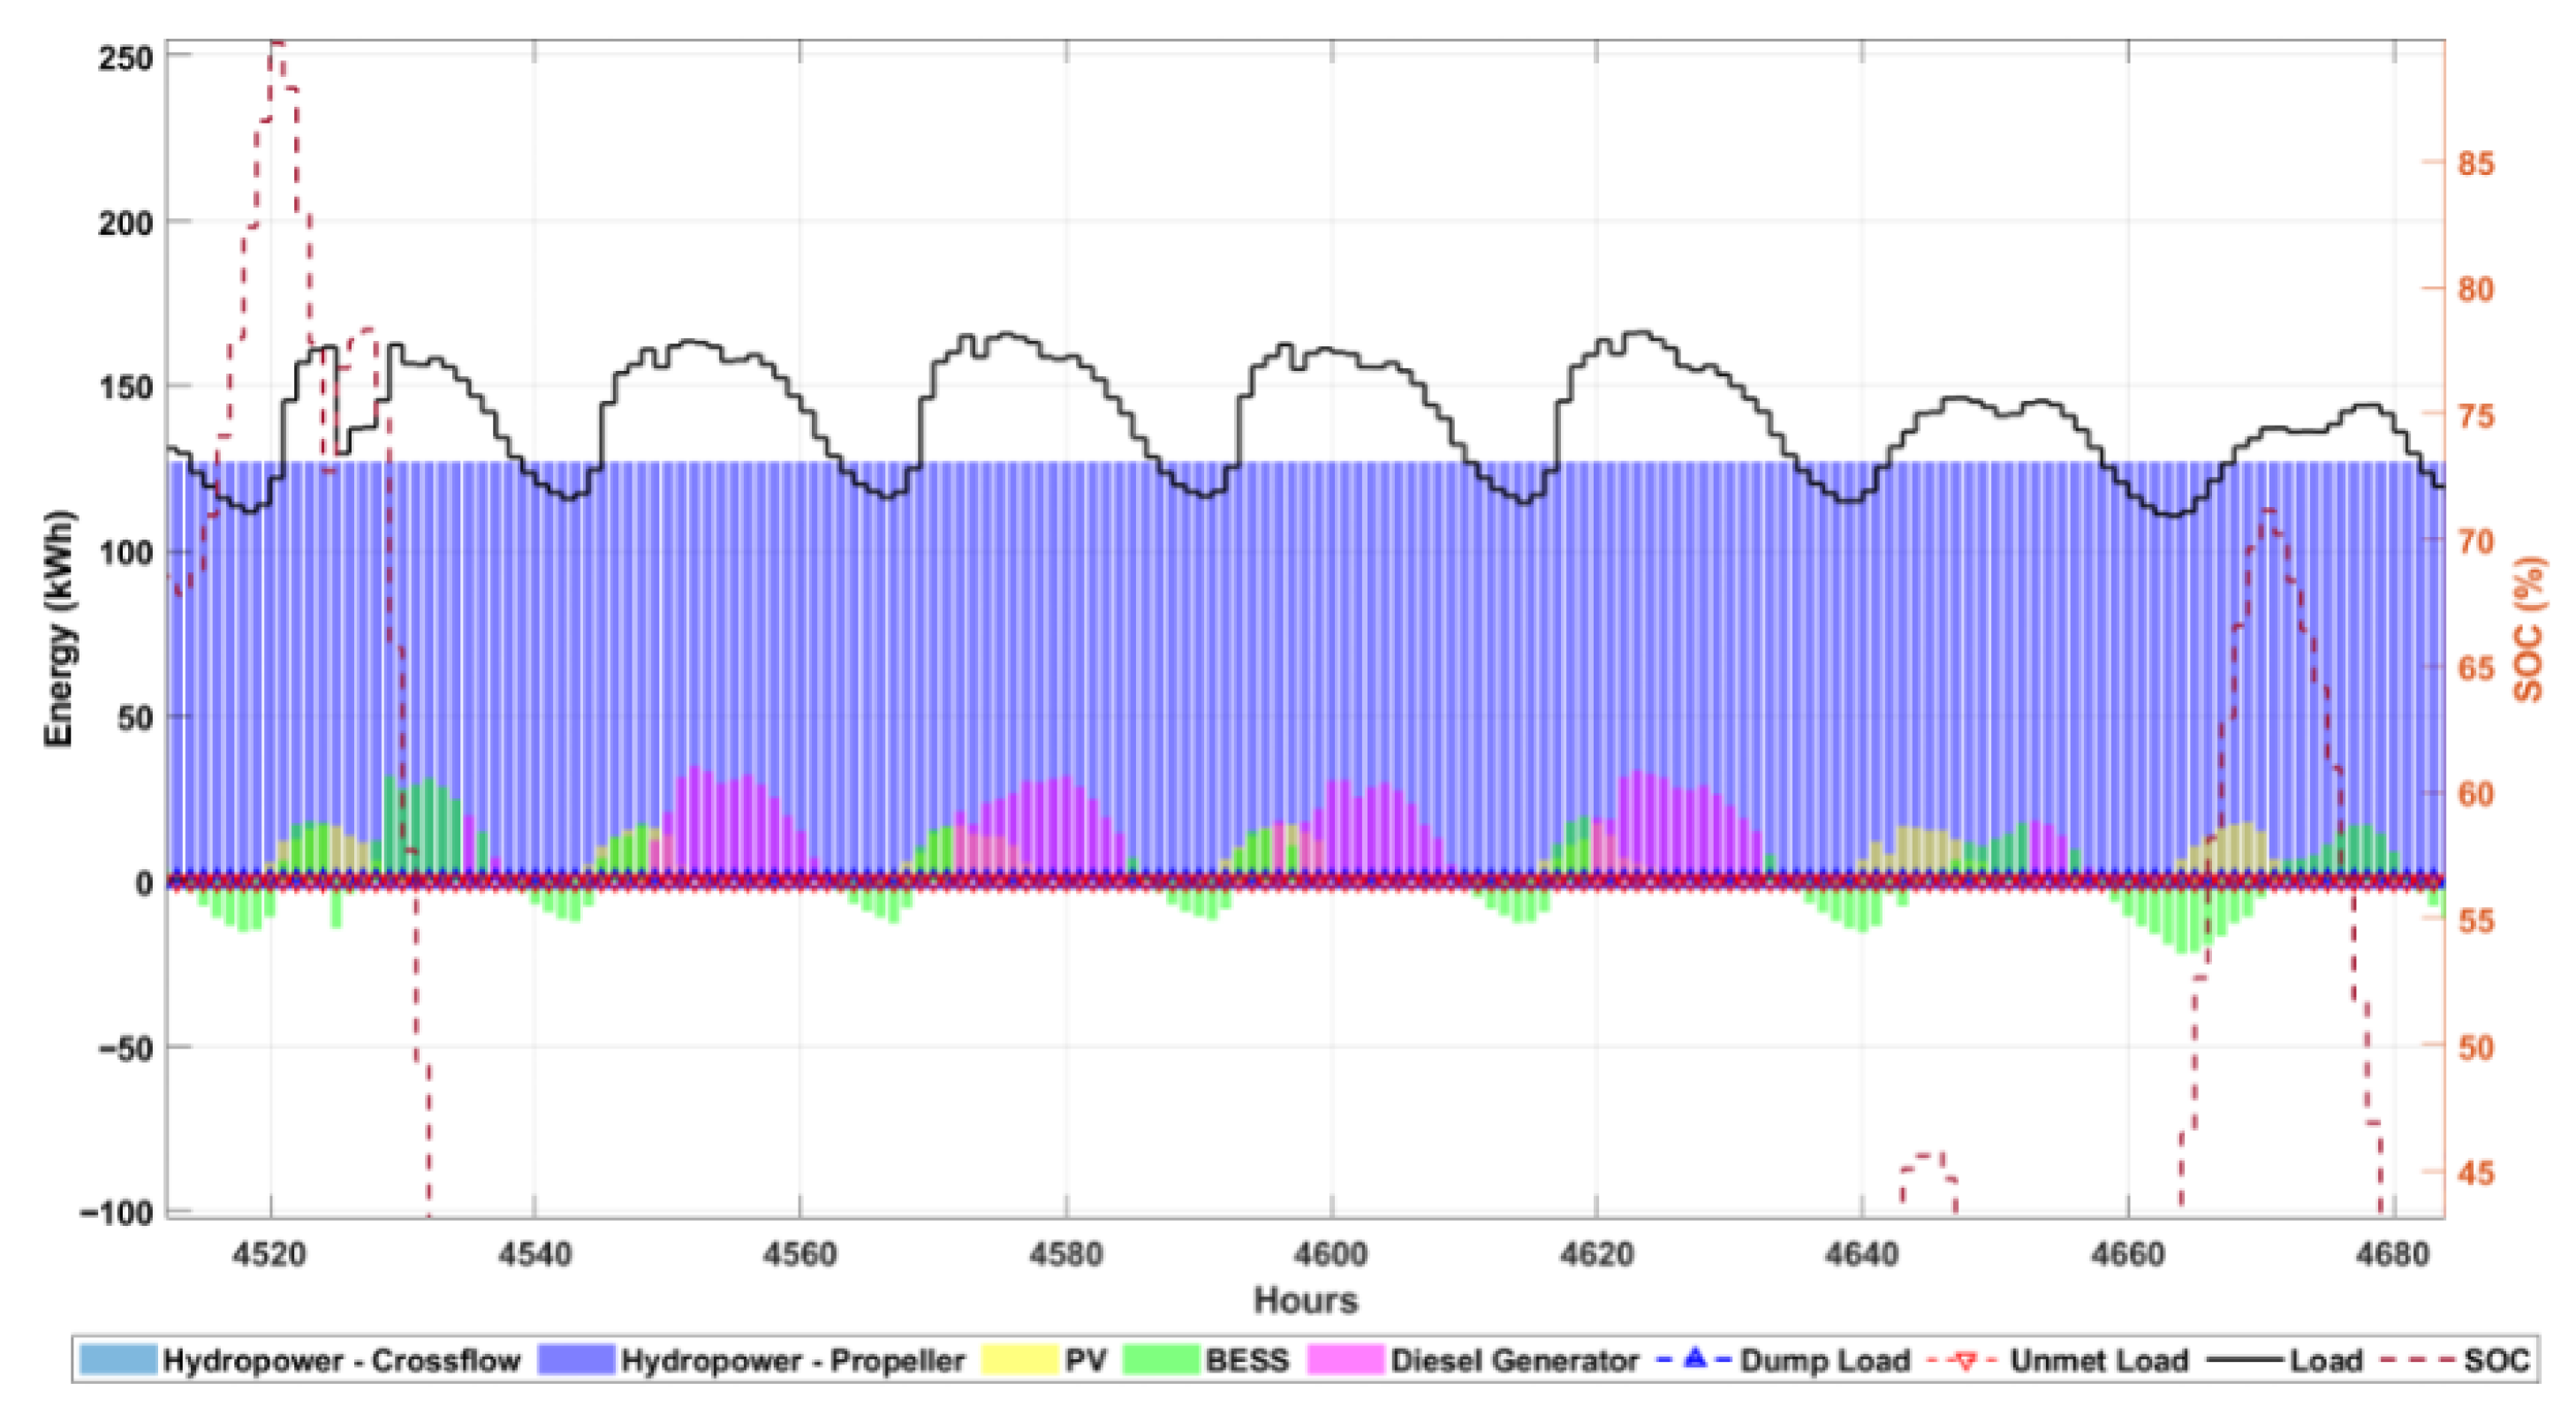
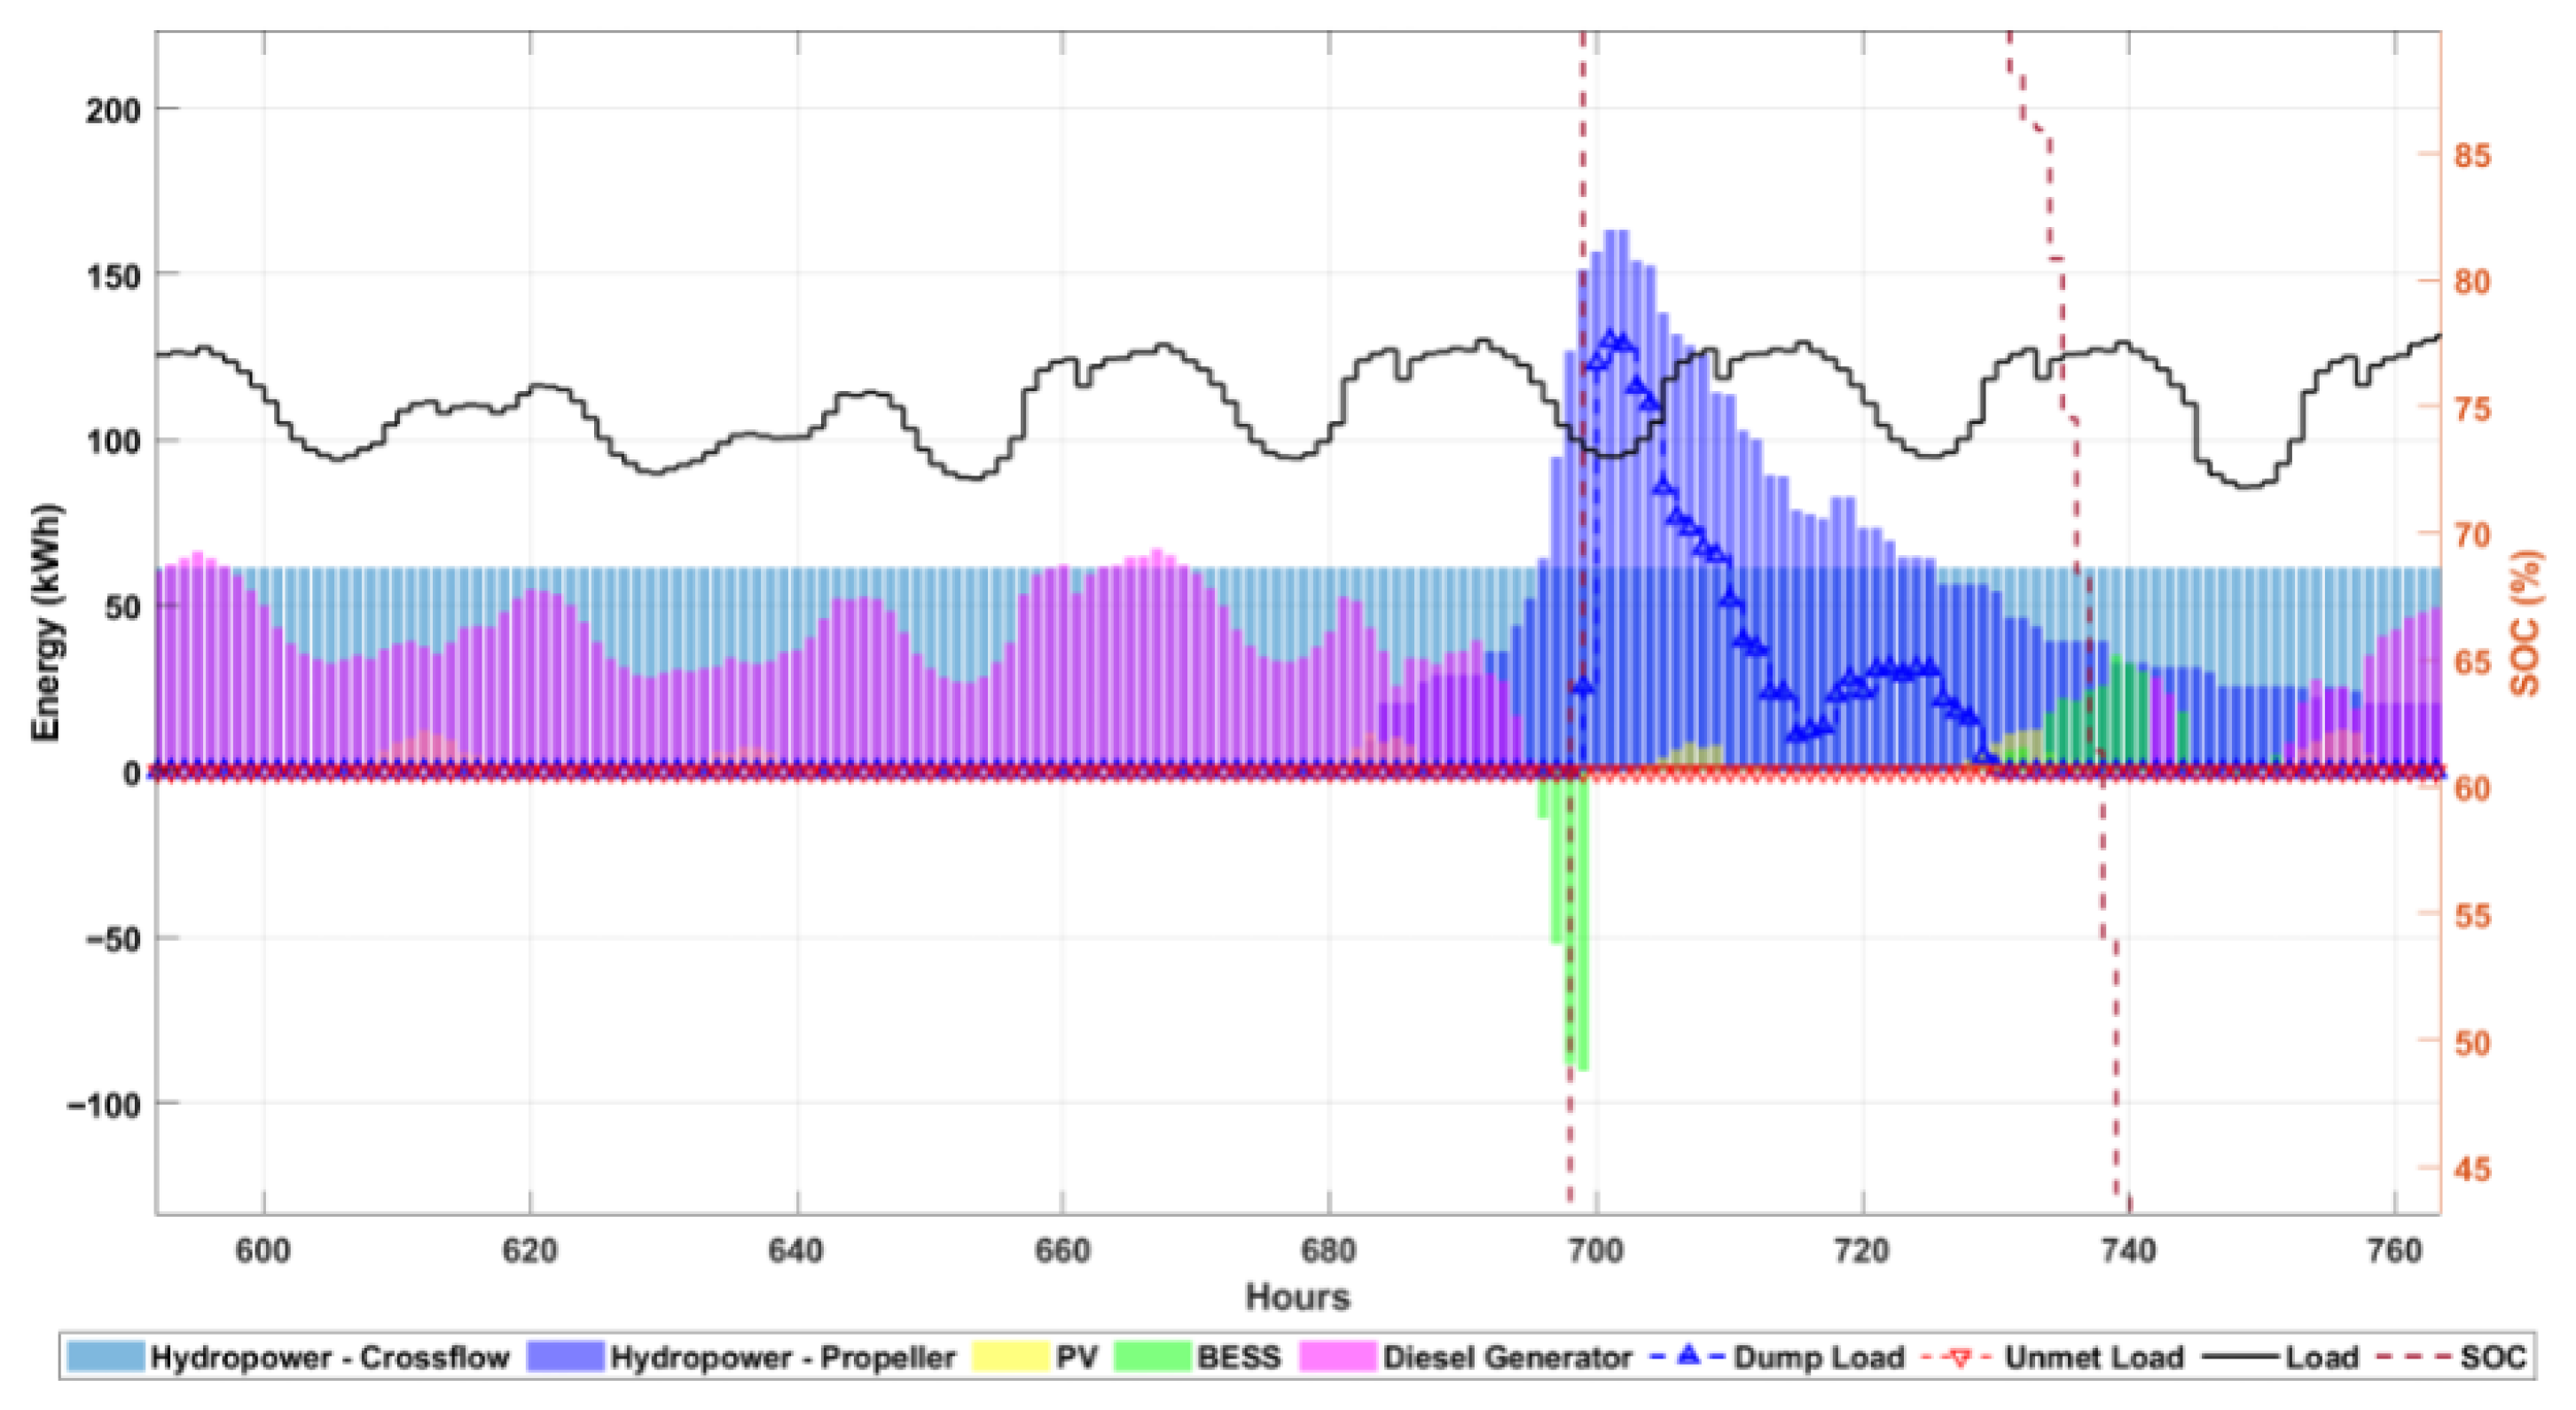
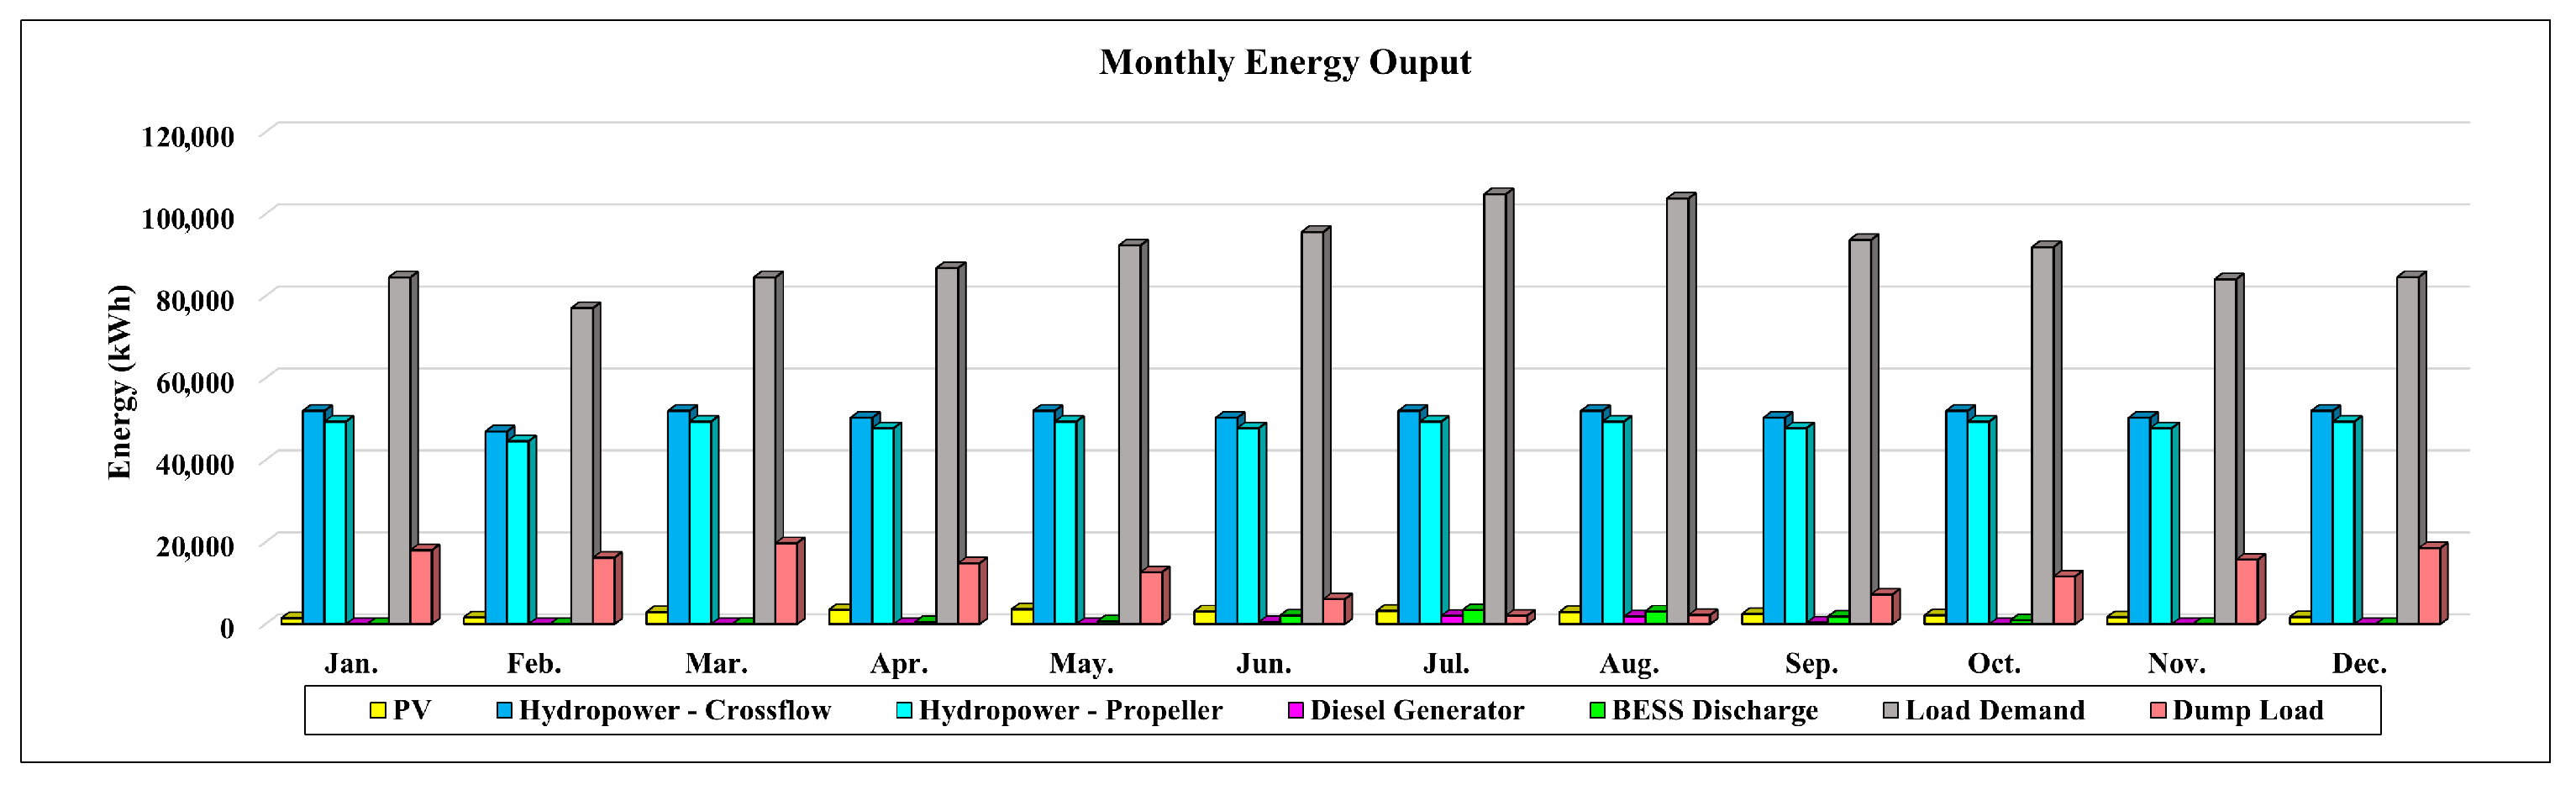
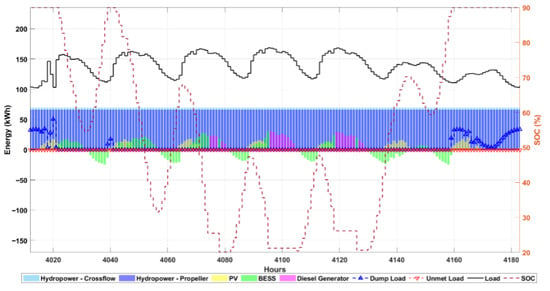
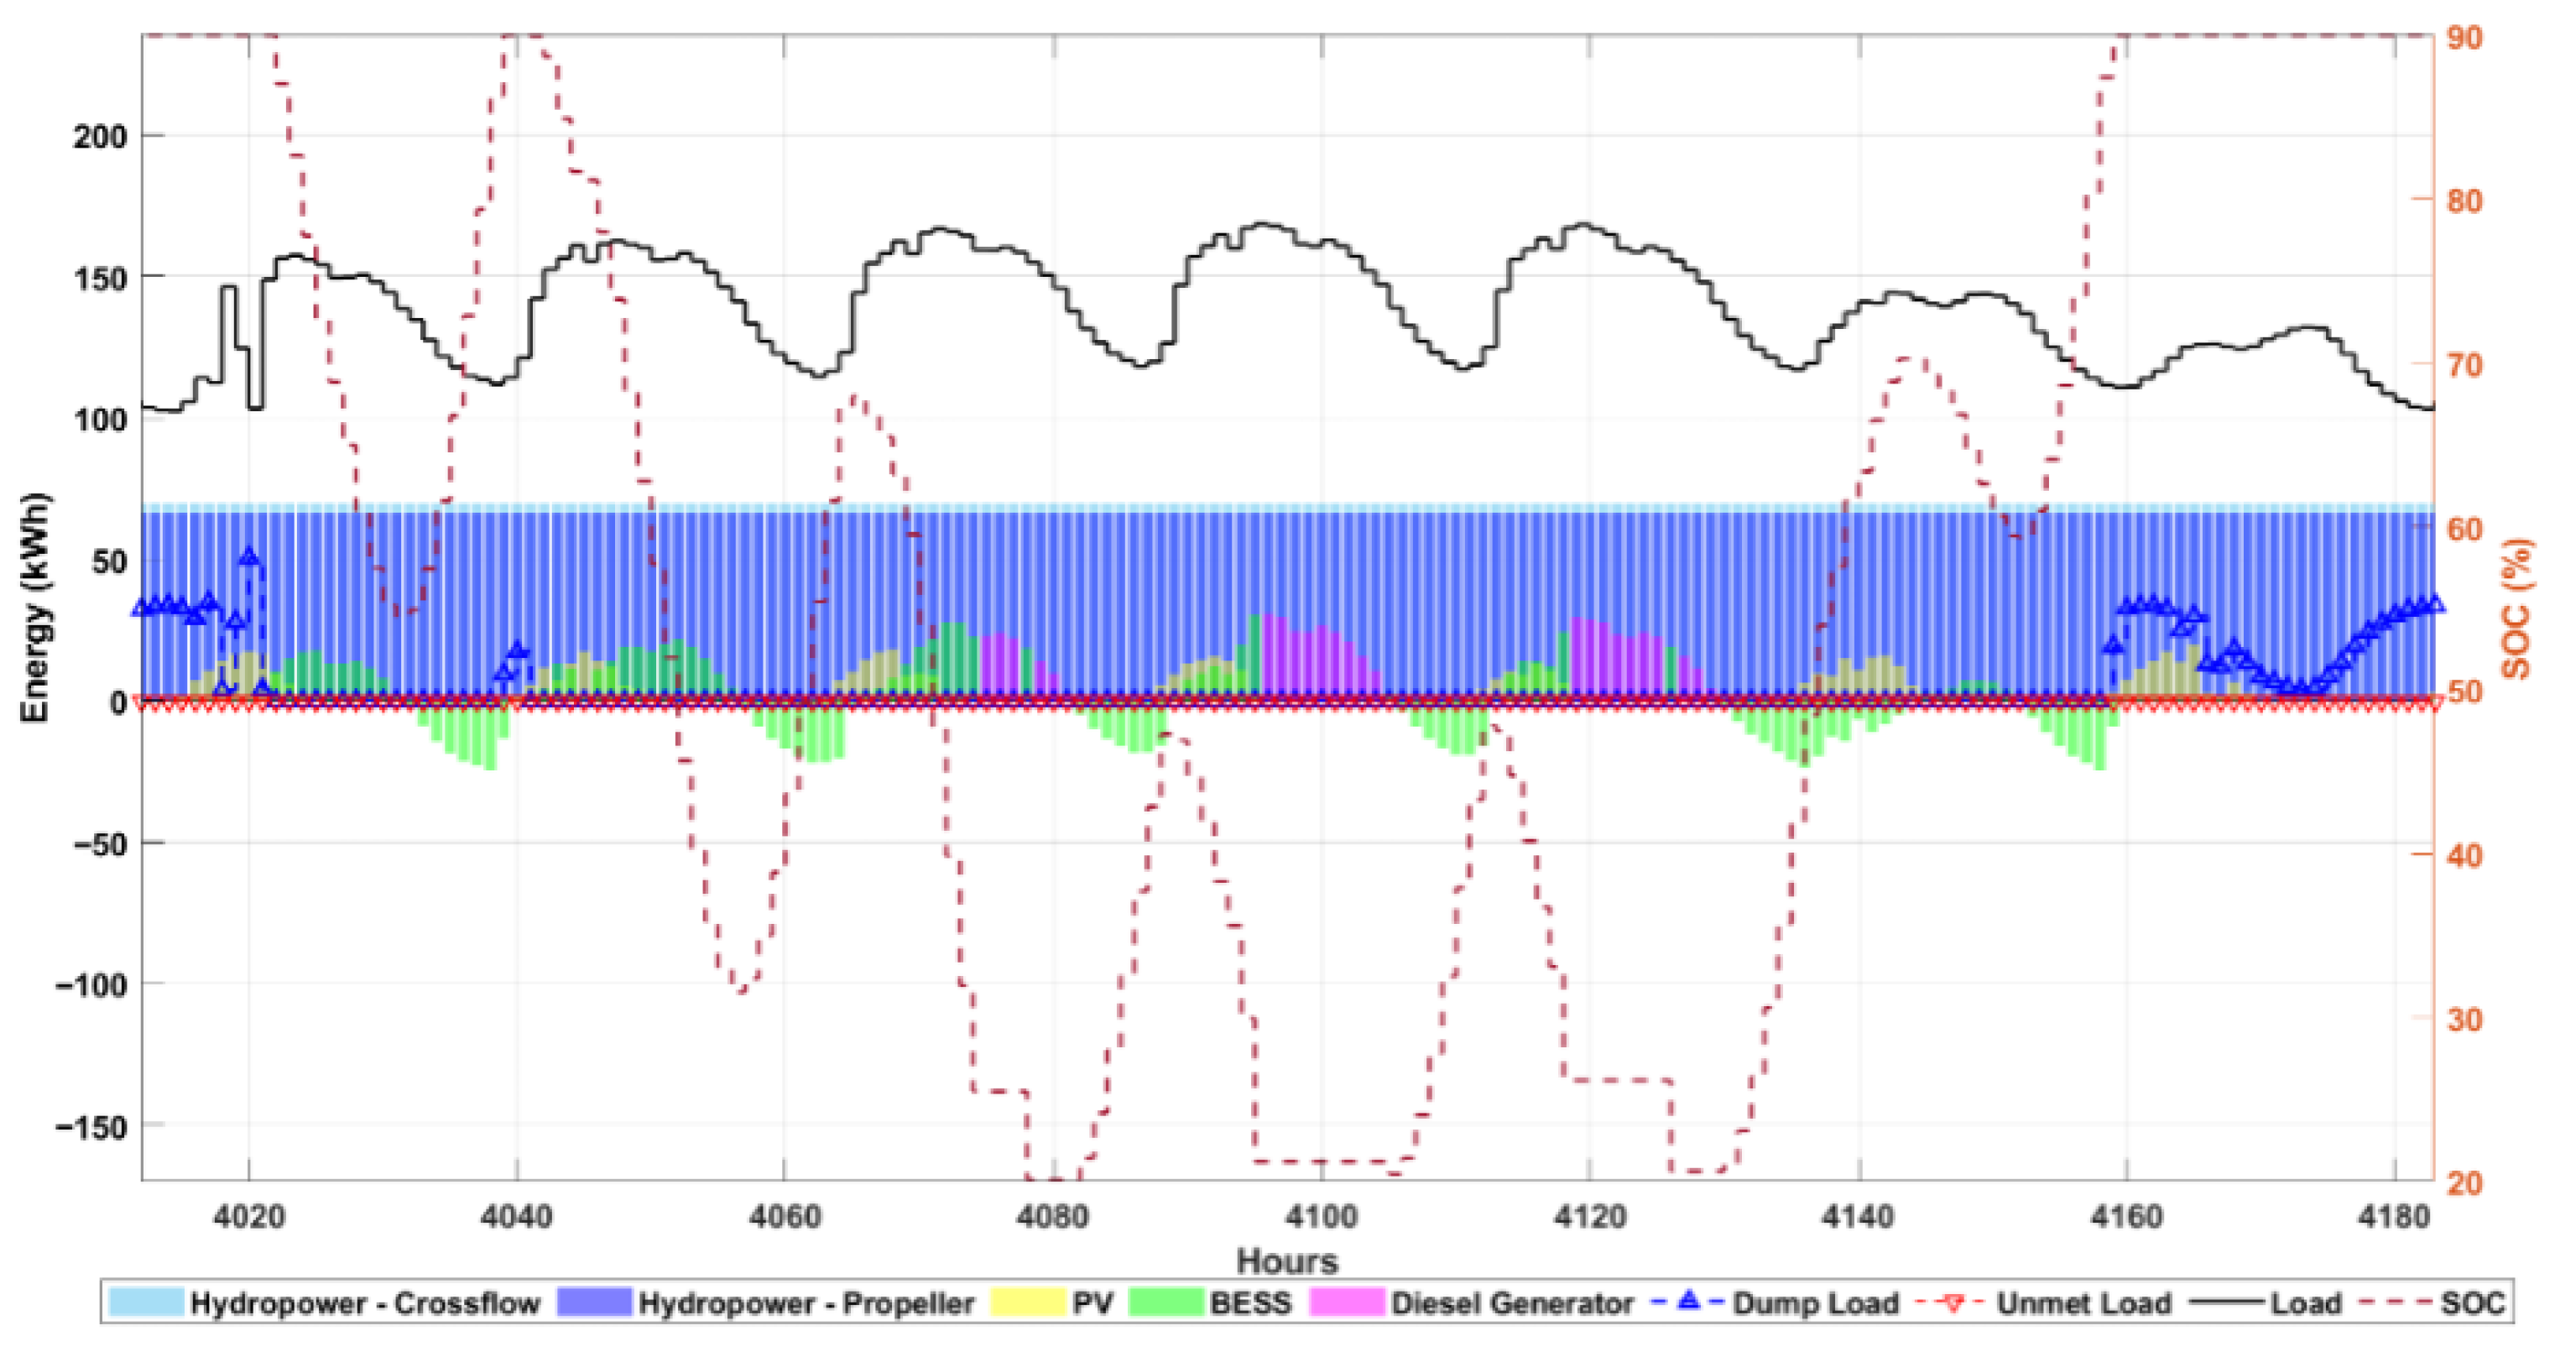
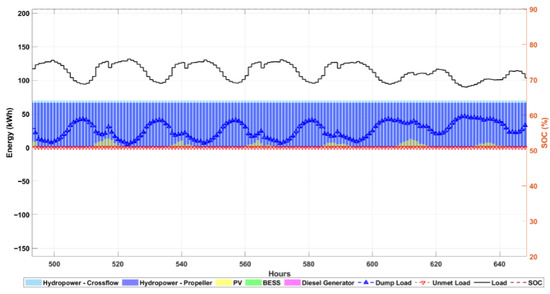
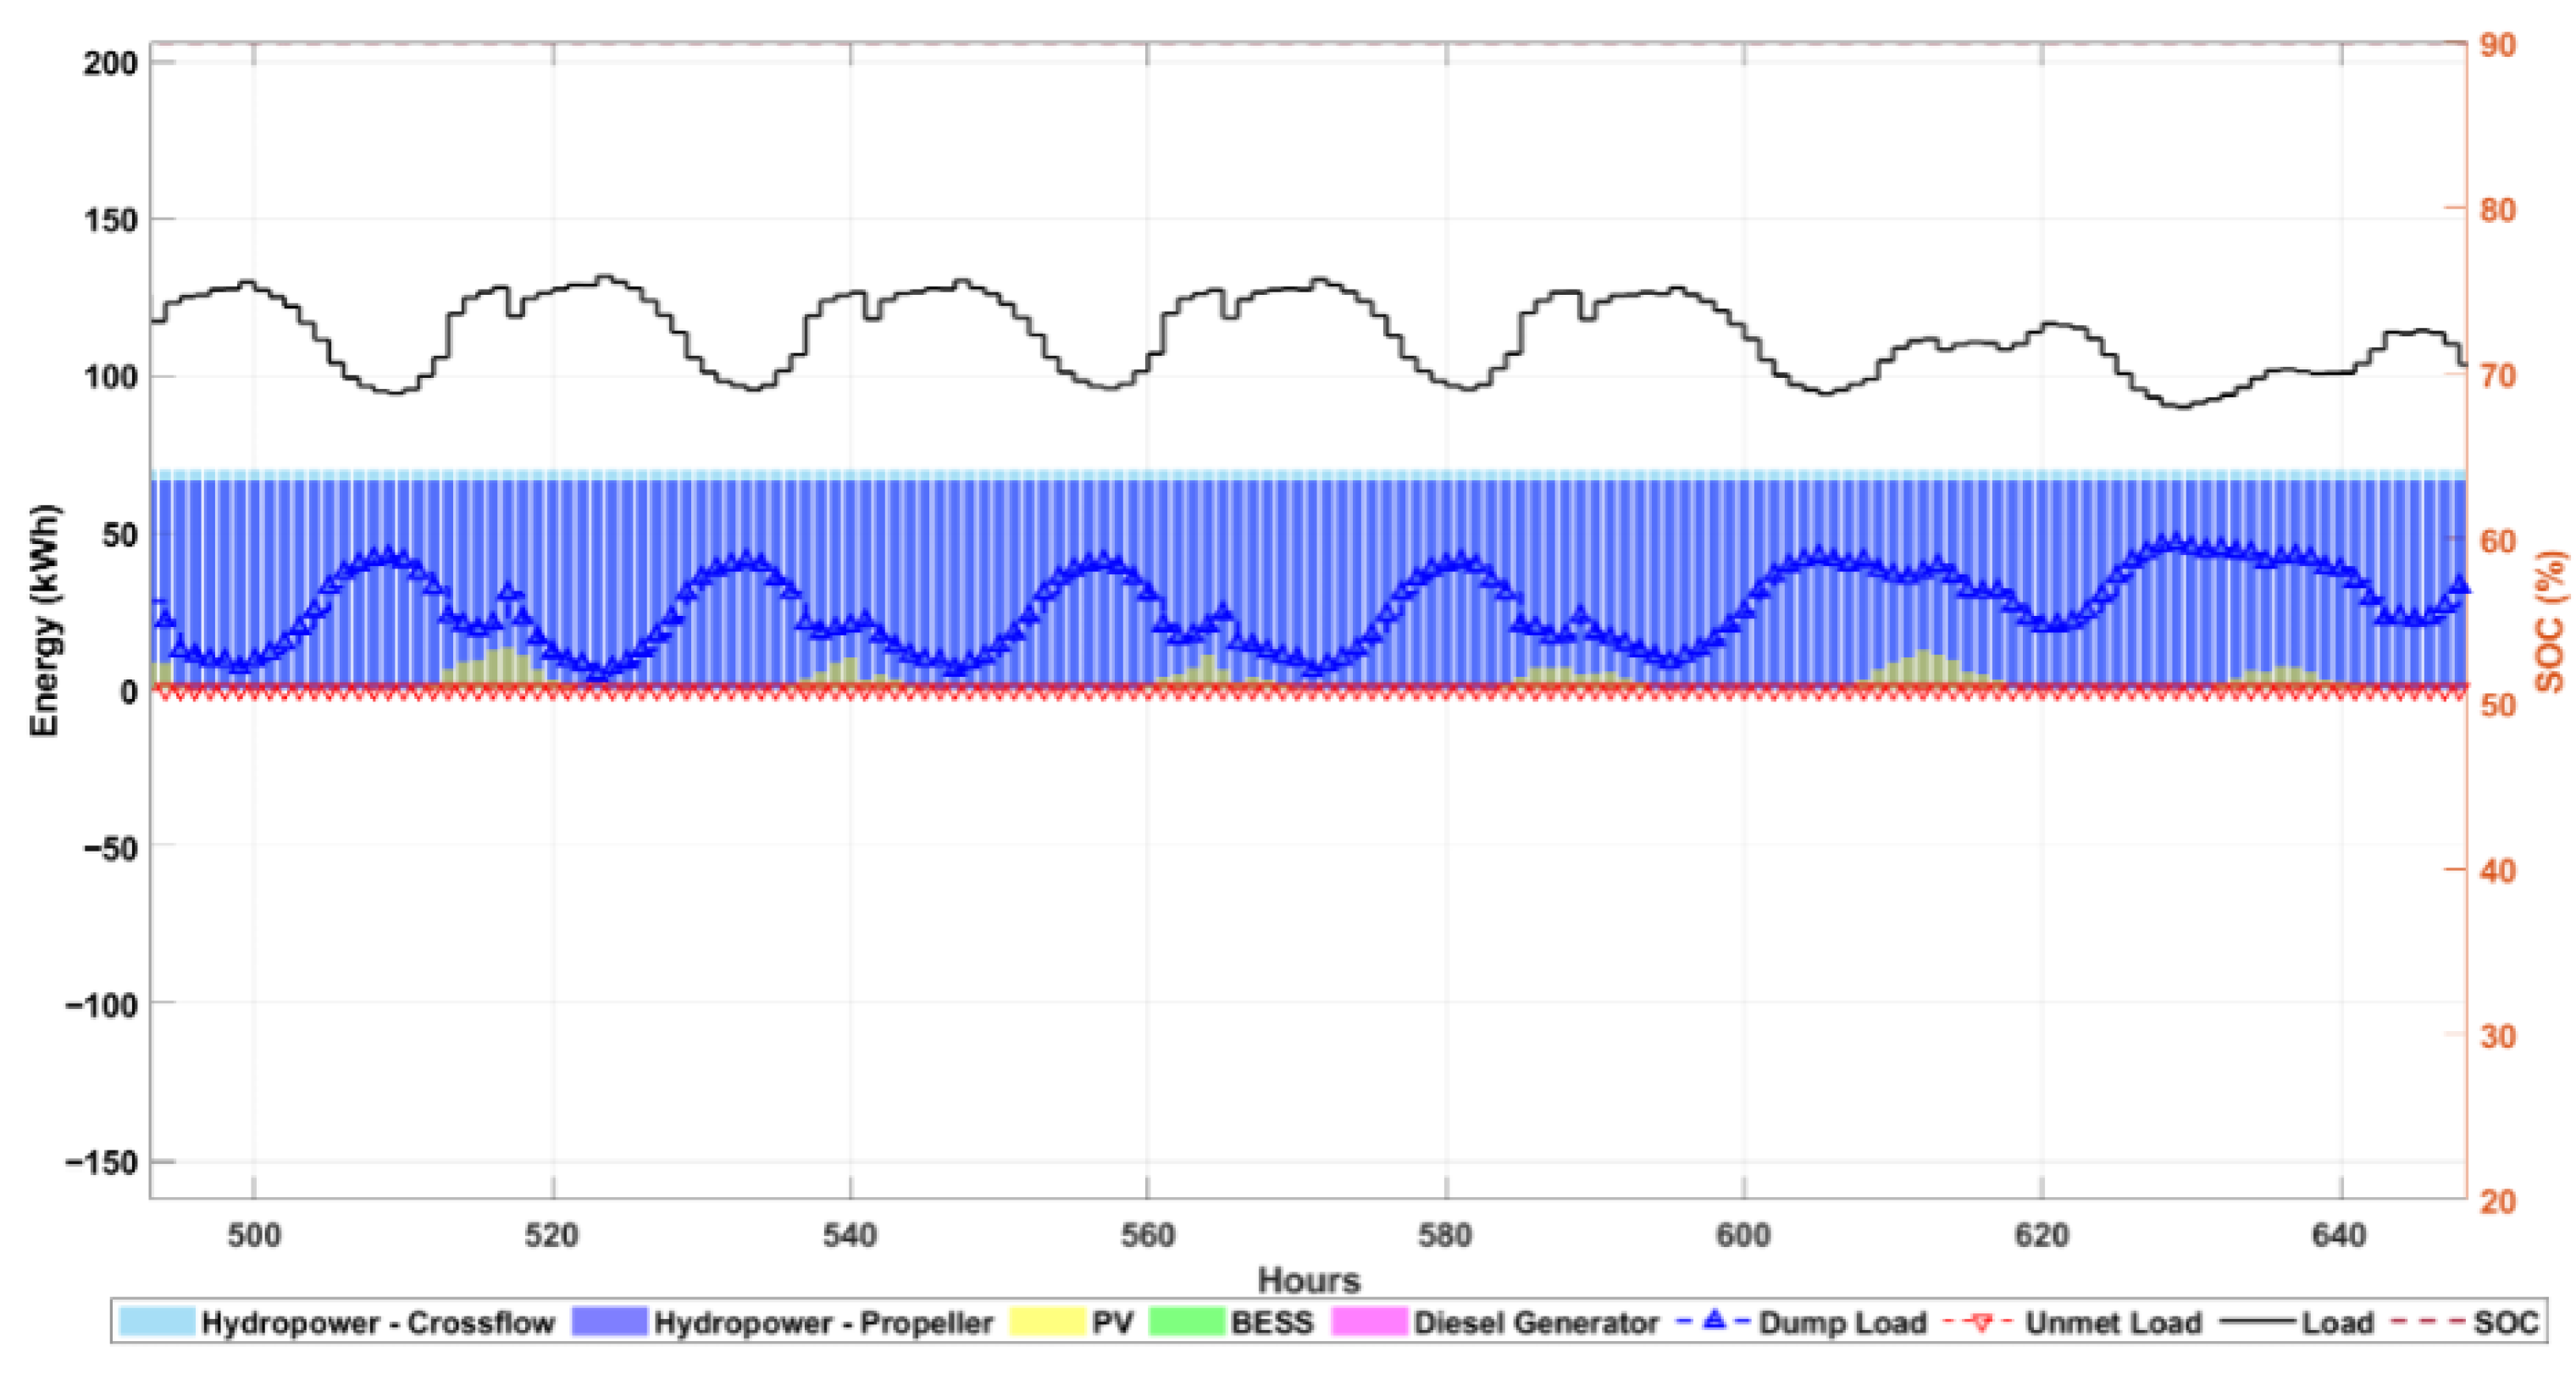
Dispatch behavior is examined at both monthly and weekly time scales to illustrate how hydropower variability, PV generation, and BESS state-of-charge (SOC) influence system operation. Figure 17, Figure 18 and Figure 19 present the dispatch profiles for Pareto Solution 1, while Figure 20, Figure 21 and Figure 22 show the corresponding results for Pareto Solution 2. The results highlight differences in hydropower utilization, SOC trajectories, diesel generator operation, and energy curtailment across the representative configurations. The ideal reference case (Figure 23, Figure 24 and Figure 25) is included as a benchmark for comparison under constant hydropower conditions.
Figure 17.
Monthly energy contributions of each component (Pareto Solution 1).
Figure 18.
Weekly dispatch snapshot in summer including SOC trajectory (Pareto Solution 1).
Figure 19.
Weekly dispatch snapshot in winter including SOC trajectory (Pareto Solution 1).
Figure 20.
Monthly energy contributions of each component (Pareto Solution 2).
Figure 21.
Weekly dispatch snapshot in summer including SOC trajectory (Pareto Solution 2).
Figure 22.
Weekly dispatch snapshot in winter including SOC trajectory (Pareto Solution 2).
Figure 23.
Monthly energy contributions of each component (Ideal reference case).
Figure 24.
Weekly dispatch snapshot in summer including SOC trajectory (Ideal reference case).
Figure 25.
Weekly dispatch snapshot in winter including SOC trajectory (Ideal reference case).
3.5. Cost Breakdown, Reliability, and Sustainability Indicators
The representative outcomes in Table 8 reveal distinct trade-offs. Pareto Solution 2 improves reliability (lower LPSP) relative to Pareto Solution 1, but this is accompanied by increased total system cost and higher emissions. In addition to the aggregate objectives (TSC, LPSP, and GHGe), component-resolved economic and operational indicators were reported. Specifically, TSC was decomposed into discounted CAPEX, replacement, and O&M costs for RoR hydro, PV, BESS, and DG, together with fuel cost when DG was enabled. Operational indicators included renewable fraction, curtailed energy share, DG energy share, and emissions intensity (kgCO2-eq/kWh served), which were computed consistently with the objective definitions.
3.6. Comparison with Baselines
A baseline comparison is conducted using (i) the crossflow-only design (Pareto Solution 1), (ii) the mixed-turbine design (Pareto Solution 2), and (iii) the ideal reference case. Figure 13 and Figure 14 summarize system-level trade-offs, while Figure 16 and Table 9 explain the physical mechanisms behind these trade-offs (operating envelope limitations and seasonal flow variability). The dispatch plots (Figure 17, Figure 18, Figure 19, Figure 20, Figure 21, Figure 22, Figure 23, Figure 24 and Figure 25) provide operational evidence supporting the cost–reliability–emissions outcomes by showing when and why diesel support is activated and how SOC constraints shape short-term balancing.
4. Discussion
4.1. Trade-Off Interpretation and Design Insights
The Pareto-optimal solutions demonstrate a clear three-way trade-off among cost, reliability, and sustainability. In general, lowering LPSP requires either (i) increasing firm renewable availability by expanding turbine feasibility across variable flow regimes or (ii) increasing buffering capability through BESS and/or diesel backup, both of which increase total system cost. The representative designs summarized in Table 8 illustrate this behavior: the solution with improved reliability (lower LPSP) is achieved with higher total system cost and higher emissions, indicating increased reliance on backup generation during low-flow periods and/or reduced renewable utilization due to operating constraints.
The dispatch snapshots (Figure 17, Figure 18, Figure 19, Figure 20, Figure 21 and Figure 22) provide operational evidence for the objective outcomes. Across representative cases, wet-season hydropower availability tends to charge the BESS toward its upper SOC bound and increases the likelihood of surplus energy (curtailment), while dry-season conditions increase the probability of SOC depletion and subsequent diesel activation. These results show that sizing decisions must be interpreted together with dispatch feasibility. Designs that appear sufficient on an annual energy basis may still experience reliability issues when short-term variability and turbine operating limits are considered.
The “Ideal” reference case assumes constant hydropower output and serves only as an analytical upper bound for comparison with practical designs.
4.2. Role of Turbine Selection Under Variable Flow
Turbine selection plays a decisive role in whether the hydropower subsystem remains operable across the full range of seasonal river-flow variability. Table 9 and Figure 16 show that a crossflow-only configuration can experience forced stoppages during high-flow extremes when operating conditions exceed the feasible region, which directly reduces the effective firm renewable contribution and increases the burden on storage and diesel backup. Conversely, the inclusion of an additional turbine type that covers higher-flow regimes expands the overall feasible operating envelope, increasing annual turbine operating hours and reducing the frequency of forced hydropower shutdown events.
Engineering findings indicate that turbine selection is a primary design factor. It must be co-optimized with sizing and dispatch, as the operating window determines the system’s firm renewable capacity. This is particularly important for mountainous catchments where wet-season variability can produce high-flow episodes that are outside the safe/efficient operating region of a single turbine family.
4.3. Implications for Practical Deployment
The results suggest several practical implications for deploying hybrid RoR hydro–solar microgrids in communities with strongly seasonal flow:
- Diesel backup should be treated as a resilience layer. Even when the design targets low-emission operation, DG can substantially reduce LPSP during compounded low-flow and low-irradiance periods, at the cost of higher emissions (Table 8).
- Operational policy matters. The dispatch plots (Figure 17, Figure 18, Figure 19, Figure 20, Figure 21, Figure 22, Figure 23, Figure 24 and Figure 25) show that SOC limits and priority rules strongly influence curtailment and diesel activation. Practically, conservative SOC reserve policies can improve reliability but may increase diesel usage and emissions.
For implementation, the minimum data required to reproduce these outcomes includes an hourly (or sub-hourly) load series, an hourly flow series (or scenario set), and local irradiance/temperature data. In addition, turbine feasibility curves should be verified against site head and expected discharge range to avoid selecting turbine parameters that are optimal only under nominal conditions.
4.4. Limitations
Several limitations should be considered when interpreting the results:
- Rule-based dispatch approximation. The EMS is designed to be interpretable and feasible; however, it does not guarantee globally optimal operational decisions at each time step. Optimization-based dispatch (e.g., MPC) could yield different curtailment and diesel patterns.
- Parameter uncertainty. Hydrological variability, PV performance parameters, and diesel fuel price uncertainty can materially affect the objective trade-offs. This motivates formal sensitivity and robustness analysis (Section 5).
- Component aging effects. Battery degradation and turbine efficiency degradation are not explicitly modeled; including them may shift the cost–reliability trade-off and alter the best-compromise choice.
- Grid interaction and demand response. The current formulation assumes a standalone supply obligation without controllable loads. Demand response or flexible load management could reduce required storage and diesel capacity while maintaining reliability.
5. Sensitivity Analysis
5.1. Scenario Generation Method
To evaluate the robustness of the optimized hybrid microgrid configurations, a deterministic sensitivity analysis was conducted by perturbing key environmental parameters after the baseline optimization. Rather than embedding uncertainty directly within the optimization framework, the sensitivity analysis was implemented as a post-optimization evaluation of the Pareto-optimal solutions obtained from the baseline case.
Hydrological uncertainty was modeled by applying scaling factors to the baseline hourly river discharge time series. The perturbed flow for scenario (s) is defined as
where represents the baseline hourly river discharge and is the scaling factor corresponding to different hydrological conditions. This deterministic scaling approach preserves the temporal characteristics of the original dataset while representing plausible variations in water availability.
Four hydrological scenarios were considered to evaluate system performance under varying river-flow conditions: severe drought (), dry year (), baseline conditions (), and wet year conditions (). For each scenario, the modified river discharge series was used to re-evaluate system performance using the hybrid renewable energy model. The resulting changes in cost, reliability, and emissions were then quantified to assess the robustness of the optimized system designs.
Table 11 summarizes the sensitivity of system performance under different hydrological conditions. The results demonstrate that hydrological variability has a noticeable influence on system performance. Under severe drought conditions , reduced river discharge limits hydropower production, leading to higher loss of power supply probability (LPSP = 1.12%) due to increased reliance on backup generation. As river flow increases toward baseline conditions, reliability improves significantly, with LPSP decreasing to 0.53%. In addition, greenhouse gas emissions decrease under higher flow conditions because increased hydropower generation reduces diesel generator operation. These results highlight the importance of considering hydrological uncertainty when evaluating the robustness of hybrid hydro-solar microgrid systems.
Table 11.
Sensitivity of system performance to hydrological variability.
5.2. Load Growth Sensitivity
Load-growth sensitivity was evaluated by scaling the annual demand series shown in Figure 7 using
The analysis reveals that moderate demand growth can be accommodated by the existing hybrid system through increased BESS cycling and occasional diesel activation. However, beyond a certain threshold, reliability degrades rapidly as generation capacity and storage power limits become insufficient to cover peak demand periods. Under the 30% load-growth scenario, LPSP increases significantly for the crossflow-only configuration due to its limited hydropower contribution during dry periods. The mixed-turbine configuration demonstrates improved resilience because the additional turbine expands the hydropower operating envelope and reduces dependence on diesel backup.
These results indicate that reliability degradation under load growth is driven primarily by short-term power mismatches rather than annual energy deficits. Consequently, storage power capacity and turbine feasibility limits play a critical role in maintaining system reliability as demand increases.
5.3. PV and Battery Cost Sensitivity
Because photovoltaic modules and battery systems typically dominate the capital cost of hybrid microgrids, a cost sensitivity analysis was performed by applying cost multipliers of and to the PV and BESS capital costs. For each scenario, the economic performance metrics (NPC and LCOE) were recalculated while keeping system operation and dispatch logic unchanged.
The results indicate that decreasing PV costs shifts the preferred design toward larger PV capacity, increasing renewable penetration and reducing diesel utilization. Conversely, increasing battery costs reduces the economic attractiveness of large storage capacities and slightly increases diesel generator dispatch during deficit periods. Despite these shifts, the overall structure of the Pareto front remains stable, indicating that the optimized configurations are relatively robust to moderate variations in technology costs. This suggests that turbine feasibility and hydrological variability exert a stronger influence on system performance than moderate fluctuations in PV and battery prices.
5.4. Fuel Price and Emissions Factors
For system configurations including diesel backup, fuel price and emissions factor assumptions directly influence both economic and environmental performance metrics. Sensitivity tests varied the diesel fuel price and the associated emissions factor while maintaining the same dispatch policy and system configuration.
The analysis shows that higher fuel prices increase the total system cost and encourage greater reliance on renewable generation and battery discharge where feasible. However, during extended low-flow periods when hydropower output is constrained by turbine operating limits, diesel generation remains necessary to maintain reliability. As a result, emissions levels are primarily driven by the frequency of diesel activation caused by hydrological feasibility losses rather than dispatch policy alone. This finding underscores the importance of improving renewable operability (e.g., through turbine selection) to reduce both cost and emissions in hybrid microgrids.
5.5. Robust Design Implications
Based on the stress-test results, robust system design should prioritize configurations that maintain acceptable reliability across extreme operating conditions while limiting cost escalation and emissions growth. A practical robustness criterion requires
under all tested scenarios. Among the feasible solutions satisfying this constraint, the minimum-cost configuration can then be selected as the preferred design.
Applying this criterion to the evaluated scenarios indicates that configurations incorporating multiple turbine types provide greater resilience to seasonal flow variability compared with single-turbine designs. By expanding the feasible hydropower operating range, mixed-turbine systems reduce the frequency of forced shutdown events and therefore limit the need for diesel backup under both drought conditions and demand growth. Consequently, turbine feasibility emerges as a critical design factor for improving the long-term robustness of run-of-river hybrid microgrids.
The sensitivity analysis evaluates parameter variations independently and does not account for correlated or simultaneous changes among inputs.
- Limitation and Implications on Robustness
It is important to note that the sensitivity analysis conducted in this study is deterministic in nature and is performed as a post-optimization assessment. Uncertainty in key input parameters, such as river flow, load demand, and economic factors, is not explicitly incorporated within the optimization framework.
Furthermore, the sensitivity analysis is based on independent parameter perturbations, where each variable is varied individually while others are held constant. As a result, potential interactions and correlations between parameters are not captured. In practical systems, simultaneous variations in multiple factors may influence system performance and alter the shape and stability of the Pareto front.
Despite these limitations, the analysis provides valuable insights into the responsiveness of system performance to key parameters and supports the robustness of the observed trade-offs among cost, reliability, and emissions. However, the results should be interpreted within the context of these assumptions.
6. Conclusions
6.1. Summary of Key Findings
This paper presented a multi-objective optimization framework for a hybrid run-of-river hydro–solar microgrid with explicit turbine selection and dispatch-aware performance evaluation. The results reveal a clear cost–reliability–sustainability trade-off across the Pareto set, where representative solutions show that improving reliability can increase both total system cost and emissions (Table 8). Turbine selection under variable flow is shown to materially affect hydropower availability: mixed turbine configurations expand operability across seasonal extremes, increase annual operating hours, and reduce forced shutdowns relative to single-turbine configurations (Table 9, Figure 16). Dispatch results further confirm that wet-season hydropower typically elevates battery state-of-charge and increases surplus energy, whereas dry-season shortfalls raise diesel-generator reliance and unmet-load risk; together, these patterns explain the objective outcomes and provide practical guidance for sizing and operational planning (Figure 17, Figure 18, Figure 19, Figure 20, Figure 21, Figure 22, Figure 23, Figure 24 and Figure 25).
6.2. Engineering Recommendations
For practical deployment in seasonal run-of-river sites, the findings support several engineering recommendations. Turbine selection should be co-designed with microgrid sizing, with operability verified across the full seasonal flow range rather than only at nominal conditions (Table 9, Figure 16). Battery capacity should be sized to manage short-term variability and provide reliability margins, and the adequacy of the selected capacity should be validated using weekly state-of-charge and dispatch trajectories rather than solely annual energy balances (Figure 18, Figure 19, Figure 20, Figure 21 and Figure 22). When included, the diesel generator is best treated as a resilience layer whose emissions impact is explicitly quantified within the multi-objective formulation, since the Pareto solutions demonstrate how diesel usage can shift the cost–reliability balance (Table 8). Finally, scenario-based planning for river flow and PV/temperature conditions should be adopted as standard practice to avoid overfitting designs to a single nominal year and to improve robustness under interannual variability.
6.3. Future Work
Future work should extend the framework toward stochastic or robust multi-objective optimization under explicit uncertainty sets for hydrological and solar resources, enabling direct evaluation of Pareto front stability under correlated and uncertain operating conditions. Additional extensions include degradation-aware battery modeling, lifecycle emissions assessment, advanced dispatch strategies, and field validation using system data.
Author Contributions
Conceptualization, Y.C. and R.P.T.; methodology, Y.C., R.P.T., S.M.M.G. and Y.N.; software, J.J.A.A.; formal analysis, J.J.A.A. and S.M.M.G.; investigation, R.P.T. and Y.N.; resources, Y.C.; data curation, Y.C.; writing—original draft preparation, Y.C. and R.P.T.; writing—review and editing, R.P.T., J.J.A.A. and S.M.M.G.; visualization, Y.C., J.J.A.A. and S.M.M.G.; supervision, Y.N.; project administration, Y.N. All authors have read and agreed to the published version of the manuscript.
Funding
This research received no external funding.
Institutional Review Board Statement
Not applicable.
Informed Consent Statement
Not applicable.
Data Availability Statement
The data supporting the findings of this study are available from the corresponding author upon reasonable request.
Acknowledgments
The authors used language editing tools, including ChatGPT and Grammarly, to improve the clarity and readability of the manuscript. All content has been reviewed and verified by the authors.
Conflicts of Interest
The authors declare no conflicts of interest.
Nomenclature
| Abbreviations | |
| BESS | Battery energy storage system |
| CAPEX | Capital expenditure |
| DG | Diesel generator |
| GHG | Greenhouse gas emissions |
| HREM | Hybrid renewable energy microgrid |
| LCOE | Levelized cost of energy |
| LOLP | Loss of load probability |
| LPSP | Loss of power supply probability |
| MOO | Multi-objective optimization |
| MOPSO | Multi-objective particle swarm optimization |
| NPC | Net present cost |
| O&M | Operation and maintenance |
| PMS | Power management strategy |
| PSO | Particle swarm optimization |
| PV | Photovoltaics |
| RoR | Run-of-river hydropower |
| Symbols | |
| Load demand at time t (kW) | |
| PV power output at time t (kW) | |
| Hydropower output at time t (kW) | |
| Diesel generator output at time t (kW) | |
| BESS charging power (kW) | |
| BESS discharging power (kW) | |
| Curtailed power (kW) | |
| Unserved load power (kW) | |
| Energy capacity of the BESS (kWh) | |
| State of charge of the BESS at time t | |
| River discharge at time t (m3/s) | |
| Turbine flow rate (m3/s) | |
| Net hydraulic head (m) | |
| Overall hydropower efficiency | |
| Turbine efficiency | |
| Generator efficiency | |
| Expected energy not served (kWh/year) | |
| Economic parameters | |
| Capital cost of system components (USD) | |
| Replacement cost (USD) | |
| Operation and maintenance cost (USD) | |
| Fuel cost of diesel generator (USD) | |
| Capital recovery factor | |
| i | Real discount rate |
| N | Project lifetime (yrs) |
| Technical parameters | |
| Fixed coefficient of fuel consumption (l/kWh) | |
| Variable coefficient of fuel consumption (l/kWh) | |
| Temperature power coefficient of PV modules | |
| Charging efficiency of the BESS | |
| Discharging efficiency of the BESS | |
References
- HassanzadehFard, H.; Tooryan, F.; Dargahi, V.; Jin, S. A cost-efficient sizing of grid-tied hybrid renewable energy system with different types of demands. Sustain. Cities Soc. 2021, 73, 103080. [Google Scholar] [CrossRef] [Scilit]
- Kassab, F.A.; Celik, B.; Locment, F.; Sechilariu, M.; Liaquat, S.; Hansen, T.M. Optimal sizing and energy management of a microgrid: A joint MILP approach for minimization of energy cost and carbon emission. Renew. Energy 2024, 224, 120186. [Google Scholar] [CrossRef] [Scilit]
- Javed, M.S.; Ma, T.; Jurasz, J.; Ahmed, S.; Mikulik, J. Performance comparison of heuristic algorithms for optimization of hybrid off-grid renewable energy systems. Energy 2020, 210, 118599. [Google Scholar] [CrossRef] [Scilit]
- Zhang, Z.; Yang, X.; Wang, Z.; Chen, Z.; Zheng, Y. Highly applicable small hydropower microgrid operation strategy and control technology. Energy Rep. 2020, 6, 3179–3191. [Google Scholar] [CrossRef] [Scilit]
- Borkowski, D.; Cholewa, D.; Korzeń, A. Run-of-the-River Hydro-PV Battery Hybrid System as an Energy Supplier for Local Loads. Energies 2021, 14, 5160. [Google Scholar] [CrossRef] [Scilit]
- Zhang, Y.; Ma, C.; Yang, Y.; Pang, X.; Liu, L.; Lian, J. Study on short-term optimal operation of cascade hydro photovoltaic systems. Appl. Energy 2021, 291, 116828. [Google Scholar] [CrossRef] [Scilit]
- Bhayo, B.A.; Al-Kayiem, H.H.; Gilani, S.I.; Khan, N.; Kumar, D. Energy management strategy of hybrid solar-hydro system with various probabilities of power supply loss. Sol. Energy 2022, 233, 230–245. [Google Scholar] [CrossRef] [Scilit]
- Pengtem, C.; Deuem, S.; Ilah, A.; Ohgaki, H.; Romphochai, S.; Bhumkittipich, P.; Bhumikitipich, K. Design of Multi-Objective Energy Management for Remote Communities Connected with an Optimal Hybrid Integrated Photovoltaic–Hydropower–Battery Energy Storage System (PV–HP–BESS) Using Improved Particle Swarm Optimization. Energies 2025, 18, 2250. [Google Scholar] [CrossRef] [Scilit]
- Tarife, R.; Nakanishi, Y.; Chen, Y.; Zhou, Y.; Estoperez, N.; Tahud, A. Optimization of Hybrid Renewable Energy Microgrid for Rural Agricultural Area in Southern Philippines. Energies 2022, 15, 2251. [Google Scholar] [CrossRef] [Scilit]
- Chaulagain, R.K.; Poudel, L.; Maharjan, S. A review on non-conventional hydropower turbines and their selection for ultra-low-head applications. Heliyon 2023, 9, e17753. [Google Scholar] [CrossRef] [Scilit]
- Sudsuansee, T.; Phitaksurachai, S.; Pan-Aram, R.; Sritrakul, N.; Tiaple, Y. Design and hydrodynamic performance of low head propeller hydro turbine for wide range high efficiency operation. Int. J. Thermofluids 2025, 27, 101228. [Google Scholar] [CrossRef] [Scilit]
- Uniyal, V.; Karn, A.; Singh, V.P. Comparative life cycle assessment of micro water Turbines: Evaluating potential for remote power generation. Sustain. Energy Technol. Assess. 2025, 73, 104107. [Google Scholar] [CrossRef] [Scilit]
- Durvasulu, V.; Balliet, W.H.; Lopez, C.J.; Lin, Y.; Li, B.; Alam, S.M.S.; Mahalik, M.R.; Kwon, J.; Mosier, T.M.R. Rationale for adding batteries to hydropower plants and tradeoffs in hybrid system operation: A review. Renew. Sustain. Energy Rev. 2024, 202, 114673. [Google Scholar] [CrossRef] [Scilit]
- Allouhi, A. A hybrid PV/wind/battery energy system to assist a run-of-river micro-hydropower for clean electrification and fuelling hydrogen mobility for young population in a rural Moroccan site. J. Clean. Prod. 2024, 442, 140852. [Google Scholar] [CrossRef] [Scilit]
- Belboul, Z.; Toual, B.; Bensalem, A.; Ghenai, C.; Khan, B.; Kamel, S. Techno-economic optimization for isolated hybrid PV/wind/battery/diesel generator microgrid using improved salp swarm algorithm. Sci. Rep. 2024, 14, 2920. [Google Scholar] [CrossRef] [Scilit]
- Rathod, A.A.; S, B. Modified Harris Hawks optimization for the 3E feasibility assessment of hybrid renewable energy system. Sci. Rep. 2024, 14, 20127. [Google Scholar] [CrossRef] [Scilit]
- Shan, R.; Sasthav, C.; Wang, X.; Lima, L.M.M. Complementary relationship between small-hydropower and increasing penetration of solar photovoltaics: Evidence from CAISO. Renew. Energy 2020, 155, 1139–1146. [Google Scholar] [CrossRef] [Scilit]
- Raya-Armenta, J.M.; Bazmohammadi, N.; Avina-Cervantes, J.G.; Sáez, D.; Vasquez, J.C.; Guerrero, J.M. Energy management system optimization in islanded microgrids: An overview and future trends. Renew. Sustain. Energy Rev. 2021, 149, 111327. [Google Scholar] [CrossRef] [Scilit]
- Allwyn, R.G.; Al-Hinai, A.; Margaret, V. A comprehensive review on energy management strategy of microgrids. Energy Rep. 2023, 9, 5565–5591. [Google Scholar] [CrossRef] [Scilit]
- Cheng, Q.; Liu, P.; Feng, M.; Cheng, L.; Ming, B.; Luo, X.; Liu, W.; Xu, W.; Huang, K.; Xia, J. Complementary operation of hydropower station with photovoltaic and wind farms: Impacts on hydropower efficiency and recoverable energy. Appl. Energy 2023, 342, 120079. [Google Scholar] [CrossRef] [Scilit]
- Krzemianowski, Z.; Kaniecki, M. Low-head high specific speed Kaplan turbine for small hydropower – design, CFD loss analysis and basic, cavitation and runaway investigations: A case study. Energy Convers. Manag. 2023, 276, 116558. [Google Scholar] [CrossRef] [Scilit]
- Mehr, G.; Durali, M.; Khakrand, M.H.; Hoghooghi, H. A novel design and performance optimization methodology for hydraulic Cross-Flow turbines using successive numerical simulations. Renew. Energy 2021, 169, 1402–1421. [Google Scholar] [CrossRef] [Scilit]
- Anagnostopoulos, J.S.; Papantonis, D.E. Optimal sizing of a run-of-river small hydropower plant. Energy Convers. Manag. 2007, 48, 2663–2670. [Google Scholar] [CrossRef] [Scilit]
- Wang, S.; Guo, D.; Han, X.; Lu, L.; Sun, K.; Li, W.; Sauer, D.U.; Ouyang, M. Impact of battery degradation models on energy management of a grid-connected DC microgrid. Energy 2020, 207, 118228. [Google Scholar] [CrossRef] [Scilit]
- Ahmad, S.; Shafiullah, M.; Ahmed, C.B.; Alowaifeer, M. A Review of Microgrid Energy Management and Control Strategies. IEEE Access 2023, 11, 24851–24876. [Google Scholar] [CrossRef] [Scilit]
- Shezan, S.A.; Hasan, K.N.; Rahman, A.; Datta, M.; Datta, U. Selection of Appropriate Dispatch Strategies for Effective Planning and Operation of a Microgrid. Energies 2021, 14, 7217. [Google Scholar] [CrossRef] [Scilit]
- Abbas, F.A.; Obed, A.A.; Qasim, M.A.; Yaqoob, S.J.; Ferahtia, S. An efficient energy-management strategy for a DC microgrid powered by a photovoltaic/fuel cell/battery/supercapacitor. Clean Energy 2022, 6, 827–839. [Google Scholar] [CrossRef] [Scilit]
- Jamal, S.; Pasupuleti, J.; Ekanayake, J. A rule-based energy management system for hybrid renewable energy sources with battery bank optimized by genetic algorithm optimization. Sci. Rep. 2024, 14, 4865. [Google Scholar] [CrossRef] [Scilit]
- Modu, B.; Abdullah, M.P.; Alkassem, A.; Hamza, M.F. Optimal rule-based energy management and sizing of a grid-connected renewable energy microgrid with hybrid storage using Levy Flight Algorithm. Energy Nexus 2024, 16, 100333. [Google Scholar] [CrossRef] [Scilit]
- Bouchekara, H.R.E.H.; Sha’aban, Y.A.; Shahriar, M.S.; Abdullah, S.M.; Ramli, M.A. Sizing of Hybrid PV/Battery/Wind/Diesel Microgrid System Using an Improved Decomposition Multi-Objective Evolutionary Algorithm Considering Uncertainties and Battery Degradation. Sustainability 2023, 15, 11073. [Google Scholar] [CrossRef] [Scilit]
- Guo, C.; Wang, X.; Zheng, Y.; Zhang, F. Real-time optimal energy management of microgrid with uncertainties based on deep reinforcement learning. Energy 2022, 238, 121873. [Google Scholar] [CrossRef] [Scilit]
- Panda, S.P.; Genest, B.; Easwaran, A.; Rigo-Mariani, R.; Lin, P. Methods for mitigating uncertainty in real-time operations of a connected microgrid. Sustain. Energy Grids Netw. 2024, 38, 101334. [Google Scholar] [CrossRef] [Scilit]
- Safder, M.U.; Hossain, M.A.; Sanjari, M.J.; Lu, J. Rule-based energy management system for autonomous voltage stabilization in standalone DC microgrid. Energy Sci. Eng. 2024, 12, 4278–4293. [Google Scholar] [CrossRef] [Scilit]
- Kheir, F.J.; Ueda, S.; Ishibashi, T.; Kinjo, M.; Halidou, I.T.; Furukakoi, M.; Senjyu, T. Scenario-based optimization of standalone microgrids using PSO: Comparative assessment of hybrid configurations for off-grid electrification in Unguja Island. AIMS Energy 2025, 13, 938–961. [Google Scholar] [CrossRef] [Scilit]
- Ishraque, M.F.; Shezan, S.A.; Ali, M.M.; Rashid, M.M. Optimization of load dispatch strategies for an islanded microgrid connected with renewable energy sources. Appl. Energy 2021, 292, 116879. [Google Scholar] [CrossRef] [Scilit]
- Sadeghi, D.; Ameri, M.; Bina, M.T. Optimal sizing of hybrid renewable energy systems in presence of electric vehicles using multi-objective particle swarm optimization. Energy 2020, 209, 118471. [Google Scholar] [CrossRef] [Scilit]
- Riou, M.; Dupriez-Robin, F.; Grondin, D.; Le Loup, C.; Benne, M.; Tran, Q.T. Multi-Objective Optimization of Autonomous Microgrids with Reliability Consideration. Energies 2021, 14, 4466. [Google Scholar] [CrossRef] [Scilit]
- Faria, J.; Marques, C.; Pombo, J.; Mariano, S.; Calado, M.R. Optimal Sizing of Renewable Energy Communities: A Multiple Swarms Multi-Objective Particle Swarm Optimization Approach. Energies 2023, 16, 7227. [Google Scholar] [CrossRef] [Scilit]
- Okendo, E.O.; Farzaneh, H. Multi-objective optimal sizing and location of the grid-connected renewable microgrids, considering cost-effectiveness, power loss, and network stability approaches. Energy Convers. Manag. X 2025, 29, 101465. [Google Scholar] [CrossRef] [Scilit]
- Wang, Y.; Wen, X.; Su, H.; Qin, J.; Kong, L. Real-time dispatch of hydro-photovoltaic (PV) hybrid system based on dynamic load reserve capacity. Energy 2023, 285, 129420. [Google Scholar] [CrossRef] [Scilit]
- Canales, F.A.; Jurasz, J. Assessing micro-scale solar-wind-hydro complementarity in a mountainous catchment through the stability coefficient. Sustain. Energy Technol. Assess. 2025, 82, 104537. [Google Scholar] [CrossRef] [Scilit]
- Wu, X.; Shan, Y.; Fan, K. A Modified Particle Swarm Algorithm for the Multi-Objective Optimization of Wind/Photovoltaic/Diesel/Storage Microgrids. Sustainability 2024, 16, 1065. [Google Scholar] [CrossRef] [Scilit]
- Zhang, H.; Lu, Z.; Hu, W.; Wang, Y.; Dong, L.; Zhang, J. Coordinated optimal operation of hydro–wind–solar integrated systems. Appl. Energy 2019, 242, 883–896. [Google Scholar] [CrossRef] [Scilit]
- Huang, K.; Liu, P.; Ming, B.; Kim, J.-S.; Gong, Y. Economic operation of a wind-solar-hydro complementary system considering risks of output shortage, power curtailment and spilled water. Appl. Energy 2021, 290, 116805. [Google Scholar] [CrossRef] [Scilit]
- Kabbani, A.; Mohamed Shaik, H. PV Cell Parameters Modeling and Temperature Effect Analysis. Int. J. Renew. Energy Dev. 2021, 10, 563–571. [Google Scholar] [CrossRef] [Scilit]
- Elyaqouti, M.; Boulfaf, N.; Hamid, N.; Izbaim, D.; Chaoufi, J.; Bouhouch, L. Thermal and electrical modelling of photovoltaic modules. Int. J. Ambient Energy 2022, 43, 5793–5809. [Google Scholar] [CrossRef] [Scilit]
- Rao, R.V.; Lakshmi, R.J. Ranking of Pareto-optimal solutions and selecting the best solution in multi- and many-objective optimization problems using R-method. Soft Comput. Lett. 2021, 3, 100015. [Google Scholar] [CrossRef] [Scilit]
- He, T.; Li, S.; Chen, Y.; Wu, S.; Li, C. Optimal Array Reconfiguration of a PV Power Plant for Frequency Regulation of Power Systems. Front. Energy Res. 2021, 9, 698003. [Google Scholar] [CrossRef] [Scilit]
- Xu, B.; Sun, Y.; Huang, X.; Zhong, P.A.; Zhu, F.; Zhang, J.; Wang, X.; Wang, G.; Ma, Y.; Lu, Q.; et al. Scenario-Based Multiobjective Robust Optimization and Decision-Making Framework for Optimal Operation of a Cascade Hydropower System Under Multiple Uncertainties. Water Resour. Res. 2022, 58, e2021WR030965. [Google Scholar] [CrossRef] [Scilit]

Disclaimer/Publisher’s Note: The statements, opinions and data contained in all publications are solely those of the individual author(s) and contributor(s) and not of MDPI and/or the editor(s). MDPI and/or the editor(s) disclaim responsibility for any injury to people or property resulting from any ideas, methods, instructions or products referred to in the content. |
© 2026 by the authors. Licensee MDPI, Basel, Switzerland. This article is an open access article distributed under the terms and conditions of the Creative Commons Attribution (CC BY) license.