


Abstract
The rapid expansion of the high electricity-intensive industries like data center has led to a structural increase in industrial electricity demand, thereby increasing the need for demand response (DR) to enhance power system flexibility. However, in the industrial sector, DR strategies based solely on simple load curtailment can impose productivity losses on participating customers. To address this limitation, this study proposes an SMP-based load shifting linear programming (LP) optimization model that enables DR curtailment to translate into electricity cost reduction through clustered DR resources formed by combining load resources at the industrial complex level. The decision variables representing hourly load shifting are adjusted under constraints defined by the hourly average demand and flexibility of the load resources, and the averages and fluctuations of SMP. The objective function is optimized to minimize the total electricity cost. Since the demand flexibility varies by season, experiments are conducted about various clustered DR resources on a seasonal basis. When resources with similar hourly average demand and flexibility are combined, the resulting load shifting plans are found to yield the greatest electricity cost reduction (Scenario 2—0.79 M KRW). These results confirm that the proposed load shifting LP model can provide a practical approach for DR operation planning.
1. Introduction
The recent rapid growth of the semiconductor manufacturing, data center, and artificial intelligence industries is driving a structural shift in electricity demand. In particular, as advanced process technologies evolve, power consumption per semiconductor manufacturing line has increased exponentially; for sub-3 nm ultra-fine processes, power requirements can exceed those of conventional processes by more than a factor of two. At the same time, the proliferation of generative AI and large language models is causing electricity consumption by data centers to rise by more than 20% per year on average [1]. AI model training and inference using GPU clusters require massive computing resources, and some scenarios project that this load could account for more than approximately 10% of total electricity consumption in the United States [2]. These industrial-structure changes are placing unprecedented stress on power supply systems. According to the International Energy Agency (IEA), global electricity demand from data centers and AI is expected to more than triple by 2030, while electricity demand from the semiconductor industry is also projected to continue increasing. Domestically, expansions in production capacity by major semiconductor firms and the entry of AI companies into Korea are expected to generate additional electricity demand on the order of several gigawatts (GW) over the next five years [3].
Traditionally, responses to rising electricity demand have relied on expanding supply—namely, constructing new power plants and augmenting transmission and distribution infrastructure. However, this approach entails substantial upfront investment and long lead times. For new power plants, the time required from planning to commercial operation typically ranges from 5 to more than 10 years, and further delays frequently occur due to environmental impact assessments, site selection, and the need to secure local acceptance. Moreover, considering policies for transitioning to renewable energy to meet carbon-neutrality goals and plans to reduce baseload generation, securing large-scale supply capacity in the short term faces significant practical constraints. As an alternative to overcome these limitations, demand response (DR) has attracted increasing attention. DR maintains grid balance by adjusting demand when electricity demand risks exceeding available supply. Compared with supply expansion, DR can be implemented in a relatively shorter timeframe and is evaluated as a cost-effective approach [4]. Internationally, advanced economies such as the United States and European countries already use DR as a core instrument of power system operation, and the advancement of smart grid technologies and the adoption of real-time electricity pricing provide the technical foundation to enhance DR effectiveness.
To maximize the impact of DR, participation by the industrial sector—which accounts for a substantial share of electricity consumption, particularly large industrial complexes—is essential. Industrial complexes consist of spatially clustered industrial facilities that share common infrastructure and energy supply systems. In the Korean context, the term industrial complex level refers not to individual factories or buildings, but to a nationally planned spatial unit in which manufacturing firms belonging to specific industrial sectors are geographically clustered and developed at the regional level. Because firms within an industrial complex tend to belong to similar industries, their electricity consumption exhibits comparable load patterns. Consequently, when demand resources from multiple industrial complexes with different industrial characteristics are aggregated and jointly participate in DR, synergistic effects can be achieved in terms of load shifting.
In Korea, the industrial sector accounts for more than 50% of total electricity consumption and is therefore the most important target for DR; a single industrial complex alone can possess demand-adjustment potential ranging from hundreds of megawatts (MW) to several gigawatts (GW) [5]. In particular, advanced industrial complexes where semiconductors, data centers, and AI infrastructure are concentrated are regarded as key DR resources due to their high power density and operational flexibility. However, managing industrial electricity demand involves fundamentally different characteristics and complexities compared with the residential and commercial sectors. In industry, electricity is not merely a consumer good but a core input to production. Accordingly, reducing electricity demand inevitably translates into lower output, degraded product quality, and delivery delays—i.e., direct losses in productivity. In semiconductor manufacturing, even momentary fluctuations in power supply can cause wafer defects, and a single production stoppage can lead to losses of tens of billions of won. In data centers, stable power supply is also essential to comply with service level agreements (SLAs) and preserve data integrity. For industries operating continuous processes, interruptions or reductions in power supply can therefore cause enormous economic losses, including equipment damage, loss of raw materials, and restart costs.
Therefore, to induce active DR participation by industrial users, it is necessary to develop rational production scheduling adjustment strategies that consider not only simple reductions in electricity usage but also the electricity price structure and the feasible range of load increases and reductions. First, in the power market, the system marginal price (SMP) for each time period is defined as the marginal generation cost of the last generator required to meet electricity demand in that period, and it is determined in real time depending on supply–demand conditions and the generation mix. Because SMP directly reflects cost differences by time of use, it is a key factor for quantitatively evaluating the economic benefits of DR and load shifting [6]. In addition, the time-dependent feasible range of increasing or decreasing electricity demand without productivity loss (flexibility range) enables shifting of production load without incurring additional costs beyond electricity expenses, thereby allowing additional profits. For example, if electricity usage in a given period can be increased or decreased by a certain percentage without generating any additional costs other than electricity cost, production can be shifted from periods with relatively high SMP to periods with relatively low SMP. Because the flexibility range differs across time periods, the reduced electricity usage in one period may need to be redistributed across multiple other periods; thus, this problem is addressed using an optimization model.
From this perspective, this study aims to develop an industrial electricity demand redistribution optimization model that incorporates time-varying SMP and to propose a methodology that achieves DR reduction targets while minimizing the electricity tariff burden. The proposed optimization model determines an optimal load-shifting plan by minimizing total electricity procurement cost subject to satisfying a demand-reduction target and respecting the flexibility range of electricity demand. To verify the practicality and effectiveness of the developed model, we conduct various scenario experiments using real industrial complex data and demonstrate the effectiveness of the proposed approach.
This paper is organized as follows. Section 2 reviews the theoretical background and prior studies on demand response and industrial electricity-use optimization. Section 3 defines an optimization problem that minimizes total electricity procurement cost through demand reduction and reallocation while considering time-varying electricity prices (SMPs) and electricity-demand flexibility ranges and proposes a mathematical optimization model. Section 4 conducts a range of experiments on demand reduction using real data and validates the effectiveness of the proposed model through the results. Finally, Section 5 discusses the study’s findings and directions for future research.
2. Literature Review
Demand Response Aggregators (DRAs) optimize profits and manage risks by aggregating distributed demand resources to participate in DR markets, while navigating uncertainties such as market prices, settlement rules, and customer participation. To this end, DRAs establish strategies considering the production schedules and energy costs of their managed facilities to achieve load reduction or load shifting in response to DR signals. The existing literature in this field is largely categorized into (1) the optimization of an aggregator’s portfolio and market participation and (2) on-site (factory/process) scheduling considering DR.
Regarding optimization from the aggregator’s perspective, Parvania et al. proposed an optimization model for a DR aggregator that enables small-scale DR resources of individual consumers to bid into wholesale electricity markets [7]. Heydarian-Forushani et al. suggested an optimal strategy for DRAs to maximize profits by participating simultaneously in both day-ahead energy markets and DR exchange markets [8]. Subsequently, Henríquez et al. introduced a decision-making framework to manage price uncertainty risks and optimize revenue across multiple electricity markets using portfolio management techniques [9]. More recently, Ovalle et al. proposed a management model to optimize energy consumption within technical constraints by considering the interaction between DRAs and individual dispatchable loads [10]. However, as these studies primarily focus on maximizing market revenue and minimizing settlement risks, they often overlook the practical feasibility—specifically when and to what extent reduction can be executed on the actual industrial floor.
In terms of production scheduling and DR, numerous studies have proposed industrial energy efficiency optimization strategies that adjust scheduling to minimize energy costs under time-varying pricing environments, such as time of use (TOU) tariffs [11,12,13,14]. Furthermore, research integrating DR concepts into manufacturing systems has provided practical frameworks by linking peak-time facility shutdowns and load shifting with scheduling logic [15], while systematic reviews have formalized the research framework for energy-efficient scheduling [16]. Duarte et al. proposed a scheme to minimize energy costs and maximize operational efficiency by linking highly volatile renewable energy with DR programs for multi-process production scheduling [17]. Recent studies have also systematically reviewed work scheduling under TOU tariffs for sustainable manufacturing and analyzed the interrelationship between energy cost reduction and production efficiency [18,19]. The research trend is further expanding toward sustainable scheduling that simultaneously minimizes carbon emission costs and energy expenses under implicit DR and carbon policies [20].
Nevertheless, a key limitation of these studies is their focus on individual factories or enterprises, making it difficult to scale the comparative evaluation to the industrial complex level. Moreover, while many studies concentrate on finding the “optimal scheduling solution” itself, they fail to provide a framework for designing load-shifting strategies based on the controllable range of hourly reduction (e.g., maximum reduction/shifting capacity, duration, rebound constraints, and continuity constraints), which is a critical input from a DR perspective.
In summary, the existing literature has separately addressed the optimization of aggregator uncertainty, risk, and market strategy, and the execution strategies for load reduction and shifting under industrial process constraints; thus, there is a lack of integrated evaluation of their combined effects. Therefore, this study distinguishes itself by first quantifying the hourly controllable reduction range—reflecting technical and operational constraints—and then deriving an optimal load-shifting strategy within that range. By applying this to industrial complexes with varying strategic industry characteristics and comparing the resulting effects (peak reduction, cost savings, DR feasibility, etc.), this research provides tailored load-shifting guidelines for industrial complexes that can be utilized by both policymakers and the industry.
3. Problem Definition
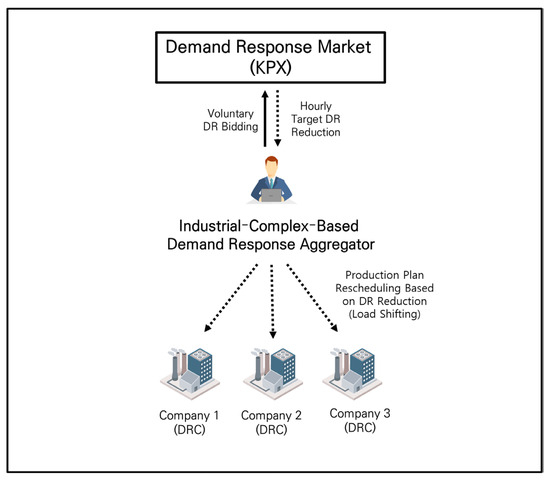
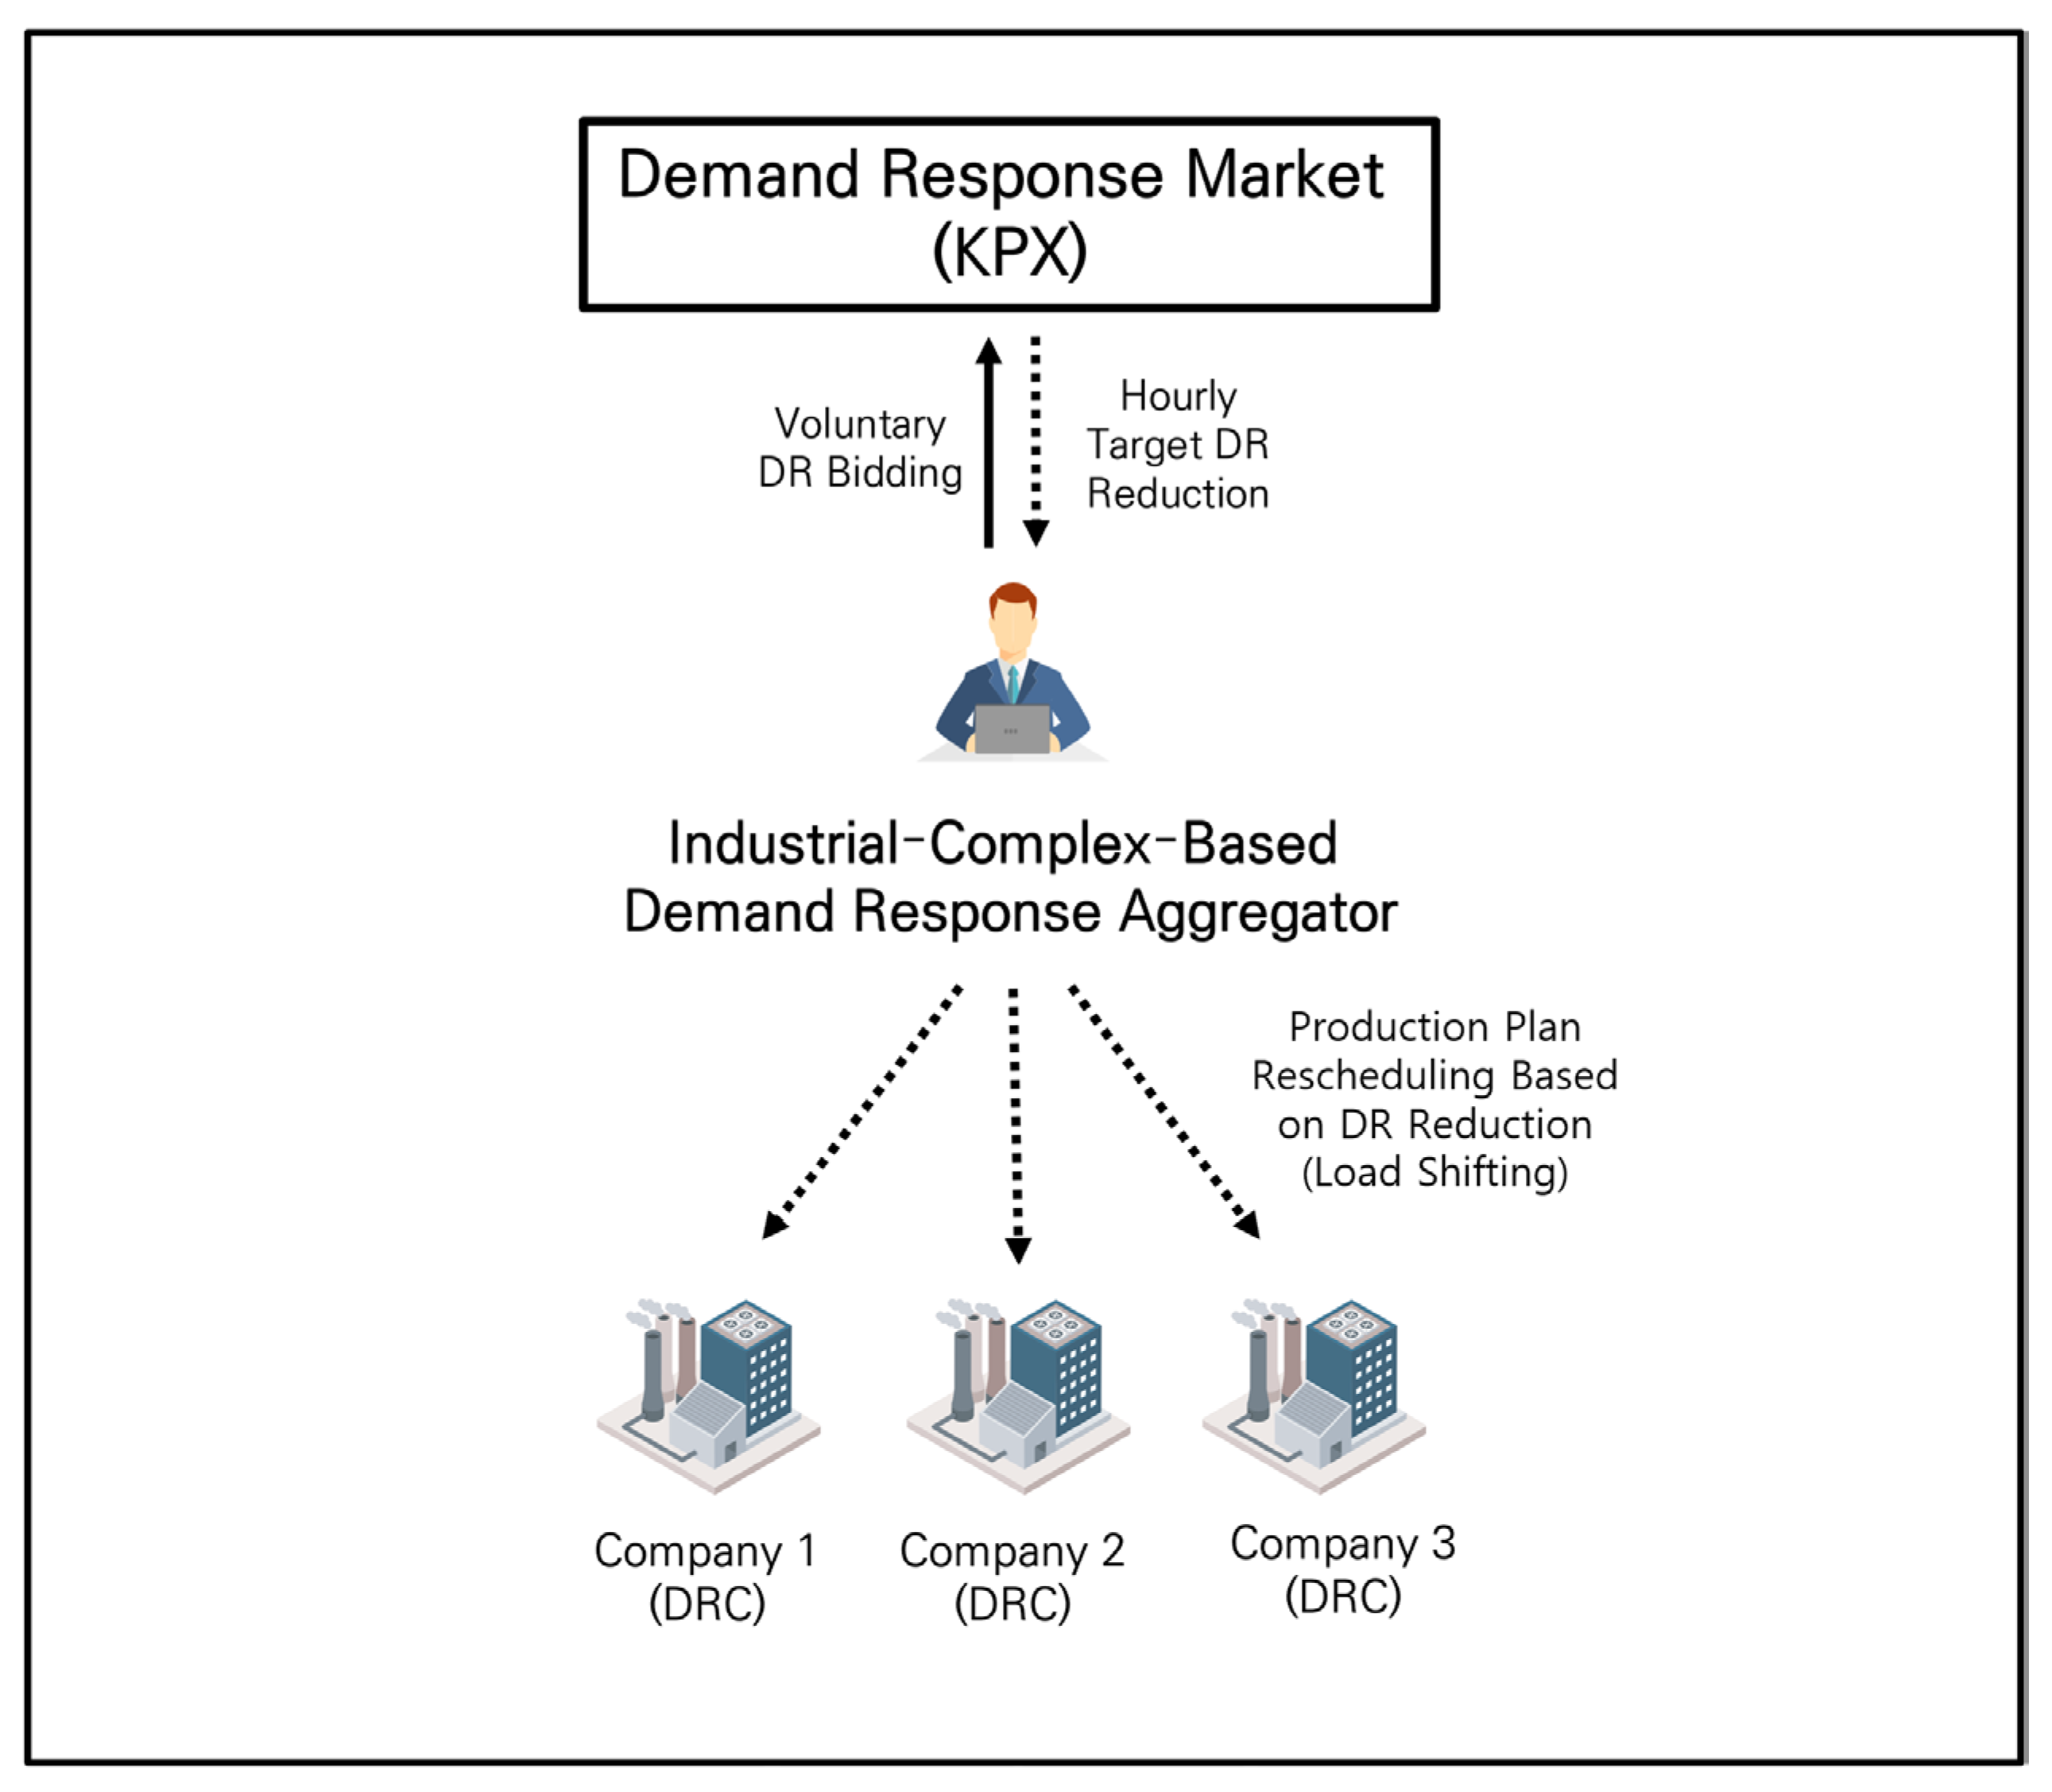
To achieve a total electricity-demand reduction target allocated to a specific industrial complex, we consider an optimization problem that determines the time-of-day redistribution of electricity demand so as to minimize the aggregate electricity procurement cost of all firms within the complex, while accounting for time-varying electricity prices (SMP). As illustrated in Figure 1, a Demand Response Aggregator (DRA) aggregates load resources from Demand Response Customers (DRCs) within the industrial complex to form a single DR resource and participates in a voluntary DR market. In the DR market, a reduction target is allocated based on the DRA’s bid outcome, and the DRA distributes the assigned reduction target across participating DRCs and requests them to execute the corresponding demand curtailment. (In theory, it is possible to construct an optimization model that determines both the bidding days and bid quantities by incorporating (i) firm-level electricity demand forecasts, (ii) historical clearing probabilities in the voluntary DR market, and (iii) differentiated baseline settlement rates. However, in Korea’s electricity demand reduction market, settlement payments and clearing rates are generally higher in the summer and winter seasons, and their day-to-day volatility is relatively limited. Moreover, bid quantities can be determined fairly effectively using historical clearing rates and available bid capacity alone, implying that the expected incremental benefit of an additional optimization layer is limited. Accordingly, rather than addressing that problem, this study focuses on a load shifting optimization problem that satisfies a given curtailment target while minimizing productivity loss.)
Figure 1.
Conceptual diagram illustrating the role of a Demand Response Aggregator (DRA) as an intermediary between the DR market and Demand Response Customers (DRCs). For hours in which a DR request is issued, the DRA considers the time-varying electricity price (SMP) and adjusts DRC production plans to shift electricity-intensive operations away from those hours and reallocate them to periods with relatively lower electricity cost (load shifting).
Each DRC implements the requested curtailment through actions such as partial equipment shutdowns and process schedule adjustments. During this process, a portion of electricity usage is shifted from one time period to another, resulting in load shifting. Although load shifting entails temporal reallocation of production activities, this study interprets it as a means of reducing electricity tariffs by decreasing electricity usage during high-SMP hours and moving that usage to low-SMP hours. Therefore, if the DRA allocates the reduction amounts rationally by considering hourly SMP and DRC-specific demand characteristics, the industrial complex can effectively meet the given reduction target while minimizing total electricity costs.
3.1. SMP, Electricity Demand, and Load Flexibility Range
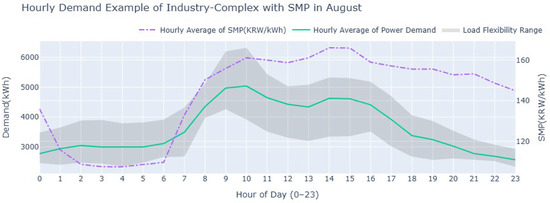
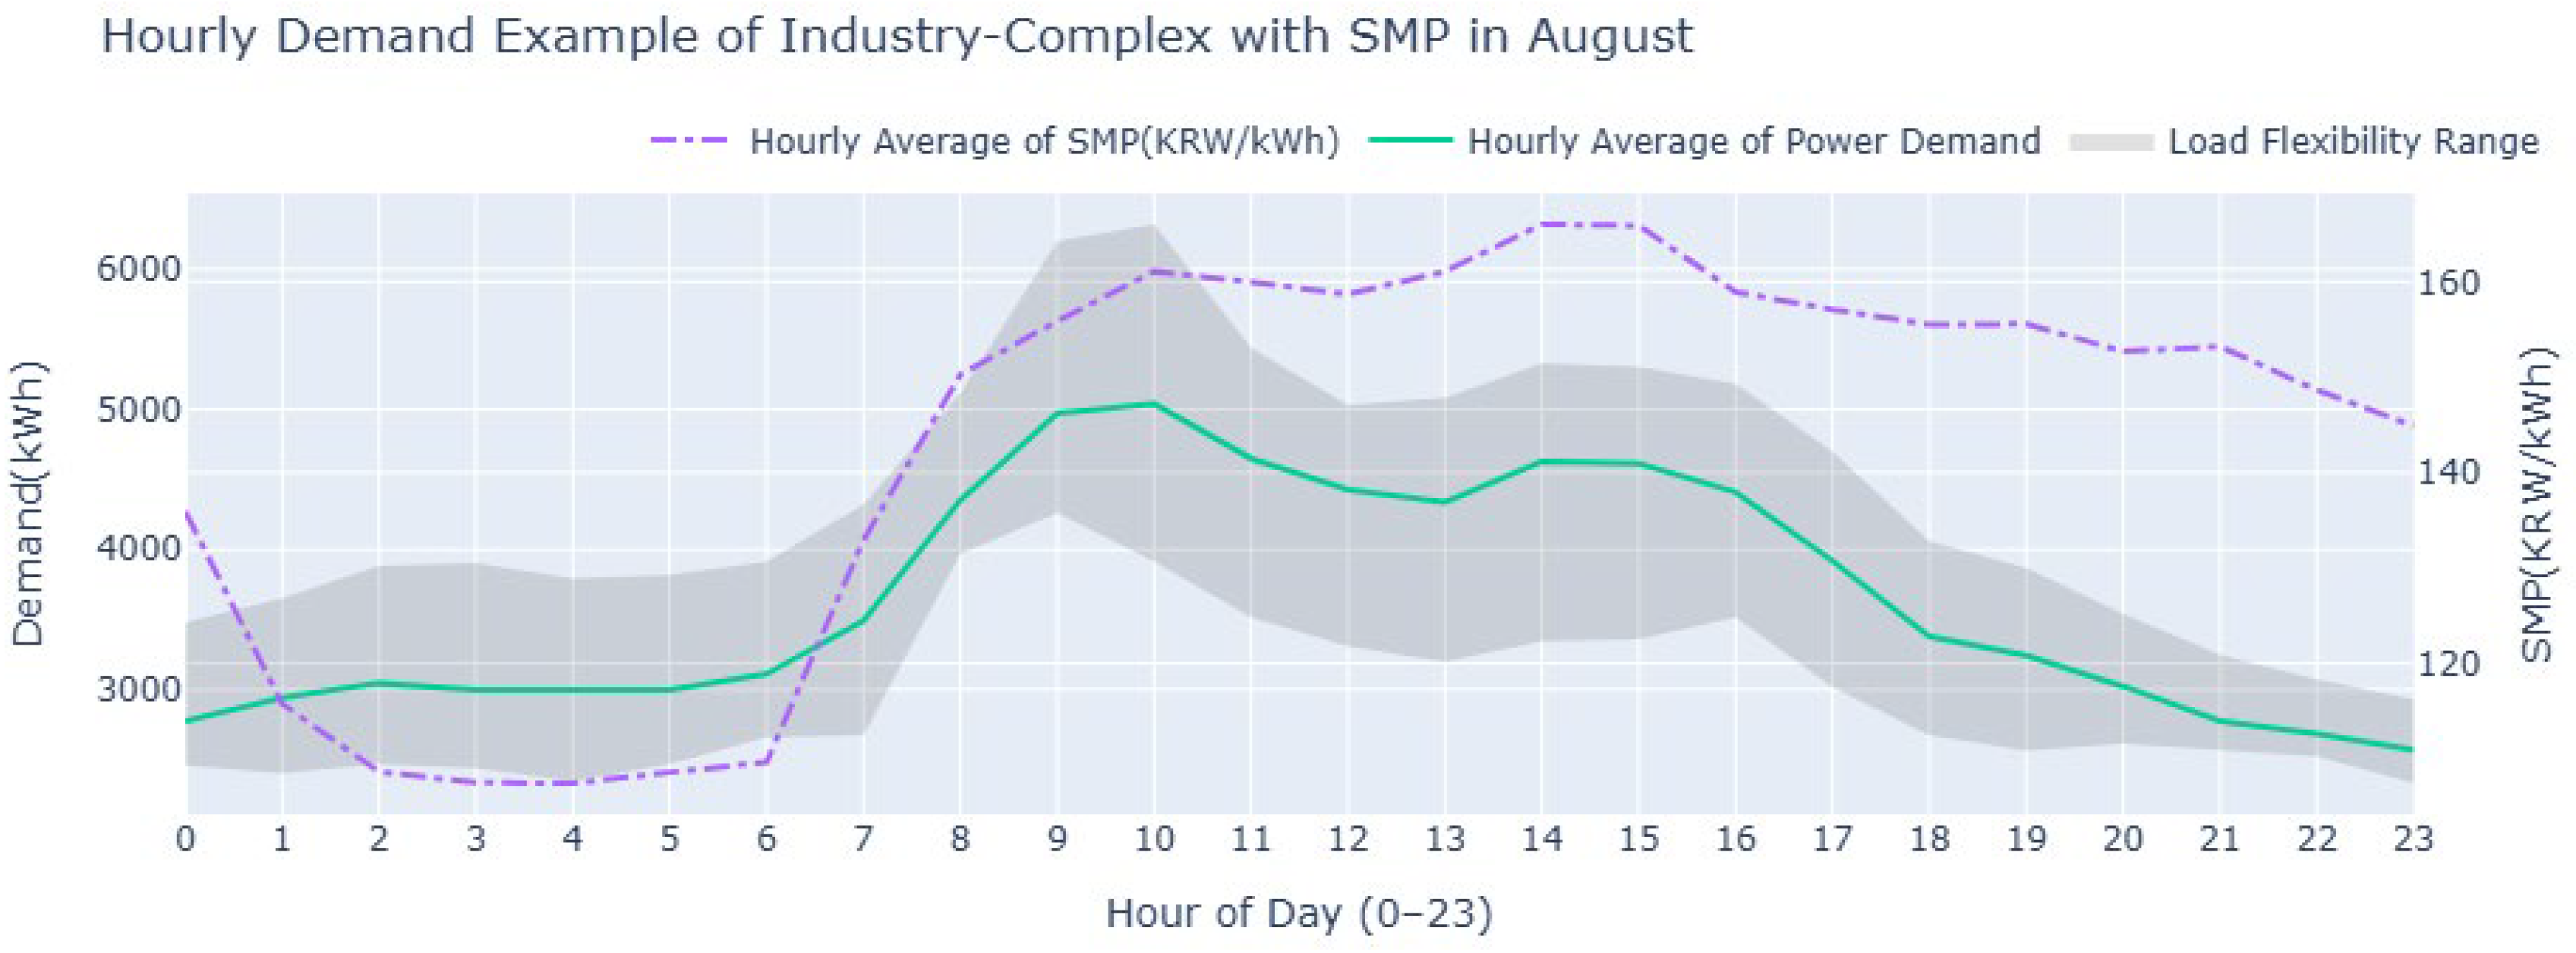
In the proposed optimization model, the key constants appearing in the objective function consist of hourly electricity prices (SMPs), average electricity demand, and the load flexibility range. Figure 2 presents the hourly average electricity demand and SMP distribution for a specific industrial complex in August, along with the corresponding load flexibility range. First, as shown in the figure, SMP tends to be relatively high during morning and afternoon peak hours when electricity demand is concentrated (e.g., 09:00–11:00 and 13:00–16:00), while remaining low during late-night and nighttime hours. This time-of-day variability implies that, even for the same amount of electricity usage, the procurement cost borne by the industrial complex can differ substantially depending on the time of use. Second, the hourly average demand represents a typical level of electricity usage observed under normal operation and is used as the reference demand before load shifting. Finally, the load flexibility range for each hour is computed based on the distribution of historical demand data. In this study, it is defined using the third quartile (Q3) and first quartile (Q1) of monthly hourly demand. Specifically, the interval from the mean demand up to Q3 indicates the maximum feasible increase in demand (i.e., upward flexibility) at that hour without additional costs beyond electricity charges, whereas the interval from the mean demand down to Q1 indicates the maximum feasible reduction in demand (i.e., downward flexibility) at that hour.
Figure 2.
The hourly average electricity demand and SMP distribution for a specific industrial complex.
Hourly flexibility ranges derived from historical demand distributions provide a basic approach for assessing industrial DR potential. An ORNL study estimated hourly DR availability by industry sector and presented differentiated analyses reflecting equipment-use characteristics and grid requirements, distinguishing between realizable estimates (Scenario 1) and technical potential (Scenario 2) [21]. Referring to this line of work, this study defines a realistic curtailment range using Q3 and Q1 of monthly hourly demand. Concretely, the mean-to-Q3 range represents the maximum feasible demand increase during DR events, capturing the flexibility with which industrial customers may raise load when needed [22]. Conversely, the mean-to-Q1 range represents the maximum feasible curtailment, estimated by analyzing demand patterns on non-event days to approximate what can be achieved in practice [23]. In Korea’s industrial DR market as well, a Customer Baseline Load (CBL) is computed based on historical average usage and is used to evaluate performance of participating plants [24]. This quartile-based approach has the advantage of reflecting both operational constraints and flexibility by leveraging the statistical distribution of historical data. While this study adopts a simple quartile-based method for estimating feasible ranges, more sophisticated baseline and curtailment estimation methods—such as regression-based techniques, machine learning approaches, and probabilistic estimation—can be incorporated as needed [25].
By jointly considering these constants, the proposed model encourages a load shifting strategy that reduces demand within the flexibility range during high-SMP hours and reallocates the reduced energy to hours with relatively low SMP. In other words, the objective is designed to minimize expensive electricity consumption in high-SMP hours and shift usage toward low-SMP hours, thereby minimizing total procurement cost for the industrial complex. In this process, the flexibility range prevents excessive reductions or unrealistic increases, enabling a rational redistribution of demand that reflects practical operating conditions.
3.2. Objective Function and Decision Variables
The linear programming (LP) problem considered in this study aims to minimize the total electricity procurement cost of the industrial complex through demand reduction and time-of-day redistribution enabled by load shifting. The objective function computes, for each DRC, the sum over 24 h of hourly electricity usage multiplied by hourly SMP and then aggregates this cost across all DRCs to obtain the total procurement cost of the single aggregated DR resource. In this study, the forecasting and settlement horizon is limited to 24 h based on the assumption that daily production tasks are completed each day in order to minimize the impact on production scheduling. Under the condition that production is not affected, this framework can be extended to longer time horizons. The DR revenue earned by achieving the assigned reduction target is excluded from the objective because the revenue is constant if the target is met. (This framework can be extended to incorporate penalties for under-delivery relative to the target.)
The assigned DR reduction target is achieved by allocating reduction amounts across DRCs, and the curtailed load is shifted to other hours, increasing demand there. Accordingly, the objective is structured such that each DRC is incentivized to take more curtailment in hours with higher SMP and to shift load toward hours with lower SMP.
The n is an index for an individual industrial complex DRC, while denotes the set of those DRCs aggregated to form a single DR resource by the DRA. We define the decision variables as the amount of load shifted via hourly reductions and increases, denoted by and . To translate these quantities into costs, the model multiplies them by hourly SMP coefficients and , forming reduction and increase terms in the objective. This enables quantitative evaluation of the cost impact of load shifting. The objective function and decision variables are as follows:
3.3. Constraints
The first constraint requires that the sum of the curtailed electricity loads across all individual industrial complex DRC satisfy the assigned demand reduction target. Let denote the set of DR curtailment hours. For each DR curtailment hour, the sum of curtailed loads across all load resources must be equal to the reduction target assigned to that hour. The constraint is shown in (2).
The second constraint requires that, for each individual load resource n, the total increased load and the total curtailed load over the 24 h period be equal. This constraint ensures that electricity consumption shifted by DR is merely reallocated across time periods, thereby preserving the total electricity usage (or workload), and is shown in (3).
Finally, to reflect realistic operating conditions of industrial complexes, constraints are imposed to prevent extreme demand curtailment or excessive load increases. Baek et al. defined the upper and lower bounds of demand increase and reduction by utilizing the 95% confidence interval centered on the mean of historical demand data [26]. However, when applied to practical demand response (DR) operation, this range may be excessively wide, potentially limiting its applicability in real-world settings.
To address this limitation, this study adopts a more conservative and practically feasible definition of load flexibility. Instead of employing the full 95% confidence interval, the interquartile range of the historical electricity demand distribution is utilized. Specifically, the range from the mean demand to the third quartile (Q3) is defined as the maximum allowable demand increase (Equation (4)), while the range from the mean demand to the first quartile (Q1) is defined as the maximum allowable demand reduction (Equation (5)). To this end, the mean , first quartile , and third quartile of the hourly electricity demand data for each load resource are utilized to define a reasonable load-shifting range that reflects actual process operations and equipment flexibility.
3.4. Optimization Model
The objective function and constraints of the SMP-based load shifting optimization model proposed in this study are formulated mathematically as follows (Equation (6)). The objective function is formulated to minimize the total electricity procurement cost of the industrial complex by applying SMP coefficients to the hourly increased and curtailed load amounts. The constraints include the requirement to satisfy the hourly DR reduction targets during designated curtailment periods, the load conservation condition for each load resource, and flexibility constraints on load increases and reductions derived from the first and third quartiles of historical electricity demand data.
4. Experimental Results
4.1. Experimental Settings
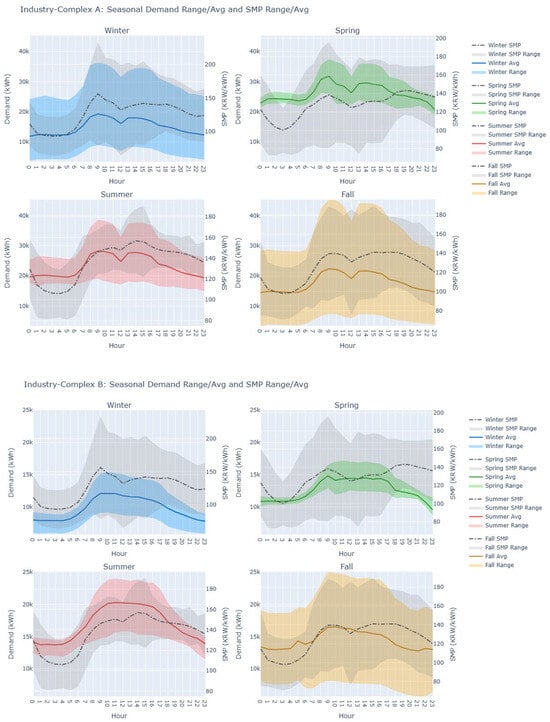
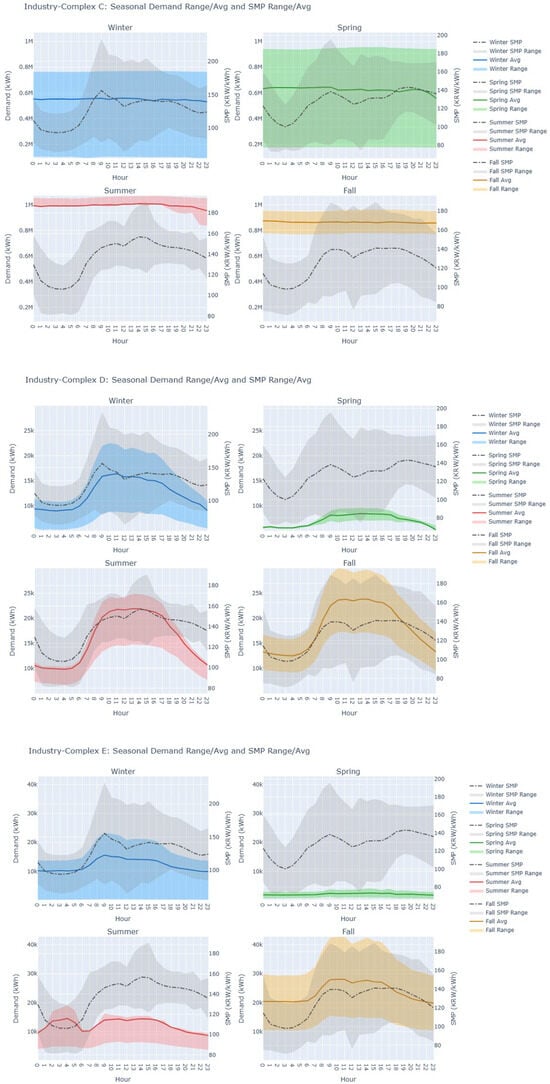
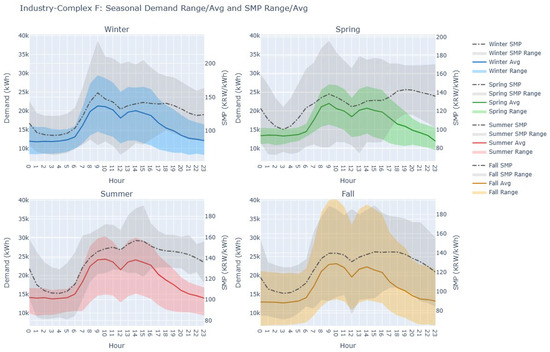
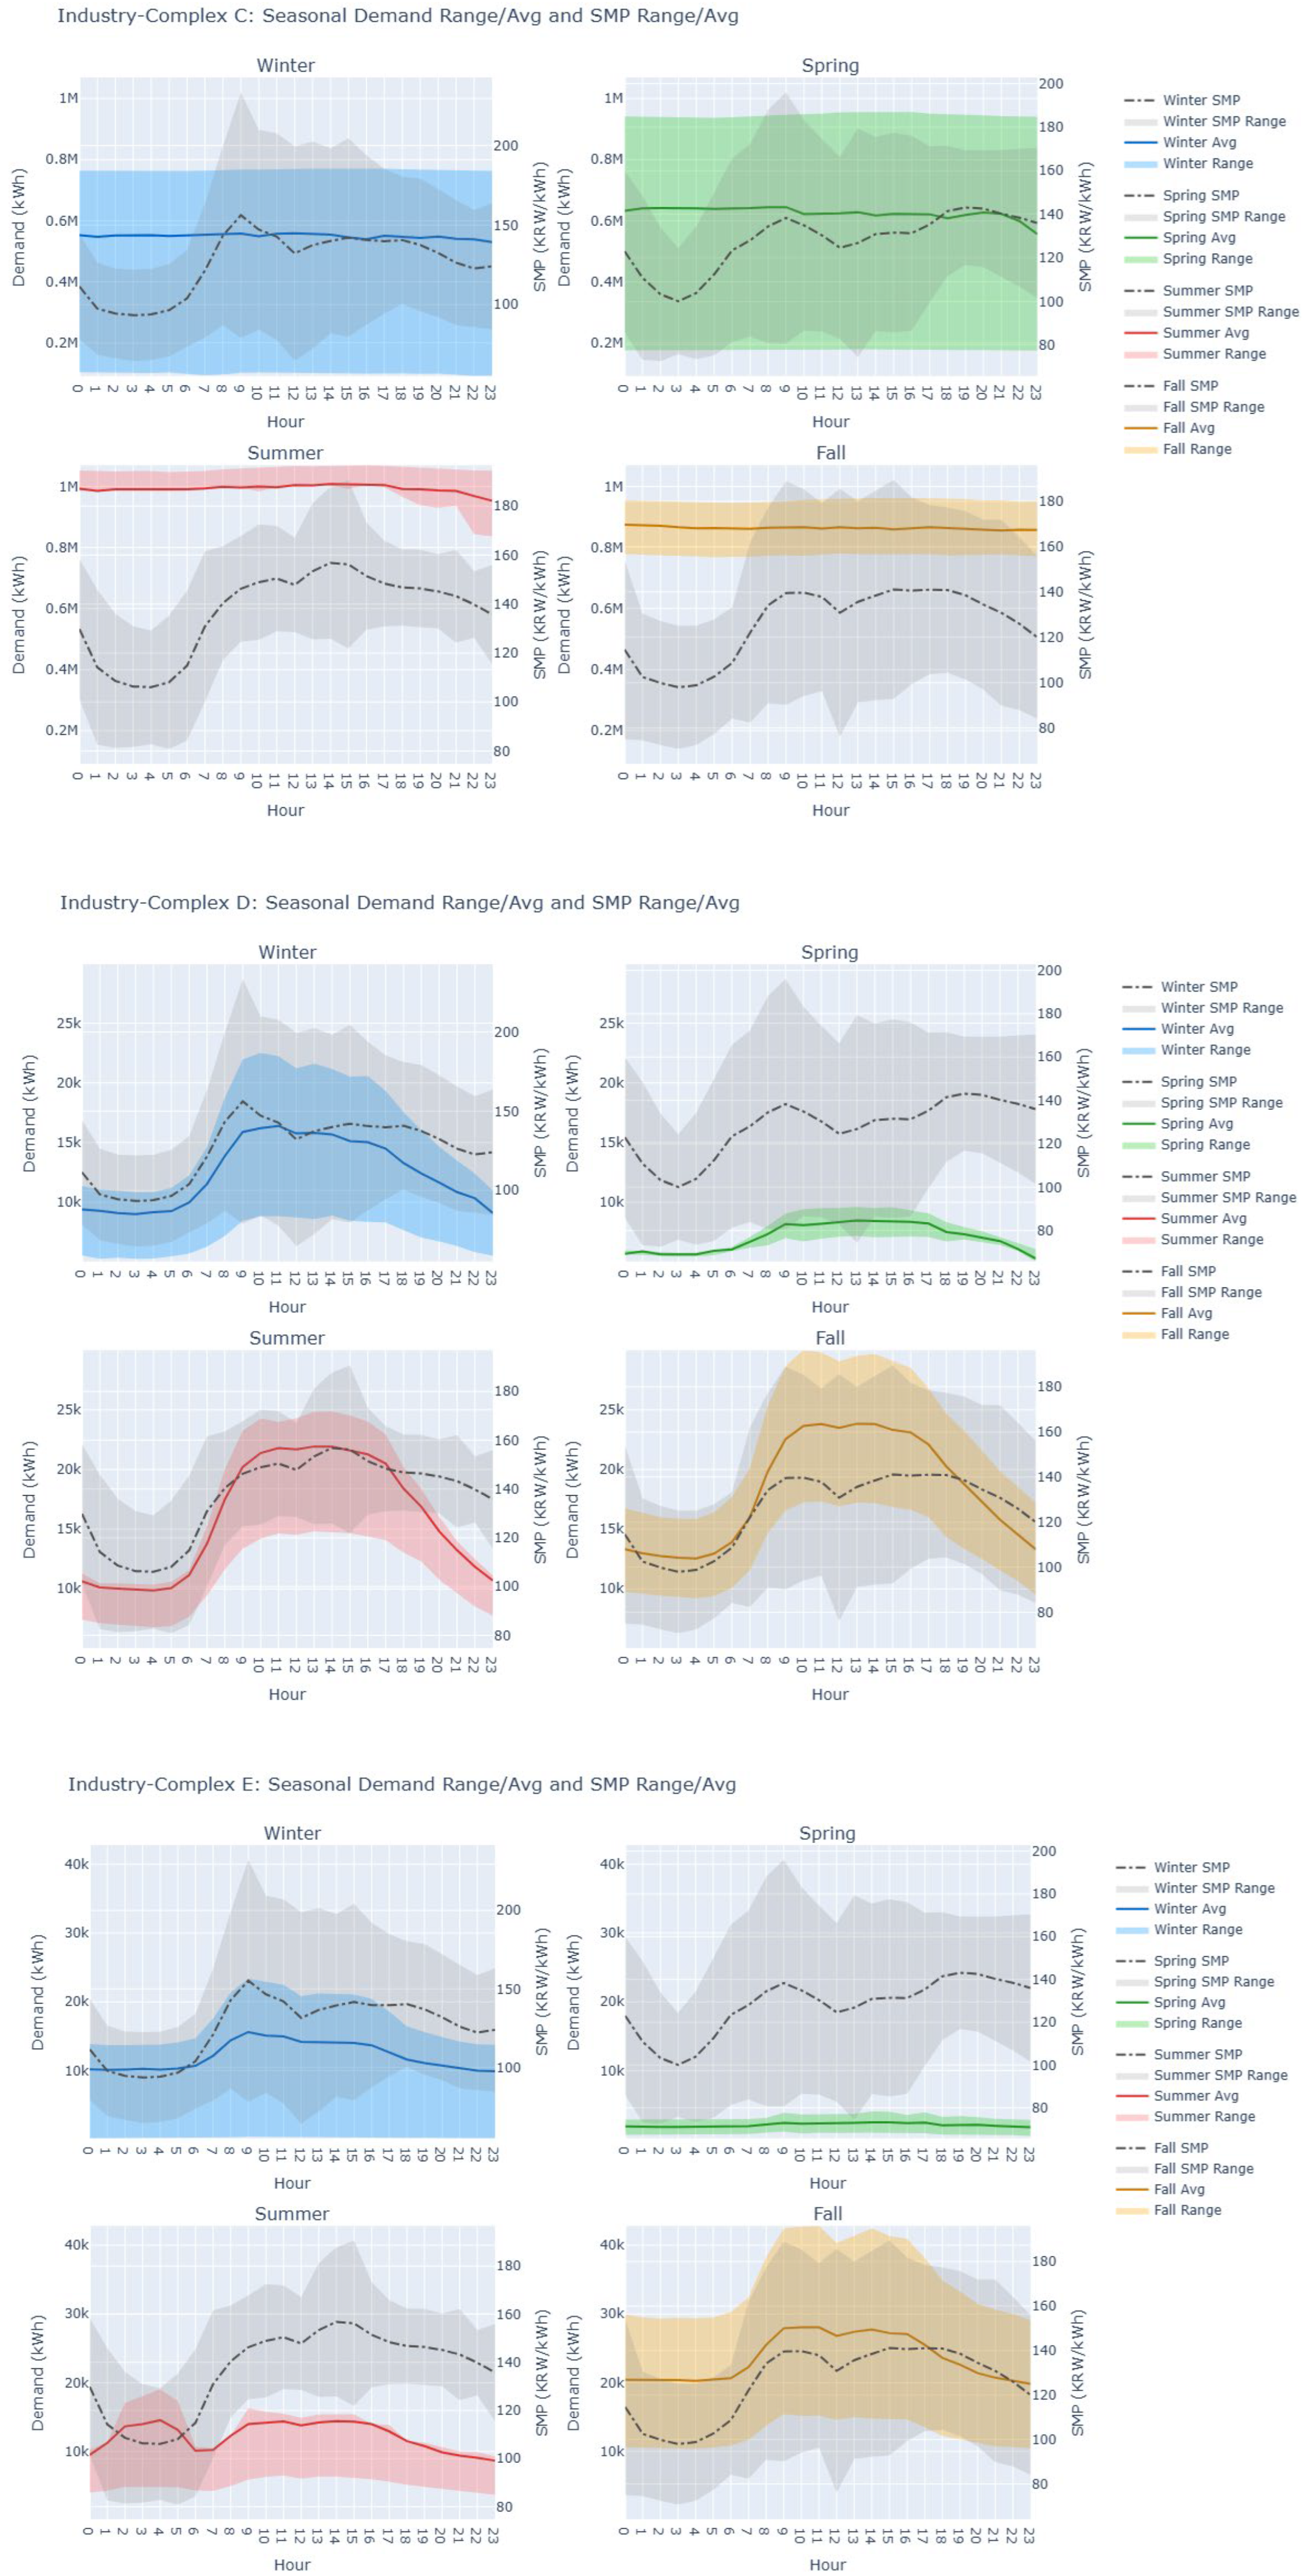
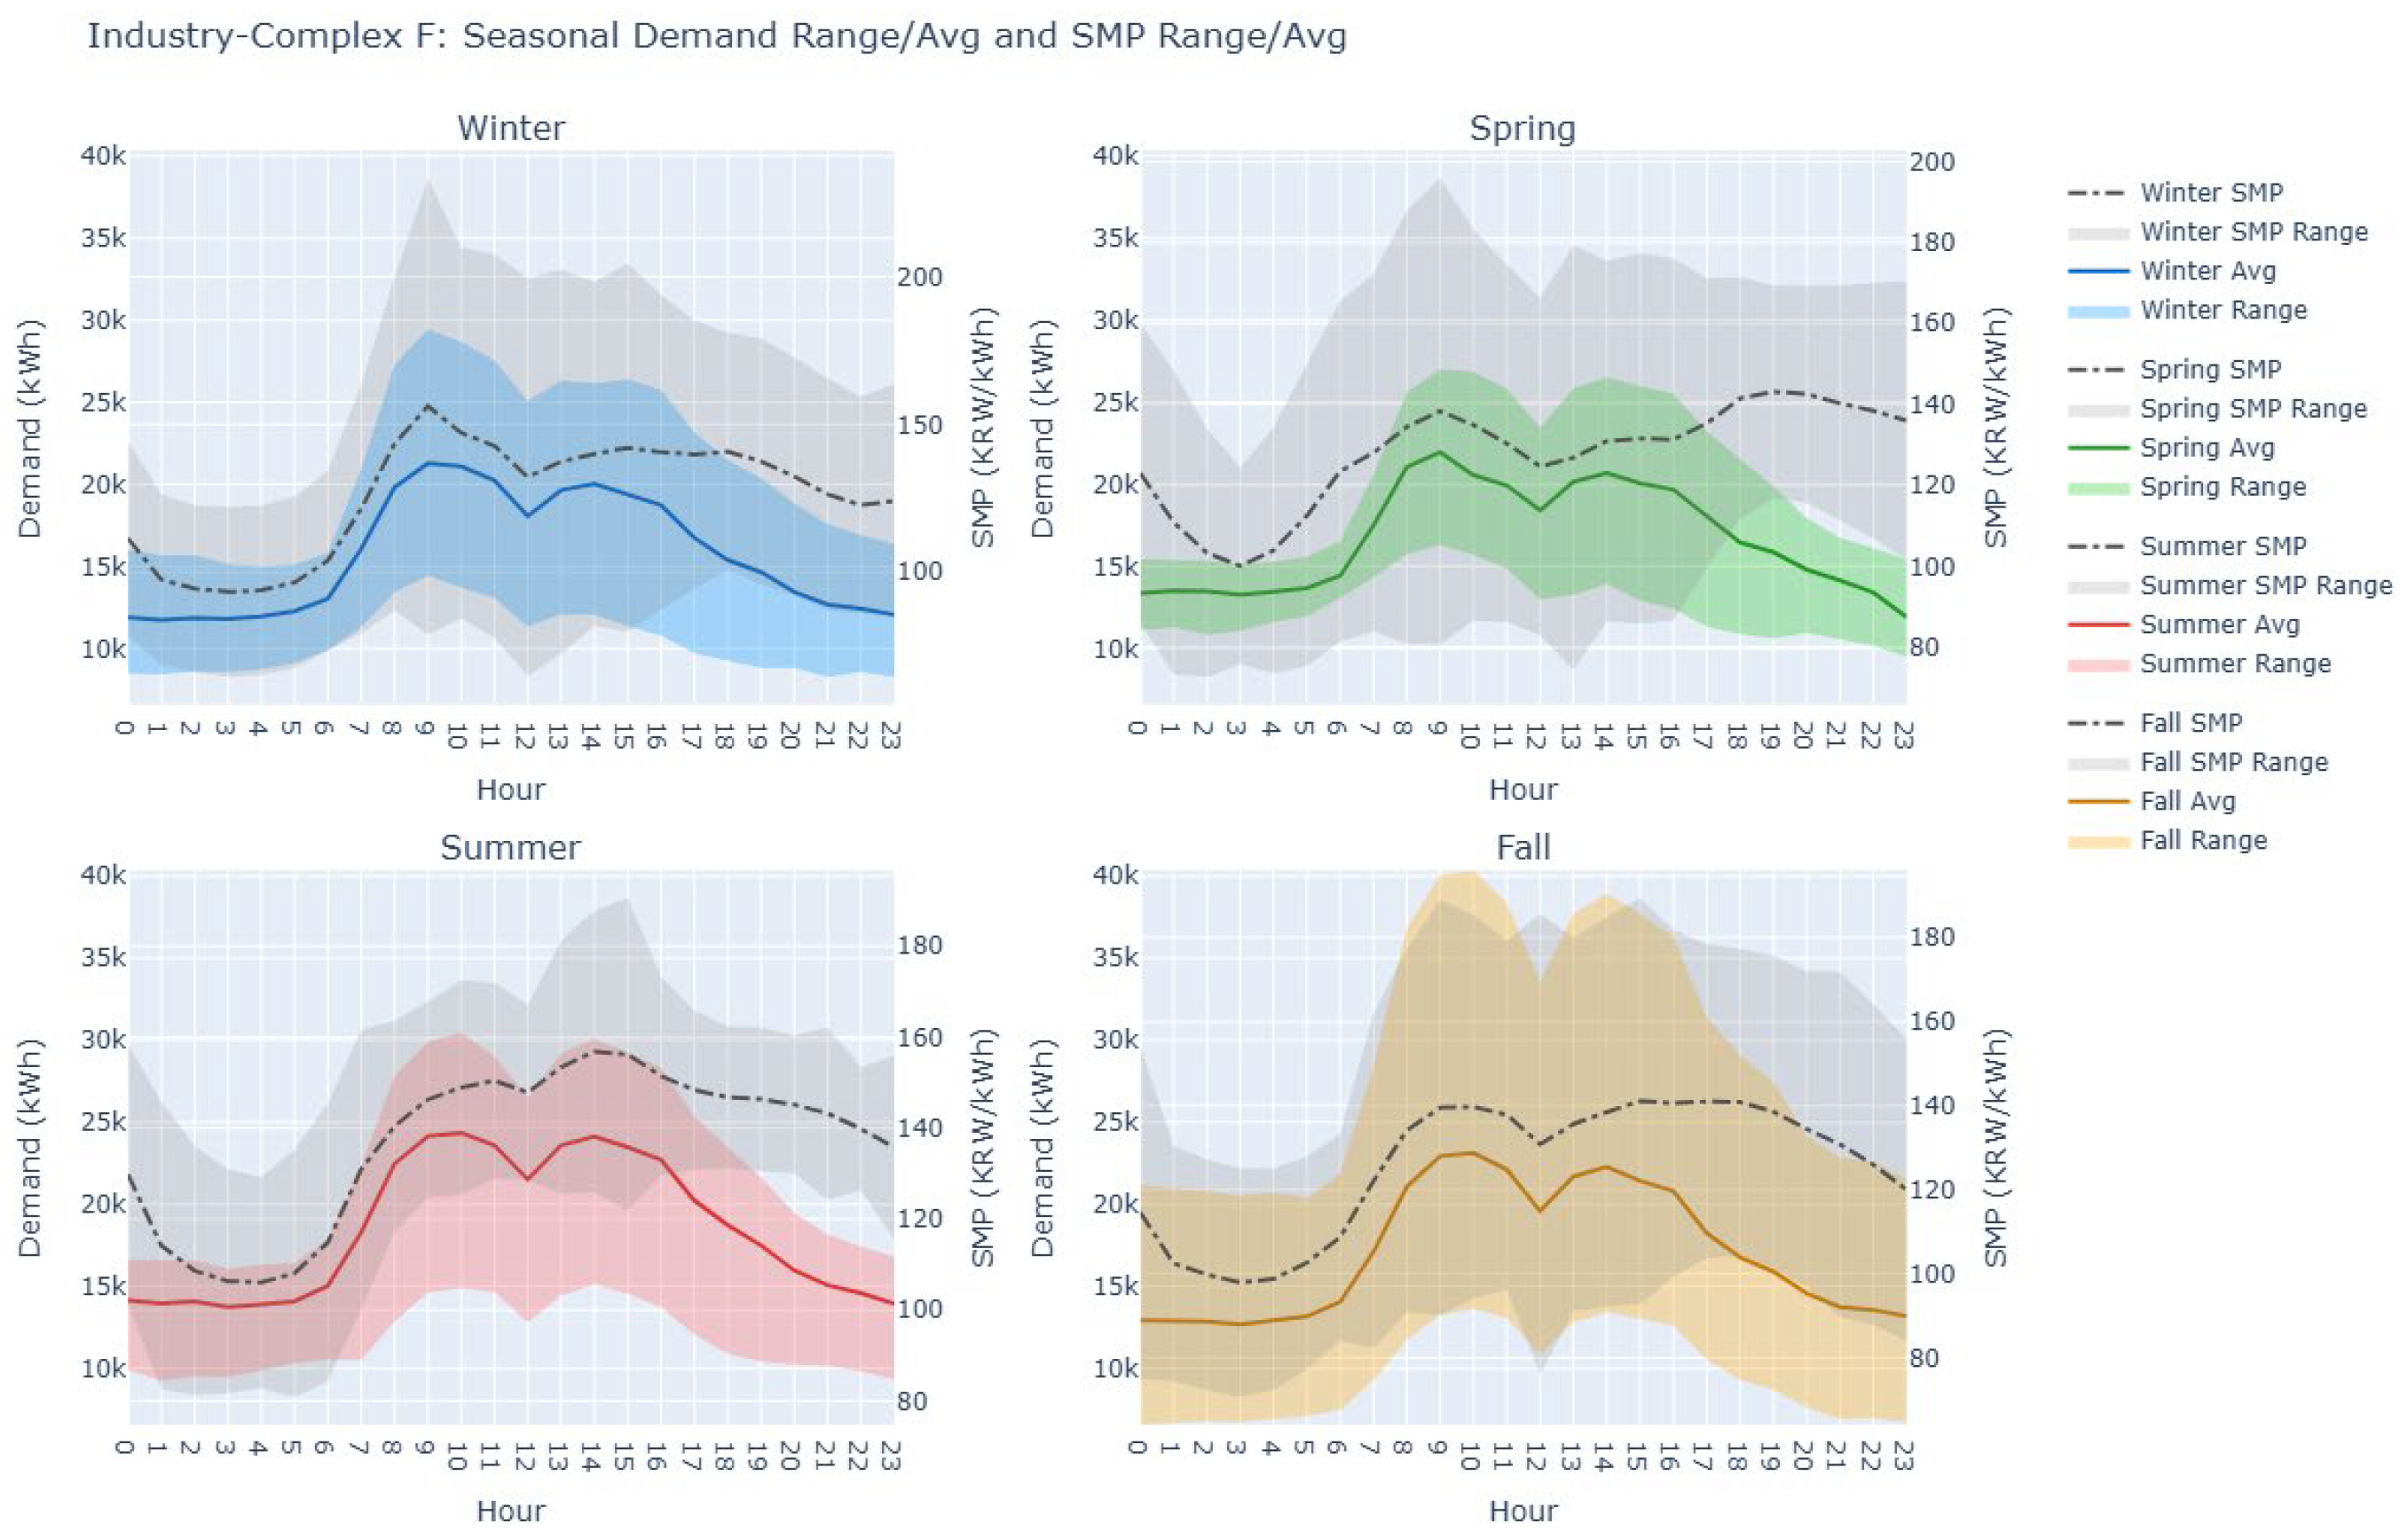
To formulate the optimization problem using real electricity demand data, we use hourly metered electricity consumption data for industrial complexes in Hwaseong City, Gyeonggi Province, Republic of Korea, covering the period from August, 2023 to December, 2024. Electricity consumption data by industrial complex were obtained from the Korea Electric Power Corporation (KEPCO) Big Data Platform, which provides industrial-complex electricity-use statistics [27]. Among the industrial complexes in Hwaseong City, six complexes with consistently reliable hourly electricity demand data were selected as candidate load resources. These industrial complexes were selected because their major constituent industries—such as electronics, data centers, semiconductor fabs, equipment manufacturing, and display production—correspond to sectors with high and rapidly growing electricity demand, as discussed in the Introduction. For each load resource, we estimated the hourly average electricity demand and the load flexibility range by Equations (4) and (5). Figure 3 illustrates the seasonal hourly average electricity demand profiles of the six industrial-complex resources used in the experiments.
Figure 3.
Seasonal hourly average electricity demand, load flexibility range, average SMP, and SMP fluctuation profiles of the six industrial-complex load resources.
Hourly electricity costs for the same period are computed using time-varying system marginal price (SMP) data. Hourly SMP data were collected through the SMP OpenAPI provided by the Public Data Portal [28]. To account for uncertainty in the SMP during DR curtailment and to complement the sensitivity analysis, the fluctuation range of SMP is incorporated by assuming that SMP follows a normal distribution and estimating its 95% confidence interval based on historical SMP data.
The width of this confidence interval is used as a criterion for selecting DR curtailment hours. Specifically, hours with a relatively high seasonal average SMP and low SMP fluctuation are prioritized as DR curtailment periods [29].
Based on this criterion, scenario analyses are conducted for summer periods characterized by low SMP fluctuation, as well as for winter periods exhibiting higher fluctuation. Through these experiments, the robustness and effectiveness of the proposed approach are validated under diverse SMP fluctuation conditions. Examples of DR curtailment hour selection and the corresponding SMP characteristics are summarized in Table 1.
Table 1.
Seasonal DR curtailment hour selection and the corresponding SMP characteristics by SMP average and fluctuation.
Table 2 summarizes the major industries and site area of each industrial complex resource, along with their seasonal electricity demand patterns as illustrated in Figure 3. Table 3 presents the seasonal average load shifting flexibility ranges and the average electricity demand (kWh) for each industrial complex resource, derived from Figure 3.
Table 2.
Summary of major industries, area size, and demand pattern characteristics of industrial-complex resources.
Table 3.
Summary of seasonal electricity demand scale, load increase and reduction flexibility for each industrial complex used in the experiments.
Load resources can be characterized based on their hourly average electricity demand and their load flexibility ranges (i.e., feasible amounts of increase and reduction). As the average electricity demand increases, the amount of curtailment that can be allocated during DR curtailment hours becomes larger, and at the same time, the amount of electricity that can be reallocated to other hours through load shifting also increases. In contrast, resources with limited load flexibility face difficulties in adjusting electricity usage due to process characteristics; therefore, rather than performing DR curtailment independently, it is necessary to enhance DR participation efficiency through the formation of clustered DR resources composed of multiple load resources.
The experimental scenarios conducted in this study test whether DR operation can be effectively implemented through a load shifting LP optimization problem designed by clustering DR resources that have difficulty participating in voluntary DR individually on a seasonal basis. Load resources with low electricity flexibility incur significant productivity losses when participating in DR individually. In Scenario 1, we test whether clustering only resources with low electricity flexibility (B, D, and E) during the spring season into a single clustered DR resource can alleviate the individual burden of corresponding demand curtailment on each DR resource.
In Scenario 2, we conduct experiments to examine whether effective DR can be achieved through load shifting by clustering only resources with low load-increase flexibility (i.e., limited ability to increase electricity demand) (D, E, and F) during the summer season. In Scenario 3, we examine the outcomes that arise when combining Resource B, which has low demand flexibility, with Resources A and D, which have high demand flexibility, during the winter season. Finally, in Scenario 4, since all resources exhibit high demand flexibility during the fall season, load-shifting LP optimization is performed for each resource individually, and the results are compared with those of clustered DR resource operation as a control group. Table 4 summarizes the described scenarios in tabular form.
Table 4.
Characteristics of DR resource composition scenarios.
For reference, Resource C represents an industrial complex whose major industry is semiconductor fabrication. Compared to other complexes, this resource is characterized by an extremely large electricity demand scale and a simple demand pattern, which makes it difficult to form a cluster with other resources. Accordingly, Resource C is excluded from the construction of clustered DR resources in the experimental process.
4.2. Experiments and Analysis
4.2.1. Clustering of Resources with Low Demand Flexibility in Spring
Scenario 1 is designed to alleviate the individual burden of corresponding demand curtailment on each DR resource by clustering only resources with low electricity flexibility (B, D, and E) during the spring season. As shown in Figure 4, during spring, SMP tends to be high during the evening hours while exhibiting relatively low fluctuation; therefore, demand curtailment is implemented during these periods. The curtailed load is then reallocated to early-morning hours with lower SMP, thereby completing the load shifting process. Among the clustered resources, Resource E, which exhibits the highest demand flexibility, accounts for the largest share of load shifting. Due to the relatively small demand scale, this scenario exhibits the smallest electricity cost reduction among the four scenarios.
Figure 4.
Load-shifting LP optimization result of Scenario 1.
4.2.2. Clustering of Resources with Limited Load-Increase Flexibility in Summer
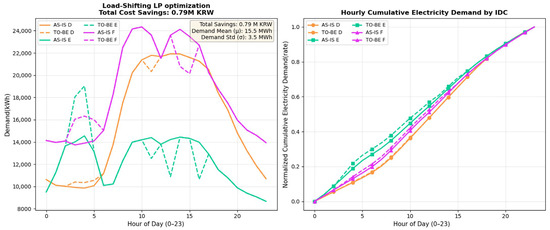
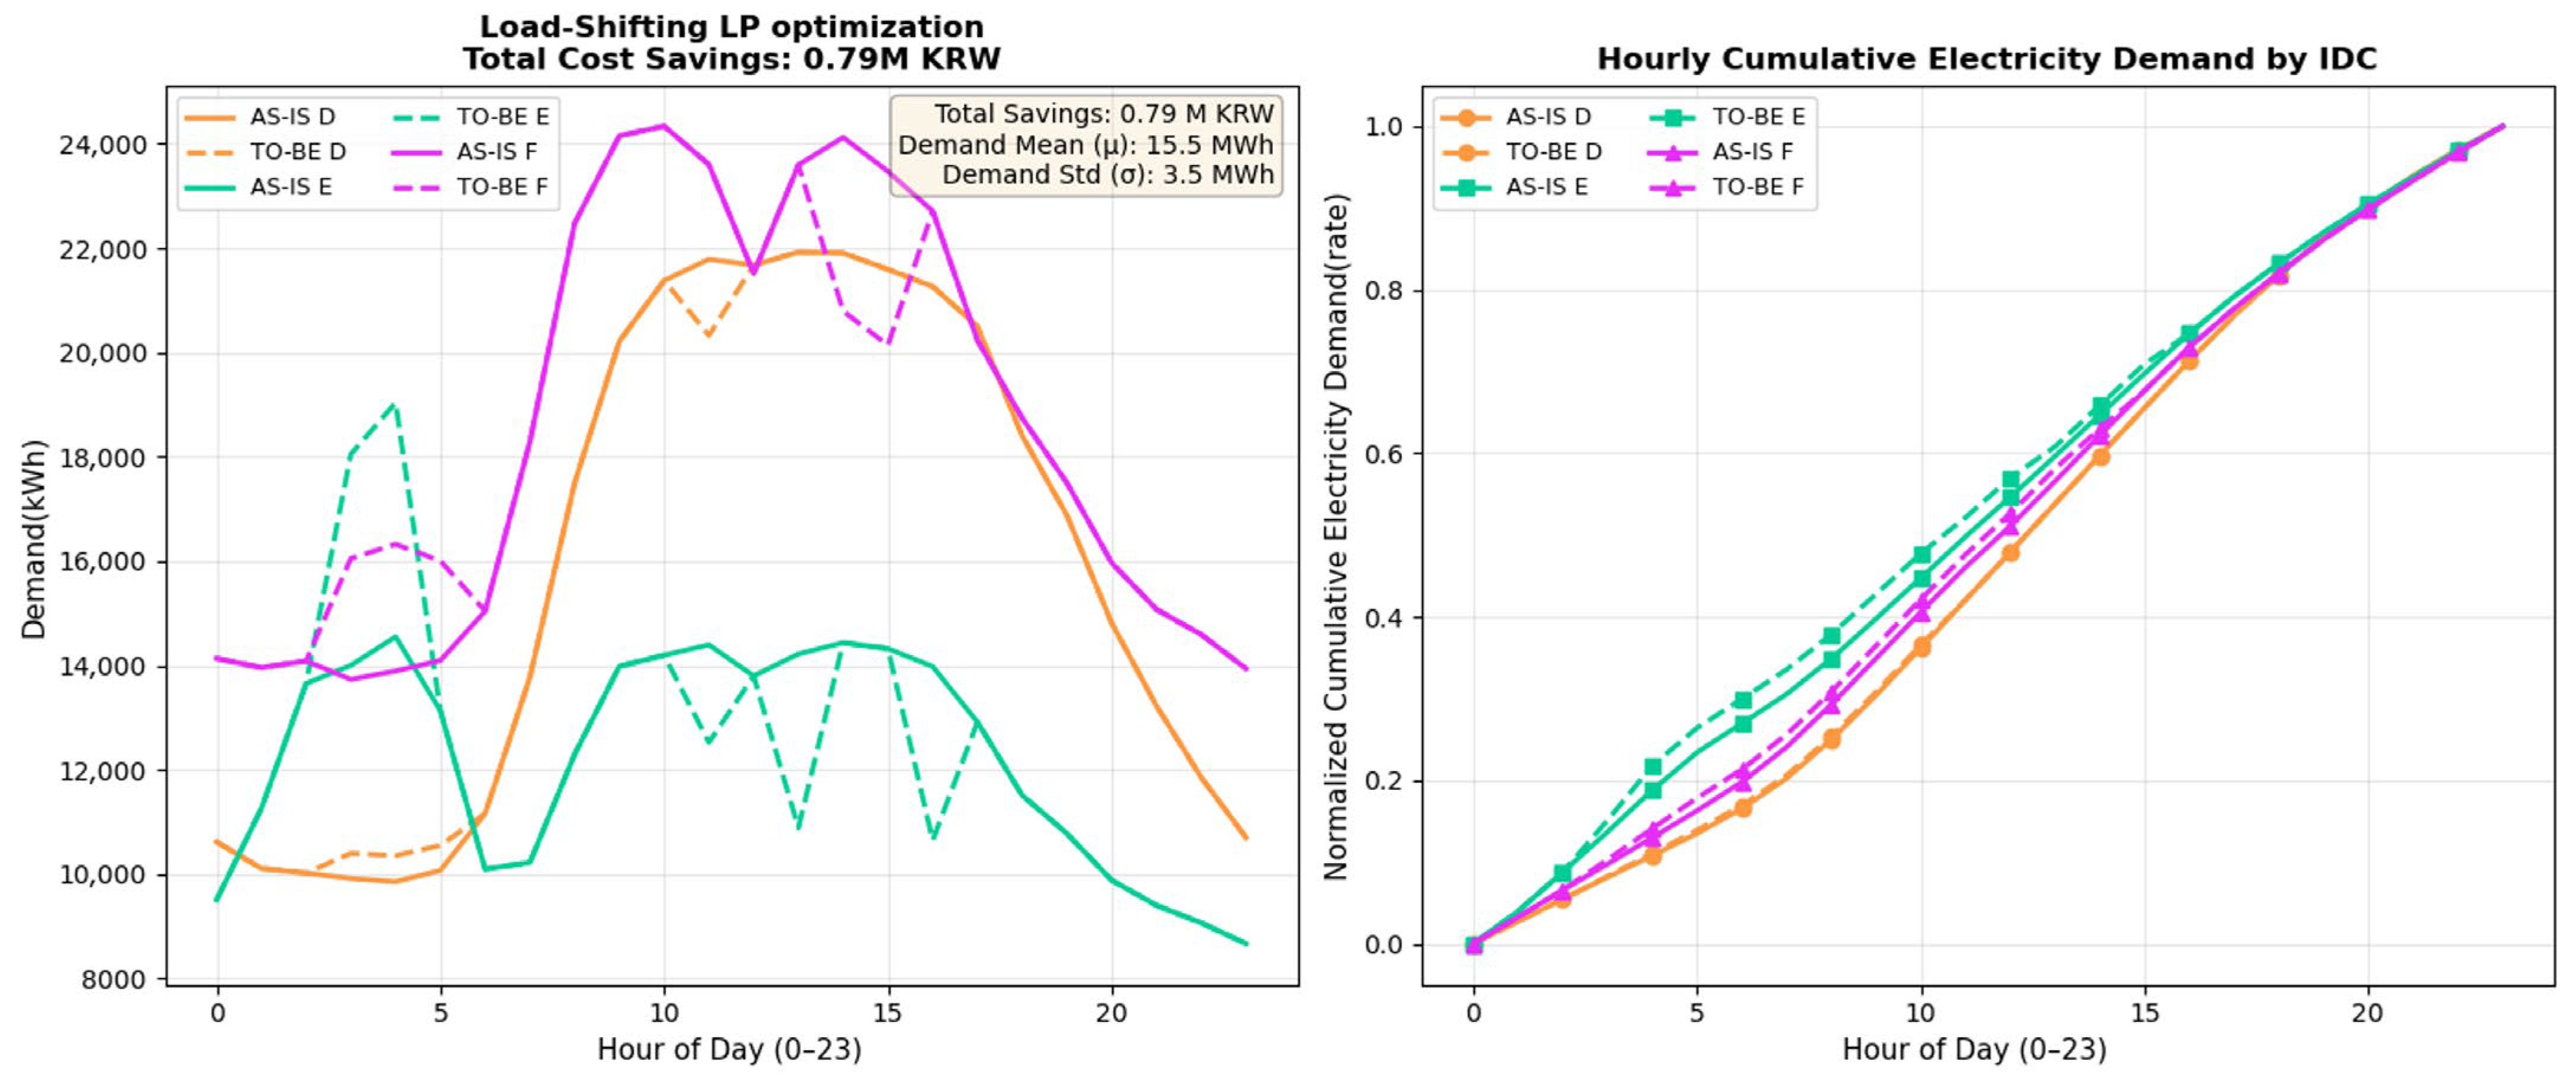
Scenario 2 examines whether effective demand response can be achieved through load shifting by clustering only resources with limited load-increase flexibility (D, E, and F) during the summer season. As shown in Figure 5, during summer, sustained cooling demand leads to high SMP during daytime hours, while SMP fluctuation remains relatively moderate; therefore, demand curtailment is implemented during these periods.
Figure 5.
Load-shifting LP optimization result of Scenario 2.
By contrast, during early-morning hours when SMP is low, Resource D exhibits almost no load-increase flexibility, Resource E shows the highest flexibility, and Resource F displays a moderate level of flexibility. Accordingly, most of the load increase occurs in Resource E, while only limited increases are observed in Resources D and F.
4.2.3. Combination of Low- and High-Flexibility Resources in Winter
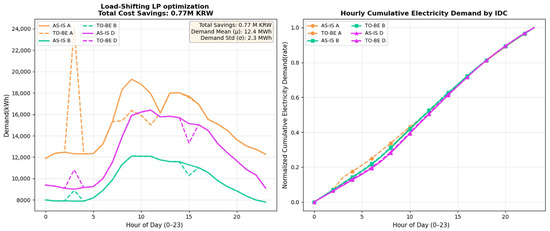
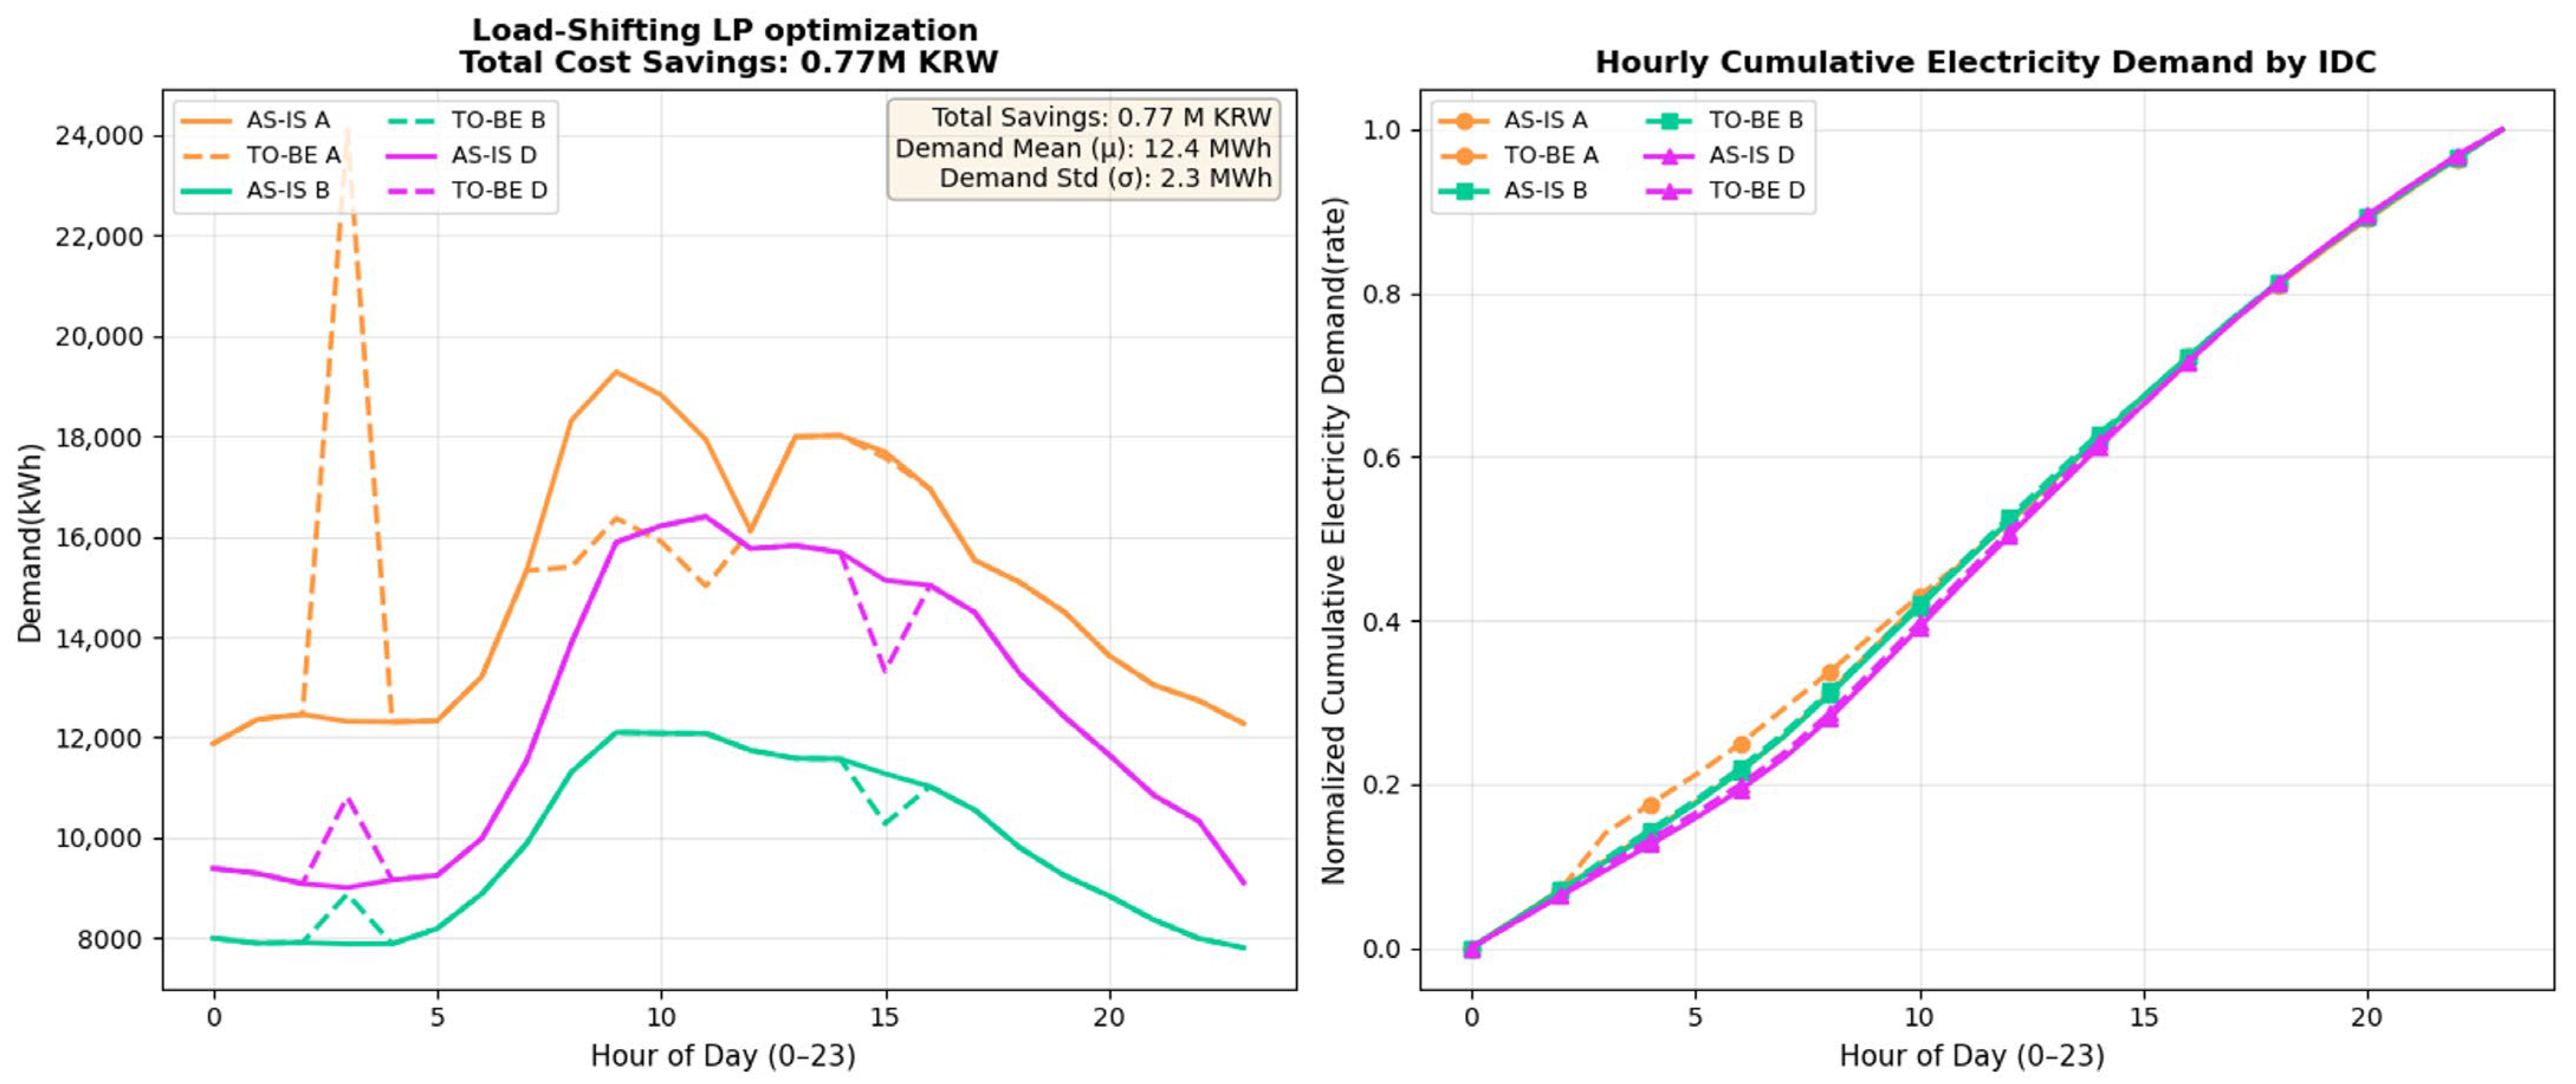
Scenario 3 investigates the outcomes that arise when combining Resource B, which has low demand flexibility, with Resources A and D, which exhibit high demand flexibility, during the winter season. As shown in Figure 6, for Resource B, no meaningful load shifting is observed due to its limited flexibility, and Resource D also experiences only minor curtailment because its load-increase flexibility during early-morning hours is low. As a result, most of the load shifting occurs in Resource A. Such an outcome implies that, under clustered DR resource operation, the customer associated with Resource A may bear a disproportionate burden, potentially leading to dissatisfaction.
Figure 6.
Load-shifting LP optimization result of Scenario 3.
4.2.4. Load Shifting via LP Optimization by Individual Industrial Complex in Fall
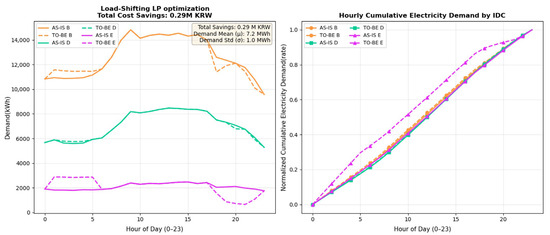
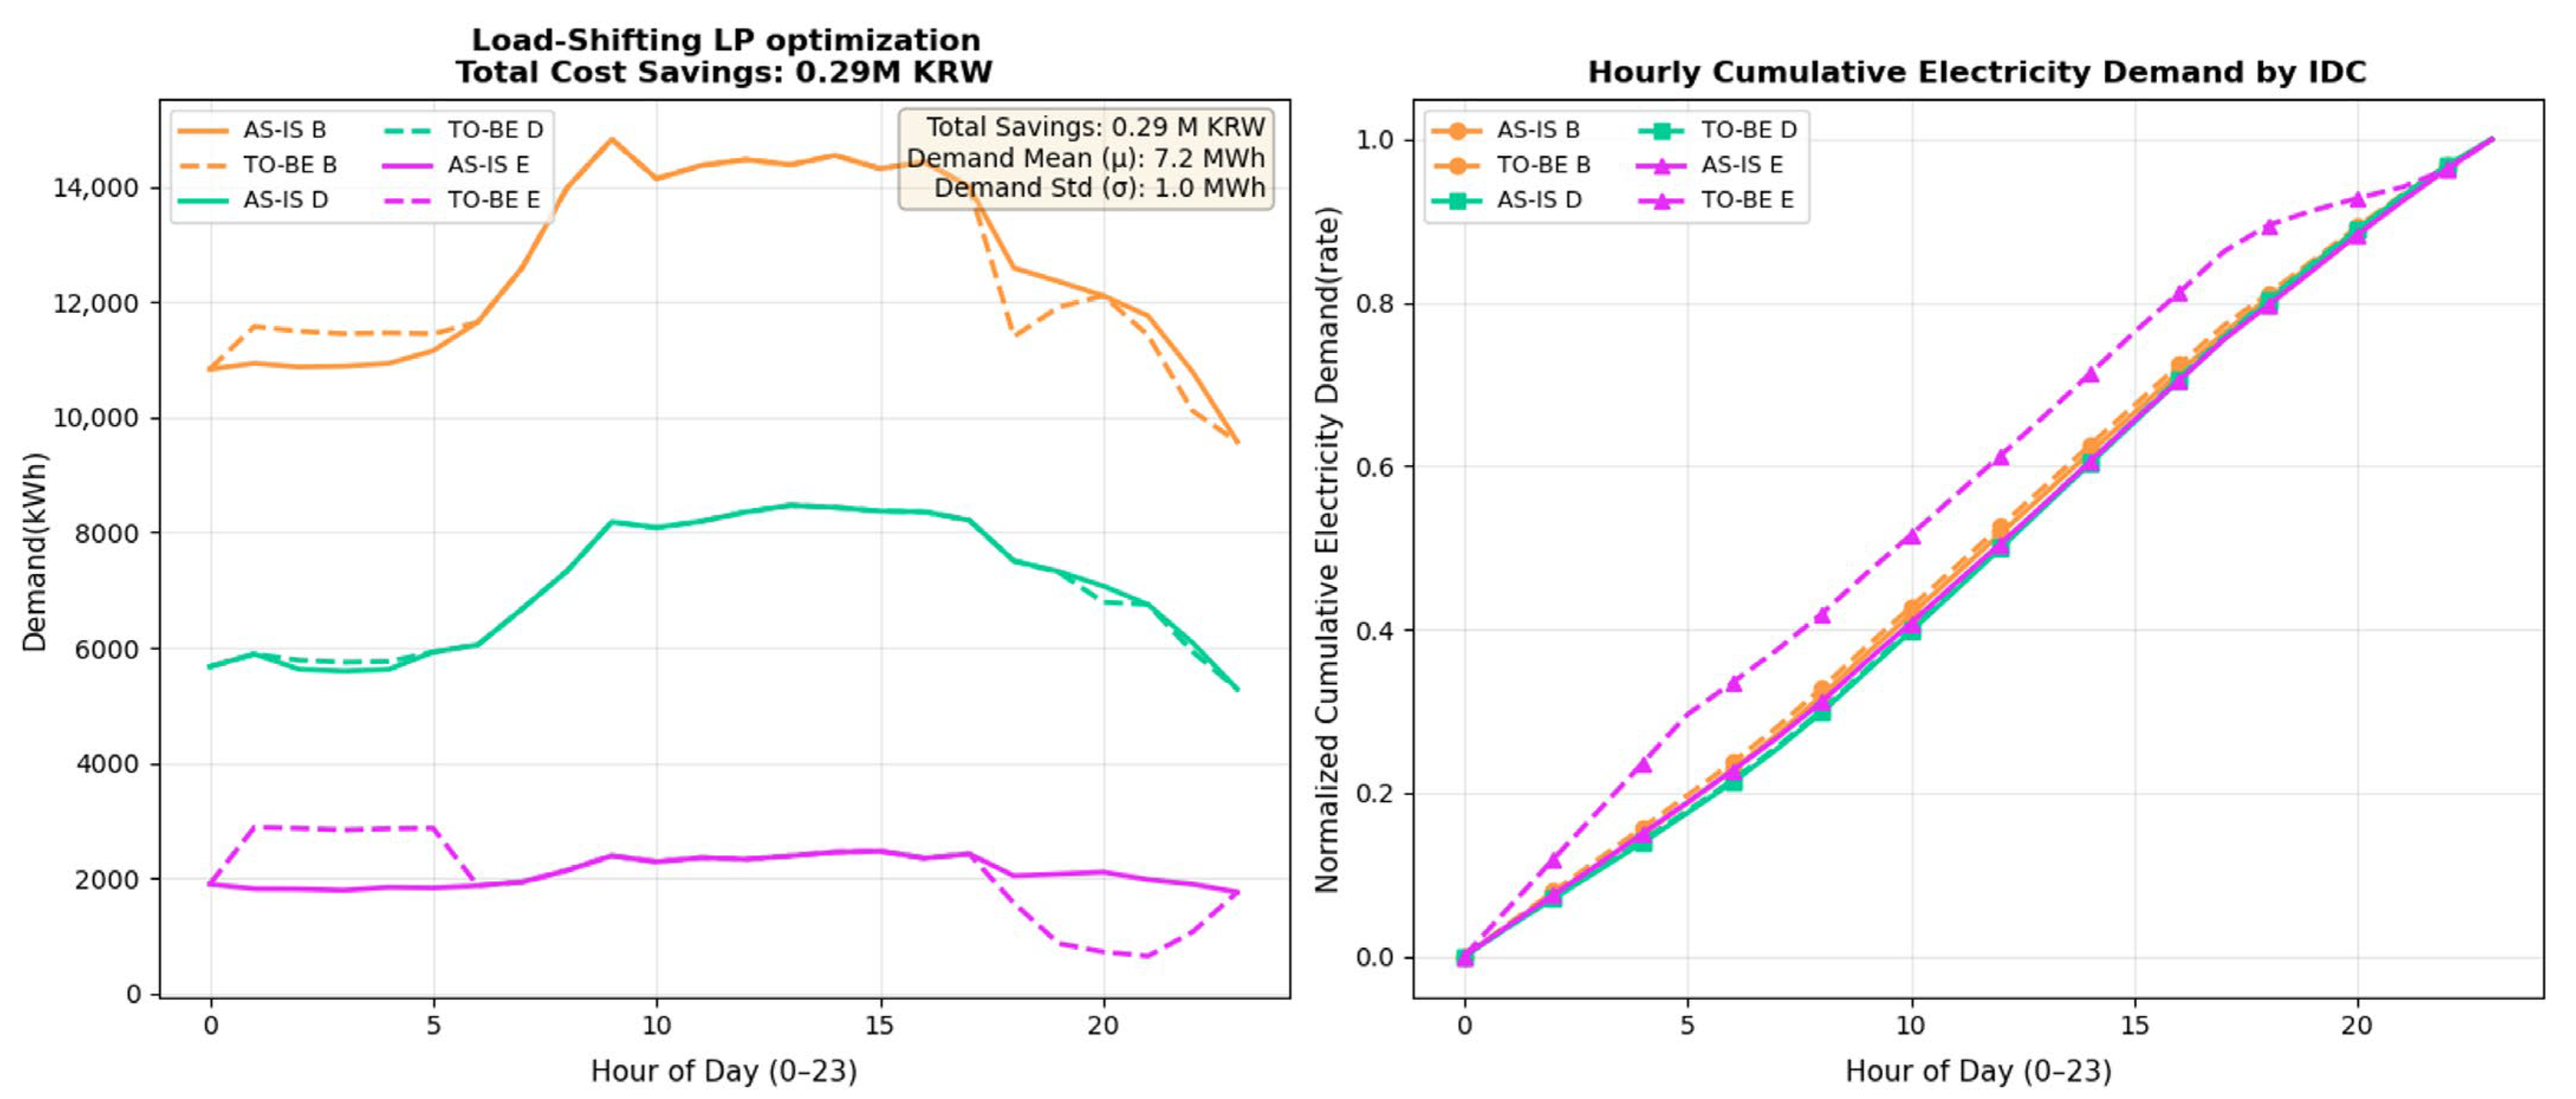
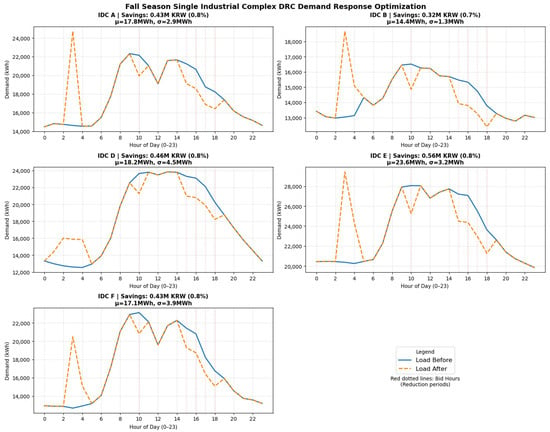
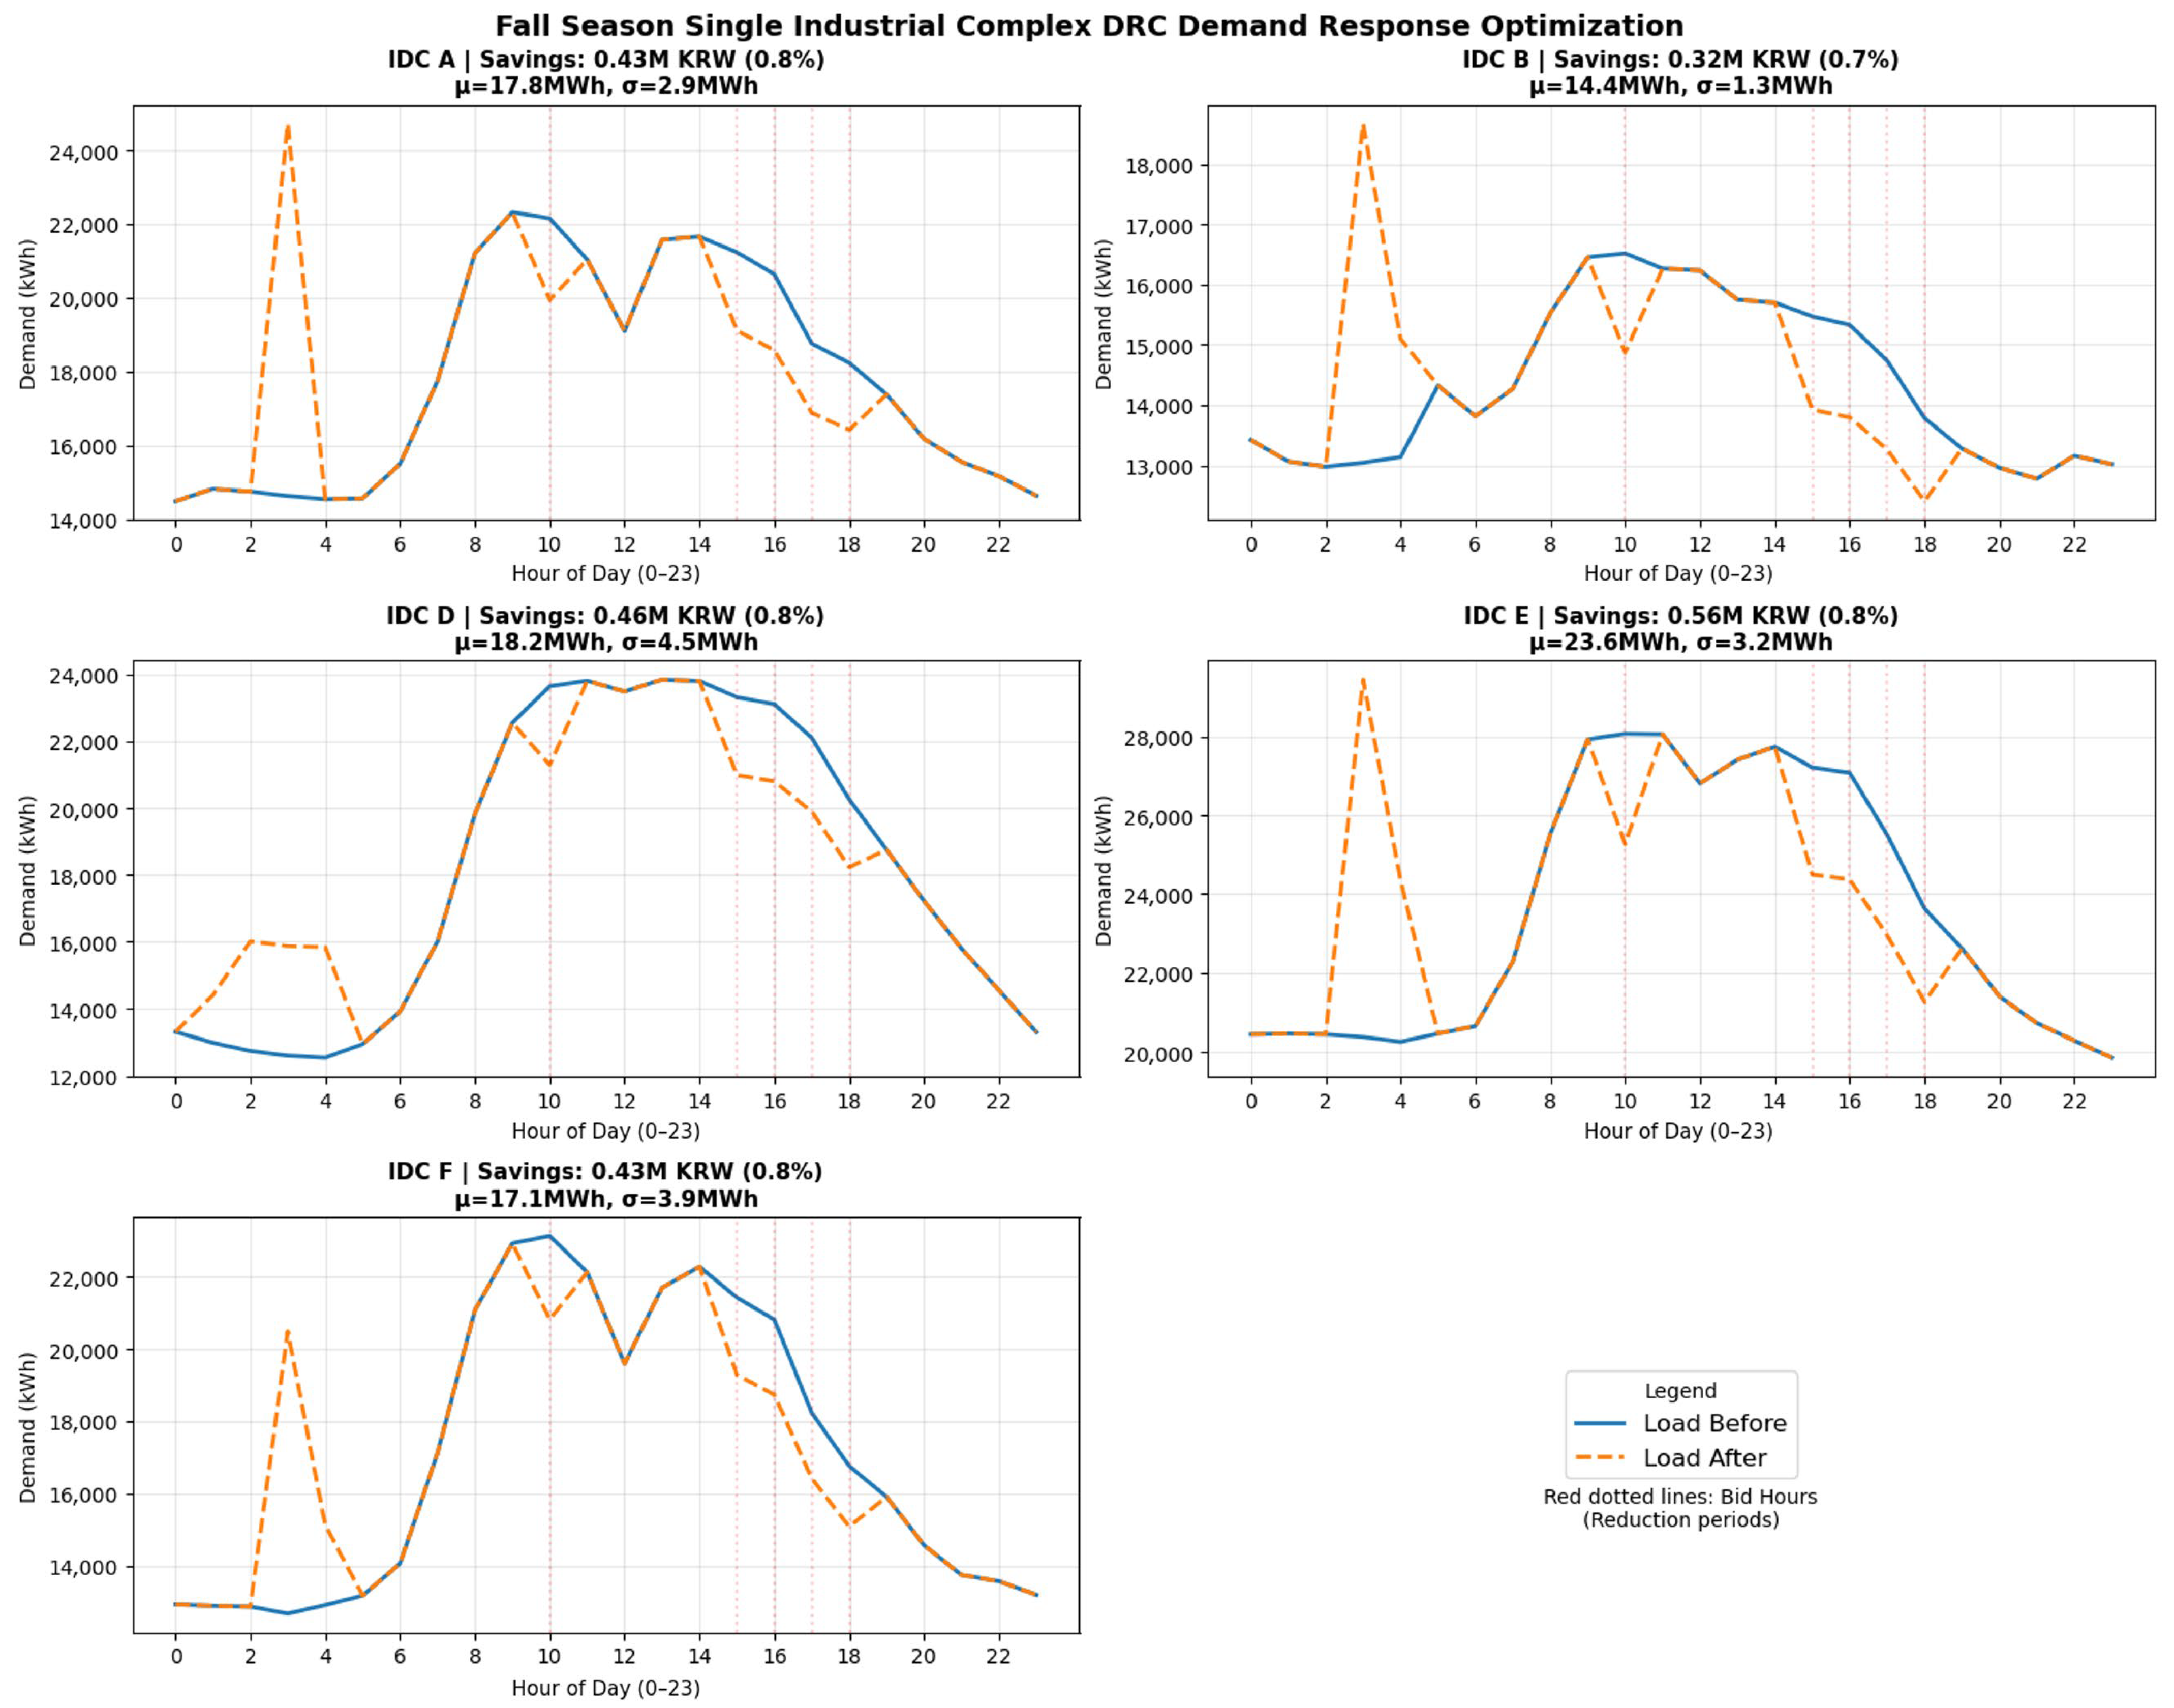
Scenario 4 is designed as a benchmark case in which load-shifting LP optimization is performed for each DR resource individually during the autumn season, since all resources exhibit high demand flexibility in this period. The results are then compared with those obtained under clustered DR resource operation. As shown in Figure 7, during autumn, the average SMP is relatively high during most hours except for early-morning periods, and the level of demand flexibility is similar across time periods. As a result, demand curtailment occurs across multiple hours, while load increases are concentrated primarily in early-morning hours. However, the magnitude of the increased demand becomes unrealistically large under individual DR operation. This suggests that, even in autumn, it is preferable to form clustered DR resources and apply a more realistic load-increase allocation plan.
Figure 7.
Optimal load-shifting results for each complex.
5. Conclusions
This study proposes a method that enables industrial complexes participating in the voluntary demand response market to achieve assigned electricity demand reduction targets by shifting production loads across time periods. This method aims to maintain the original production level while securing benefits from voluntary demand response participation and minimizing electricity consumption costs. The proposed model is based on linear programming and minimizes electricity costs by curtailing and reallocating electricity demand across time periods in accordance with SMP, while incorporating constraints on DR reduction targets, load conservation conditions, and increase–decrease flexibility derived from historical electricity demand distributions.
Based on simulation results using actual electricity demand data from industrial complexes and system marginal price (SMP) data, Scenario 2 demonstrates that the most realistic load shifting plans—and the greatest electricity cost savings—are achieved when industrial complex resources with similar time-of-day average demand levels and comparable load flexibility, while maintaining sufficiently large flexibility ranges, are combined. In Scenario 1, although the aggregated demand response resources were considered realistic due to their limited load flexibility, the resulting electricity cost savings were relatively small. In contrast, Scenario 3 required a specific resource to accommodate an excessively large amount of load shifting, leading to an impractical operational burden.
Furthermore, when DR participation was evaluated on an individual basis, as in Scenario 4, unrealistic outcomes were observed, such as the need for excessive load increases during early morning hours. In particular, large-scale industrial complexes dominated by semiconductor fabrication facilities were found to be unsuitable for aggregation with other DR resources due to their substantial and inflexible demand profiles. Conversely, conventional electronics manufacturing facilities and data center resources exhibited sufficient potential to participate effectively in demand response programs when aggregated with other heterogeneous demand resources.
These results suggest that demand response programs need to move beyond uniform, curtailment-oriented operation schemes and actively exploit time-varying system marginal prices (SMPs). In addition, DR aggregators (DRAs) can effectively enhance the performance of DR operations by constructing resource portfolios that account for heterogeneity in electricity demand characteristics and load flexibility across DR Customers (DRCs).
Meanwhile, this study has a limitation in that the optimization framework was evaluated under a theoretical setting rather than in an actual DR operation environment. Future research will focus on implementing DR optimization using real industrial-complex demand resources and examining whether load shifting can be effectively integrated with production scheduling and electricity metering systems. Through such validation, future work aims to demonstrate that the proposed load-shifting-based linear programming optimization model can provide a practical and realistic approach for demand response operation planning.
In summary, this study proposes a strategic aggregation framework at the industrial complex level to mitigate productivity losses associated with voluntary demand response, along with a load-shifting-based linear programming optimization model that minimizes electricity costs using system marginal prices (SMPs). The proposed approach enhances power system flexibility under conditions of increasing electricity price volatility and provides a realistic and practically applicable solution for real-world demand response operation planning.
Author Contributions
Conceptualization, H.A. and C.O.; methodology, H.A.; software, H.A.; validation, J.P. and C.O.; formal analysis, H.A. and J.P.; investigation, H.A. and J.P.; writing—original draft preparation, H.A. and C.O.; writing—review and editing, J.P. and C.O.; visualization, H.A.; supervision, C.O.; project administration, C.O.; funding acquisition, C.O. All authors have read and agreed to the published version of the manuscript.
Funding
This work was supported by 2024 Hongik University Research Fund.
Data Availability Statement
All data utilized in this paper are public and have been included in the reference list.
Conflicts of Interest
Jongjin Park is employed in VGen Co., Ltd. The other authors declare no conflicts of interest.
References
- Wang, Q.; Huang, N.; Chen, Z.; Chen, X.; Cai, H.; Wu, Y. Environmental data and facts in the semiconductor manufacturing industry: An unexpected high water and energy consumption situation. Water Cycle 2023, 4, 47–54. [Google Scholar] [CrossRef] [Scilit]
- Shehabi, A.; Smith, S.J.; Sartor, D. 2024 United States Data Center Energy Usage Report. Lawrence Berkeley National Laboratory (LBNL). 2024. Available online: https://eta-publications.lbl.gov/sites/default/files/2024-12/lbnl-2024-united-states-data-center-energy-usage-report_1.pdf (accessed on 20 November 2025).
- International Energy Agency. Energy Demand from AI. Energy and AI (Report). International Energy Agency (IEA). 2025. Available online: https://www.iea.org/reports/energy-and-ai/energy-demand-from-ai (accessed on 20 November 2025).
- Albadi, M.H.; El-Saadany, E.F. A summary of demand response in electricity markets. Electr. Power Syst. Res. 2008, 78, 1989–1996. [Google Scholar] [CrossRef] [Scilit]
- Shoreh, M.H.; Siano, P.; Shafie-khah, M.; Loia, V.; Catalão, J.P.S. A survey of industrial applications of demand response. Electr. Power Syst. Res. 2016, 141, 31–49. [Google Scholar] [CrossRef] [Scilit]
- Pechmann, A.; Shrouf, F.; Chonin, M.; Steenhusen, N. Load-shifting potential at SMEs manufacturing sites: A methodology and case study. Renew. Sustain. Energy Rev. 2017, 78, 431–438. [Google Scholar] [CrossRef] [Scilit]
- Parvania, M.; Fotuhi-Firuzabad, M.; Shahidehpour, M. Optimal Demand Response Aggregation in Wholesale Electricity Markets. IEEE Trans. Smart Grid 2013, 4, 1957–1965. [Google Scholar] [CrossRef] [Scilit]
- Heydarian-Forushani, E.; Shafie-khah, M.; Damavandi, M.Y.; Catalão, J.P.S. Optimal participation of DR aggregators in day-ahead energy and demand response exchange markets. In Doctoral Conference on Computing, Electrical and Industrial Systems; Springer: Berlin/Heidelberg, Germany, 2014; Volume 423, pp. 353–360. [Google Scholar] [CrossRef] [Scilit]
- Henríquez, R.; Wenzel, G.; Olivares, D.E.; Negrete-Pincetic, M. Participation of demand response aggregators in electricity markets: Optimal portfolio management. IEEE Trans. Smart Grid 2018, 9, 4861–4871. [Google Scholar] [CrossRef] [Scilit]
- Ovalle, P.N.; Vuelvas, J.; Correa, C.A.; Diaz-Londono, C.; Patino, D. Management model for a demand response aggregator and dispatchable loads. In Energy Systems Integration for Multi-Energy Systems; Springer: Berlin/Heidelberg, Germany, 2025; pp. 659–689. [Google Scholar] [CrossRef] [Scilit]
- Castro, P.M.; Harjunkoski, I.; Grossmann, I.E. Optimal scheduling of continuous plants with energy constraints. Comput. Chem. Eng. 2011, 35, 372–387. [Google Scholar] [CrossRef] [Scilit]
- Moon, J.Y.; Shin, K.; Park, J. Optimization of production scheduling with time-dependent and machine-dependent electricity cost for industrial energy efficiency. Int. J. Adv. Manuf. Technol. 2013, 68, 523–535. [Google Scholar] [CrossRef] [Scilit]
- Shrouf, F.; Ordieres-Meré, J.; García-Sánchez, A.; Ortega-Mier, M. Optimizing the production scheduling of a single machine to minimize total energy consumption costs. J. Clean. Prod. 2014, 67, 197–207. [Google Scholar] [CrossRef] [Scilit]
- Hadera, H.; Harjunkoski, I.; Sand, G.; Grossmann, I.E.; Engell, S. Optimization of steel production scheduling with complex time-sensitive electricity cost. Comput. Chem. Eng. 2015, 76, 117–136. [Google Scholar] [CrossRef] [Scilit]
- Park, J.; Park, S.; Ok, C. Optimal factory operation planning using electrical load shifting under time-based electric rates. J. Adv. Mech. Des. Syst. Manuf. 2016, 10, JAMDSM0085. [Google Scholar] [CrossRef] [Scilit]
- Gahm, C.; Denz, F.; Dirr, M.; Tuma, A. Energy-efficient scheduling in manufacturing companies: A review and research framework. Eur. J. Oper. Res. 2016, 248, 744–757. [Google Scholar] [CrossRef] [Scilit]
- Duarte, J.; Fan, N.; Jin, T. Multi-process production scheduling with variable renewable integration and demand response. Eur. J. Oper. Res. 2020, 281, 186–200. [Google Scholar] [CrossRef] [Scilit]
- dos Santos, S.A.B.; Soares, J.M.; Barroso, G.C.; de Athayde Prata, B. Demand response application in industrial scenarios: A systematic mapping of practical implementation. Expert Syst. Appl. 2023, 215, 119393. [Google Scholar] [CrossRef] [Scilit]
- Catanzaro, D.; Pesenti, R.; Ronco, R. Job scheduling under Time-of-Use energy tariffs for sustainable manufacturing: A survey. Eur. J. Oper. Res. 2023, 308, 1091–1109. [Google Scholar] [CrossRef] [Scilit]
- Fisco-Compte, P.; Juanpera, M.; Domenech, B.; Pastor, R.; Ranaboldo, M.; Bullich-Massagué, E. Sustainable optimal production scheduling methodology under implicit demand response and carbon policy: A manufacturing industry case study. Appl. Energy 2025, 384, 125403. [Google Scholar] [CrossRef] [Scilit]
- Starke, M.; Alkadi, N.; Ma, O. Assessment of Industrial Load for Demand Response Across U.S. Regions of the Western Interconnect. Oak Ridge National Laboratory (ORNL). 2013. Available online: https://info.ornl.gov/sites/publications/files/pub45942.pdf (accessed on 27 December 2025).
- Lee, E.; Baek, K.; Kim, J. Evaluation of Demand Response Potential Flexibility in the Industry Based on a Data-Driven Approach. Energies 2020, 13, 6355. [Google Scholar] [CrossRef] [Scilit]
- Ko, W.; Vettikalladi, H.; Song, S.-H.; Choi, H.-J. Implementation of a Demand-Side Management Solution for South Korea’s Demand Response Program. Appl. Sci. 2020, 10, 1751. [Google Scholar] [CrossRef] [Scilit]
- Lee, E.; Baek, K.; Kim, J. Datasets on South Korean manufacturing factories’ electricity consumption and demand response participation. Sci. Data 2022, 9, 227. [Google Scholar] [CrossRef] [Scilit]
- Valentini, O.; Andreadou, N.; Bertoldi, P.; Lucas, A.; Saviuc, I.; Kotsakis, E. Demand Response Impact Evaluation: A Review of Methods for Estimating the Customer Baseline Load. Energies 2022, 15, 5259. [Google Scholar] [CrossRef] [Scilit]
- Baek, K.; Baek, J.; Ko, K. A Data-Driven Estimation Model for Industrial Demand Flexibility Potential. J. Electr. Eng. Technol. 2025, 20, 2849–2857. [Google Scholar] [CrossRef] [Scilit]
- Korea Electric Power Corporation. Electricity Big Data Open Portal. Industry and Sector-Based Electricity Usage Statistics Dataset. Korea Electric Power Corporation Big Data Platform. Available online: https://bigdata.kepco.co.kr/cmsmain.do?scode=S01&pcode=000502&pstate=L&redirect=Y (accessed on 8 May 2025).
- Korea Power Exchange. System Marginal Price (SMP) OpenAPI. Public Data Portal Dataset Providing Hourly Electricity Market Price Information. Available from: Public Data Portal, Korea Power Exchange SMP API. Available online: https://www.data.go.kr/data/15076302/openapi.do (accessed on 8 May 2025).
- Morales-España, G.; Ramírez-Elizondo, L.; Hobbs, B.F. Classifying and Modelling Demand Response in Power Systems. Energy 2022, 242, 122544. [Google Scholar] [CrossRef] [Scilit]

Disclaimer/Publisher’s Note: The statements, opinions and data contained in all publications are solely those of the individual author(s) and contributor(s) and not of MDPI and/or the editor(s). MDPI and/or the editor(s) disclaim responsibility for any injury to people or property resulting from any ideas, methods, instructions or products referred to in the content. |
© 2026 by the authors. Licensee MDPI, Basel, Switzerland. This article is an open access article distributed under the terms and conditions of the Creative Commons Attribution (CC BY) license.