


Abstract
Water scarcity is driving increasing interest in potable water reuse, particularly in arid regions. However, inadequately treated reclaimed water may pose health risks from waterborne pathogens, including gastrointestinal infections. This study applied quantitative microbial risk assessment (QMRA) to estimate infection risks associated with Escherichia coli (E. coli), Cryptosporidium, rotavirus, and adenovirus using pilot-scale data from El Paso Water’s Pure Water Center advanced purification facility. Pathogen concentrations in source and treated water were fitted to probability distributions and incorporated into a probabilistic Monte Carlo QMRA framework to estimate exposure doses, daily and cumulative infection risks, and treatment performance (expressed as log reduction values (LRVs)) and were compared to U.S. Environmental Protection Agency (EPA) drinking water risk thresholds. E. coli demonstrated the greatest treatment effectiveness, with a median daily treated water infection risk of 1.45 × 10⁻⁶ and a median LRV of 3.32. Cryptosporidium demonstrated limited reduction in infection risk (median LRV = 0.976), while rotavirus demonstrated minimal reduction following treatment. Although adenovirus infection risk decreased after treatment, the residual risk remained high. Viral risk estimates were strongly influenced by non-detects and limited observations. These findings highlight the importance of robust monitoring and probabilistic QMRA approaches for evaluating uncertainty and treatment performance in advanced potable reuse systems.
1. Introduction
Water scarcity is a growing concern, even in countries that have sufficient water resources. Nearly four billion people face severe water scarcity for at least one month per year, prompting communities to consider alternative water sources [1]. By 2050, nearly three-quarters of the global population may be affected by droughts [2]. Water scarcity is driven by multiple, often compounding factors, including deteriorating infrastructure and distribution systems, inadequate water resource management, urbanization, population growth, and prolonged drought conditions. In response, communities are increasingly evaluating alternative water sources. Concurrently, climate-related events such as droughts, wildfires, and extreme weather are becoming more frequent and severe, further straining water systems [3]. These challenges have intensified discussions around strengthening water infrastructure and highlight the urgent need for water utilities to enhance their resiliency to ensure the continued delivery of safe, reliable drinking water under increasingly uncertain conditions.
A practical solution to address stressed water resources is water reuse, also referred to as water reclamation or recycling. Water reuse is increasingly considered an effective local strategy, particularly in regions facing imbalances in water demand and availability due to clean water scarcity, declining water resources, and increasing pollution [4]. El Paso, Texas, is an arid desert community in Far West Texas that relies on the Rio Grande River for nearly half of its water supply [5]. However, drought conditions are becoming more frequent, and the annual average rainfall is only approximately 23 cm. Additionally, the Rio Grande has experienced reduced snowmelt contributions from Colorado and New Mexico, with studies of the Upper Rio Grande Basin indicating a decline of roughly 17% to over 30% in snowmelt-driven flow [6,7,8]. In response, the region’s primary water utility, El Paso Water, re-evaluated local water conditions in 2012 and initiated a direct potable reuse (DPR) strategy to support long-term water sustainability. As part of this effort, an advanced water purification (AWP) system, referred to as the Pure Water Center, is being constructed to treat wastewater to drinking water standards and will become the nation’s first direct-to-distribution water reuse facility to provide up to 10 million gallons of drinking water per day [9]. A pilot AWP facility tested in 2016 evaluated the effectiveness of a four-step treatment process—including membrane filtration (MF/UF), nanofiltration and reverse osmosis (NF/RO), ultraviolet (UV) disinfection, and granular activated carbon (GAC)—in removing and inactivating waterborne contaminants, including microbial pathogens [10]. This evaluation is particularly relevant given that El Paso relies on both groundwater and surface water (specifically the Rio Grande), where routine monitoring efforts have identified the presence of protozoan pathogens, such as Cryptosporidium and Giardia, in surface water, while groundwater generally shows few or no detections [11]. In addition, bacterial and viral pathogens—including Escherichia coli (E. coli), a fecal indicator bacterium, rotavirus (one of the most infectious waterborne pathogens), and adenovirus—pose ongoing challenges for drinking water safety due to their infectivity and, in some cases, resistance to treatment processes. Given the potential human health risks associated with microbial contaminants found in wastewater, evaluating the effectiveness of treatment processes for this system is critical.
The ability of a community to provide sufficient and safe drinking water is essential for preventing waterborne disease. However, the characteristics of waterborne pathogens, including infectivity rate and persistence, may change over time due to deteriorating infrastructure and emerging environmental stressors. Public health protection cannot be ensured by microbiological monitoring of treated water alone, as detection limits are often higher than pathogen concentrations associated with risk threshold levels [12]. Therefore, several approaches have been used to evaluate microbial risks associated with water supplies and potable water reuse. Microbiological monitoring and surveillance provide important information on pathogen occurrence and treatment performance, but they are generally used as part of broader risk-based approaches rather than as direct estimates of infection risk [13]. Epidemiological studies can evaluate health outcomes in exposed populations, although relatively few studies have examined the microbial risks associated with potable water reuse, and the limited number of operational potable reuse systems and expected low incidence of waterborne disease can make epidemiological evaluation challenging [14]. Qualitative and semi-quantitative approaches, including sanitary inspections, risk scoring, and risk matrices, can be used to identify hazards and prioritize risks, but they do not provide quantitative estimates of pathogen-specific infection risk like those provided by quantitative microbial risk assessment (QMRA) [15].
QMRA provides a complementary approach by integrating pathogen occurrence, treatment performance, exposure, and dose–response relationships through a four-step framework consisting of hazard identification, exposure assessment, dose–response assessment, and risk characterization to estimate the probability of infection and other health outcomes [16,17]. QMRA has been widely applied to evaluate microbial risks associated with potable water reuse. However, estimated risks remain highly dependent on site-specific pathogen occurrence, treatment configurations, exposure assumptions, and treatment performance [18]. In addition to verifying that individual water treatment trains meet established risk targets under existing monitoring frameworks, this systematic approach can also be used to optimize treatment processes for potable reuse applications [19]. Furthermore, QMRA can assist in developing socially acceptable and economically sustainable policies aimed at reducing adverse health impacts associated with human activities.
The Texas Commission on Environmental Quality (TCEQ) evaluates DPR projects on a strict case-by-case basis, establishing site-specific pathogen log reduction values (LRVs) requirements based on source water quality and public health targets [20]. This risk-based approach aligns with contemporary QMRA frameworks that use pathogen occurrence, exposure assumptions, and treatment performance to establish LRVs necessary to achieve acceptable annual infection risks. Recent QMRA studies have demonstrated that required LRVs can vary substantially depending on assumptions regarding pathogen occurrence, exposure frequency, treatment reliability, and operational failure scenarios, supporting the need for site-specific regulatory frameworks rather than a single universal DPR standard. Comparing California, Texas, and proposed DPR regulatory frameworks has shown that pathogen LRV targets may range from approximately 13/10/10 to 20/15/25 for viruses, Giardia, and Cryptosporidium, respectively, depending on assumptions regarding pathogen occurrence, treatment redundancy, and off-specification operating conditions [21].
Although QMRA has been applied widely to evaluate microbial risks associated with potable water reuse, site-specific assessments remain important. Estimated health risks are influenced by an array of factors, including source water characteristics, pathogen occurrence, treatment configurations, exposure assumptions, and variability in treatment performance. In this study, we apply a QMRA framework that utilizes probabilistic pathogen data from El Paso Water’s Pure Water Center pilot facility (2016) to evaluate pathogen-specific microbial infection risks across a multibarrier AWP treatment train. Estimated daily and cumulative infection risks were compared to the U.S. Environmental Protection Agency (EPA) health-based drinking water risk thresholds, and treatment performance was evaluated using risk-based LRVs derived from infection risks in source and treated water. The probabilistic framework also characterizes variability and uncertainty associated with pathogen concentrations and treatment performance. By integrating pilot-scale treatment data, probabilistic risk modeling, pathogen-specific risk characterization, and comparison with health-based benchmarks, we provide a case-specific assessment of microbial risks associated with DPR while demonstrating an adaptable QMRA framework for evaluating microbial risk and uncertainty in other potable reuse applications. This work demonstrates substantial differences in estimated risk reductions among microbial groups and underscores the importance of interpreting pathogen-specific treatment performance in the context of model assumptions and data limitations.
2. Materials and Methods
2.1. Data Collection
A drinking water exposure scenario was developed to estimate pathogen-specific infection risks. Due to the innovative and unique AWP process, data from El Paso Water’s Pure Water Center AWP pilot facility (2016) were used to evaluate treatment performance and associated infection risks. The pilot facility incorporated parallel membrane trains to evaluate the performance of Microfiltration (Pall) and Ultrafiltration (Evoqua), as well as Nanofiltration (NF90) and Reverse Osmosis (ESPA2-LD), technologies under identical feed conditions (80% recovery). Chlorine and ammonia were added upstream of membrane filtration to mitigate biological fouling and maintain stable membrane performance.
The dataset consisted of analytical laboratory measurements of pathogen concentrations in source water (secondary effluent) and across treatment barriers, including E. coli, Cryptosporidium, rotavirus, and adenovirus. Data were obtained from Arcadis, U.S., Inc. (El Paso, TX, USA) datasets and the AWP facility pilot test report [22,23,24].
Water samples were collected from 19 November 2014 to 19 January 2016 for E. coli and Cryptosporidium and from 10 June 2015 to 13 January 2016 for rotavirus and adenovirus analyses. The number of observations differed across pathogens and treatment stages, reflecting variations in monitoring frequency and data availability. For Cryptosporidium, 38 source water and 16 treated drinking water measurements were available; for E. coli, 28 source water and 28 treated drinking water measurements; and for rotavirus and adenovirus, 22 observations were available for both source and treated drinking water. All datasets included detect, non-detect, and not-sampled values, which were retained to preserve the complete structure of the original monitoring records.
2.2. QMRA
A QMRA was applied using pilot-scale treatment data from the Pure Water Center to estimate daily and annual infection risks associated with selected waterborne pathogens in drinking water. The analysis followed the standard four-step framework consisting of hazard identification, exposure assessment, dose–response assessment, and risk characterization. The framework was applied to evaluate pathogen occurrence and treatment performance across the Pure Water Center AWP treatment train and to estimate the health risks associated with ingestion of treated drinking water.
The QMRA used pathogen concentration data from source and treated drinking water with treatment performance, drinking water ingestion, and pathogen-specific dose–response relationships. Source water concentrations were used to characterize the microbial hazards entering the treatment train, while treated water concentrations represented the residual pathogen concentrations following treatment. These data were integrated with drinking water ingestion volume to estimate the pathogen dose, which was then used with pathogen-specific dose–response relationships to calculate the probability of infection. Annual infection risks were then calculated from the daily infection risks and compared with established health-based risk thresholds. The specific methods and assumptions used for each step of the QMRA are described in the following subsections.
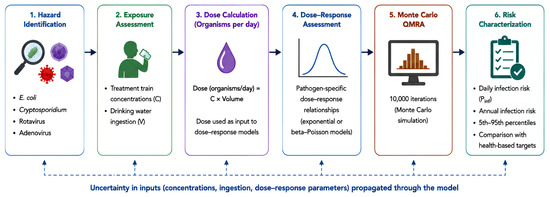
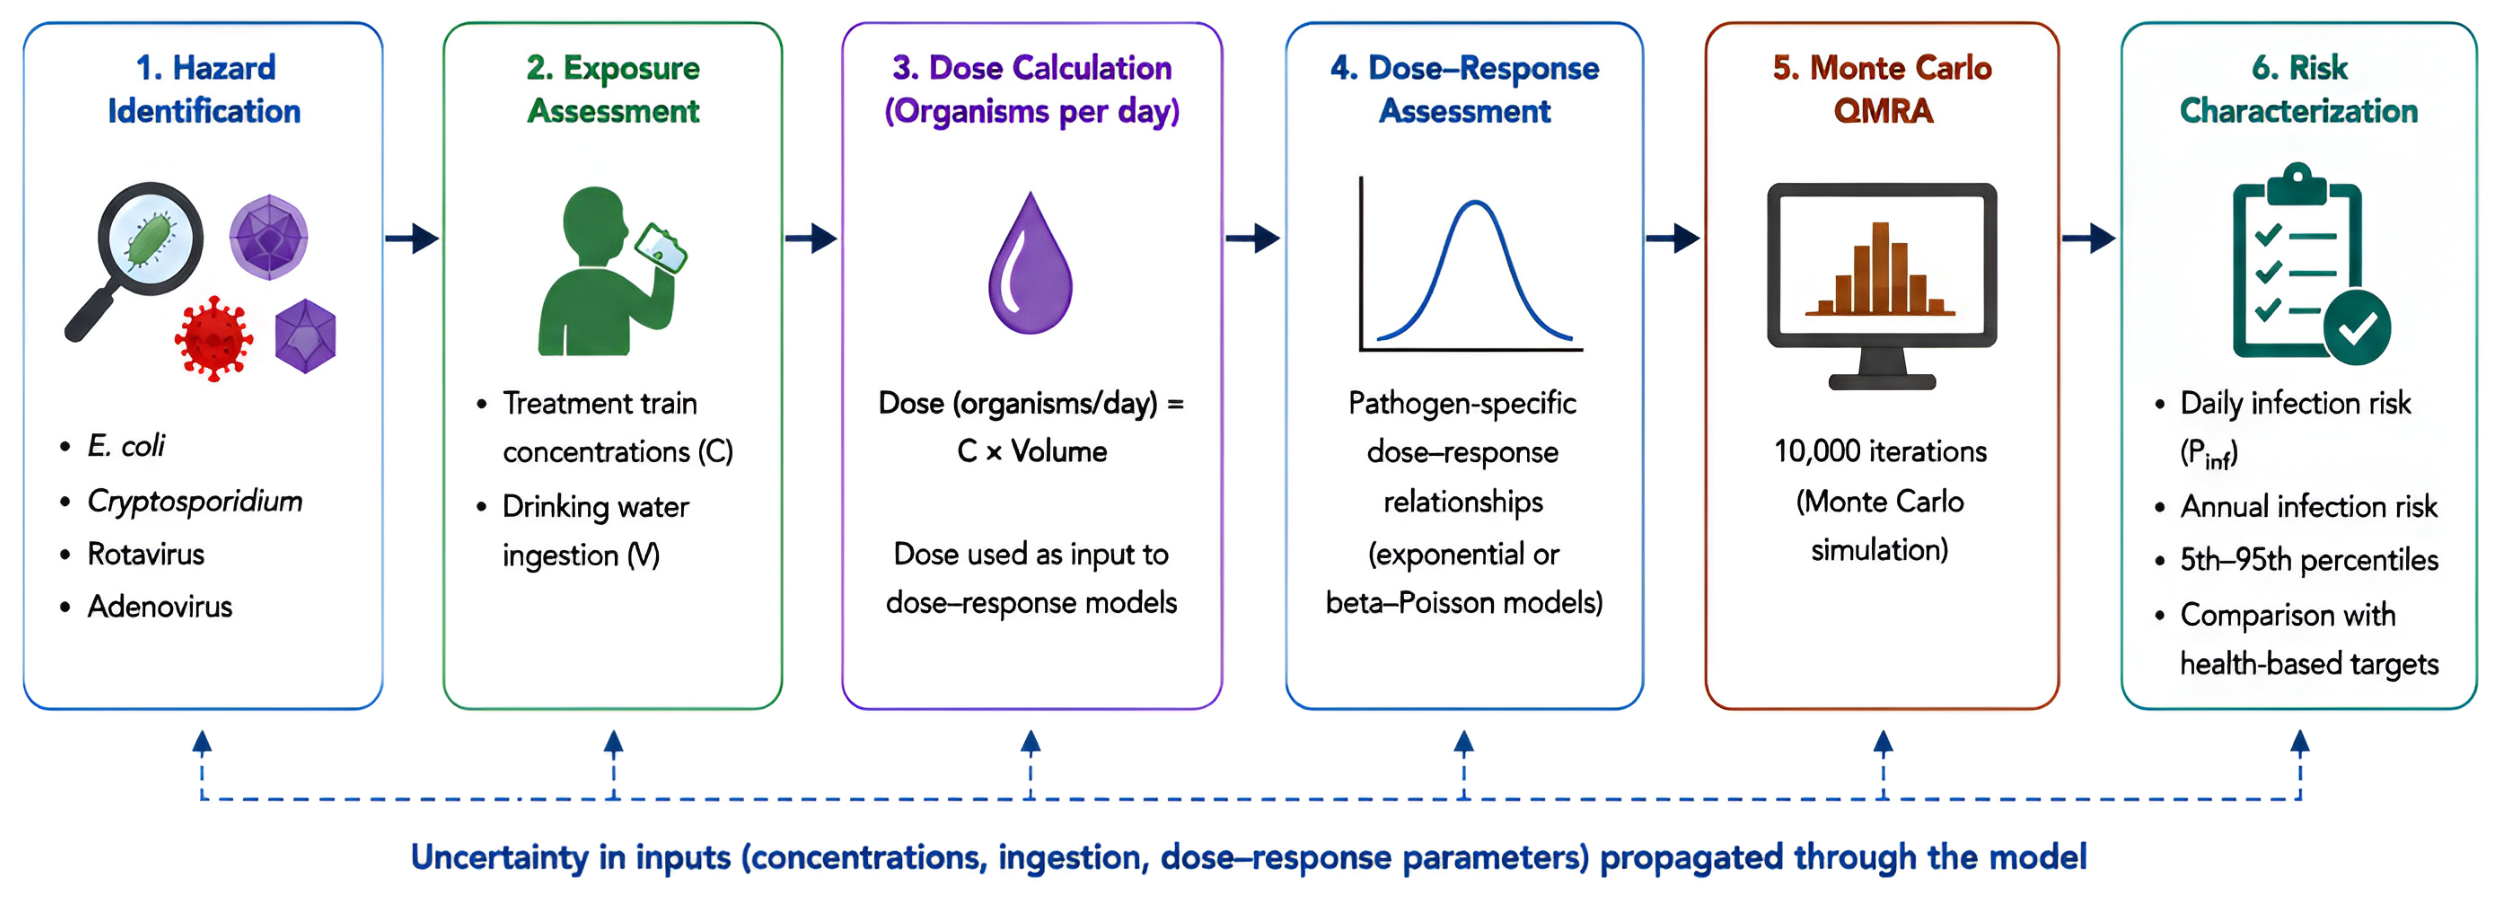
The overall QMRA framework applied in this study is presented in Figure 1, illustrating the integration of exposure inputs, dose–response modeling, and risk characterization to estimate pathogen-specific infection risks.
Figure 1.
QMRA workflow used to estimate infection risk from source and treated drinking water.
2.2.1. Hazard Identification
This study focused on microbial pathogens present in both source water (secondary effluent) and treated drinking water to evaluate the effectiveness of the AWP treatment train in reducing pathogen concentrations to levels consistent with drinking water standards.
Target Pathogens
Infection risk was evaluated for four representative waterborne pathogens: E. coli, Cryptosporidium, rotavirus, and adenovirus. These pathogens were selected to represent bacteria, protozoa, and viruses with differing infectivity and resistance to treatment processes and have been identified in surface and groundwater sources in the El Paso region.
E. coli is a fecal indicator bacterium commonly associated with gastrointestinal illness and is widely used to assess microbial water quality and potential fecal contamination [25]. Its presence may indicate possible contamination by other pathogens. However, indicator bacteria do not always correlate with the presence of more treatment-resistant organisms, such as protozoa and viruses.
Cryptosporidium is a protozoan parasite that causes cryptosporidiosis and can survive for extended periods in the environment. It is resistant to conventional disinfection processes, particularly chlorination, and is often used as a representative protozoan pathogen of concern in water reuse systems [26].
Rotavirus is one of the most infectious waterborne viral pathogens and is known for its high resistance to disinfectants, including ultraviolet (UV) light disinfection and chlorination, allowing it to persist in water systems [27]. Adenovirus was selected due to its high infectivity and notable resistance to UV light disinfection, making it a critical challenge for advanced water treatment systems [28].
2.2.2. Exposure Assessment
Exposure Route
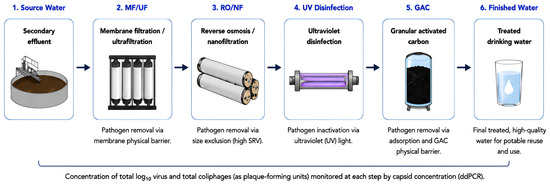
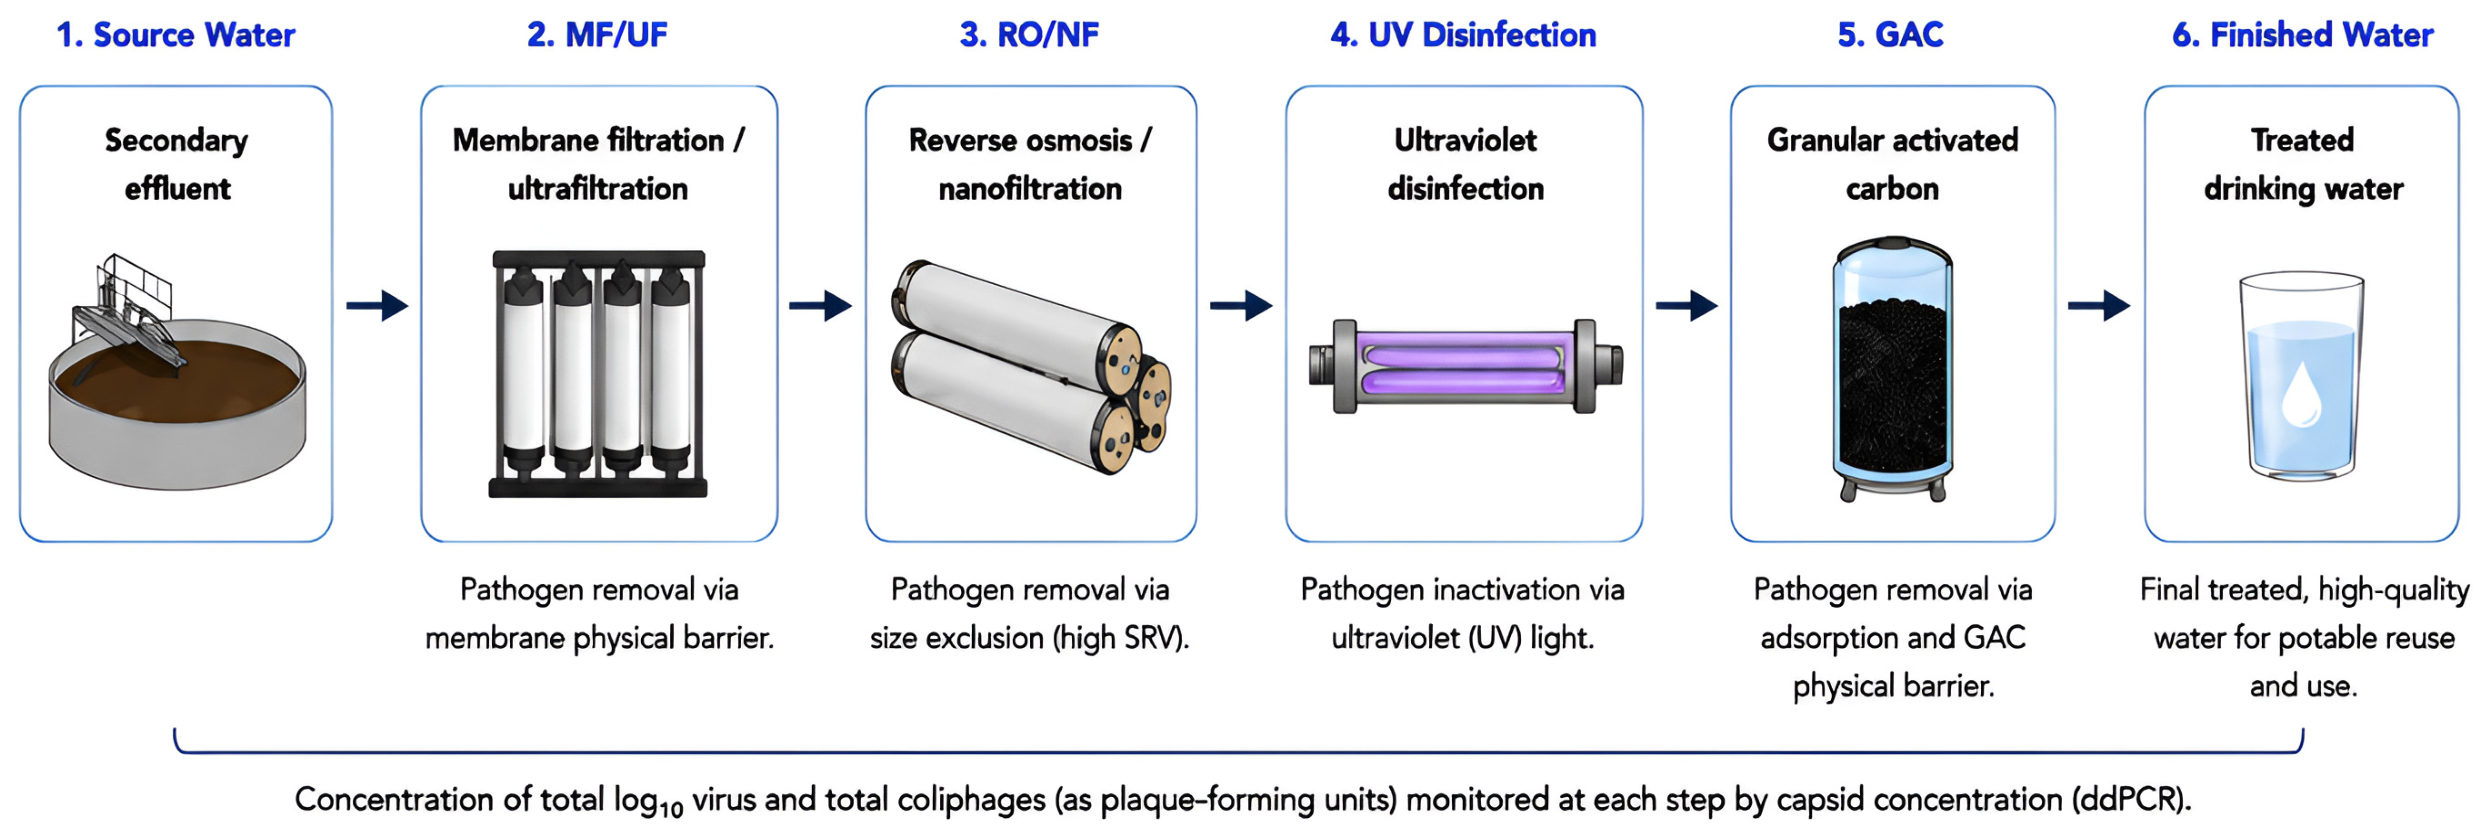
The exposure route considered in this study was ingestion of treated drinking water following the Pure Water Center’s AWP treatment train, which consists of membrane filtration (MF/UF), nanofiltration and reverse osmosis (NF/RO), ultraviolet (UV) disinfection, and granular activated carbon (GAC). Infection risks were evaluated for both source water (secondary effluent) and treated drinking water to quantify pathogen reduction and estimate the LRVs associated with the treatment train. Because this study evaluated microbial infection risks associated with consuming drinking water produced by the AWP treatment train, the QMRA was limited to the ingestion exposure route. Other potential exposure routes, including inhalation and dermal contact, were outside the scope of the drinking water exposure scenario evaluated in this study.
The schematic train and corresponding exposure pathway are presented in Figure 2.
Figure 2.
Pilot-scale advanced purification treatment train at the El Paso Pure Water Center.
Exposure Concentration
Non-detect and non-sampled values were substituted with one-half the method detection limit (MDL) to provide an estimated pathogen concentration in the QMRA when the true concentration was below the analytical detection limit and could not be directly quantified. This approach is commonly used in environmental exposure and risk assessments and is consistent with U.S. EPA guidance for handling censored environmental data [29]. Because the distribution of concentrations below the detection limit could not be characterized from the available data, one-half the MDL was used as a standardized substitution value.
Alternative approaches for handling censored environmental data, including maximum likelihood estimation and Kaplan–Meier methods, were considered. These approaches can be useful for estimating concentration distributions when sufficient information is available to characterize the censored portion of the data. However, the pathogen-specific datasets in this study included a substantial amount of missing data, high proportions of non-detects for some pathogens, and limited observations of treated water viral concentrations. Given these data limitations and the need to apply a consistent approach across pathogens and treatment stages, one-half of the MDL was used as a standardized substitution approach for the QMRA. The potential influence of this approach on estimated variability and risk is acknowledged as a limitation.
The detection limits were 20 most probable number per liter (MPN/L) for E. coli (assigned value: 10 MPN/L), 0.01 oocysts/L for Cryptosporidium (assigned value: 0.005 oocysts/L), and 1 plaque-forming unit per liter (PFU/L) for rotavirus and adenovirus (assigned value: 0.5 PFU/L).
Rotavirus and adenovirus concentrations were initially reported in genomic copies per liter (GC/L). To maintain consistency with infectivity-based dose–response models, these values were converted to plaque-forming units per liter (PFU/L) using a conversion factor based on Pecson et al. (2022), where approximately 109 GC corresponds to 108 PFU [30].
Pathogen concentrations in source water and treated drinking water were fit to probability distributions to describe microbial variability. Measured concentrations for all four pathogens were fit to several probability distributions (e.g., lognormal, Weibull, gamma, exponential, logistic, and uniform), and final distributions were selected based on goodness-of-fit evaluation (e.g., Kolmogorov–Smirnov and Anderson–Darling), yielding distribution parameters to be incorporated into the QMRA. The selected distributions were intended to characterize observed microbial variability when sufficient concentration data were available, while distributions applied to highly censored or non-variable data were used to represent uncertainty in the estimated concentrations.
For E. coli concentrations in source water, a large proportion of samples were reported at the upper detection limit of the assay (24,200 MPN/L), which may reflect upper censoring in the dataset. Due to this limitation, a lognormal distribution was selected to better represent potential variability in source water concentrations, including concentrations above the observed detection limit. This approach assumes that the underlying concentration distribution extends beyond the observed upper detection limit. Therefore, estimated concentrations at the upper end of the distribution are subject to uncertainty. In treated water, concentrations were constant (10 MPN/L), with no observed variability after treatment. Because no variability was observed, a uniform distribution ranging from zero to the observed maximum concentration (0, 10 MPN/L) was used to reflect this uncertainty.
For Cryptosporidium, source water concentrations were evaluated using several probability distributions, with a lognormal distribution providing the best fit to characterize observed variability. The use of this distribution assumes that the observed concentration data adequately represent the underlying right-skewed variability in source water. In treated water, the same distribution-fitting approach was applied, and a Weibull distribution was selected based on goodness-of-fit results. As with the other fitted distributions, the estimated variability is dependent on the available concentration data and may be influenced by the proportion of non-detects and substituted values.
For rotavirus, a lognormal distribution was used to describe source water concentrations based on goodness-of-fit results. In treated water, strong left-censoring limited how well the data could support distribution fitting. However, a lognormal distribution was applied to represent potential variability in treated water concentrations based on its common use in microbial risk assessment and its ability to represent right-skewed microbial concentration data [17]. Because the treated water distribution was estimated from substantially censored data, the resulting concentration variability and associated risk estimates are subject to uncertainty.
For adenovirus, source water concentrations were best described by a lognormal distribution based on goodness-of-fit results. In treated water, all samples were reported as non-detects and were assigned half the detection limit (0.5 PFU/L), using the substitution approach described above. Because no variability was observed in the treated water, a uniform distribution ranging from zero to 0.5 PFU/L was used to reflect uncertainty. This approach assumes that concentrations between zero and one-half the detection limit are plausible, but the resulting uncertainty distribution is limited by the absence of measured detectable concentrations.
Exposure Dose
The exposure dose was defined as the estimated number of pathogens ingested per exposure event through source and drinking water consumption and was calculated using Equation (1):
where C is the pathogen concentration in water (pathogens/L), V is the daily drinking water ingestion volume (L/day), and Dose is the number of pathogens ingested per exposure event.
Daily drinking water ingestion was modeled using a lognormal distribution, consistent with prior drinking water exposure assessments [31]. Distribution parameters were derived by fitting data from the U.S. EPA Exposure Factors Handbook, based on NHANES 2005–2010 percentile data for consumer-only direct water ingestion [32]. The resulting distribution was characterized by µ = 0.18 and σ = 0.52, corresponding to a median intake of 1.2 L/day and a 95th percentile of 2.8 L/day. A single drinking-water ingestion distribution was used for both source water and treated water scenarios to provide a consistent representation of daily drinking water consumption and allow direct comparison of estimated infection risks before and after treatment. Exposure doses were estimated separately for source water and treated water using the corresponding pathogen concentration distributions described above. All exposure model inputs, including pathogen concentration distributions and drinking water ingestion assumptions, are summarized in Table 1.
Table 1.
Exposure parameters utilized in the QMRA.
2.2.3. Dose–Response Assessment
The dose–response assessment estimated the probability of infection resulting from the ingested pathogen dose calculated in the previous step. This step links the exposure dose to human health outcomes by applying pathogen-specific dose–response models.
Data from the Center for Advancing Microbial Risk Assessment (CAMRA) were used to identify the best-fit dose–response models for each pathogen [33]. For Cryptosporidium and adenovirus, the exponential dose–response model was applied using Equation (2):
where k is the infectivity constant parameter representing the probability that an individual pathogen causes infection, d is the ingested dose per exposure event obtained from Equation (1), and Pinf is the probability of infection per exposure event (daily). The k values used were 5.72 × 10⁻² for Cryptosporidium and 6.07 × 10⁻¹ for adenovirus, consistent with values used by the U.S. EPA [33,34].
The beta-Poisson model was identified as the best-fit dose–response model for E. coli and rotavirus and was applied using Equations (3) and (4):
where Pinf is the probability of infection per exposure event (daily), d is the exposure dose obtained from Equation (1), α describes the variability in host susceptibility and pathogen infectivity, and β relates to the pathogen–host interaction. N50 represents the dose at which 50% of the population is expected to be infected. For E. coli, N50 and α were 2.11 × 10⁶ and 1.55 × 10⁻¹, respectively, and were used to derive β [33]. For rotavirus, N50 and α were 6.17 and 2.53 × 10⁻², respectively [33].
2.2.4. Risk Characterization
The risk characterization step integrates results from the exposure assessment and dose–response models to estimate the probability of infection for each pathogen. This final step provides overall risk estimates for both source water and treated drinking water.
For source water, daily gastroenteritis infection risks were estimated to compare them with treated drinking water and to quantify treatment effectiveness in terms of risk reduction. In addition, infection risks between source and treated drinking water were compared using log reduction values.
For treated drinking water, the daily, 30-day, 180-day, and annual gastroenteritis infection risks were calculated using Equations (2), (3) and (5):
where Pevent is the probability of infection from a single exposure event obtained in Equations (2) and (3), n is the number of exposure events, and Ptotal is the total probability of one or more infections over the entire period.
The estimated infection risks were compared against U.S. EPA’s drinking water threshold of 10−6 infections per person per day and 10−4 infections per person per year.
2.3. Log Reduction Values
Treatment performance was evaluated using daily LRVs based on the ratio of estimated infection risks between source and treated water. Although LRVs are commonly calculated from pathogen concentrations, a risk-based LRV was used in this study to quantify the reduction in estimated infection risk associated with the treatment train. Risk-based LRVs were calculated using Equation (6):
where Risk source is the estimated daily risk of infection from source water, and Risk treated is the estimated daily risk of infection after treatment. Because the dose–response relationship is applied consistently to source and treated water exposures for each pathogen, the risk-based LRV describes the reduction in estimated infection risk across the treatment train in orders of magnitude. This approach allows treatment performance to be evaluated based on the resulting reduction in health risk and facilitates comparison across pathogens and sampling conditions.
2.4. Monte Carlo Simulation
Sensitivity analyses were conducted using Monte Carlo simulations (n = 10,000) (Oracle Crystal Ball®, Austin, TX, USA) to address uncertainty and variability in pathogen concentrations, treatment performance, and infection risk estimates. Pathogen concentration distributions for source and treated water were fitted separately using the available concentration data, and the selected distributions were incorporated as stochastic assumptions in the simulations. Output metrics for exposure dose and infection risk included median values, means, and 5th–95th percentile values. Source and treated water risk distributions were compared to characterize treatment-associated reductions in estimated infection risk, which were subsequently used to calculate risk-based LRVs.
3. Results
A QMRA was performed to estimate infection risks associated with four waterborne pathogens in source water (secondary effluent) and treated drinking water using pilot-scale data from El Paso Water’s Pure Water Center. The results of the QMRA include probabilistic estimates of exposure doses, treatment performance expressed as log reduction values (LRVs), and corresponding infection risks for source water and treated drinking water.
3.1. Exposure Doses
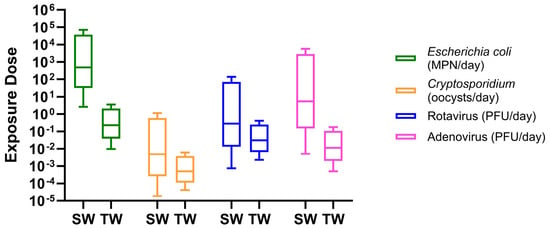
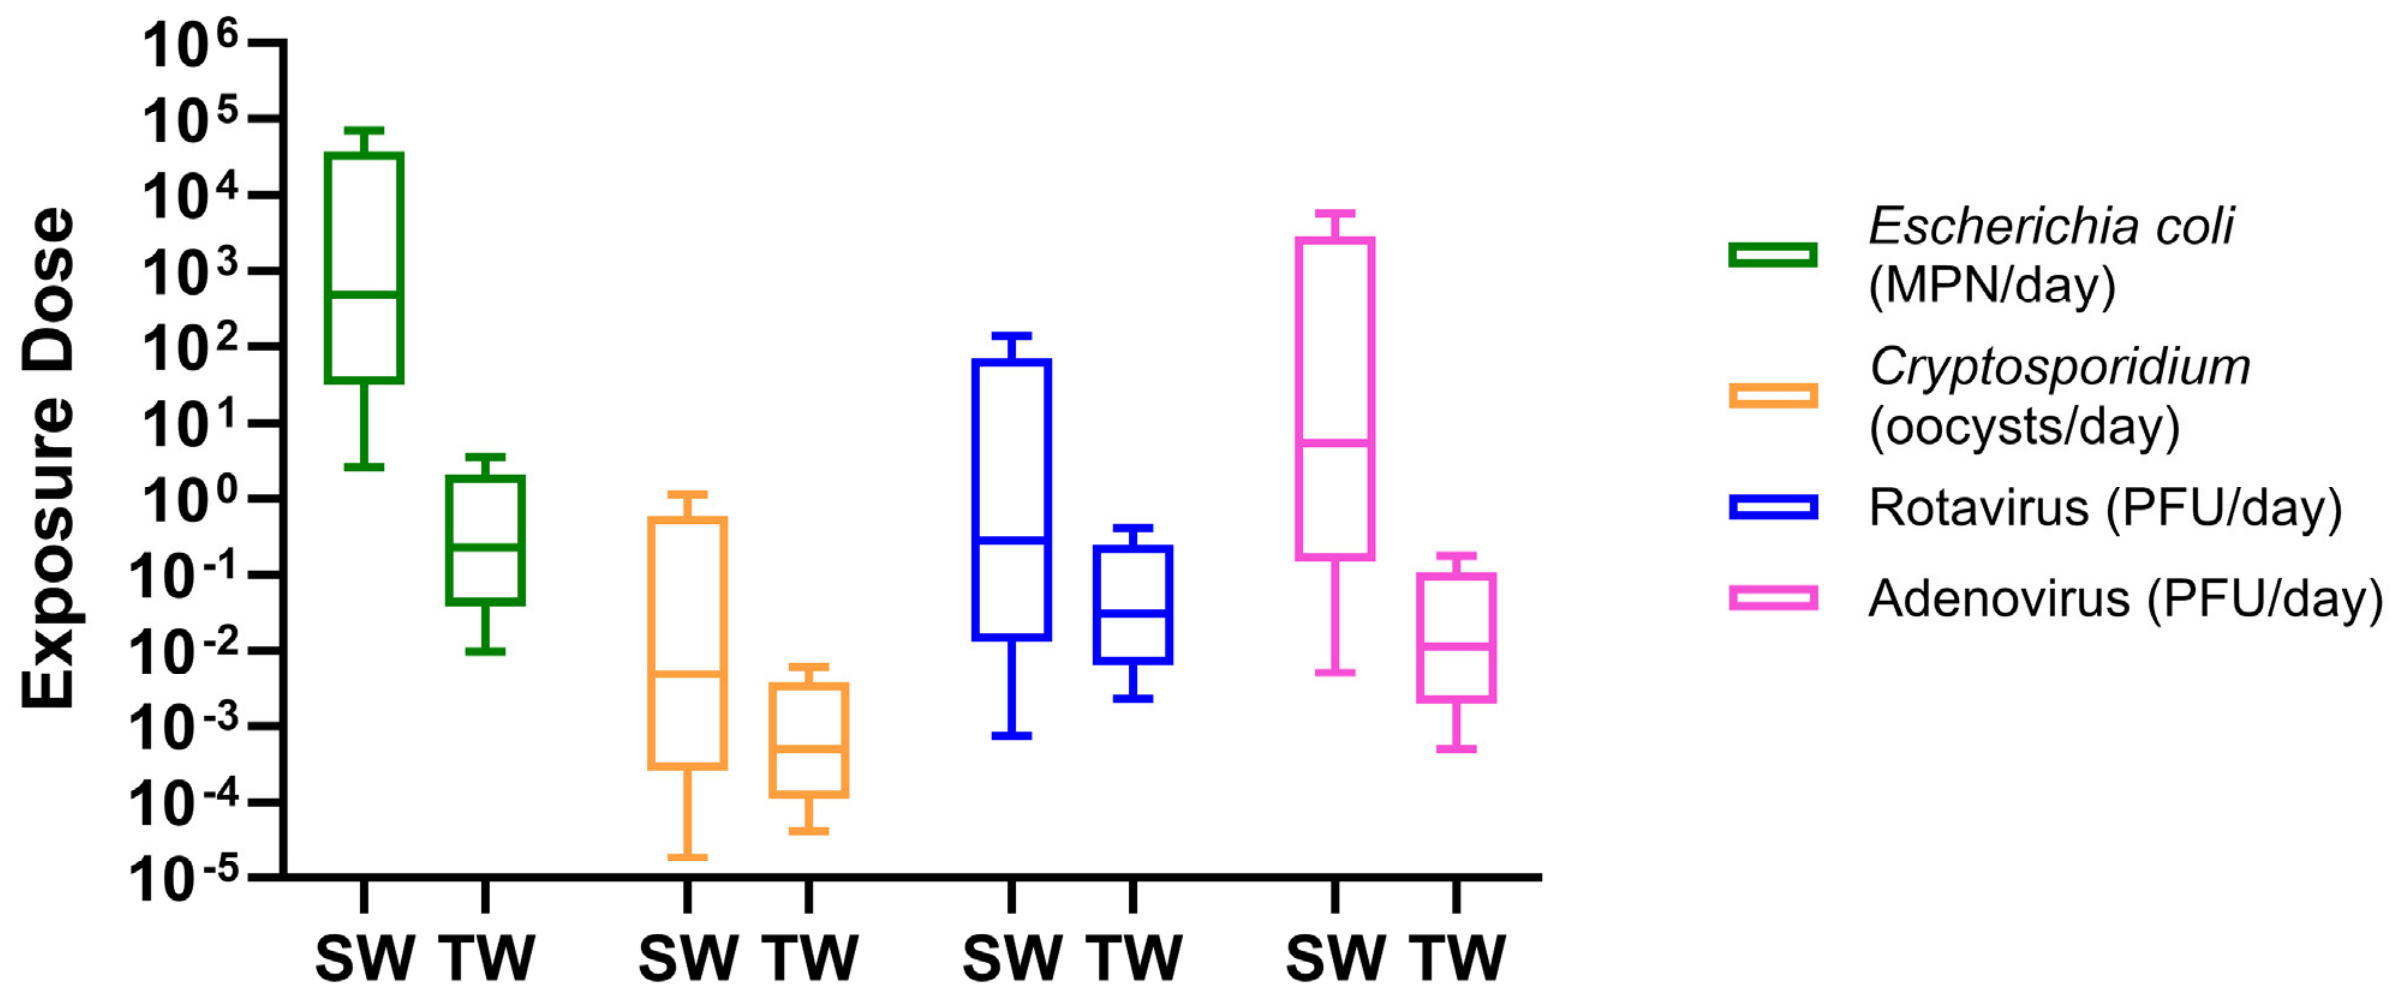
The results demonstrated significant variability in pathogen-specific exposure doses between source water and treated drinking water across all microbial groups (Figure 3).
Figure 3.
Box plots of simulated daily exposure doses for E. coli, Cryptosporidium, rotavirus, and adenovirus in source water (SW) and treated drinking water (TW). Boxes represent interquartile ranges, with medians and whiskers indicating distribution spread.
For E. coli, the source water dose had a median of 4.86 × 10² MPN/day, whereas the median dose in treated water decreased to 2.28 × 10⁻¹ MPN/day, indicating effective bacterial reduction across the treatment train. Similarly, for Cryptosporidium, the median dose decreased from 4.88 × 10⁻³ oocysts/day in source water to 4.99 × 10⁻⁴ oocysts/day in treated drinking water, indicating a modest reduction in exposure following treatment. For rotavirus, the median exposure dose decreased from 2.81 × 10⁻¹ PFU/day in source water to 3.06 × 10⁻² PFU/day in treated water, indicating a consistent but moderate reduction in viral exposure across the treatment train. Similarly, adenovirus demonstrated a significant reduction in median exposure dose, decreasing from 5.46 PFU/day in source water to 1.15 × 10⁻² PFU/day in treated drinking water.
Overall, exposure doses decreased following treatment for all evaluated pathogens. However, the magnitude of reduction varied by microbial group, with the largest decrease observed for E. coli, and comparatively smaller reductions observed for protozoan and viral pathogens. Exposure dose results, including medians, means, and 5th and 95th percentiles, are summarized in Table S1.
3.2. Infection Risk Estimates
Results are reported as median values with corresponding 5th–95th percentile ranges to characterize variability and uncertainty.
3.2.1. Daily Risks of Infection
Estimated daily infection risks varied significantly across pathogens and between source water (secondary effluent) and treated drinking water. Daily infection risks were compared to the U.S. EPA benchmark of 10−6 infections per person per day.
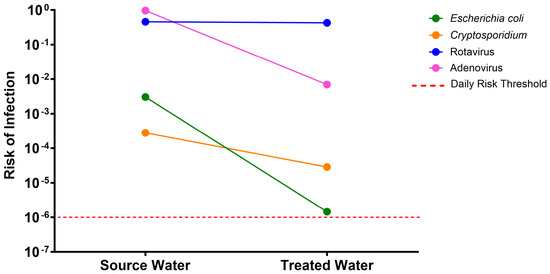
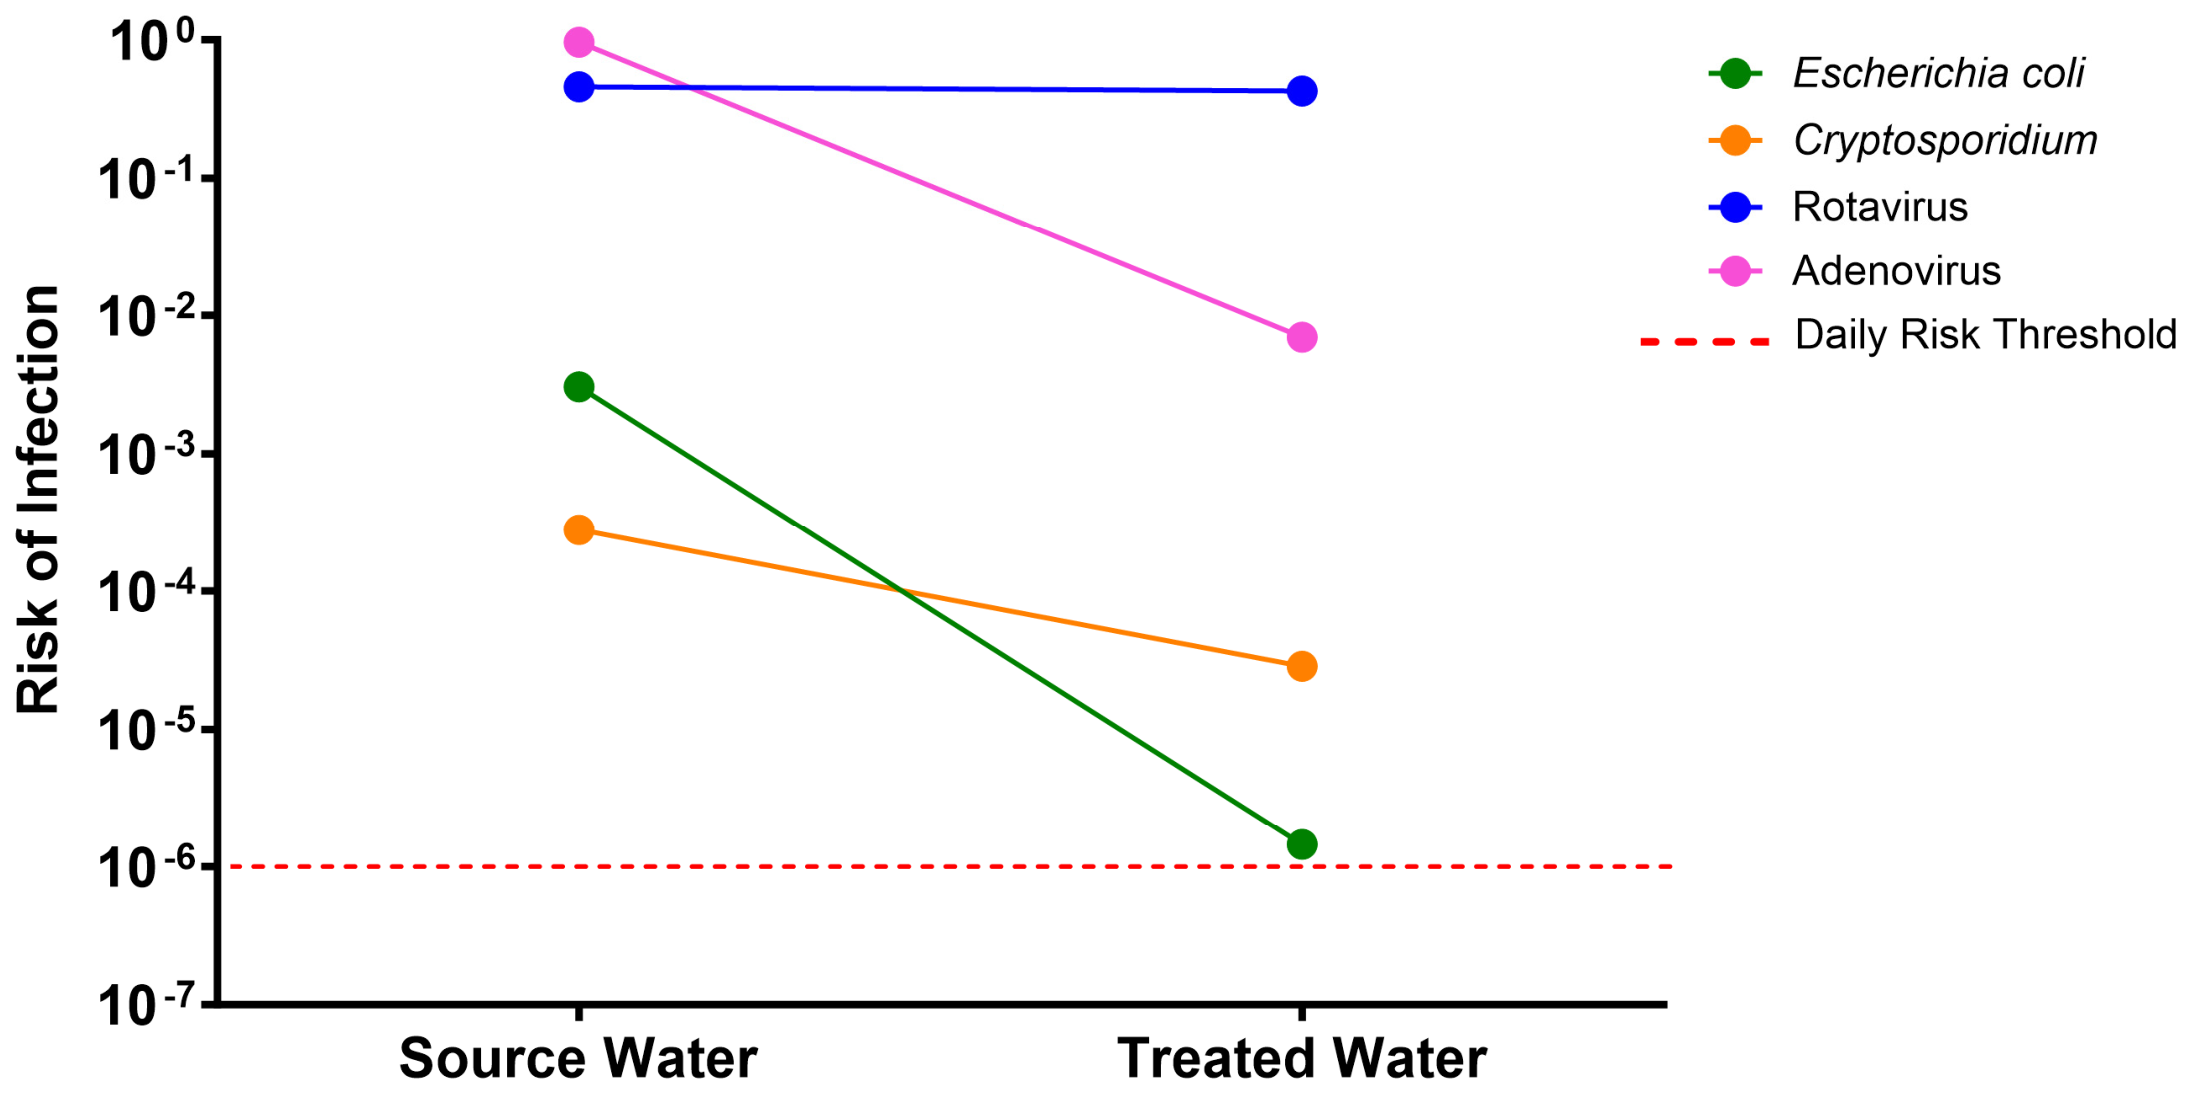
For E. coli, the source water daily infection risk had a median of 3.05 × 10⁻³ (µ = 3.32 × 10⁻²), decreasing to 1.45 × 10⁻⁶ (µ = 5.79 × 10⁻⁶) following treatment. This indicates a significant reduction in infection risk, with treated water risks approaching the U.S. EPA risk threshold level. These results are summarized in Table S2. Likewise, for Cryptosporidium, the median daily infection risk decreased from 2.79 × 10⁻⁴ (µ = 1.65 × 10⁻²) in source water to 2.85 × 10⁻⁵ (µ = 9.07 × 10⁻⁵) in treated drinking water; however, despite this reduction, estimated infection risks remained above the U.S. EPA risk threshold level by one order of magnitude. These results are summarized in Table S3. Viral pathogens demonstrated minimal reductions in daily infection risks. For rotavirus, source water daily risk had a median of 4.59 × 10⁻¹ (µ = 4.58 × 10⁻¹), and treated water risk remained similar at a median of 4.28 × 10⁻¹ (µ = 4.28 × 10⁻¹), indicating almost no reduction following treatment. Similarly, adenovirus source water risk was high, with a median of 9.64 × 10⁻¹ (µ = 6.50 × 10⁻¹), while treated water daily risk decreased to a median of 6.98 × 10⁻³ (µ = 2.43 × 10⁻²). This indicates a substantial reduction in the estimated daily infection risk; however, still above the U.S. EPA risk threshold by three orders of magnitude. The results are summarized in Tables S4 and S5. Daily infection risks for all pathogens are shown in Figure 4.
Figure 4.
Daily infection risk for source and treated drinking water across E. coli, Cryptosporidium, rotavirus, and adenovirus, showing reductions following treatment. The U.S. EPA daily risk threshold of 10−6 infections per person per day is represented by the red dashed line.
Overall, bacterial and protozoan risks decreased following treatment, whereas viral pathogens demonstrated higher residual risks, with rotavirus remaining constant and adenovirus demonstrating a substantial reduction after treatment.
3.2.2. Annual Risks of Infection
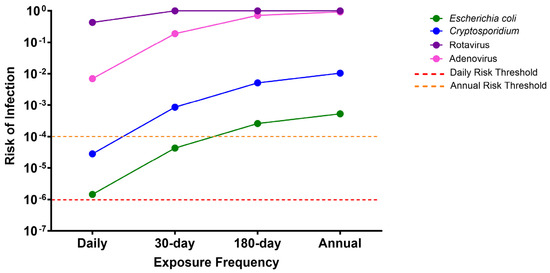
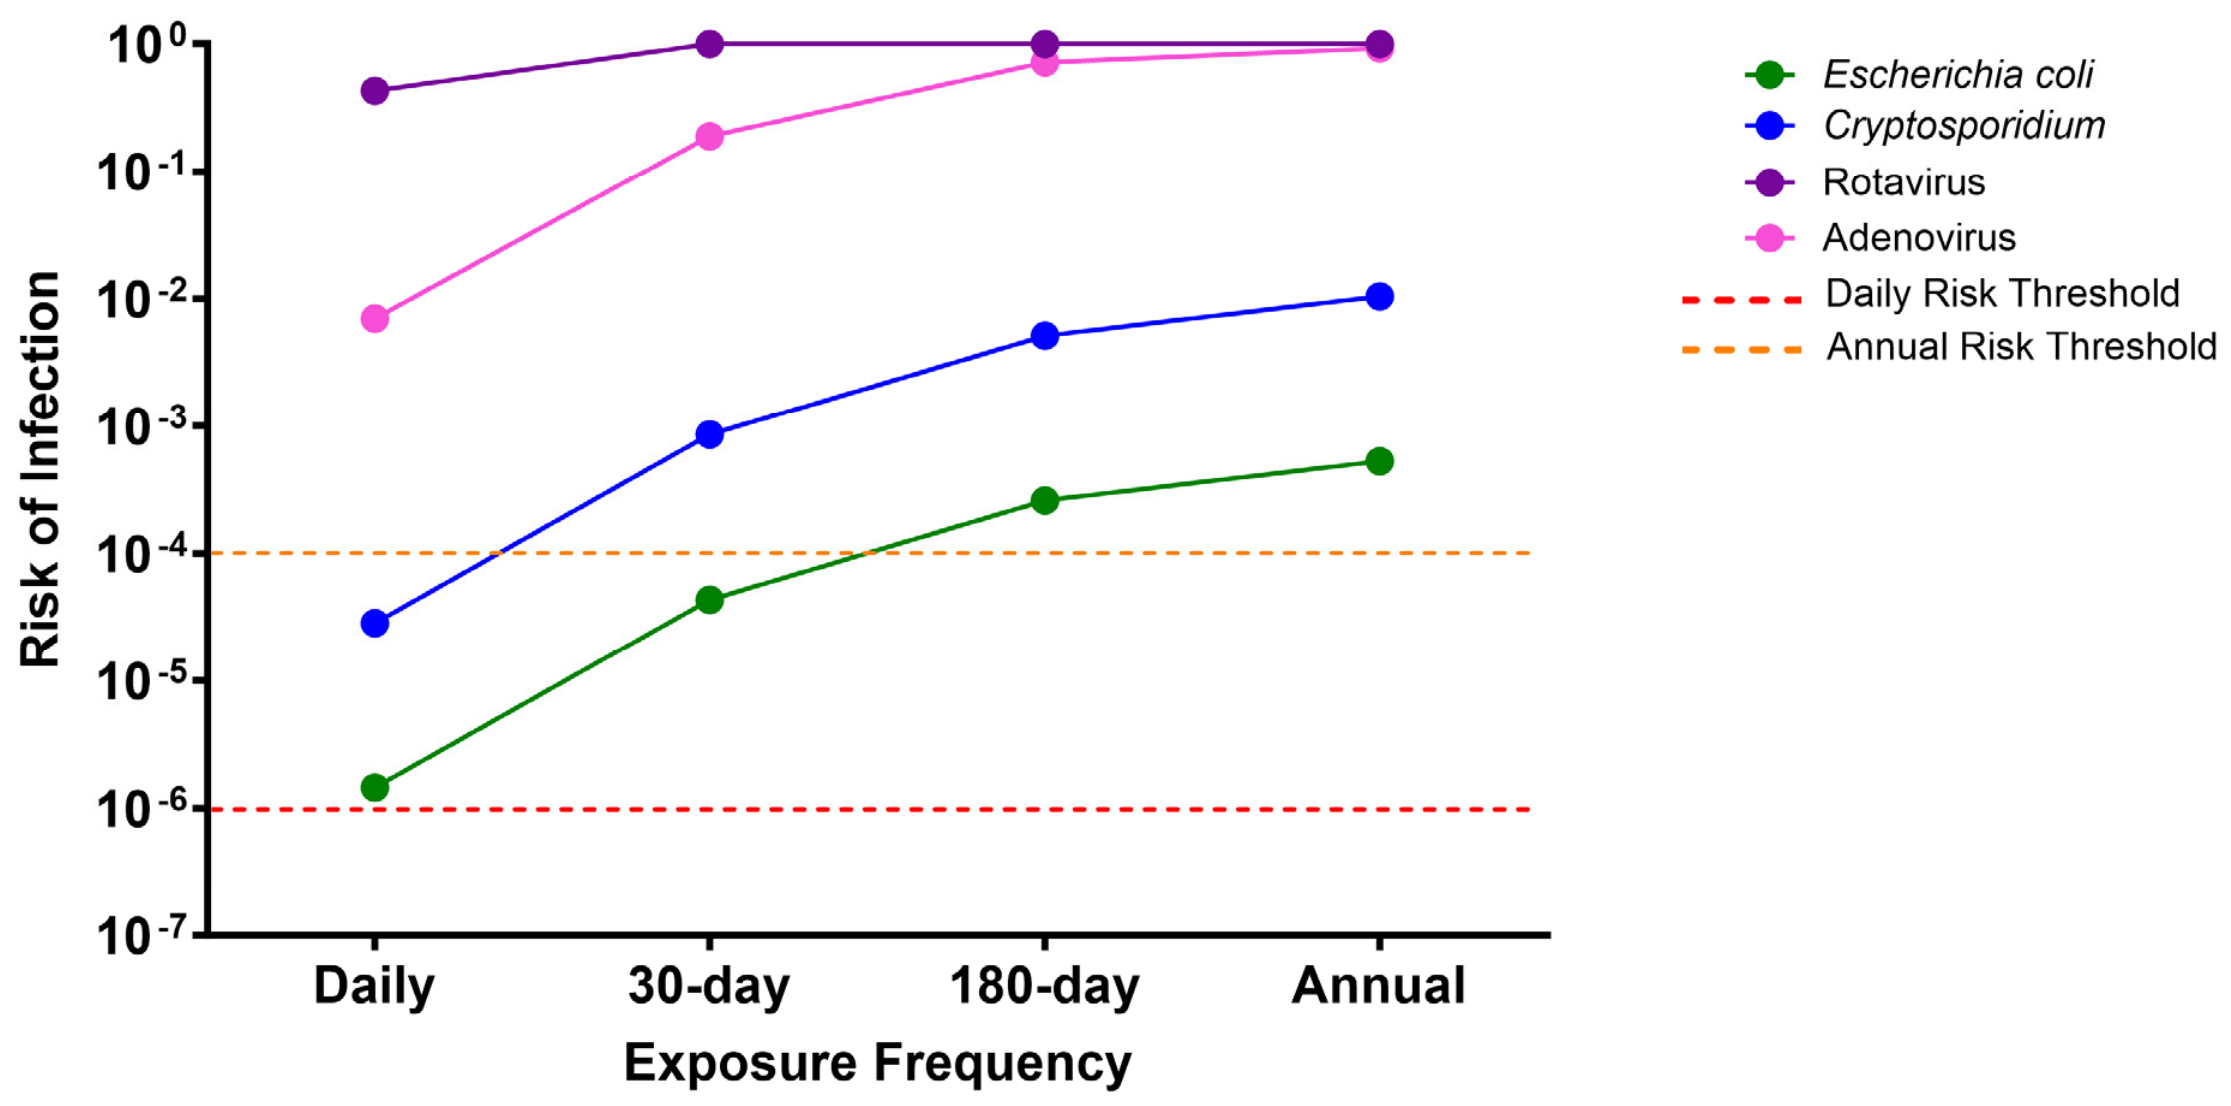
Cumulative infection risks for treated drinking water were evaluated over 30-day, 180-day, and annual exposure periods and compared to the U.S. EPA’s annual risk threshold of 10−4 infections per person per year. The cumulative infection risks for all four pathogens are presented in Figure 5.
Figure 5.
Cumulative infection risks in treated water for E. coli, Cryptosporidium, rotavirus, and adenovirus over different exposure periods. The 10−4 and 10−6 lines represent the U.S. EPA annual and daily infection risk threshold, respectively (10−4 infections per person per year and 10−6 infections per person per day).
For E. coli, cumulative infection risk increased from a median of 4.34 × 10⁻⁵ (µ = 1.73 × 10⁻⁴) over 30 days to 2.60 × 10⁻⁴ (µ = 1.04 × 10⁻³) over 180 days, and 5.28 × 10⁻⁴ (µ = 2.09 × 10⁻³) annually. The 180-day and annual risks slightly exceeded the U.S. EPA risk threshold, indicating accumulation of exposure over time despite low daily risk levels. These results are summarized in Table S2.
For Cryptosporidium, cumulative risks increased from a median of 8.56 × 10⁻⁴ (µ = 2.69 × 10⁻³) over 30 days to 5.13 × 10⁻³ (µ = 1.54 × 10⁻²) over 180 days, and 1.04 × 10⁻² (µ = 2.97 × 10⁻²) annually. These risk estimates exceeded the U.S. EPA risk threshold by approximately two orders of magnitude, indicating persistent risk over extended exposure periods. These results are summarized in Table S3.
Viral pathogens demonstrated consistently high cumulative infection risks. For rotavirus, cumulative risks showed median and mean values of 9.99 × 10⁻¹ across 30-day, 180-day, and annual exposures, indicating a high probability of infection under the modeled conditions and significantly exceeding the U.S. EPA risk threshold by several orders of magnitude. For adenovirus, cumulative infection risk increased over time, with a median of 1.89 × 10⁻¹ (µ = 3.07 × 10⁻¹) over 30 days, 7.16 × 10⁻¹ (µ = 6.35 × 10⁻¹) over 180 days, and 9.22 × 10⁻¹ (µ = 7.52 × 10⁻¹) annually. These results indicate a high probability of infection over extended exposure periods and are summarized in Tables S4 and S5.
Overall, cumulative infection risks increased with exposure duration for all pathogens, with bacterial and protozoan risks remaining lower in magnitude relative to viral pathogens, which demonstrated the highest estimated probability of infection over time, particularly rotavirus. However, these results should be interpreted in the context of substantial limitations in the viral concentration data.
3.3. Advanced Water Purification (AWP) Water Treatment Train Performance
Treatment performance was evaluated using LRVs derived from daily infection risks between source and treated drinking water, as shown in Equation (6). This provided a risk-based measure of overall treatment effectiveness across the AWP treatment train.
The treatment train achieved a significant reduction in daily infection risk associated with E. coli, with a median LRV of 3.32 (µ = 3.28), indicating effective bacterial removal. This LRV indicates a substantial reduction in estimated infection risk and is consistent with expected performance ranges for multi-barrier treatment systems, where bacterial removal typically exceeds 3-log reduction [35,36].
For Cryptosporidium, the median log reduction was 0.976 (µ = 0.974), indicating a limited reduction in daily infection risk across the treatment train. This level of removal is lower than typical performance targets reported for advanced potable reuse systems, where protozoan reductions on the order of 2–3 log are generally expected under multi-barrier treatment systems [35,36]. The log reduction observed in this study was lower than typical performance targets reported for advanced potable reuse systems and suggests lower estimated treatment performance for protozoan pathogens under the evaluated conditions. Higher log reductions are generally targeted in advanced potable reuse systems to provide an additional safety margin and improve reliability under variable operating conditions.
Viral pathogens demonstrated lower overall reductions in estimated infection risk. Rotavirus showed a median LRV of 3.13 × 10⁻² (µ = 2.76 × 10⁻²), demonstrating a minimal reduction in infection risk following treatment. Adenovirus demonstrated a median log reduction of 1.72 (µ = 1.65), indicating a low reduction in infection risk. These values are below the virus removal targets commonly associated with advanced potable reuse systems, where viral reductions are of approximately 3–6 log [35,37,38]. However, the estimated viral reductions should be interpreted with caution due to the substantial proportion of missing and substituted viral concentration data, particularly for rotavirus and adenovirus. Thus, the lower reductions should not be interpreted as definitive evidence of inadequate viral treatment, as they may reflect both treatment performance and uncertainty associated with the limited viral concentration data. In addition, adenovirus is known for its high resistance to UV light disinfection, which may contribute to the observed lower log reductions in this study [35,37]. Additional monitoring would be needed to better characterize viral treatment performance and determine whether the observed reductions consistently meet treatment targets.
In late 2024, the TCEQ granted final design approval for the Pure Water Center, allowing construction of the facility to proceed [39]. Because TCEQ evaluates DPR projects using site-specific, risk-based treatment requirements, the estimated LRVs in this study provide additional context for evaluating the microbial risk reduction achieved by the Pure Water Center AWP pilot treatment train. The present analysis provides an independent QMRA-based assessment of treatment performance using the available pathogen concentration data and estimated infection risks. However, the LRVs estimated in this study should not be interpreted as a determination of regulatory compliance or as replacing TCEQ’s final design approval, which was based on a regulatory review of the overall project design and treatment approach.
Overall, treatment performance varied across microbial groups, with the highest risk reduction observed for E. coli, limited reduction for Cryptosporidium, and minimal reduction for viral pathogens. These findings provide an independent QMRA-based assessment of microbial risk reduction under the evaluated conditions and highlight the importance of multiple disinfection barriers and system redundancy in potable reuse applications.
4. Discussion
4.1. Microbial Risk and Treatment Performance
This study applied QMRA to evaluate microbial infection risks associated with a direct potable reuse system using pilot-scale data from El Paso Water’s Pure Water Center. The probabilistic results demonstrated significant variability in pathogen-specific treatment performance and infection risks across sampling events and microbial groups. Overall, the treatment train system demonstrated greater effectiveness in reducing bacterial risks than protozoan and viral risks, indicating differences in pathogen resistance, infectivity, and treatment susceptibility.
The largest reductions were observed for E. coli, which showed significant reductions in exposure dose, daily infection risk, and log reduction values following treatment. The findings are consistent with previous potable reuse and QMRA studies reporting effective bacterial removal through advanced membrane filtration and disinfection processes. Studies by Hai et al. (2014) and Nasir et al. (2022) demonstrated that advanced water treatment trains that include membrane filtration, reverse osmosis, and disinfection can achieve significant reductions in bacterial indicators and microbial risks [40,41]. Even though Cryptosporidium showed limited reduction in daily infection risk and low log reduction values following treatment, the probabilistic analysis indicated measurable reductions between source water and treated water risks despite variability across sampling events. However, the observed limited reductions are also consistent with findings reported by Burke et al. (2025), which demonstrated that membrane-based advanced treatment systems for Cryptosporidium removal can vary depending on operational conditions and monitoring uncertainty [42]. To further contextualize the quantitative findings from this study, Table 2 summarizes reported microbial risk estimates and treatment performance metrics from previous QMRA studies evaluating potable reuse and advanced water treatment systems.
Table 2.
Comparison of QMRA studies evaluating potable reuse systems and advanced water treatment performance.
Although this study demonstrated reductions in bacterial and protozoan risks, the estimated treated water infection risks remained above the U.S. EPA drinking water risk thresholds under the modeled exposure conditions. However, these findings do not necessarily indicate inadequate treatment performance. Rather, they highlight the sensitivity of QMRA outcomes to input assumptions, including pathogen concentrations, limited data, treatment variability, and dose–response parameters. The probabilistic QMRA framework further demonstrated that variability and uncertainty can significantly affect risk estimates, particularly when treatment performance varies across sampling events.
4.2. Regulatory Context and Implications for DPR
The estimated treatment performance can also be considered in the context of current state-level DPR regulatory and guidance frameworks. California’s Direct Potable Reuse regulations, effective October 2024, establish pathogen-specific treatment requirements of 10-log reduction for enteric viruses, 14-log reduction for Giardia lamblia, and 15-log reduction for Cryptosporidium, together with requirements for multiple treatment processes and diverse treatment mechanisms [46]. The California framework also requires continuous achievement of lower pathogen reduction levels of 16-log, 10-log, and 11-log, respectively, while the higher 20/14/15-log targets must be achieved for at least 90% of the time that the treatment train produces water during a calendar month [46]. In Texas, TCEQ’s DPR guidance similarly emphasizes pathogen-specific treatment requirements and treatment reliability, with the amount of treatment required determined using site-specific source water pathogen concentrations and acceptable finished water pathogen levels [47]. These regulatory frameworks provide important context for interpreting the pathogen-specific LRVs estimated in this study. Because the LRVs calculated in this study are risk-based estimates, they should be viewed as complementary information on treatment performance rather than as regulatory treatment credits or direct evidence of compliance with state-specific requirements. This distinction is particularly important for interpreting the relatively lower viral and Cryptosporidium reductions observed in this study, as regulatory treatment frameworks incorporate pathogen-specific treatment barriers, process validation, and operational monitoring beyond risk-based estimates alone.
The differences in estimated treatment performance among microbial groups likely reflect differences in pathogen characteristics and susceptibility to the treatment barriers evaluated. The greater reductions observed for E. coli are consistent with the susceptibility of bacterial cells to the combined effects of membrane treatment and downstream disinfection processes [41]. In contrast, the viral pathogens showed comparatively low LRVs and limited risk reductions between source and treated water, with rotavirus remaining largely unchanged. Viruses are substantially smaller than bacteria and may therefore be more difficult to remove through some physical treatment processes, while their susceptibility to inactivation varies by virus and treatment conditions. This is consistent with previous studies demonstrating that enteric viruses remain among the most challenging pathogens to control in potable water reuse. Studies by Wigginton et al. (2012) and Sobsey et al. (2003) demonstrated that enteric viruses, particularly adenovirus, exhibit resistance to UV light disinfection and may persist in advanced water treatment systems [48,49]. Similarly, Haas et al. (2014) emphasize that viral pathogens frequently drive QMRA-derived infection risks due to their high infectivity and greater resistance to treatment compared to bacteria and protozoa [17].
Although Cryptosporidium demonstrated greater reductions than viral pathogens, its reduction was limited and may reflect variability in pathogen concentrations, uncertainty associated with the available data, and the characteristics of the treatment process. These findings highlight the importance of designing DPR systems as redundant, multibarrier treatment trains that include complementary removal and inactivation mechanisms rather than relying on a single treatment process. Operational monitoring and treatment redundancy are particularly important for maintaining reliable microbial risk reduction under variable source water conditions. However, the pathogen-specific differences observed in this study should be interpreted in the context of the data limitations and the specific pilot-scale treatment configuration evaluated.
4.3. Data Limitations and Uncertainty in Risk Estimates
A key limitation in this study was the amount of non-detect and non-sampled values in the dataset, which varied significantly across pathogens and sampling points. In this study, non-detects refer to measurements collected but reported below the analytical detection limit, while non-sampled values refer to sampling events where no measurements were available. For E. coli, missing data accounted for 13% in source water and 1.3% across the treatment train, demonstrating a relatively complete coverage for bacterial values. In contrast, Cryptosporidium demonstrated approximately 47% missing data in source water samples. Greater data gaps were observed for viral pathogens. Rotavirus demonstrated 59% missing data in source water and 90% in the treatment train, while adenovirus showed 36% missing data in source water and a complete absence in treated water samples. To address these gaps, a substitution approach using one-half the detection limit was used for both non-detect and not-sampled values to provide a defined concentration estimate for the exposure assessment. However, this approach introduces potential bias, particularly when detection frequency is low or data are substantially incomplete. Substitution approaches can increase estimated concentrations or reduce variability, as discussed by Helsel (2012) [50]. The high proportion of substituted values and limited viral observations likely decreased variability in the fitted concentration distributions and influenced the resulting risk estimates. Consequently, the estimated viral risks of infection may be subject to substantial uncertainty and may be overestimated or underestimated. Therefore, the elevated viral risk estimates observed in this study should not be interpreted as definitive evidence of treatment inefficiency or inadequate treatment performance. Rather, these estimates reflect the combined influence of treatment performance and uncertainty associated with the limited viral concentration data and the high proportion of substituted values. The interpretation of viral LRVs is also influenced by the analytical detection limits and the assumptions used to process non-detect observations. Because many viral concentrations were below the detection limit and were substituted using one-half the MDL, the resulting source and treated water concentration distributions, and therefore the estimated infection risks and LRVs, may be influenced by these assumptions. Additional viral monitoring and more complete treatment performance data are needed to better characterize viral risk reduction in the treatment system.
Given these limitations, the findings highlight the importance of appropriately addressing uncertainty in DPR monitoring frameworks. Data gaps in viral and protozoan pathogen values in water reuse monitoring should be considered for DPR policies, as non-detects and non-sampled values represent different sources of data limitation but can have similar implications for exposure assessment. These could include regulations requiring minimum monitoring frequencies for priority pathogens, such as enteric viruses and Cryptosporidium, to reduce reliance on imputation and improve data completeness. In addition, when data gaps or non-detects predominate, guidance could support the use of conservative default assumptions for source water concentrations and LRVs that are well-established as protective of public health. Incorporating these types of measures would help ensure that risk estimates remain robust under conditions of limited monitoring data and reduce the likelihood that uncertainty in the dataset drives the observed risk outcomes, rather than true treatment performance.
4.4. Scope, Applicability, and Operational Considerations
The scope of this study was to evaluate microbial infection risks associated with the ingestion of source water and treated drinking water from the Pure Water Center pilot AWP treatment train using available 2016 pilot-scale pathogen concentration data. Although the risk estimates and pathogen-specific LRVs are specific to the treatment train, source water characteristics, available pathogen concentration data, and exposure assumptions evaluated in this study, the broader findings have applicability to other potable reuse systems. In particular, this study demonstrates the value of a QMRA framework for evaluating pathogen-specific treatment performance, characterizing variability and uncertainty, and assessing how data limitations can influence estimated infection risks. These principles can be applied to other potable reuse systems, although specific risk estimates and treatment performance results should be evaluated using site-specific pathogen occurrence, treatment performance, exposure, and dose–response data. Therefore, the findings provide both a site-specific assessment of the Pure Water Center treatment train and broader insight into the application of QMRA to evaluate microbial risks and uncertainty in potable reuse systems. The same general QMRA framework could also be adapted to other water reuse configurations and intended end uses. However, the exposure assessment would need to be modified to reflect the relevant exposure pathways for each application, rather than the direct ingestion pathway evaluated in this study. Similarly, pathogen occurrence data, treatment performance, dose–response relationships, and exposure assumptions would need to be tailored to the specific source water, treatment system, and intended end use.
The study’s findings are especially relevant for arid and water-stressed regions such as El Paso, where long-term water supply sustainability increasingly relies on potable reuse strategies. Located within the Chihuahuan Desert, El Paso experiences persistent drought, declining river flow, and growing water demand driven by population growth and climate variability. Therefore, advanced potable reuse plays a critical role in enhancing regional water resilience and diversifying supply sources. The results highlight the importance of multi-barrier treatment strategies and comprehensive microbial monitoring to ensure public health protection in direct potable reuse applications. Additionally, the study demonstrates the value of QMRA for evaluating uncertainty and variability in advanced treatment performance.
The observed pathogen reductions should be interpreted within the context of the pilot facility, where the treatment reliability is derived from the cumulative performance of the treatment train rather than any individual process. Finally, it should be noted that DPR performance is influenced not only by treatment effectiveness but also by long-term operational stability, source water control, and compliance with applicable regulatory requirements. Long-term operation of advanced potable reuse systems may involve temporary interruptions or reductions in treatment performance due to equipment failure, membrane integrity loss, disinfection interruptions, maintenance activities, or other operational disturbances. These events highlight the importance of treatment redundancy, continuous process monitoring, automatic diversion and shutdown mechanisms, and validated recovery procedures to prevent off-specification water from reaching the distribution system [44]. Accordingly, the treatment performance observed during the pilot evaluation represents performance under the evaluated operating conditions and should not be interpreted as evidence that treatment performance remains constant under all long-term operational scenarios.
One approach to managing the potential effects of temporary treatment disruptions is to maintain additional treatment capacity, or an operational safety margin, during normal conditions. Designing treatment systems to achieve LRVs above the minimum health-based targets can provide additional protection against temporary reductions in treatment performance and help maintain overall pathogen risk reduction during operational disturbances [44]. However, the appropriate magnitude of this additional margin should be determined using site-specific pathogen occurrence data, treatment performance variability, failure scenarios, and regulatory targets. The risk-based QMRA framework used in this study can support such evaluations by examining whether treatment performance under normal and disrupted operating conditions remains sufficient to achieve health-based risk targets.
4.5. Future Research Directions
Future studies should prioritize long-term and higher-frequency monitoring of viral and protozoan pathogens across multiple treatment stages to improve characterization of pathogen occurrence and treatment performance. Additional research should also evaluate treatment disruptions and operational failure scenarios using QMRA to determine the treatment performance margins needed to maintain health-based targets under non-ideal conditions. Applying the framework to additional potable reuse systems and alternative water reuse configurations would further support evaluation of how site-specific source water characteristics, treatment processes, exposure pathways, and operational conditions influence microbial health risks.
The treatment train evaluated in this study incorporated multiple advanced treatment barriers, including membrane filtration, UV Advanced Oxidation Process (AOP), and GAC processes consistent with modern DPR multi-barrier principles. The observed pathogen reductions and QMRA results therefore provide insight into the effectiveness of integrated advanced treatment systems designed to support potable reuse. Although advanced technologies have demonstrated the capability to achieve substantial microbial risk reduction, continued attention to monitoring, operational verification, source control, and treatment resilience remains critical. Collectively, these results support the use of QMRA as a scientifically defensible and adaptable framework for evaluating pathogen-specific risks, treatment performance, and uncertainty in potable reuse systems. While the risk estimates and pathogen-specific LRVs are site-specific to the conditions evaluated in this study, the results demonstrate how QMRA can be used to assess treatment performance, identify the influence of data limitations, and characterize uncertainty in microbial risk estimates. These findings highlight the broader value of QMRA for supporting risk-based evaluation of potable reuse systems when appropriate site-specific data are available.
Supplementary Materials
The following supporting information can be downloaded at https://www.mdpi.com/article/10.3390/pollutants6030046/s1. Table S1: Daily Exposure Doses. Table S2: Risks of Infection Associated with Escherichia coli. Table S3: Risks of Infection Associated with Cryptosporidium. Table S4: Risks of Infection Associated with Rotavirus. Table S5: Risks of Infection Associated with Adenovirus.
Author Contributions
Conceptualization, K.S.M. and K.D.M.; methodology, K.S.M. and K.D.M.; validation, K.S.M., K.D.M. and A.G.; formal analysis, K.S.M.; investigation, K.S.M.; data curation, K.S.M.; writing—original draft preparation, K.S.M.; writing—review and editing, K.S.M., K.D.M., A.G. and E.D.; visualization, K.S.M., A.G. and E.D.; supervision, K.D.M.; project administration, K.D.M. All authors have read and agreed to the published version of the manuscript.
Funding
This research received no external funding.
Data Availability Statement
The datasets used in this study are not publicly available due to institutional restrictions associated with pilot-scale facility data.
Acknowledgments
The authors acknowledge El Paso Water for providing access to pilot-scale treatment facility data used in this study.
Conflicts of Interest
The authors declare no conflicts of interest.
Abbreviations
The following abbreviations are used in this manuscript:
| QMRA | Quantitative microbial risk assessment |
| LRVs | Log reduction values |
| DPR | Direct potable reuse |
| AWP | Advanced water purification |
| MF | Membrane filtration |
| UF | Ultrafiltration |
| NF | Nanofiltration |
| RO | Reverse osmosis |
| UV | Ultraviolet |
| GAC | Granular activated carbon |
| E. coli | Escherichia coli |
| MDL | Method detection limit |
| EPA | Environmental Protection Agency |
| MPN | Most probable number |
| PFU | Plaque-forming unit |
| GC | Genomic copies |
| CAMRA | Center for Advancing Microbial Risk Assessment |
| AOP | Advanced oxidation process |
| IPR | Indirect potable reuse |
References
- Mekonnen, M.M.; Hoekstra, A.Y. Four billion people facing severe water scarcity. Sci. Adv. 2016, 2, e1500323. [Google Scholar] [CrossRef] [Scilit]
- United Nations University Institute for Water, Environment and Health (UNU-INWEH). UN: Invest I Nature to Cut Billion-Dollar Costs of Droughts. 2024. Available online: https://unu.edu/inweh/news/un-invest-nature-cut-billion-dollar-costs-droughts (accessed on 10 April 2026).
- Felter, C.; Robinson, K. Water Stress: A Global Problem That’s Getting Worse. Council on Foreign Relations, 22 April 2021. Available online: https://www.cfr.org/backgrounders/water-stress-global-problem-thats-getting-worse (accessed on 10 April 2026).
- Flint, C.G.; Koci, K.R. Local resident perceptions of water reuse in Northern Utah. Water Environ. Res. 2021, 93, 123–135. [Google Scholar] [CrossRef] [Scilit]
- El Paso Water. Rio Grande and Elephant Butte. Available online: https://www.epwater.org/our-water/water-resources/rio-grande-and-elephant-butte (accessed on 30 August 2021).
- Pskowski, M. Facing Drought and Low Snowpack, Rio Grande States Expect a ‘Challenging’ Year. Inside Climate News, 20 April 2026. Available online: https://insideclimatenews.org/news/20042026/rio-grande-compact-meeting-low-river-flows/ (accessed on 2 May 2026).
- Douglas-Mankin, K.R.; Rumsey, C.A.; Sexstone, G.A.; Ivahnenko, T.I.; Houston, N.; Chavarria, S.B.; Senay, G.B.; Foster, L.K.; Thomas, J.V.; Flickinger, A.K.; et al. Upper Rio Grande Basin water-resource status and trends: Focus area study review and synthesis. J. Am. Soc. Agric. Biol. Eng. 2022, 65, 881–901. [Google Scholar] [CrossRef] [Scilit]
- Rango, A.; Steele, C.M.; Havstad, K.M.; Vivoni, E.R.; Gutzler, D.S. Covariability of climate and streamflow in the Upper Rio Grande from interannual to interdecadal timescales. J. Hydrol. Reg. Stud. 2017, 13, 58–71. [Google Scholar] [CrossRef] [Scilit]
- WateReuse Association. El Paso Water Breaks Ground on Direct Potable Reuse Facility. WateReuse Association, 8 May 2025. Available online: https://watereuse.org/el-paso-water-breaks-ground-on-direct-potable-reuse-facility/ (accessed on 2 May 2026).
- El Paso Water. Pure Water Center. El Paso Water. Available online: https://www.epwater.org/our-water/water-resources/pure-water-center (accessed on 2 May 2026).
- Di Giovanni, G.D. Pathogens in Rio Grande River Water; Texas A&M AgriLife Research Center: El Paso, TX, USA, 2018; Available online: https://agrilife.org/elpaso/files/2018/08/GD-Pathogens-in-Rio-Grande-River-Water.pdf (accessed on 11 July 2021).
- Chaudhry, R.M.; Hamilton, K.A.; Haas, C.N.; Nelson, K.L. Drivers of Microbial Risk for Direct Potable Reuse and de Facto Reuse Treatment Schemes: The Impacts of Source Water Quality and Blending. Int. J. Environ. Res. Public Health 2017, 14, 635. [Google Scholar] [CrossRef] [Scilit]
- WHO. Assessing Microbial Safety of Drinking Water: Improving Approaches and Methods, 1st ed.; Dufour, A., Ed.; IWA Publishing: London, UK, 2003. [Google Scholar]
- Nappier, S.P.; Soller, J.A.; Eftim, S.E. Potable Water Reuse: What Are the Microbiological Risks? Curr. Environ. Health Rep. 2018, 5, 283–292. [Google Scholar] [CrossRef] [Scilit]
- World Health Organization. Quantitative Microbial Risk Assessment: Application for Water Safety Management; World Health Organization: Geneva, Switzerland, 2016; Available online: https://iris.who.int/handle/10665/246195 (accessed on 2 May 2026).
- Gerba, C.P. Risk Assessment. In Environmental Microbiology, 3rd ed.; Elsevier Inc.: Amsterdam, The Netherlands, 2015; pp. 565–579. [Google Scholar] [CrossRef] [Scilit]
- Haas, C.N.; Rose, J.B.; Gerba, C.P. Quantitative Microbial Risk Assessment, 2nd ed.; Wiley: Hoboken, NJ, USA, 2014. [Google Scholar]
- Clements, E.; van der Nagel, C.; Crank, K.; Hannoun, D.; Gerrity, D. Review of quantitative microbial risk assessments for potable water reuse. Environ. Sci. Water Res. Technol. 2025, 11, 542–559. [Google Scholar] [CrossRef] [Scilit]
- Zhiteneva, V.; Hübner, U.; Medema, G.J.; Drewes, J.E. Trends in conducting quantitative microbial risk assessments for water reuse systems: A review. Microb. Risk Anal. 2020, 16, 100132. [Google Scholar] [CrossRef] [Scilit]
- Steinle-Darling, E. The Many Faces of DPR in Texas. J. Am. Water Works Assoc. 2015, 107, 16–20. [Google Scholar] [CrossRef] [Scilit]
- Gerrity, D.; Crank, K.; Steinle-Darling, E.; Pecson, B.M. Establishing pathogen log reduction value targets for direct potable reuse in the United States. AWWA Water Sci. 2023, 5, e1353. [Google Scholar] [CrossRef] [Scilit]
- Arcadis. 2016-05-24 Analytical Lab Data. El Paso Water Utilities: El Paso, TX, USA, 2016; to be submitted.
- Arcadis. Microbial Characteristics of Source. El Paso Water Utilities: El Paso, TX, USA, 2016; to be submitted.
- Arcadis. Advanced Water Purification Facility Pilot Test Report (Revision No. 1). El Paso Water Utilities: El Paso, TX, USA, 2016; to be submitted.
- Price, R.G.; Wildeboer, D. “E. coli” as an Indicator of Contamination and Health Risk in Environmental Waters. In Escherichia coli—Recent Advances on Physiology, Pathogenesis and Biotechnological Applications; IntechOpen: London, UK, 2017. [CrossRef] [Scilit]
- Keegan, A.; Daminato, D.; Saint, C.P.; Monis, P.T. Effect of water treatment processes on Cryptosporidium infectivity. Water Res. 2008, 42, 1805–1811. [Google Scholar] [CrossRef] [Scilit]
- Gerba, C.P.; Rose, J.B.; Haas, C.N.; Crabtree, K.D. Waterborne rotavirus: A risk assessment. Water Res. 1996, 30, 2929–2940. [Google Scholar] [CrossRef] [Scilit]
- Rames, E.; Roiko, A.; Stratton, H.; Macdonald, J. Technical aspects of using human adenovirus as a viral water quality indicator. Water Res. 2016, 96, 308–326. [Google Scholar] [CrossRef] [Scilit]
- U.S. Environmental Protection Agency. Guidance for Data Quality Assessment: Practical Methods for Data Analysis; (EPA QA/G-9S, Final Report); U.S. Environmental Protection Agency: Washington, DC, USA, 2015.
- Pecson, B.M.; Darby, E.; Danielson, R.; Dearborn, Y.; Giovanni, G.D.; Jakubowski, W.; Leddy, M.; Lukasik, G.; Mull, B.; Nelson, K.L.; et al. Distributions of waterborne pathogens in raw wastewater based on a 14-month, multi-site monitoring campaign. Water Res. 2022, 213, 118170. [Google Scholar] [CrossRef] [Scilit]
- Roseberry, A.M.; Burmaster, D.E. Lognormal Distributions for Water Intake by Children and Adults. Risk Anal. 1992, 12, 99–104. [Google Scholar] [CrossRef] [Scilit]
- U.S. Environmental Protection Agency. Chapter 3 (update): Ingestion of water and other select liquids. In Exposure Factors Handbook; (EPA/600/R-18/259F); U.S. Environmental Protection Agency, Office of Research and Development: Washington, DC, USA, 2019. Available online: https://www.epa.gov/sites/default/files/2019-02/documents/efh_-_chapter_3_update.pdf (accessed on 2 May 2026).
- Center for Advancing Microbial Risk Assessment (CAMRA). Quantitative Microbial Risk Assessment, QMRA Wiki. Michigan State University. Available online: https://qmrawiki.org (accessed on 11 January 2022).
- U.S. Environmental Protection Agency. Quantitative Microbial Risk Assessment to Estimate Illness in Freshwater Recreational Areas: Fecal Indicator Tool; (EPA-820-R-10-009); U.S. Environmental Protection Agency, Office of Water: Washington, DC, USA, 2010. Available online: https://www.epa.gov/sites/default/files/2015-11/documents/quantitiave-microbial-risk-fecal.pdf (accessed on 29 April 2022).
- World Health Organization (WHO). Guidelines for Drinking-Water Quality, 4th ed.; (incorporating the 1st addendum); WHO: Geneva, Switzerland, 2017. [Google Scholar]
- U.S. Environmental Protection Agency. National Primary Drinking Water Regulations: Long Term 2 Enhanced Surface Water Treatment Rule. Fed. Regist. 2006, 71, 656–751. [Google Scholar]
- National Research Council. Assessment of Water Reuse as an Approach for Meeting Future Water Supply Needs; The National Academies Press: Washington, DC, USA, 2012. [CrossRef] [Scilit]
- U.S. Environmental Protection Agency. Guidelines for Water Reuse; (EPA/600/R-12/618); U.S. Environmental Protection Agency: Washington, DC, USA, 2012. Available online: https://www.epa.gov/waterreuse/guidelines-water-reuse (accessed on 2 May 2026).
- El Paso Water. Breaking Ground on Water Purification Facility. 2025. Available online: https://www.epwater.org/about-us/newsroom/direct-to-distribution-water-reuse-facility (accessed on 20 July 2026).
- Hai, F.; Riley, T.; Shawkat, S.; Magram, S.; Yamamoto, K. Removal of Pathogens by Membrane Bioreactors: A Review of the Mechanisms, Influencing Factors and Reduction in Chemical Disinfectant Dosing. Water 2014, 6, 3603–3630. [Google Scholar] [CrossRef] [Scilit]
- Nasir, A.M.; Adam, M.R.; Mohamad Kamal, S.N.E.A.; Jaafar, J.; Othman, M.H.D.; Ismail, A.F.; Aziz, F.; Yusof, N.; Bilad, M.R.; Mohamud, R.; et al. A review of the potential of conventional and advanced membrane technology in the removal of pathogens from wastewater. Sep. Purif. Technol. 2022, 286, 120454. [Google Scholar] [CrossRef] [Scilit]
- Burke, M.; Wells, E.; Larison, C.; Rao, G.; Bentley, M.J.; Linden, Y.S.; Smeets, P.; DeFrance, J.; Brown, J.; Linden, K.G. Systematic Review of Microorganism Removal Performance by Physiochemical Water Treatment Technologies. Environ. Sci. Technol. 2025, 59, 21763–21775. [Google Scholar] [CrossRef] [Scilit]
- Amoueyan, E.; Ahmad, S.; Eisenberg, J.N.S.; Gerrity, D. Equivalency of indirect and direct potable reuse paradigms based on a quantitative microbial risk assessment framework. Microb. Risk Anal. 2019, 12, 60–75. [Google Scholar] [CrossRef] [Scilit]
- Pecson, B.M.; Triolo, S.C.; Olivieri, S.; Chen, E.C.; Pisarenko, A.N.; Yang, C.-C.; Olivieri, A.; Haas, C.N.; Trussell, R.S.; Trussell, R.R. Reliability of pathogen control in direct potable reuse: Performance evaluation and QMRA of a full-scale 1 MGD advanced treatment train. Water Res. 2017, 122, 258–268. [Google Scholar] [CrossRef] [Scilit]
- Amoueyan, E.; Ahmad, S.; Eisenberg, J.N.S.; Pecson, B.; Gerrity, D. Quantifying pathogen risks associated with potable reuse: A risk assessment case study for Cryptosporidium. Water Res. 2017, 119, 252–266. [Google Scholar] [CrossRef] [Scilit]
- California State Water Resources Control Board. Direct Potable Reuse Regulations; (SBDDW-23-001) Final regulation text; The State Water Resources Control Board: Sacramento, CA, USA, 2024.
- Texas Commission on Environmental Quality. Direct Potable Reuse for Public Water Systems; RG-634; Texas Commission on Environmental Quality: Austin, TX, USA, 2022.
- Wigginton, K.R.; Pecson, B.M.; Sigstam, T.; Bosshard, F.; Kohn, T. Virus Inactivation Mechanisms: Impact of Disinfectants on Virus Function and Structural Integrity. Environ. Sci. Technol. 2012, 46, 12069–12078. [Google Scholar] [CrossRef] [Scilit]
- Sobsey, M.D.; Meschke, J.S. Virus Survival in the Environment with Special Attention to Survival in Sewage Droplets and Other Environmental Media of Fecal or Respiratory Origin; Report; World Health Organization: Geneva, Switzerland, 2003; Volume 70, pp. 19–39. [Google Scholar]
- Helsel, D.R. Statistics for Censored Environmental Data Using Minitab and R, 2nd ed.; Wiley: Hoboken, NJ, USA, 2012. [Google Scholar]

Disclaimer/Publisher’s Note: The statements, opinions and data contained in all publications are solely those of the individual author(s) and contributor(s) and not of MDPI and/or the editor(s). MDPI and/or the editor(s) disclaim responsibility for any injury to people or property resulting from any ideas, methods, instructions or products referred to in the content. |
© 2026 by the authors. Licensee MDPI, Basel, Switzerland. This article is an open access article distributed under the terms and conditions of the Creative Commons Attribution (CC BY) license.