


Abstract
Greece’s electricity system—with an annual demand of approximately 57 TWh and renewable penetration exceeding 50% in 2024–2025—faces growing operational risks from weather-driven supply–demand imbalances. We developed an agent-based model (ABM) implemented in Mesa (Python) that simulates the full national market over a complete annual cycle (1 June 2024–31 May 2025). The model comprises 24 autonomous agents—six producer agents (solar, wind, biomass, natural gas, hydro, lignite), 15 consumer agents (two national aggregates plus 13 regional nodes), two transaction agents (imports, exports), and one baseline data agent—parameterized directly from ADMIE, RAE, ELSTAT, and Ember data sources. Baseline validation against ADMIE records yields an annual production error of +0.35% (57.2 TWh simulated vs. 57.0 TWh) and daily source-level correlations of at least 0.94. Four extreme weather scenarios are applied and evaluated using a resilience index R: a 21-day Dunkelflaute event (R = 0.965), 24 heatwave days (R = 0.985), four hypothetical PV curtailment events (R = 0.996), and a 7-day storm (R = 0.992). The Dunkelflaute scenario produces the highest unserved energy (1.4 TWh), corresponding to a daily storage requirement of 65–70 GWh sustained over multiple consecutive days.
1. Introduction
By 2024, renewable energy sources supplied more than 50% of the Greek electricity demand, exceeding the EU Green Deal target of 45% by 2030 ahead of schedule. As a result, weather-driven supply variability has become the primary reliability challenge: the same meteorological conditions that enable high RES generation can also produce rapid, large-scale supply shortfalls. The Greek grid is geographically fragmented, comprising the mainland interconnected system and more than 200 inhabited islands, linked by limited cross-border interconnections with a combined capacity of approximately 2.3 GW. In this setting, simultaneous reductions in wind and solar output—termed Dunkelflaute in Central European practice—can rapidly erode supply margins, while temperature-driven demand surges strain the system from the demand side.
Real events illustrate the severity of these challenges. During the winter of 2024–2025, persistent low-wind and overcast conditions reduced the renewable contribution to below 30% of normal levels (ADMIE operational data), while wholesale electricity prices spiked toward €175/MWh on the most stressed days. The summer 2024 heatwave increased the air conditioning demand by 20–25%, pushing the daily peaks above 10.5 GW [1]. Conventional modeling tools such as PyPSA and PLEXOS optimize dispatch under perfect foresight assumptions, which limits their ability to represent agent-level heterogeneity and localized imbalances. The ABM addresses these limitations through a bottom-up simulation in which each market participant is represented individually. Recent reviews [2,3] document more than 200 ABM applications to electricity markets. Modern frameworks such as ASSUME [4] incorporate deep reinforcement learning for adaptive bidding. For Greece, the Business Strategy Assessment Model (BSAM) [5] has been applied to strategic bidding and market design under increasing RES penetration. However, no prior study has constructed a geospatial, ADMIE-validated, weather stress testing ABM of the full Greek national electricity market—the gap that the present study fills.
This paper presents an ABM simulating 365 daily steps over June 2024–May 2025 with 24 agents parameterized from official national data. Four contributions follow: (i) the first geospatial, weather stress testing ABM of the Greek electricity market validated against ADMIE data; (ii) a multi-scenario stress testing framework; (iii) a resilience index quantifying vulnerability across event types; and (iv) a platform extensible to digital twin integration.
2. Literature Review
2.1. Agent-Based Modeling in Electricity Markets
In an ABM, autonomous agents representing individual producers, consumers, or institutions interact according to defined rules; market-level outcomes emerge from these interactions without being prescribed at the system level. Bonabeau [6] established the conceptual foundation; North et al. [7] applied it to electricity markets with the EMCAS model at Argonne National Laboratory; and Koritarov [8] demonstrated its suitability for grid–economic interactions in deregulated settings. Sensfuß et al. [9] provided the first comprehensive ABM electricity market survey; Botterud et al. [10] demonstrated a regional-scale ABM for Central Europe. Ringler et al. [2] cataloged more than 205 applications; Trimarchi et al. [3] confirmed growing integration with machine learning; and Madler et al. [11] validated multi-agent microgrid models against real market data. The ASSUME toolbox [4] represents the state of the art with integrated DRL agents. For Greece, the BSAM [5] examines strategic bidding; the present model addresses extreme weather resilience instead.
2.2. ABM with Renewables, Demand Response, and Storage
Vidigal et al. [12] showed that high wind penetration drives price instability; Sensfuß et al. [13] quantified the merit order effect in Germany. Zhou et al. [14] demonstrated that demand response agents dampen price spikes, and Thimmapuram and Kim [15] provided a basis for parameterizing consumer price elasticity. Ringler et al. [2] called for more work on storage agents—a priority for future versions of this model.
2.3. Extreme Weather Impacts
Añel et al. [16] documented 5–10% thermal plant output reductions during heatwaves—the mechanism underlying the heatwave scenario’s thermal derating. Su et al. [17] showed that compound hydrometeorological extremes produce the most severe price volatility. Strnad et al. [18] projected approximately 351 TWh of European long-duration storage requirements from a Dunkelflaute risk analysis—framing the infrastructure challenge revealed by the present Greek simulation. Miskiw and Staudt [19] demonstrated adaptive DRL agent behavior under volatile conditions; deterministic rules are retained here to isolate weather effects.
3. Model Description
3.1. Modeling Framework
The simulation is implemented in Python 3.12 using the Mesa ABM framework (version 3.3.0) [20]. A central SolarModel class manages a custom scheduler, a step counter, and all 24 agent instances. Each step corresponds to one calendar day, giving 365 steps over 1 June 2024–31 May 2025. At initialization, five JSON data files are loaded: daily generation and consumption (baseline or scenario-modified), daily imports and exports by country, uncorrected bioenergy values, and unperturbed operational data for the baseline data agent.
3.2. Agent Classes and Decision Rules
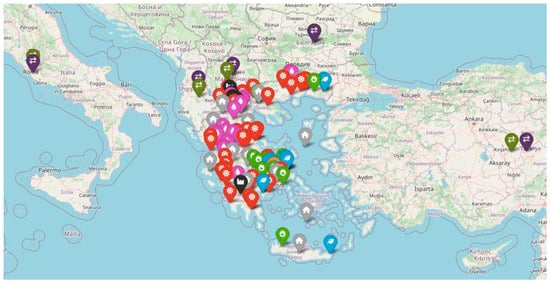
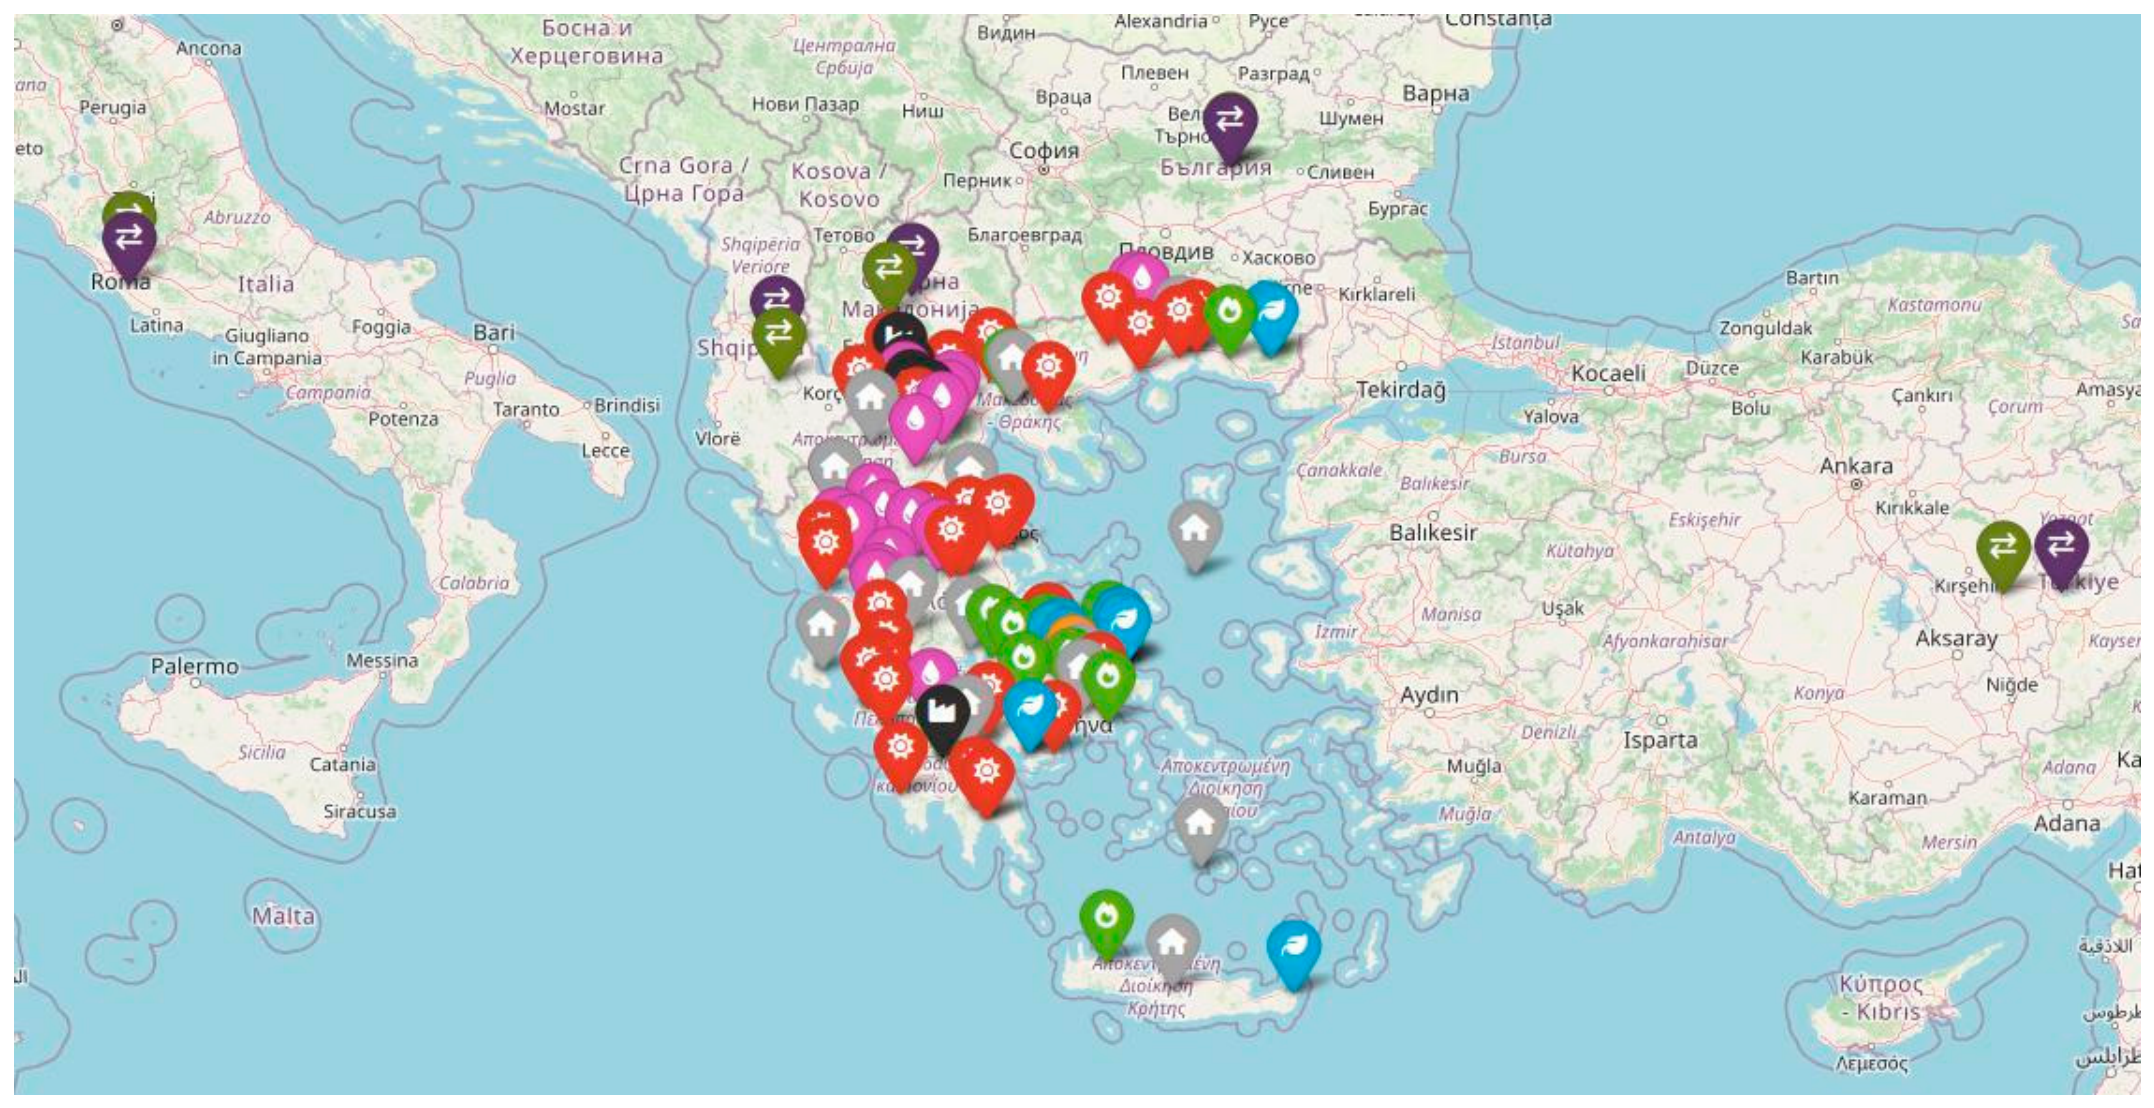
The model comprises 24 agents in four functional classes (Table 1). Producer agents aggregate all physical plants of a given fuel type into a single national-level stream; unit commitment and plant-level constraints are not modeled. At each step, each producer reads its daily value from the JSON file and accumulates a running total. Producers are placed at representative geographic coordinates to support visualization (Figure 1). Consumer agents model demand at two resolutions: one agent for mainland Greece and one for Crete, plus 13 regional agents that disaggregate the mainland demand using fixed ELSTAT-based shares (Attica 31.71%, Central Macedonia 15.80%, Central Greece 14.08%, and so on). Transaction agents replay historical monthly import/export totals and do not respond to scenario-induced deficits—this exogenous treatment is discussed explicitly in Section 6.4. The baseline data agent holds unperturbed operational series for scenario comparison. The 24-agent resolution reflects the granularity at which validated national data exist, rather than a modeling convenience: ADMIE reports generation at the level of six fuel-type aggregates rather than individual power plants, and ELSTAT publishes demand data at the 13-region level adopted here. This resolution allows every agent’s daily output to be calibrated and validated directly against an authoritative national record (Section 5.1), which would not be possible at the plant level without proprietary dispatch data, and is sufficient for the system-level resilience index R (Section 3.4); finer-grained unit commitment behavior is identified as future work (Section 6.4).
Table 1.
Agent classes and primary functions.
Figure 1.
Geospatial placement of the 24 model agents. Producer agents (red sun: solar; blue leaf: wind; orange leaf: biomass; green flame: gas; purple droplet: hydro; black factory: lignite) are placed at representative plant coordinates; consumer agents mark regional centroids (grey house icons); bilateral transaction agents (exchange-arrow icons: dark purple for exports, dark green for imports; Italy, Bulgaria, Türkiye, Albania, N. Macedonia) are placed at representative locations in each partner country. An interactive map is generated with folium. Base map: © OpenStreetMap contributors.
3.3. Data Sources
All inputs are drawn from publicly accessible, authoritative sources (Table 2). ADMIE’s AΠE aggregate is disaggregated using Ember monthly solar and wind shares; bioenergy is the residual, floored at zero. Crete consumption is modeled separately following ADMIE’s reporting structure. JRC PVGIS irradiance data inform the PV temperature derating coefficients used in preprocessing but do not enter the daily agent update rule directly. Monthly imports and exports are assigned to the first calendar day of each month, with remaining days set to zero.
Table 2.
Data sources and their use in GreeceABM.
3.4. Resilience Index
System performance is summarized by the resilience index R = (1/T) · Σ min(Gt + It, Dt)/Dt, where Gt is domestic generation, It is net imports, Dt is the demand (all in MWh), and T = 365 days. Because imports are exogenous, R under stress scenarios represents a conservative lower bound on what would be achievable with adaptive import dispatch.
4. Simulation Scenarios
4.1. Scenario Design
Four weather scenarios can be activated individually or in combination via flags (df, hw, pc, sh), yielding 16 configurations. Each is implemented as a perturbation of the daily generation and demand time series before the simulation; the agent logic remains unchanged, ensuring that all differences are attributable to weather perturbations. Table 3 summarizes the parameters. Day selection for the Dunkelflaute and Heatwave scenarios (Section 4.2 and Section 4.3) draws from Python’s random module; the specific runs reported in Section 5 were not generated from a fixed seed, so the exact set of perturbed days and multiplicative factors cannot be regenerated bit-for-bit from these runs. The released code now fixes random.seed(42) before scenario generation, so future runs are exactly reproducible. Repeated runs under different seeds consistently preserve the relative severity ordering of the scenarios reported in Section 5.5, although the absolute R and deficit values vary by run; characterizing this variability with a Monte Carlo ensemble across seeds is identified as future work.
Table 3.
Scenario parameterization. * Hydro ×0.40 is an upper-bound stylization (see Section 4.3).
4.2. Dunkelflaute Scenario
The scenario is parameterized from SMARD data (German market, winter 2024–2025), where 21 days were identified with both onshore wind and PV below the monthly mean. Applied to Greece, this constitutes a severe tail-risk stress test rather than the reproduction of a specific historical event—the 80–95% curtailment is intentionally more severe than documented Greek winter events to probe system limits. On each of 21 randomly selected November–February days, wind and solar are multiplied by a factor drawn from U(0.05, 0.20) and demand by U(1.15, 1.20).
4.3. Heatwave Scenario
The 24-day duration follows the US EPA analysis, which indicates approximately six heatwave events per year with an average duration of four days. PV output is reduced by 9–16% based on a −0.2%/°F temperature coefficient at 41–50 °C. Gas and lignite output is reduced by 7–13%, consistent with Añel et al. [16]. Hydro output is reduced to 40% of the recorded values—an upper-bound stylization concentrating an 8.5% annual drought-induced reduction (Ember data) entirely into the 24 affected days. Demand rises by 15–30%.
4.4. Hypothetical PV Curtailment
Four dates test short-duration PV drops (12 June 2024, 11 July 2024, 5 December 2024, 14 January 2025): three at 50% PV, one at 20%. This is explicitly not calibrated to actual eclipse forecasts for Greece in 2024–2025.
4.5. Storm Scenario
All six generation sources are reduced to 50% for seven consecutive days (10–16 September 2024), motivated by documented storm impacts on electricity production [25]. With a September demand of ~130–150 GWh/day, the daily deficit is approximately 65–75 GWh, yielding ~0.48 TWh cumulative unserved energy—roughly 0.9% of the annual demand. This is an upper-bound structural failure test, not a planning frequency case.
5. Results
5.1. Baseline Validation
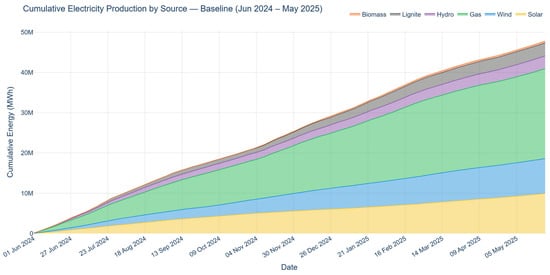
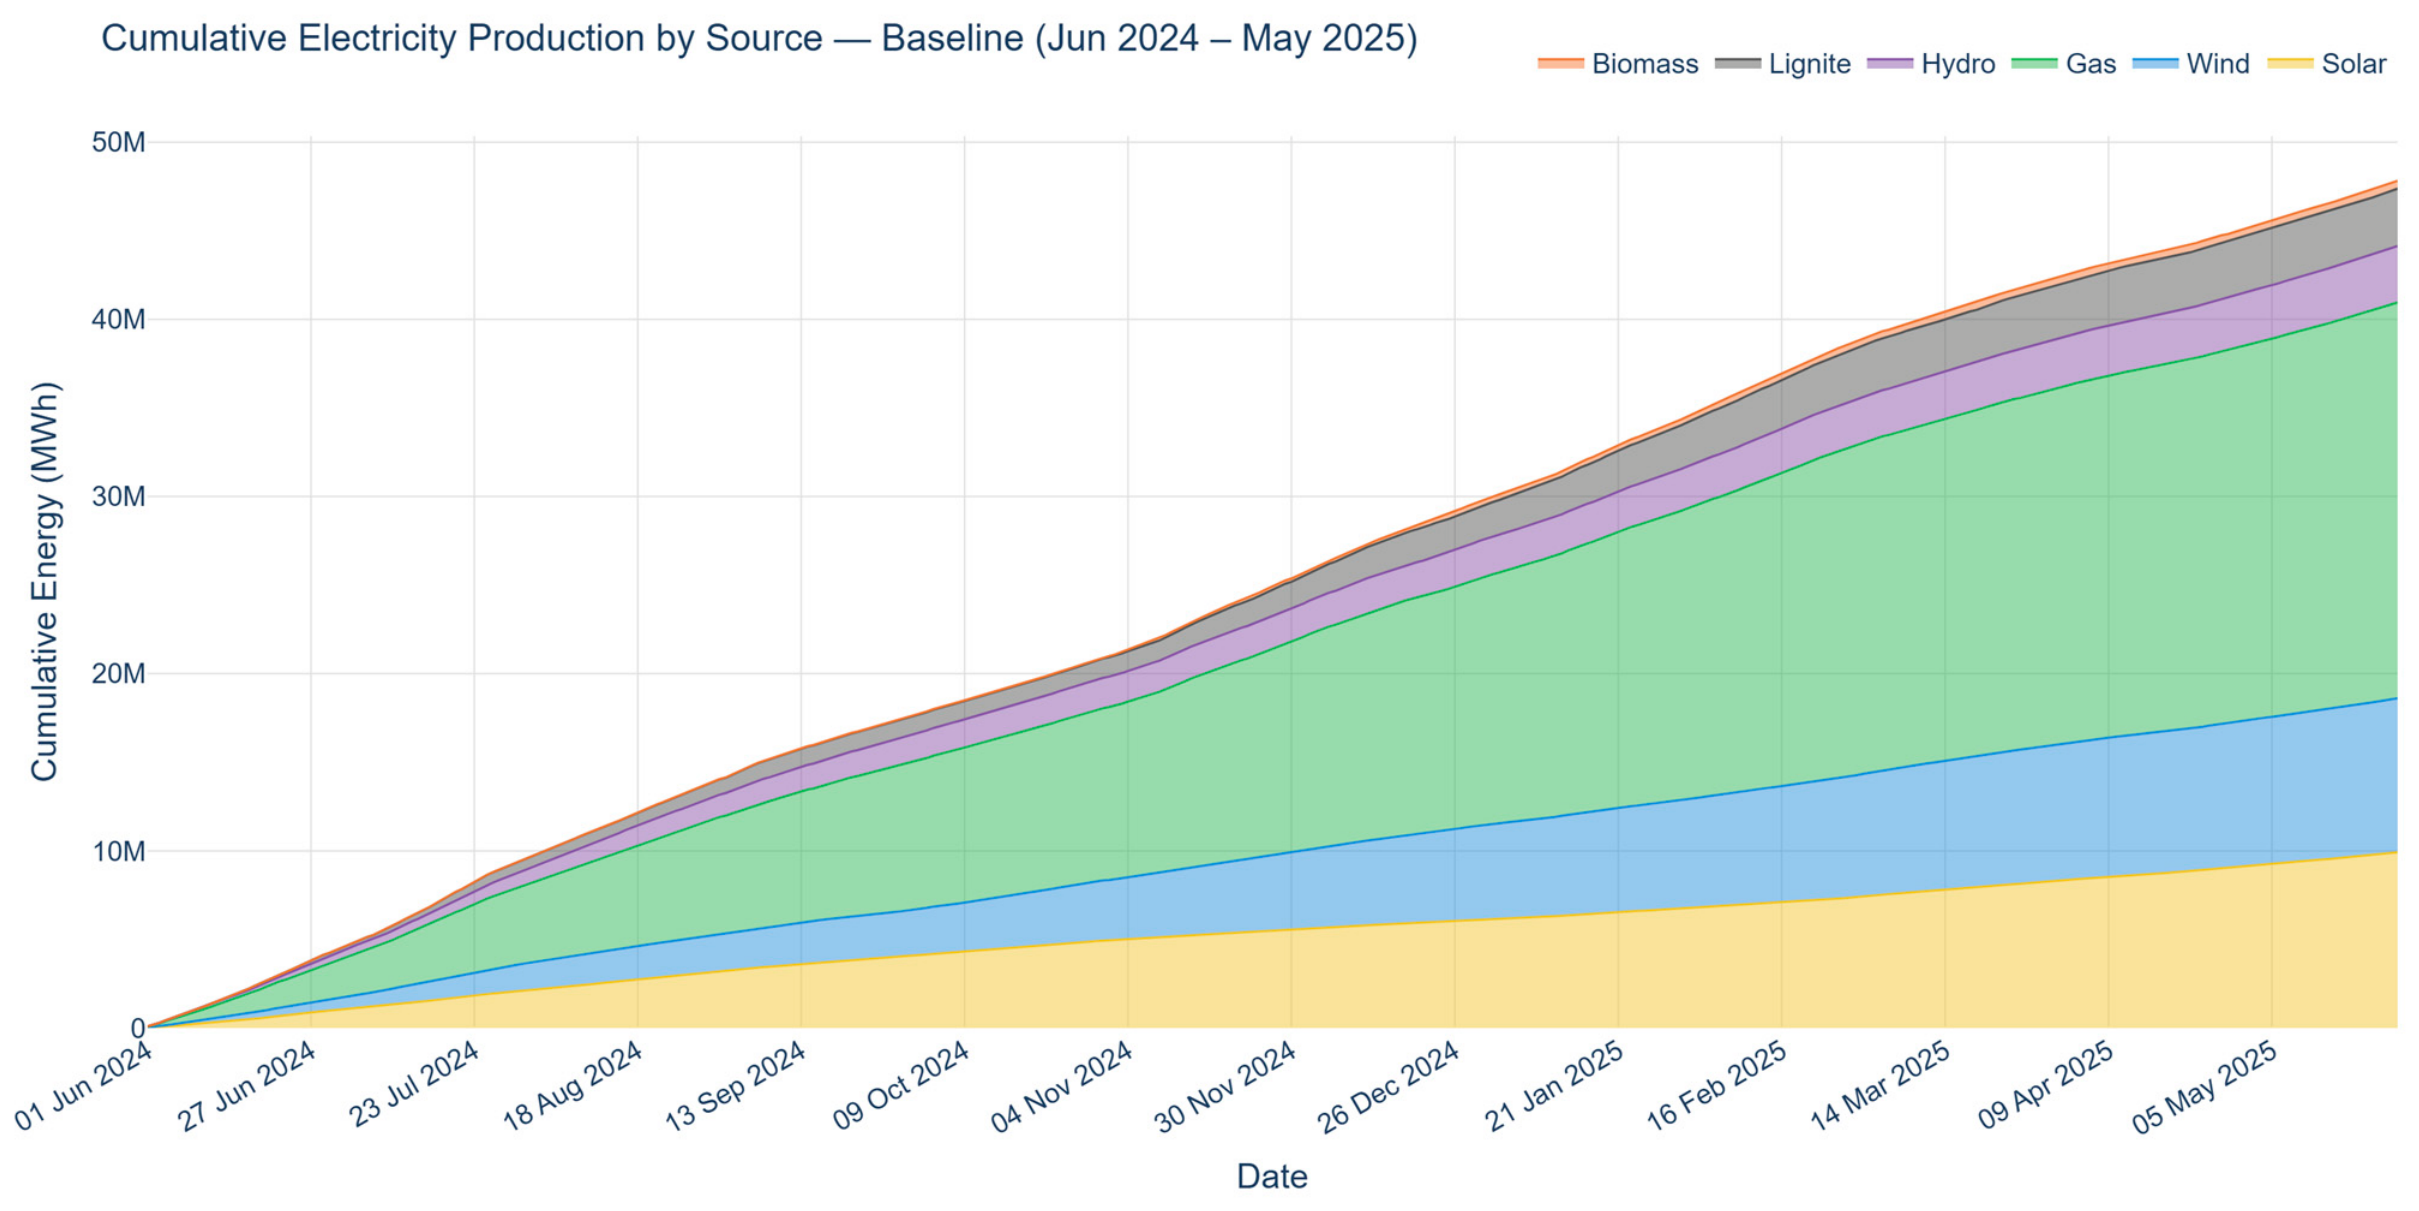
The model reproduces the 2024–2025 ADMIE operational records with high accuracy (Figure 2). The total annual generation error is +0.35%; the daily time-series correlation for the total generation and total demand reaches r = 0.98 and r = 0.99, respectively. Table 4 provides the source-level validation metrics. The baseline resilience index is R = 0.998; the small deviation from 1.0 is an artifact of the monthly import lump-sum convention.
Figure 2.
Baseline simulation output: cumulative daily electricity production by source (1 June 2024–31 May 2025). Stacked areas correspond to the six producer agent types (solar, wind, biomass, gas, hydro, lignite). Total production closely tracks total consumption throughout the annual cycle, consistent with the validation metrics in Table 4.
Table 4.
Baseline validation against ADMIE data (June 2024–May 2025). † Biomass absolute error is negligible (<2% of total generation).
5.2. Dunkelflaute
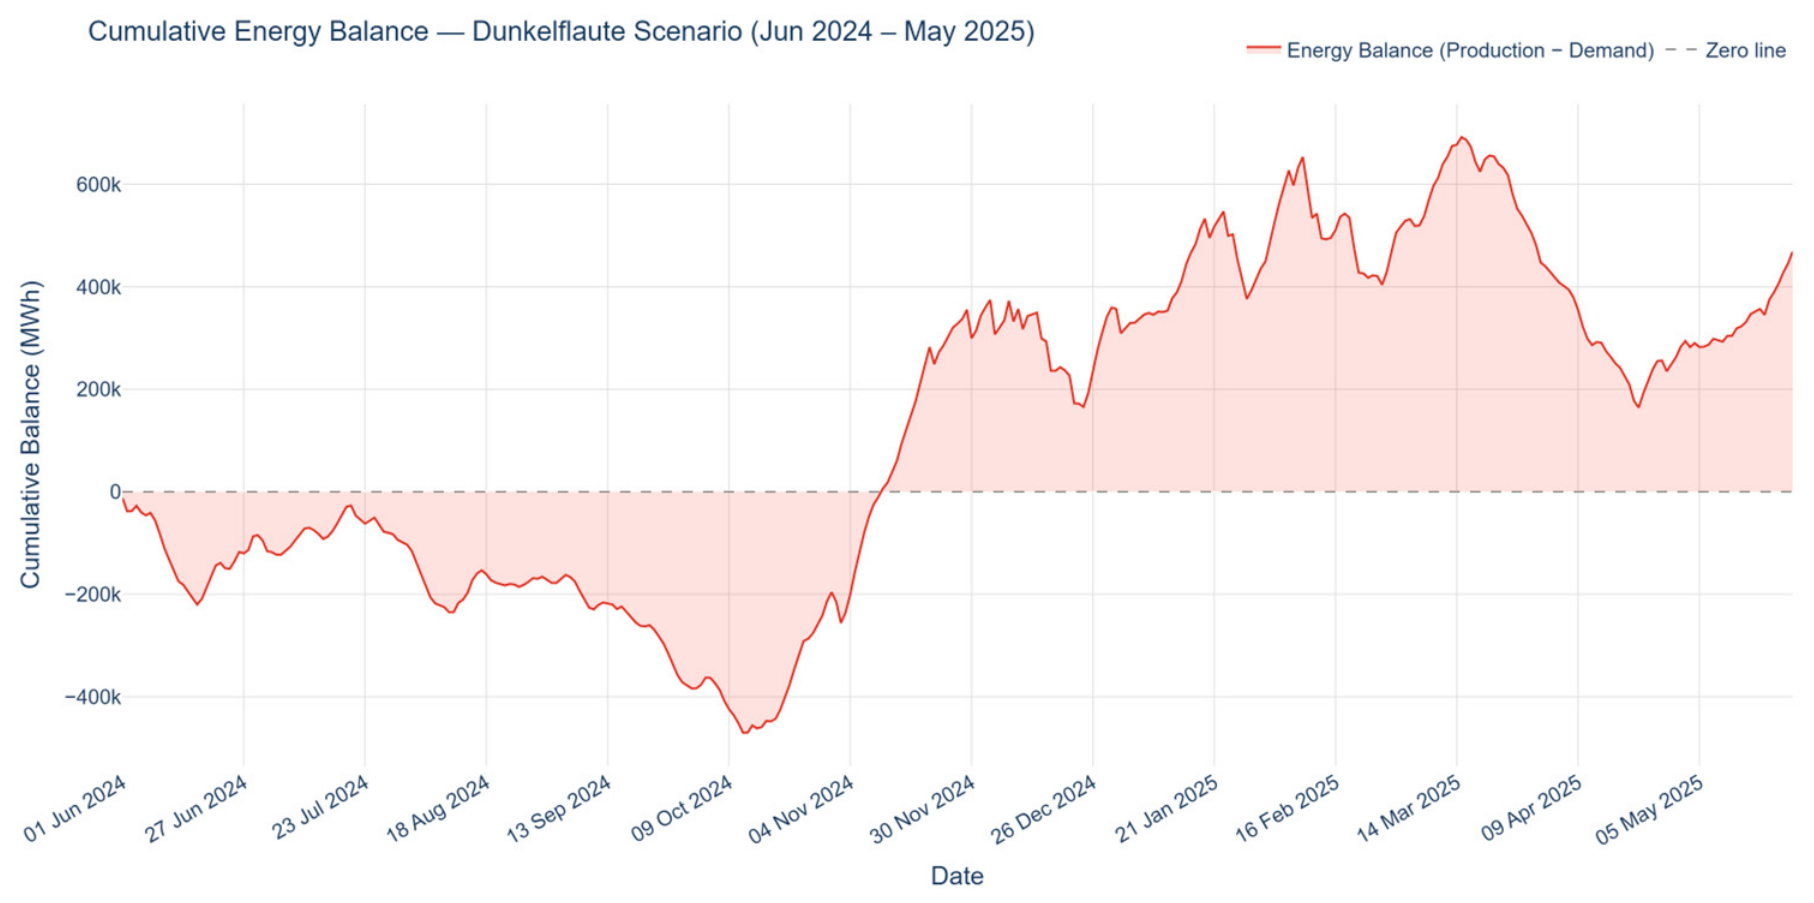
Wind and solar fall to 5–20% of normal levels on 21 winter days, while the demand rises by 15–20%. Gas and lignite compensate partially but cannot offset the combined supply collapse and demand surge. Because imports are fixed at historical totals, the model records an unmet demand on the most severe days (Figure 3); the reported deficits are therefore conservative lower bounds. A representative run yields R = 0.965, a maximum daily deficit of 68 GWh, and cumulative unserved energy of 1.4 TWh over 21 days—implying a long-duration storage requirement of 65–70 GWh/day over multiple consecutive days.
Figure 3.
Cumulative energy balance (generation + imports − demand) under a stress scenario. Negative excursions below the zero line mark periods of unserved energy. Multiple deficit windows are visible during the scenario period, with the deepest trough corresponding to consecutive low-generation days—the operational signature of a Dunkelflaute event.
5.3. Heatwave
Twenty-four summer days experience a demand of 180–200+ GWh with simultaneous supply derating. Unlike Dunkelflaute, solar generation remains substantial because the irradiance that drives high temperatures also supports PV output. The system is stressed primarily through demand surge. A representative run yields R = 0.985, a maximum daily deficit of 45 GWh, and 0.9 TWh of cumulative unserved energy.
5.4. PV Curtailment and Storm
PV curtailment events produce single-day deficits of 10–18% of the daily supply, absorbed by gas and hydro within the day (R = 0.996; cumulative deficit 0.06 TWh). The storm scenario produces R = 0.992 (annual) but a local R ≈ 0.65 within the seven-day window; the cumulative unserved energy is ~0.48 TWh. Its value lies in defining the structural failure boundary rather than a typical planning risk.
5.5. Scenario Summary
Table 5 compares the resilience metrics across scenarios. The relative ordering—Dunkelflaute as the most severe, followed by Storm (acute window), Heatwave, and PV Curtailment—is robust across stochastic runs; the absolute R values vary slightly by run (Section 4.1).
Table 5.
Resilience index R and deficit metrics by scenario (representative run). Dunkelflaute and heatwave days are randomly selected; values reflect a single representative run.
6. Discussion
6.1. Key Findings
The central result is the asymmetry between supply-side and demand-side stress. Dunkelflaute yields R = 0.965 and 1.4 TWh of unserved energy versus R = 0.985 and 0.9 TWh for heatwaves. Renewables provide approximately half of the annual generation; when wind and solar collapse, roughly half of the domestic supply disappears within days. Gas units cannot fully compensate. These results are consistent with Su et al. [17] and Strnad et al. [18], who identify compound supply-side extremes as more damaging than demand surges. The Dunkelflaute daily deficits of up to 68 GWh indicate that long-duration storage—not short-duration (2–4 h) batteries—is the enabling technology for reliability under events of this severity. This scale is broadly consistent with continental-level estimates: Strnad et al. [18] project approximately 351 TWh of long-duration storage needed across Europe under a future Dunkelflaute risk, and the present national-level deficit of 1.4 TWh over 21 days is compatible with this magnitude given Greece’s roughly 2% share of the European electricity demand. The finding that combined Dunkelflaute and heatwave conditions are more severe than either scenario alone (R = 0.950, Table 5) is likewise consistent with Su et al. [17], who report that compound hydrometeorological extremes produce disproportionately severe outcomes relative to single-factor events.
6.2. Methodological Contribution
To the best of the authors’ knowledge, this is the first geospatial, weather stress testing ABM of the Greek national electricity market validated against 2024–2025 ADMIE data. Earlier Greek ABMs such as BSAM [5] address strategic bidding rather than resilience. The multi-scenario design is a second contribution: four distinct phenomena can be superimposed within a single annual simulation, reflecting the reality that multiple events can occur in one year. The stochastic parameterization provides natural ensembles across repeated runs without the full Monte Carlo overhead.
6.3. Policy Implications
Dunkelflaute deficits of 65–70 GWh/day point toward long-duration storage technologies—pumped hydro, hydrogen, or long-duration batteries—as necessary complements to further renewable deployment. The heatwave results support demand-side flexibility investments: shifting 10–15% of the peak cooling load would meaningfully reduce stress. Because imports are exogenous and historical, the resilience indices are conservative; an expanded Balkan interconnection capacity and dynamic import management would likely improve the outcomes. This strengthens the case for the ongoing Balkan interconnect upgrade program.
6.4. Limitations and Future Work
Three limitations are acknowledged explicitly. First, the model operates at a daily resolution, which may underestimate intra-day balancing constraints and short-duration peaks. Extension to an hourly resolution is the immediate next priority. Second, producer agents follow deterministic, data-driven dispatch without strategic bidding, storage operation, or demand response; ASSUME [4] and explainable DRL [19] provide natural integration pathways. Third, cross-border flows are exogenous and based on historical totals, not on the available capacity or cost-optimized dispatch—the most consequential structural limitation for scenario realism. Future work will implement storage and demand response agents, DRL-based bidding, and real-time ADMIE data integration for digital twin deployment.
7. Conclusions
An agent-based model of the Greek electricity market has been developed and validated against ADMIE 2024–2025 operational data, achieving annual errors below 0.4% and daily source-level correlations of at least 0.94. Four extreme weather scenarios—Dunkelflaute, heatwaves, hypothetical PV curtailment, and catastrophic storms—are stress-tested using a resilience index R. Supply-side intermittency during Dunkelflaute conditions (R = 0.965; 1.4 TWh unserved energy) is the dominant operational challenge under the current generation mix, being more severe than demand-side heatwave stress (R = 0.985). This implies that long-duration storage is a higher policy priority than demand-side measures alone, although both are beneficial. The model is intentionally transparent and extensible: future development will target an hourly resolution, explicit flexibility agents, DRL-based decision rules, and real-time ADMIE coupling for digital twin deployment. The framework is readily transferable to other Mediterranean and Balkan grids facing similar combinations of high renewable penetration, fragmented infrastructure, and climate-driven variability.
Author Contributions
Conceptualization, V.T. and K.T.; methodology, V.T. and G.S.; software, G.S.; validation, G.S. and V.T.; formal analysis, V.T.; investigation, G.S.; resources, V.T.; data curation, G.S.; writing—original draft preparation, V.T.; writing—review and editing, V.T. and K.T.; visualization, G.S.; supervision, K.T. and V.T.; project administration, K.T. All authors have read and agreed to the published version of the manuscript.
Funding
This research received no external funding.
Institutional Review Board Statement
Not applicable.
Informed Consent Statement
Not applicable.
Data Availability Statement
The model source code, data extraction scripts, and all input datasets (ADMIE, Ember, ELSTAT, and JRC PVGIS-derived JSON files) required to reproduce the results reported here are publicly available at https://github.com/StergiouGiorgos/Agent-Based-Simulation-of-the-Greek-Electricity-Grid (accessed on 5 November 2026).
Acknowledgments
The authors thank ADMIE for the open access to the operational data and the World Resources Institute for the Global Power Plant Database. The thesis underlying this work was developed at the Department of Computer Engineering and Informatics, University of Patras.
Conflicts of Interest
The authors declare no conflicts of interest.
References
- Daily Energy Balance Analysis Reports. Independent Power Transmission Operator S.A. Available online: https://www.admie.gr (accessed on 5 November 2026).
- Ringler, P.; Keles, D.; Fichtner, W. Agent-Based Modelling and Simulation of Smart Electricity Grids and Markets—A Literature Review. Renew. Sustain. Energy Rev. 2016, 57, 205–215. [Google Scholar] [CrossRef] [Scilit]
- Trimarchi, S.; Casamatta, F.; Gamba, L.; Grimaccia, F.; Lorenzo, M.; Niccolai, A. A Review of Agent-Based Models for Energy Commodity Markets and Their Natural Integration with RL Models. Energies 2025, 18, 3171. [Google Scholar] [CrossRef] [Scilit]
- Harder, N.; Miskiw, K.K.; Khanra, M.; Maurer, F.; Patil, P.; Qussous, R.; Weinhardt, C.; Klobasa, M.; Ragwitz, M.; Weidlich, A. ASSUME: An Agent-Based Simulation Framework for Exploring Electricity Market Dynamics with Reinforcement Learning. SoftwareX 2025, 30, 102176. [Google Scholar] [CrossRef] [Scilit]
- Kontochristopoulos, Y.; Michas, S.; Kleanthis, N.; Flamos, A. Investigating the Market Effects of Increased RES Penetration with BSAM: A Wholesale Electricity Market Simulator. Energy Rep. 2021, 7, 4905–4929. [Google Scholar] [CrossRef] [Scilit]
- Bonabeau, E. Agent-Based Modeling: Methods and Techniques for Simulating Human Systems. Proc. Natl. Acad. Sci. USA 2002, 99, 7280–7287. [Google Scholar] [CrossRef] [Scilit] [PubMed]
- North, M.J.; Conzelmann, G.; Koritarov, V.; Macal, C.M.; Thimmapuram, P.R.; Veselka, T.D. E-Laboratories: Agent-Based Modeling of Electricity Markets. In Proceedings of the American Power Conference, Chicago, IL, USA, 15–17 April 2002. [Google Scholar]
- Koritarov, V.S. Real-World Market Representation with Agents. IEEE Power Energy Mag. 2004, 2, 39–46. [Google Scholar] [CrossRef] [Scilit]
- Sensfuß, F.; Genoese, M.; Ragwitz, M.; Möst, D. Agent-Based Simulation of Electricity Markets—A Literature Review. Energy Stud. Rev. 2007, 15, 1–29. [Google Scholar] [CrossRef] [Scilit]
- Botterud, A.; Ilic, M.D.; Wangensteen, I. Optimal Investments in Power Generation Under Centralized and Decentralized Decision Making. IEEE Trans. Power Syst. 2005, 20, 254–263. [Google Scholar] [CrossRef] [Scilit]
- Madler, J.; Harding, S.; Weibelzahl, M. A Multi-Agent Model of Urban Microgrids: Assessing the Effects of Energy-Market Shocks Using Real-World Data. Appl. Energy 2023, 343, 121180. [Google Scholar] [CrossRef] [Scilit]
- Vidigal, D.; Lopes, F.; Pronto, A.; Santana, J. Agent-Based Simulation of Wholesale Energy Markets: A Case Study on Renewable Generation. In Proceedings of the 2015 26th International Workshop on Database and Expert Systems Applications (DEXA), Valencia, Spain, 1–4 September 2015; IEEE: New York, NY, USA, 2015; pp. 81–85. [Google Scholar] [CrossRef] [Scilit]
- Sensfuß, F.; Ragwitz, M.; Genoese, M. The Merit-Order Effect: A Detailed Analysis of the Price Effect of Renewable Electricity Generation on Spot Market Prices in Germany. Energy Policy 2008, 36, 3086–3094. [Google Scholar] [CrossRef] [Scilit]
- Zhou, Z.; Zhao, F.; Wang, J. Agent-Based Electricity Market Simulation with Demand Response from Commercial Buildings. IEEE Trans. Smart Grid 2011, 2, 580–588. [Google Scholar] [CrossRef] [Scilit]
- Thimmapuram, P.R.; Kim, J. Consumers’ Price Elasticity of Demand Modeling with Economic Effects on Electricity Markets Using an Agent-Based Model. IEEE Trans. Smart Grid 2013, 4, 390–397. [Google Scholar] [CrossRef] [Scilit]
- Añel, J.; Fernández-González, M.; Labandeira, X.; López-Otero, X.; de la Torre, L. Impact of Cold Waves and Heat Waves on the Energy Production Sector. Atmosphere 2017, 8, 209. [Google Scholar] [CrossRef] [Scilit]
- Su, Y.; Kern, J.D.; Reed, P.M.; Characklis, G.W. Compound Hydrometeorological Extremes Across Multiple Timescales Drive Volatility in California Electricity Market Prices and Emissions. Appl. Energy 2020, 276, 115541. [Google Scholar] [CrossRef] [Scilit]
- Strnad, F.; Schmidt, J.; Mockert, F.; Hennig, P.; Ludwig, N. Assessing the Risk of Future Dunkelflaute Events for Germany Using Generative Deep Learning. Environ. Data Sci. 2026, 5, e11. [Google Scholar] [CrossRef] [Scilit]
- Miskiw, K.K.; Staudt, P. Explainable Deep Reinforcement Learning for Multi-Agent Electricity Market Simulations. In Proceedings of the 2024 20th International Conference on the European Energy Market (EEM), Istanbul, Turkiye, 10–12 June 2024; IEEE: New York, NY, USA, 2024; pp. 1–9. [Google Scholar] [CrossRef] [Scilit]
- Masad, D.; Kazil, J. Mesa: An Agent-Based Modeling Framework. In Proceedings of the 14th Python in Science Conference (SciPy 2015), Austin, TX, USA, 6–12 July 2015; SciPy: Austin, TX, USA, 2015; pp. 51–58. [Google Scholar] [CrossRef] [Scilit]
- Monthly Electricity Data for Greece. Ember-Energy. Available online: https://ember-energy.org/ (accessed on 5 November 2026).
- World Resources Institute. Global Power Plant Database, 2024. Available online: https://datasets.wri.org (accessed on 5 November 2026).
- ELSTAT. Regional Energy Statistics, 2012. Available online: https://www.statistics.gr/en/home (accessed on 5 November 2026).
- European Commission. Photovoltaic Geographical Information System. PVGIS: Interactive Tools. Available online: https://re.jrc.ec.europa.eu/pvg_tools/ (accessed on 5 November 2026).
- Gargani, J. Impact of Major Hurricanes on Electricity Energy Production. Int. J. Disaster Risk Reduct. 2022, 67, 102643. [Google Scholar] [CrossRef] [Scilit]

Disclaimer/Publisher’s Note: The statements, opinions and data contained in all publications are solely those of the individual author(s) and contributor(s) and not of MDPI and/or the editor(s). MDPI and/or the editor(s) disclaim responsibility for any injury to people or property resulting from any ideas, methods, instructions or products referred to in the content. |
© 2026 by the authors. Licensee MDPI, Basel, Switzerland. This article is an open access article distributed under the terms and conditions of the Creative Commons Attribution (CC BY) license.