


Abstract
This study experimentally validates a cost-efficient physics-based implementation of the TRICK framework for estimating longitudinal, lateral, and vertical tire–road contact forces from measured vehicle-state signals. Estimates were compared with a high-precision Kistler wheel force transducer during proving-ground acceleration, braking, and cornering tests. Steady-state mean errors were 4.3–6.4%, with larger deviations during dynamic transients. The results support the framework’s potential for low-cost vehicle dynamics monitoring and active safety applications within the validated operating range.
1. Introduction
Tire–road contact forces () govern vehicle longitudinal, lateral, and yaw dynamics and support stability control and model validation [1,2]. Wheel force transducers (WFTs) provide accurate measurements but entail high costs, added unsprung mass, and integration constraints [3]. Model-based observers instead use inertial measurements, wheel speeds, and steering angle [4,5,6,7], although rigid-body assumptions, neglected suspension compliance, noise, and tire nonlinearity limit accuracy [1,2,6].
Existing approaches include Kalman filters [4,5,6,7], sliding-mode observers, and hybrid data-driven estimators [8]. Many are evaluated in simulation or through indirect metrics; direct validation against calibrated WFTs under high-slip transients remains limited.
This study contributes experimental implementation and validation of TRICK [9,10] through the following:
Architectural and Driveline Adaptation: TRICK is adapted to front-wheel-drive (FWD) passenger vehicles, accounting for asymmetric drive torque allocation, dynamic braking split, and front-axle roll stiffness.
Measurement-System Implementation: The TRICK force-estimation equations were implemented as synchronized calculation channels in the MoTeC i2 Pro analysis environment, enabling direct comparison between estimated and measured wheel-force signals.
Direct Experimental Ground-Truth Validation: Proving-ground comparison with a calibrated Kistler WFT quantifies errors and operating limits in steady-state and transient maneuvers.
2. Theoretical Background and Vehicle Dynamics Modeling
Model-based virtual sensing estimates tire–road forces () without the cost and integration requirements of dedicated dynamometers [4,6,9].
The eight-degree-of-freedom quadricycle model describes longitudinal, lateral, and yaw motion, four-wheel rotations, and steering [9]. It assumes a rigid chassis and lumped masses, approximates suspension compliance and damper transients through quasi-static load transfer, and neglects tire relaxation length [2,9,11].
2.1. Data Acquisition and Sensor Instrumentation
Tests were performed using a front-wheel-drive Mercedes-Benz CLA 250 (Mercedes-Benz AG, Stuttgart, Germany) [12]. Data acquisition was coordinated by a MoTeC ACL3 logger (MoTeC Pty Ltd., Victoria, Australia) and two SVIM modules. The Race Technology Speedbox INS provided longitudinal and lateral acceleration, vehicle velocity, and angular-rate signals at 200 Hz. Additional sensors included linear potentiometers and a steering-angle sensor for monitoring suspension travel and driver inputs.
2.2. Reference Wheel Force Measurement
The Kistler RoaDyn S625 WFT (Kistler Group, Winterthur, Switzerland) measures rim strain with integrated load cells and transforms rotating signals into fixed chassis coordinates [3,12]. The Kistler system provided reference longitudinal (Fx), lateral (Fy), and vertical (Fz) wheel-force signals. The measurement data were transmitted to the Kistler onboard unit through a 1 kHz Ethernet interface and subsequently forwarded to the data-acquisition system via CAN. The specified full-scale accuracy of the force channels was below 1%.
3. Wheel Force Estimation Methods
3.1. Overview of Alternative Wheel Force Estimation Formulations
Alternative formulations include two-stage rotational-dynamics/EKF estimators that separate longitudinal forces from planar state reconstruction, and second-order sliding-mode observers that reject parameter uncertainty but require chattering suppression. Kinematic sensor-fusion observers avoid tire-model dependence but remain sensitive to bias and low-excitation drift. Neural-network approaches approximate cornering stiffness but require extensive training data.
TRICK was selected because its eight-degree-of-freedom formulation enables wheel-specific force estimation, while its modular structure allows straightforward implementation within the available measurement and analysis environment [9,10].
3.2. The Selected TRICK Method and the Reasoning Behind It
The framework assumes rigid-body, lumped-mass chassis dynamics, quasi-static suspension load transfer, and instantaneous tire-force responses to slip and normal-load changes, neglecting relaxation length [2,9,13].
Fixed parameters are total mass , wheelbase , track widths , center-of-gravity height , wheel inertia , and aerodynamic coefficients. The investigated parameters were body longitudinal and lateral accelerations (), yaw rate (), individual wheel angular speeds (), longitudinal velocity (), steering angle (), and brake line pressure ().
Standstill offsets correct sensor misalignment and static pitch/roll before force computation [9]:
where is gravitational acceleration; are the zero-velocity offsets; and are the corrected body accelerations [9].
3.3. The Subsystems and Limitations of the TRICK Method
Three consecutive modules estimate normal, longitudinal, and lateral contact forces [9].
Vertical Force Estimation ():
For the front-left (FL), front-right (FR), rear-left (RL), and rear-right (RR) wheels, normal load combines static weight, longitudinal and lateral load transfer, and aerodynamic downforce [2,9,11]:
Here, and are the static axle loads; and and are the center-of-gravity distances to the front and rear axles. Longitudinal load transfer is [2,11]
Lateral load transfer is divided by the front and rear roll stiffness fractions ( and ) [11,14]:
Aerodynamic axle downforces depend quadratically on longitudinal velocity [2,11]:
where is air density and are the axle-specific downforce coefficients.
Longitudinal Force Estimation ():
The net longitudinal force balances inertia and aerodynamic resistance [2,9]:
where . FWD driving and braking require different force allocations [9]:
- Driving Regime (): Front-wheel traction is allocated by instantaneous normal-load shares. The unpowered rear wheels contribute rolling resistance and rotational inertia [9]:where is the dynamic rolling radius, the effective wheel inertial force, and the rolling resistance [2,9].
- Braking Regime (): Decelerating force is allocated to all four wheels in proportion to their instantaneous normal loads [9]:
Lateral Force Estimation ():
Axle lateral forces (, ) follow planar equilibrium using lateral and yaw acceleration () [2,4,9]:
where is yaw inertia. Assuming symmetric wheel characteristics, each axle’s lateral force is divided in proportion to dynamic normal loads [9]:
4. Validation Method
Tests on dry asphalt at Jakabszállás Airport comprised acceleration, hard braking, a 100 m-radius skid pad, and dynamic slalom. ABS and ESP were disabled. Vehicle parameters (; ) were fixed before testing. The Speedbox INS supplied body accelerations () and yaw rate (); the Kistler RoaDyn WFT supplied reference forces () and wheel speeds at 1 kHz. Equations (1) and (2) corrected sensor inclination using an initial 3-s static window before each run. The estimation equations were implemented as calculation channels in MoTeC i2 Pro and evaluated synchronously with the recorded measurement data. The Kistler force channels were used exclusively as reference measurements for validation and did not enter the force-estimation equations.
5. Discussion
Correlation analysis compared estimated and measured forces separately by component and maneuver to distinguish the effects of different physical mechanisms and model assumptions [12,15].
5.1. Vertical Force Estimation
At rest, with zero longitudinal and lateral acceleration, measured and estimated normal forces differed only slightly, supporting the static axle-load formulation.
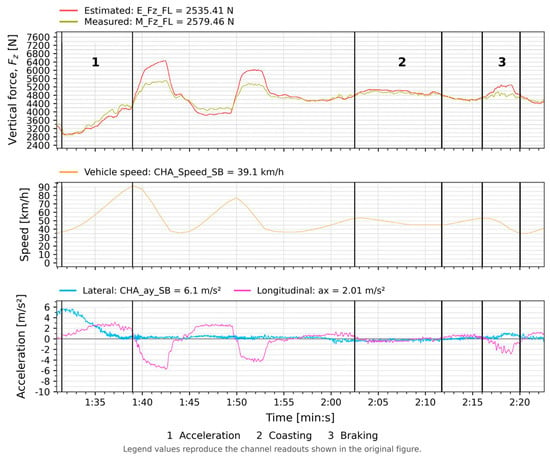
Acceleration, coasting, and braking were evaluated separately. The estimator tracked moderate load changes, but intense braking exposed limitations of quasi-static load transfer in representing suspension elasticity and rapid body pitch.
During steady-state circular tests, vertical-force errors increased with speed and lateral load transfer, reflecting the simplified roll and compliance representation.
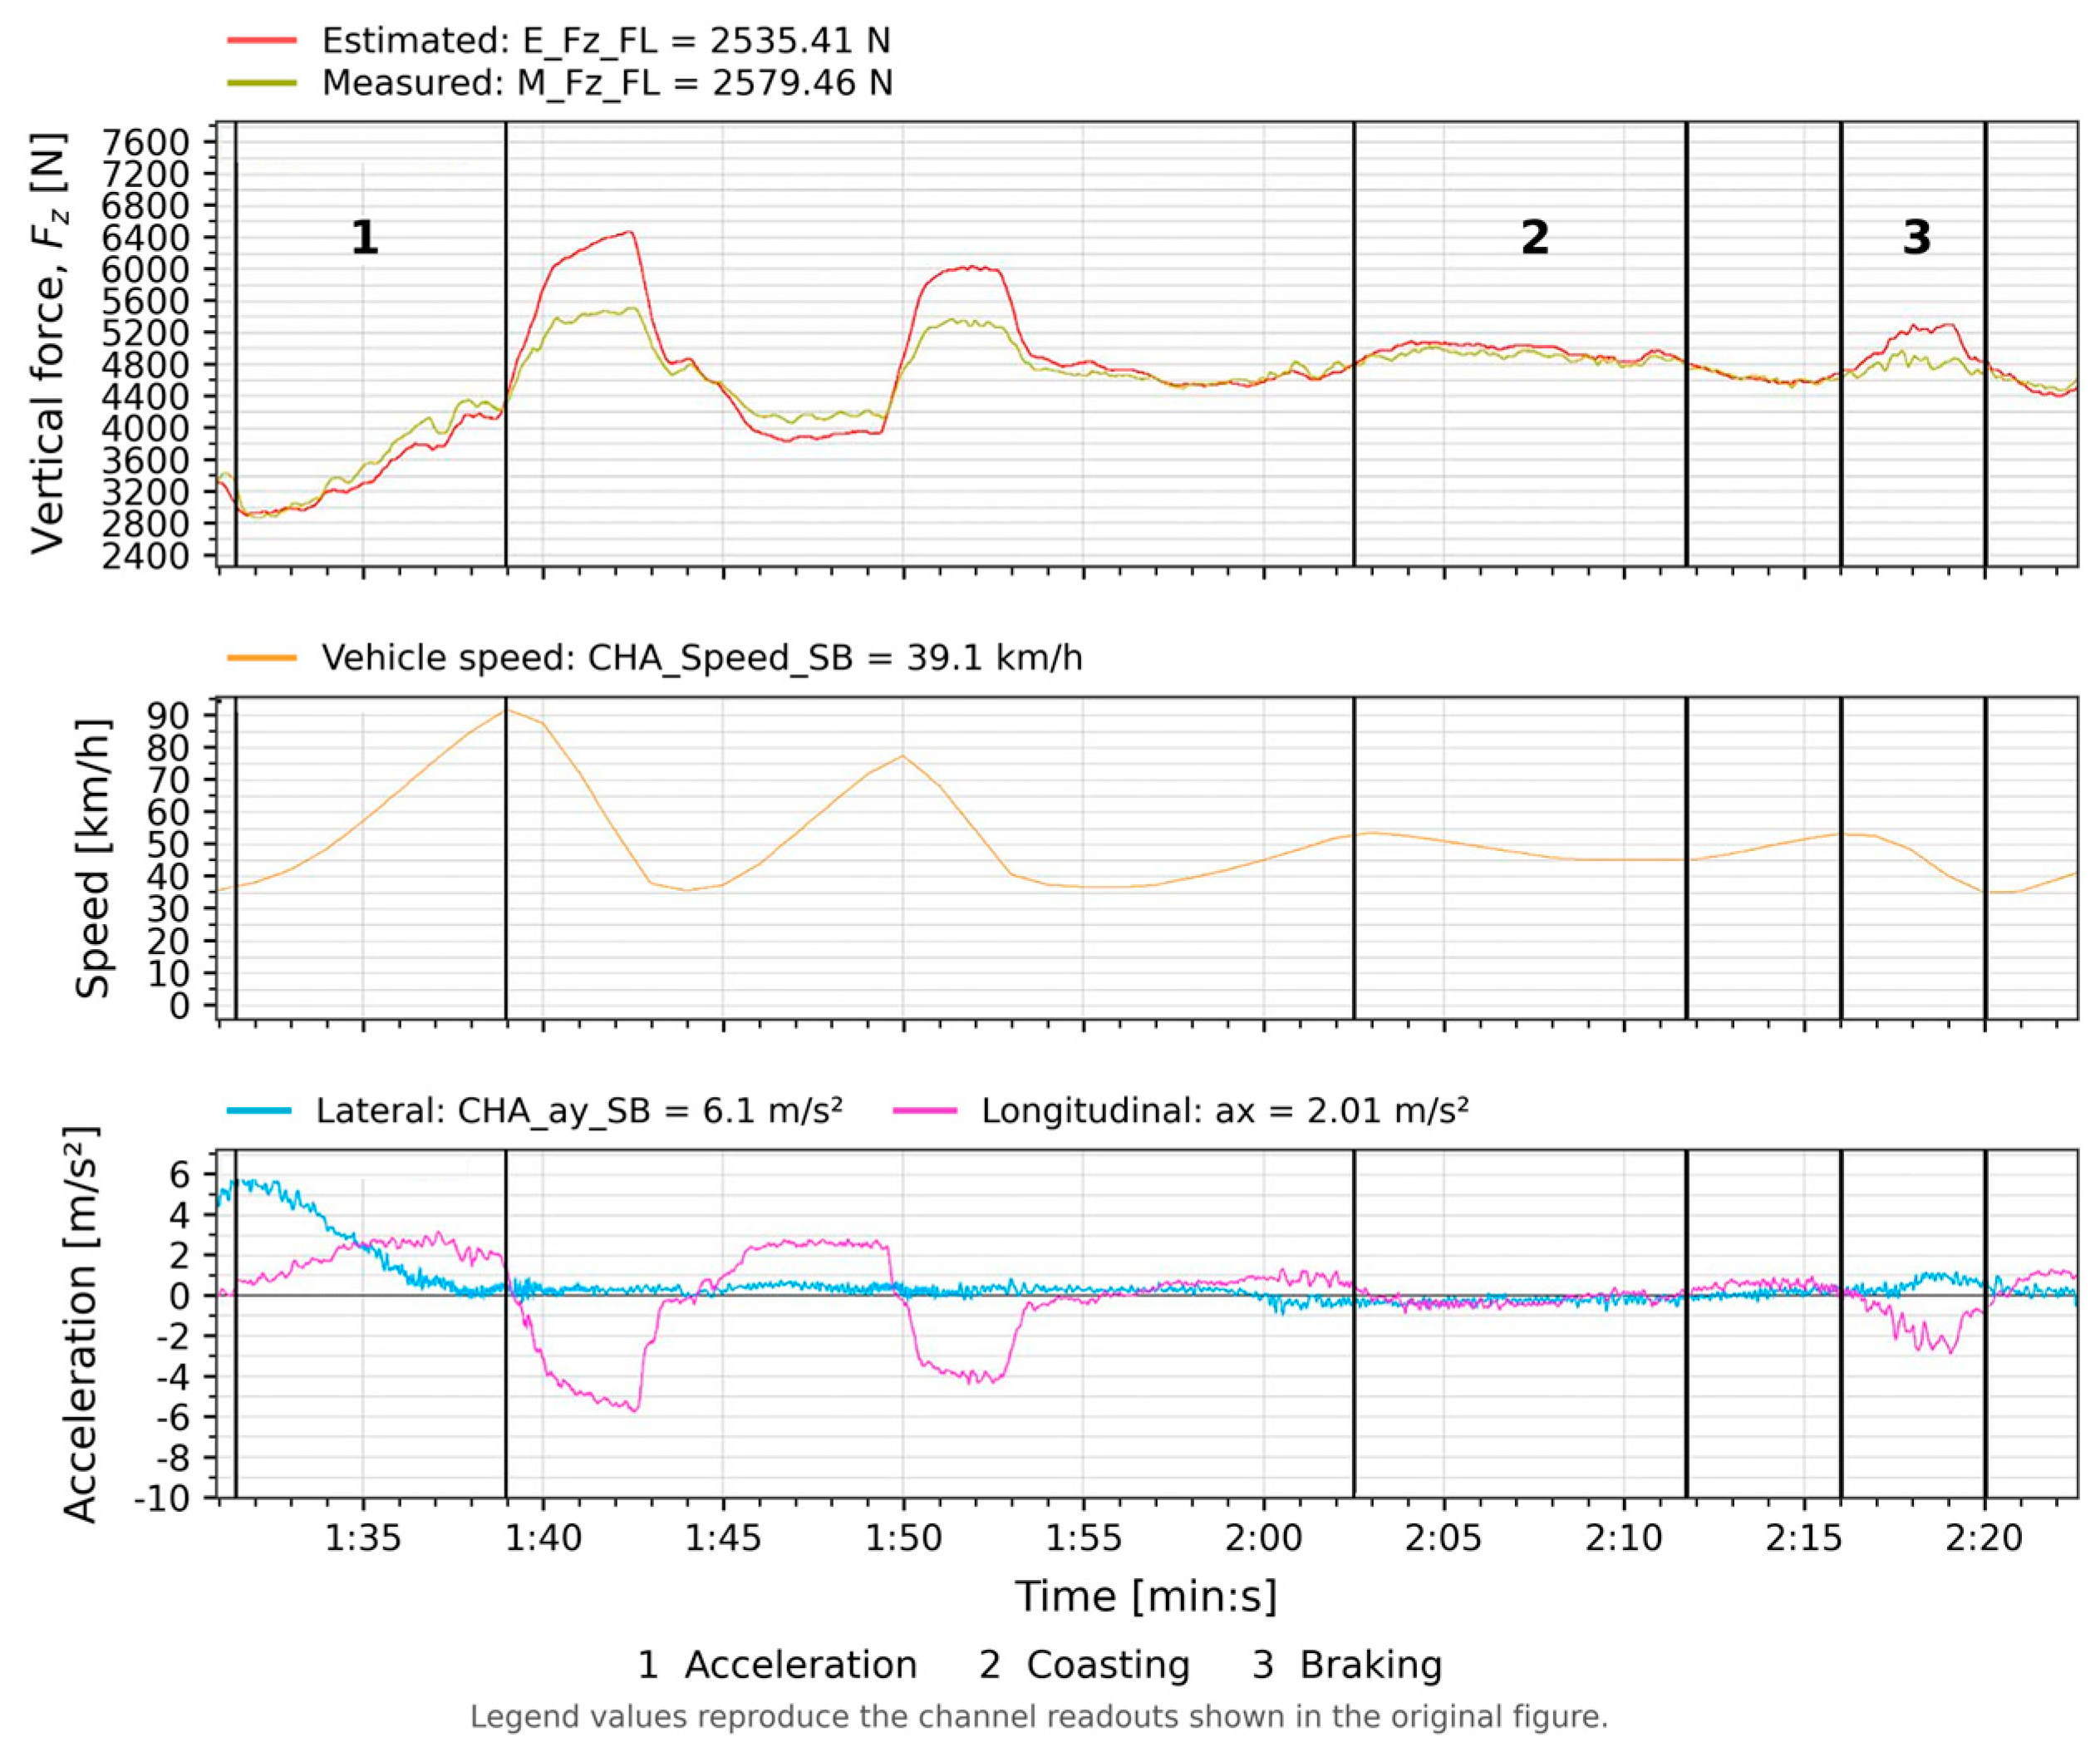
Figure 1 compares front-left vertical force () during acceleration, coast-down, and braking. Agreement was closest during moderate changes; suspension pitch and damper deflection contributed to discrepancies at braking peaks.
Figure 1.
Measured (Kistler WFT, yellow curve) versus estimated (TRICK, red curve) dynamic vertical contact force () on the front-left wheel during longitudinal acceleration, coasting, and braking phases (51 s–53 s), accompanied by vehicle speed and acceleration profiles.
5.2. Lateral Force Estimation
Steady-state circular and dynamic cornering tests showed that estimated lateral forces followed the measured direction and timing but differed in amplitude.
Larger errors at negative lateral acceleration suggest that axle-load symmetry does not hold equally in both turning directions, potentially because of weight distribution, suspension geometry, or tire asymmetry.
Slalom estimates followed the main trends at near-constant speed but became less accurate as lateral acceleration increased. Errors diminished at lower speed, indicating sensitivity to speed-dependent rolling, inertial, or aerodynamic parameters.
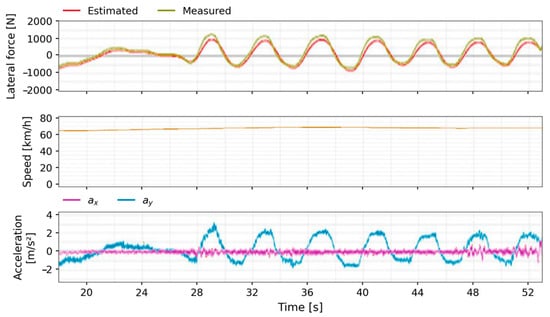
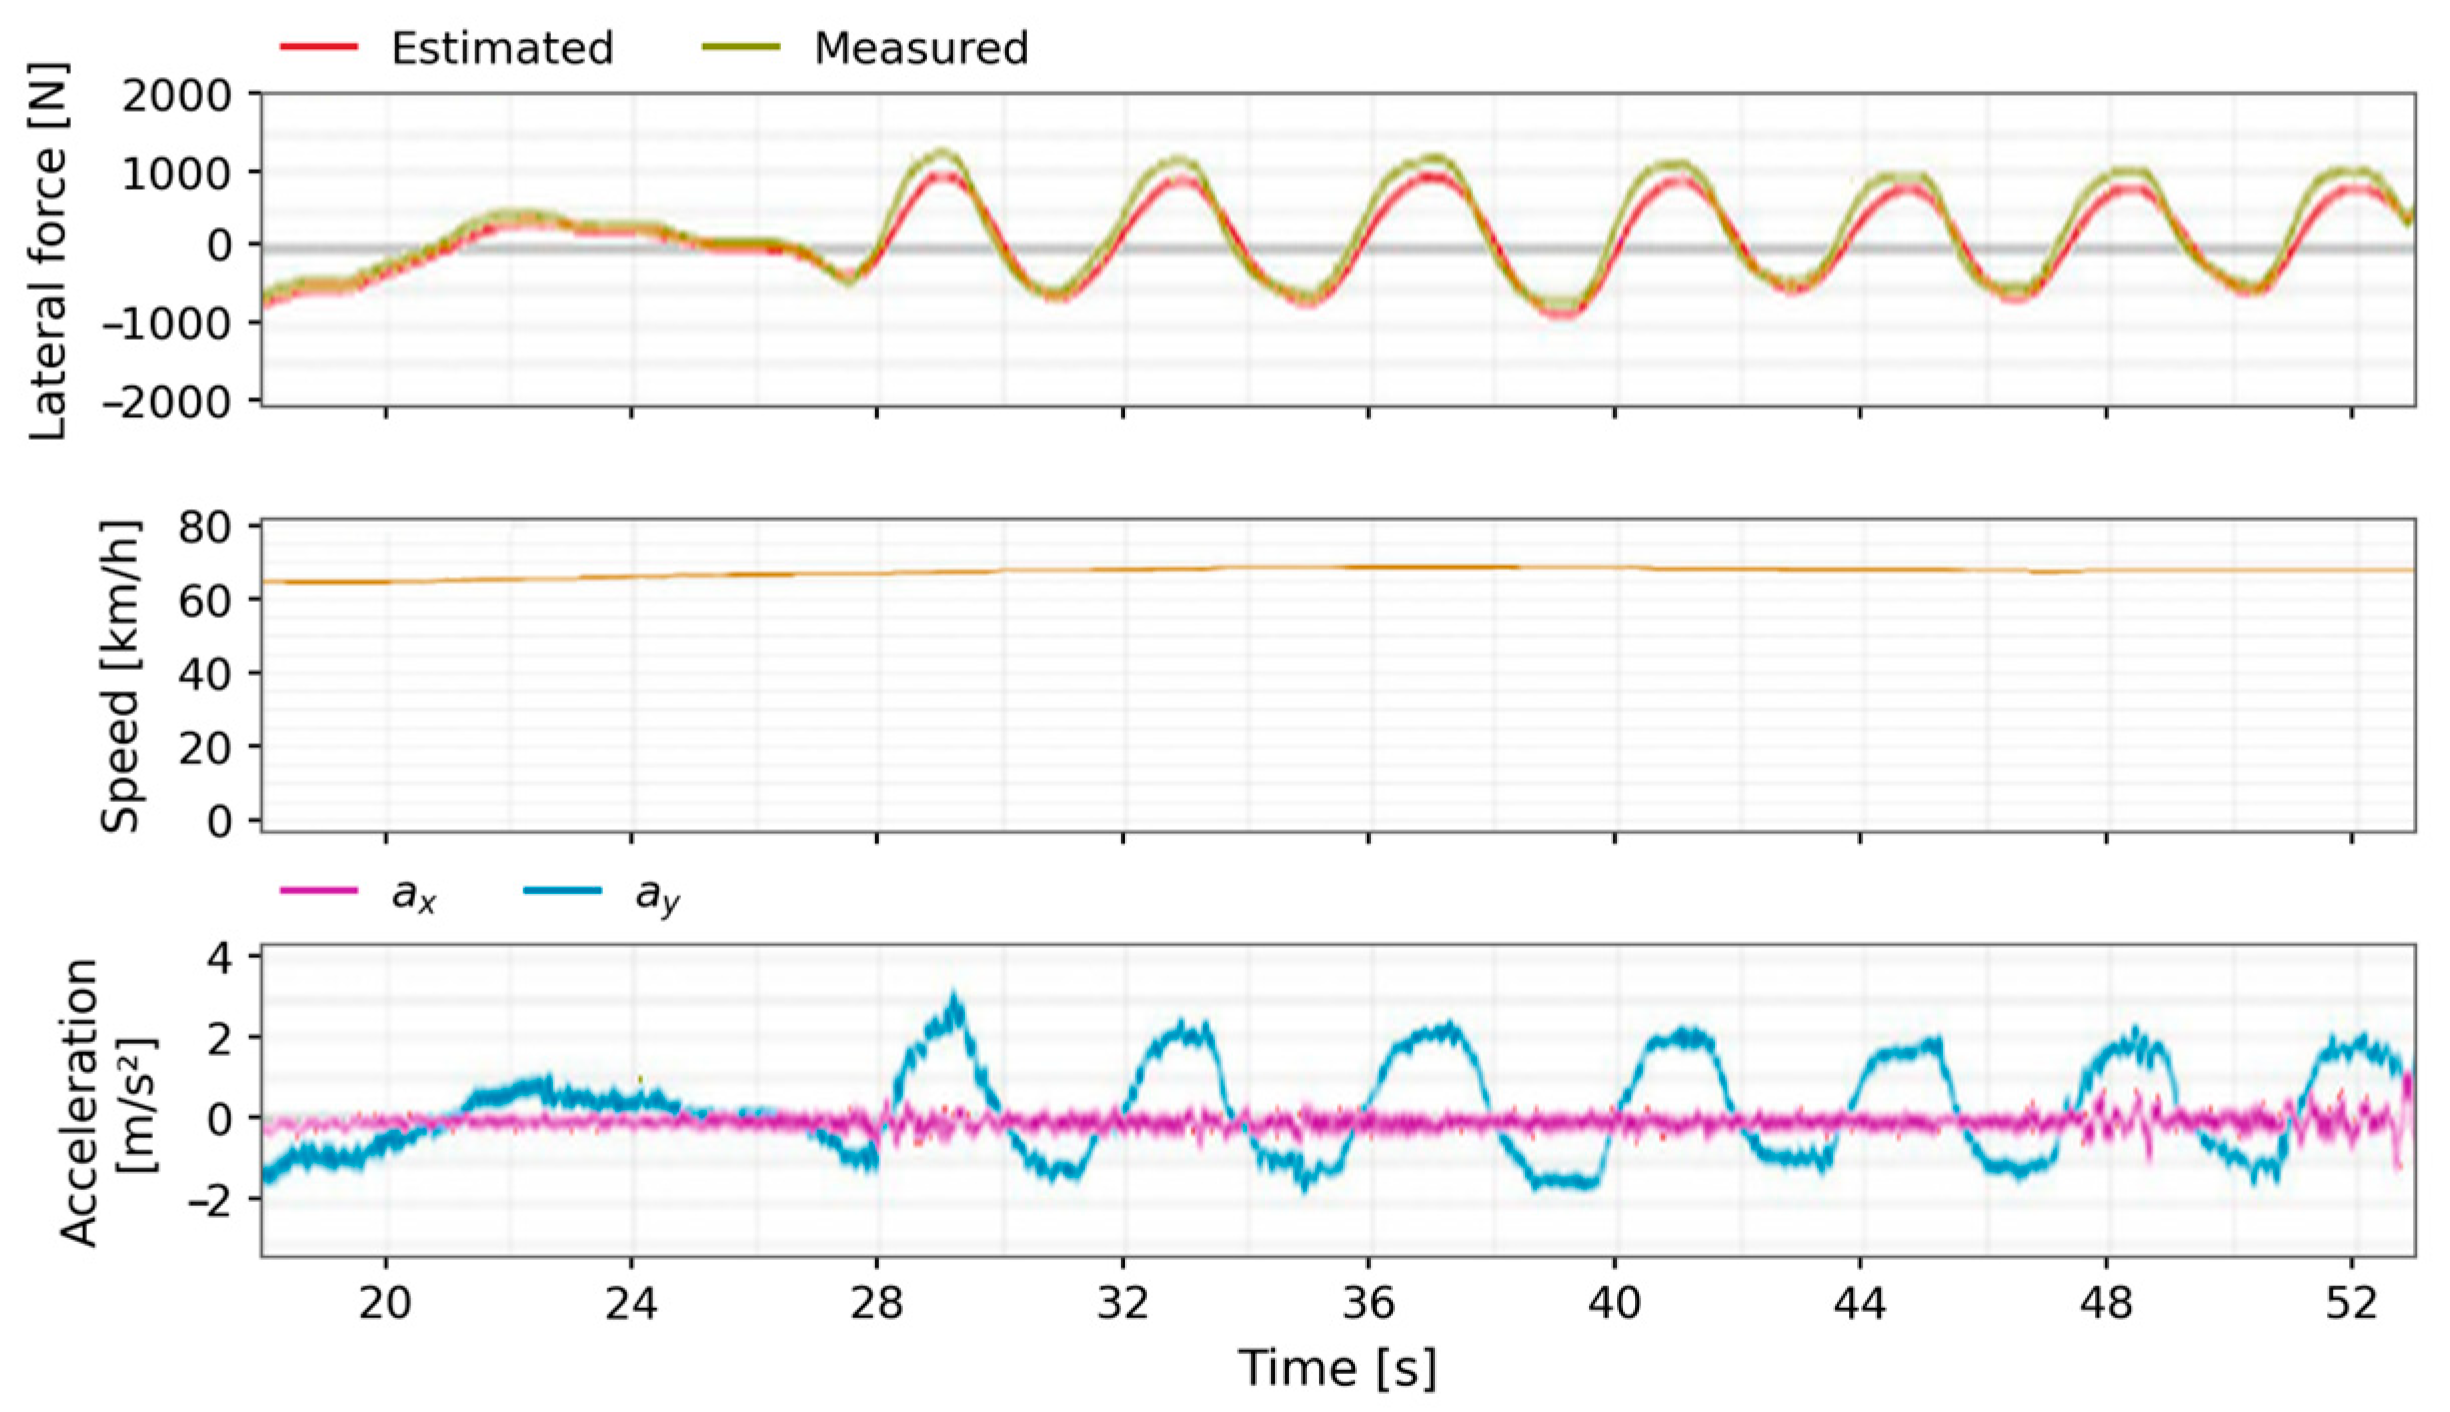
Figure 2 shows that the lateral estimator follows slalom frequency, phase, and directional reversals. Agreement deteriorates above , with amplitude divergence at extrema attributed to unmodelled tire load degressivity.
Figure 2.
Comparison of measured (Kistler WFT, yellow curve) and estimated (TRICK, red curve) lateral contact force () during a dynamic slalom maneuver at constant vehicle speed, illustrating transient directional tracking and peak-amplitude behavior.
5.3. Estimation of Longitudinal Force
Acceleration and braking tests showed that longitudinal estimates reproduced the main waveform and event timing, with amplitude discrepancies during some phases.
Errors were largest during rapid longitudinal or lateral acceleration changes, indicating limitations in the transient model as well as parameter sensitivity. Wheel inertia, rolling resistance, and aerodynamic drag corrections did not fully resolve these deviations.
During dynamic direction changes, measured longitudinal forces remained near zero while estimates exhibited an approximately 100 N offset. This stable bias suggested inaccurate wheel inertia or rolling resistance parameters; coast-down results were also evaluated.
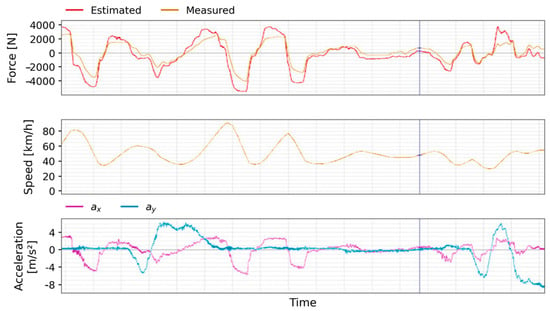
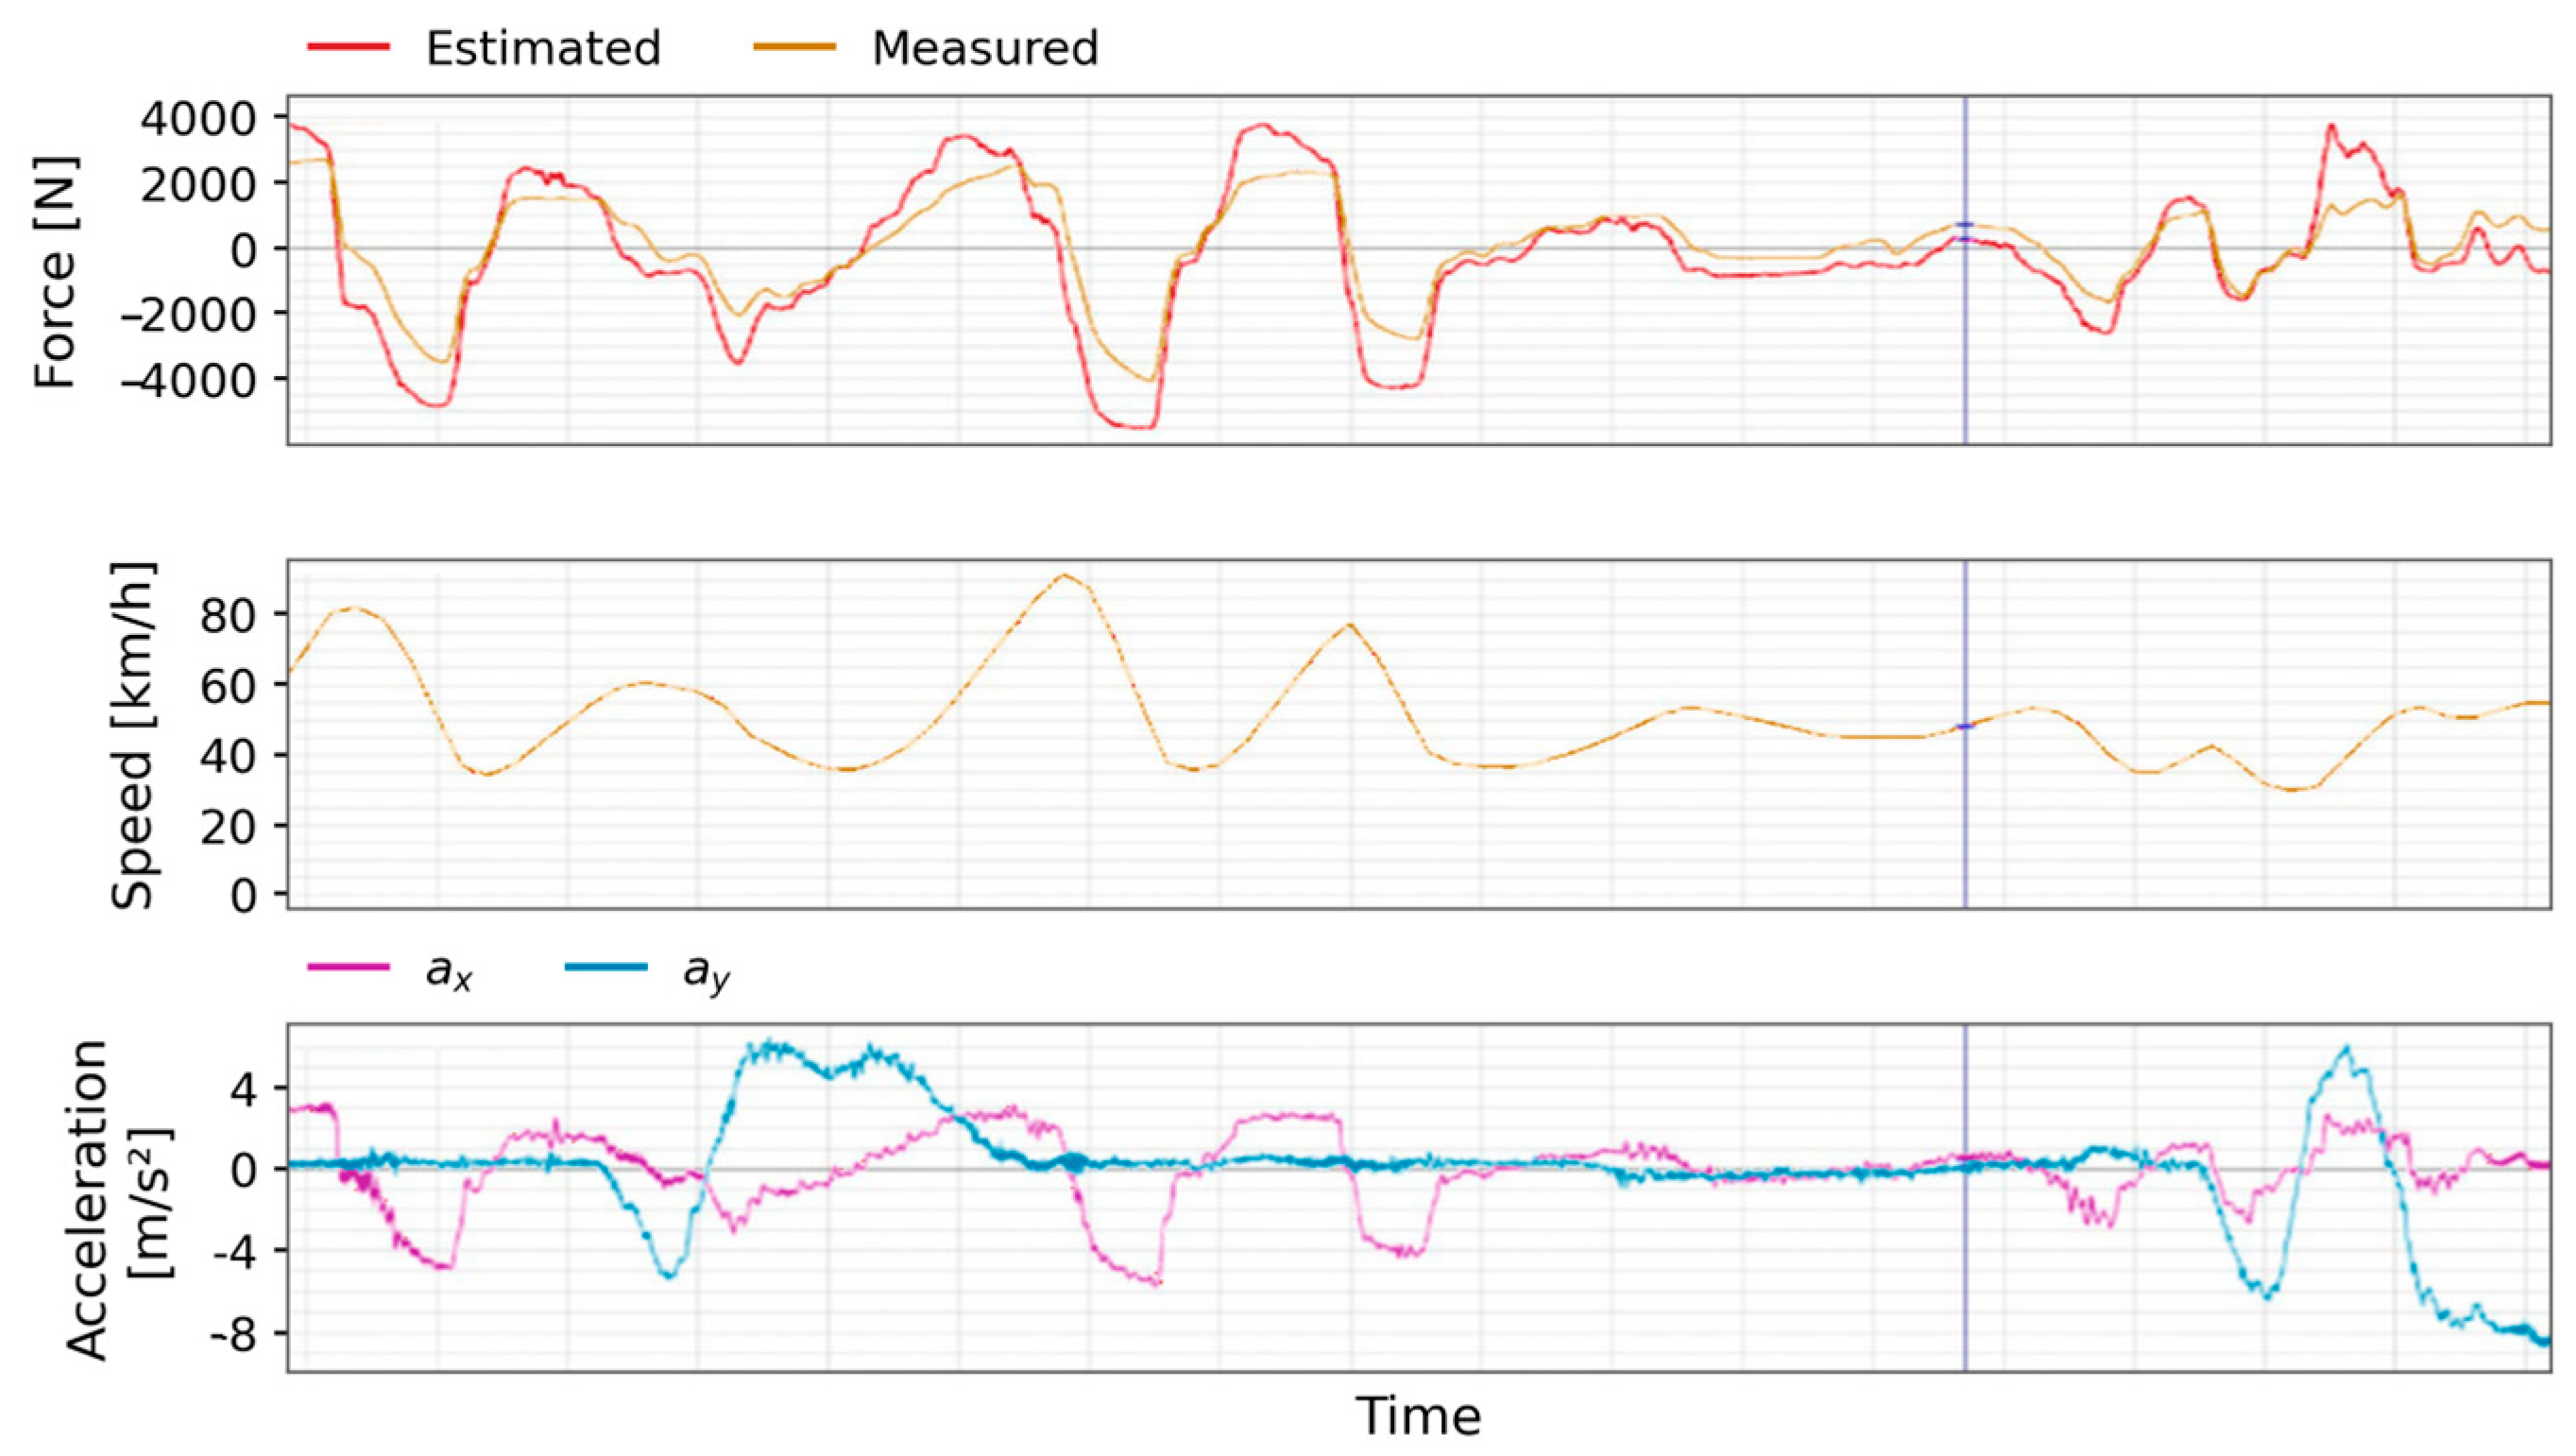
Figure 3 compares longitudinal forces () during acceleration and braking. The model captures braking slope and duration, with the largest deviations at abrupt brake application, where wheel slip acceleration and suspension deflection affect the response.
Figure 3.
Measured versus estimated longitudinal contact force () during acceleration and hard braking maneuvers, highlighting deceleration curve matching and dynamic transient transitions.
5.4. Quantitative Performance and Error Evaluation
Table 1 reports mean, maximum, and minimum deviations from the Kistler reference for each force component and maneuver.
Table 1.
Quantitative validation error metrics comparing TRICK estimations against Kistler WFT reference.
Static vertical-force errors averaged 3 N and peaked at 5 N. During longitudinal maneuvers, the mean was 123 N (5.8%) and the peak 709 N during rapid braking, attributed to pitch and damper effects. On the 100 m-radius skid pad, vertical errors averaged 209 N and reached 915 N at the adhesion limit.
Mean lateral errors were 185 N (5.5%) in steady-state cornering and 260 N (8.9%) in slalom. The 820 N peak coincided with reversals above . Hard-braking longitudinal errors averaged 145 N; pure lateral excitation revealed an approximately 100 N bias linked to rolling resistance and wheel inertia. Relative error remained below 6.5% within the linear handling envelope.
5.5. Physical Interpretation of Model Limitations, Tire Degressivity, and Elastokinematics
The errors in Table 1 illustrate three limitations of the quasi-static model.
Tire Load Degressivity: Equations (16) and (17) allocate axle lateral forces in proportion to normal loads () [9]. For , NRMSE was approximately 5.5%. Above , saturation and load degressivity () reduce outer-tire grip efficiency [1,11]. Neglecting these effects explains the approximately 820 N lateral overestimation at steering extrema (Figure 2).
Elastokinematic Pre-Stress: After severe cornering, the Kistler WFT recorded residual lateral forces of 400–1000 N at rest (). Suspension bushing strain and tire carcass deflection retain forces that the rigid-body model predicts as zero [2,11]. The measured forces dissipated after a change in boundary conditions, observed when driver egress caused suspension rebound.
Inertial Sensitivity: The persistent approximately 100 N longitudinal offset during slalom indicates sensitivity to undriven-wheel inertia and rolling resistance under lateral scrub.
6. Conclusions
Proving-ground comparison with a Kistler WFT showed that the TRICK implementation reproduced the dominant longitudinal, lateral, and vertical force trends. Agreement was strongest in steady-state and moderately dynamic conditions; rapid load transfer, tire nonlinearity, and neglected suspension compliance reduced transient accuracy. The results support cost-effective use for vehicle dynamics investigations and diagnostics within the validated range. Future work should improve transient modeling and extend validation across operating conditions.
Author Contributions
Conceptualization, D.M. and B.S.; methodology, D.M. and B.S.; software, D.M.; validation, D.M. and B.S.; formal analysis, D.M.; investigation, D.M.; resources, D.M. and B.S.; data curation, D.M.; writing—original draft preparation, D.M.; writing—review and editing, D.M. and B.S.; visualization, D.M.; supervision, B.S.; project administration, D.M. and B.S. All authors have read and agreed to the published version of the manuscript.
Funding
This research received no external funding.
Institutional Review Board Statement
Not applicable.
Informed Consent Statement
Not applicable.
Data Availability Statement
The data supporting the findings of this study are available from the corresponding author upon reasonable request.
Conflicts of Interest
The authors declare no conflict of interest.
References
- Bakker, E.; Nyborg, L.; Pacejka, H.B. Tyre Modelling for Use in Vehicle Dynamics Studies; SAE Technical Paper; SAE International: Warrendale, PA, USA, 1987; p. 870421. [Google Scholar] [CrossRef] [Scilit] [PubMed]
- Rajamani, R. Vehicle Dynamics and Control, 2nd ed.; Springer: New York, NY, USA, 2012. [Google Scholar] [CrossRef] [Scilit]
- Rupp, A.; Grubisic, V.; Neugebauer, J. Development of a Multi-Component Wheel Force Transducer—A Tool to Support Vehicle Design and Validation; SAE Technical Paper; SAE International: Warrendale, PA, USA, 1993; p. 930258. [Google Scholar] [CrossRef] [Scilit] [PubMed]
- Doumiati, M.; Victorino, A.C.; Charara, A.; Lechner, D. Onboard Real-Time Estimation of Vehicle Lateral Tire–Road Forces and Sideslip Angle. IEEE/ASME Trans. Mechatron. 2011, 16, 601–614. [Google Scholar] [CrossRef] [Scilit]
- Jin, X.; Yin, G. Estimation of lateral tire–road forces and sideslip angle for electric vehicles using interacting multiple model filter approach. J. Frankl. Inst. 2015, 352, 686–707. [Google Scholar] [CrossRef] [Scilit]
- Doumiati, M.; Charara, A.; Victorino, A.; Lechner, D. Vehicle Dynamics Estimation using Kalman Filtering: Experimental Validation; John Wiley & Sons: Hoboken, NJ, USA, 2012. [Google Scholar]
- Gadola, M.; Chindamo, D.; Romano, M.; Padula, F. Development and validation of a Kalman filter-based model for vehicle slip angle estimation. Veh. Syst. Dyn. 2014, 52, 68–84. [Google Scholar] [CrossRef] [Scilit]
- Xu, N.; Askari, H.; Huang, Y.; Zhou, J.; Khajepour, A. Tire Force Estimation in Intelligent Tires Using Machine Learning. IEEE Trans. Intell. Transp. Syst. 2022, 23, 3565–3574. [Google Scholar] [CrossRef] [Scilit]
- Farroni, F. T.R.I.C.K.-Tire/Road Interaction Characterization & Knowledge—A tool for the evaluation of tire and vehicle performances in outdoor test sessions. Mech. Syst. Signal Process. 2016, 72–73, 808–831. [Google Scholar] [CrossRef] [Scilit]
- Dell’Annunziata, G.N.; Farroni, F.; Timpone, F.; Lenzo, B. T.R.I.C.K. 2.0: Enhanced Vehicle Dynamics Analysis and Estimation Harnessing Advanced Vehicle Sensors. SAE Int. J. Veh. Dyn. Stab. NVH 2025, 9, 399–421. [Google Scholar] [CrossRef] [Scilit]
- Milliken, W.F.; Milliken, D.L. Race Car Vehicle Dynamics; SAE International: Warrendale, PA, USA, 1995. [Google Scholar]
- Widner, A.; Tihanyi, V.; Tettamanti, T. Framework for Vehicle Dynamics Model Validation. IEEE Access 2022, 10, 35422–35436. [Google Scholar] [CrossRef] [Scilit]
- Do, J.; Hyun, D.; Han, K.; Choi, S.B. Real-time estimation of longitudinal tire stiffness considering dynamic characteristics of tire. Mechatronics 2024, 98, 103120. [Google Scholar] [CrossRef] [Scilit]
- Brayshaw, D.L.; Harrison, M.F. Use of Numerical Optimization to Determine the Effect of the Roll Stiffness Distribution on Race Car Performance. Proc. Inst. Mech. Eng. D J. Automob. Eng. 2005, 219, 1141–1151. [Google Scholar] [CrossRef] [Scilit]
- Sargent, R.G. Verification and validation of simulation models. In Proceedings of the 2010 Winter Simulation Conference; IEEE: New York, NY, USA, 2010; pp. 166–183. [Google Scholar] [CrossRef] [Scilit]

Disclaimer/Publisher’s Note: The statements, opinions and data contained in all publications are solely those of the individual author(s) and contributor(s) and not of MDPI and/or the editor(s). MDPI and/or the editor(s) disclaim responsibility for any injury to people or property resulting from any ideas, methods, instructions or products referred to in the content. |
© 2026 by the authors. Licensee MDPI, Basel, Switzerland. This article is an open access article distributed under the terms and conditions of the Creative Commons Attribution (CC BY) license.