


Abstract
Quantum capacitance is an essential metric for evaluating the performance of electrode materials for supercapacitors in transition metal alloys, where the density of states (DOS) near the Fermi level is critical for charge-storage capacity. A novel approach to forecasting the quantum capacitance of NixCo1−x alloys is presented in this work. This approach predicts the quantum capacitance by combining pattern-learning method with DOS. We used principal component analysis (PCA) to predict the DOS patterns for various alloy compositions of Ni-Co. This was accomplished by applying the density functional theory (DFT) on transition metal alloy (Ni-Co) and machine learning-based pattern-learning method for electronic structures. A linear model using features such as d-orbital occupation, coordination number, and mixing factor predicted the DOS with around 95% accuracy when compared to DFT benchmarks. In this study, the DFT+U method was employed to enhance the precision of d-orbital electronic density of states. The equation , which was evaluated at the electrode material’s surface area, is then used to calculate quantum capacitance from the predicted DOS at the Fermi level. The DOS at the Fermi level is . According to the optimal DOS near the Fermi level, the composition (x = 0.6) achieved a higher Cq of up to 90 µF/cm2 while maintaining better structural stability than the maximum Ni-rich composition. This method provides a computationally cheap alternative for extensive DFT calculations. It is possible to minimize the time needed to design based on DFT supercapacitor electrode material, specifically metal alloys, from several days to a few minutes. The findings lay the basis for future developments in energy storage applications by demonstrating the integrated use of machine learning and quantum mechanics in materials science.
1. Introduction
Supercapacitors are necessary for electric automobiles and renewable energy applications due to their elevated power density and quick charge/discharge cycles relative to conventional batteries [1,2]. The performance of a supercapacitor is controlled by the electronic attributes of its electrode materials. The density of states (DOS) near the Fermi level () plays a primary roll in charge exchange. This shows that electronic structure design is important for advanced storage devices [3,4]. Capacitance and electrochemical stability are common problems with carbon-based and metal oxide materials, despite their widespread usage. Pseudocapacitive qualities, stability, and excellent conductivity make nickel–cobalt (Ni-Co) alloys a favorite [5,6]. The combination of double-layer () and quantum capacitance () results in the total capacitance () of the alloy electrodes. Since is directly proportional to DOS at the Fermi level, [7,8], optimizing Ni-Co composition increases storage capacity by optimizing charge carrier electronic states. First-principles calculations are typically used to forecast these electronic attributes. The Hubbard U correction (DFT+U) method must be employed to precisely account for strong Coulomb interactions between localized d-electrons in Ni and Co, which are usually ignored by traditional DFT [9,10]. The precision of quantum mechanical frameworks is limited to small systems due to their high computational cost. To close this gap, machine learning has been used to expedite material discovery. Instead of predicting the continuous DOS patterns that influence electrochemical behavior, current ML models typically predict static values such as d-band centers [11,12]. A hybrid method combining “pattern learning” and DFT+U calculations is used in this study to predict the of NixCo1−x alloys. Using Principal Component Analysis (PCA) on a large DOS dataset, we identify groups of materials with similar electronic signatures and connect these patterns to local atomic properties such as d-orbital occupancy and coordination numbers.
2. Materials and Methods
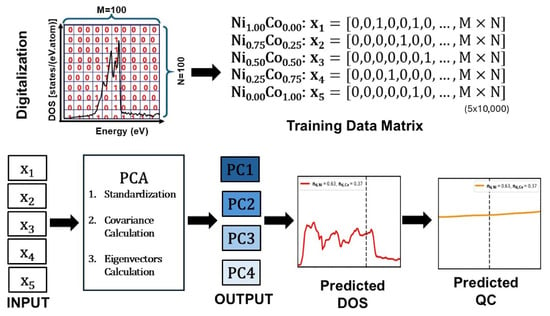
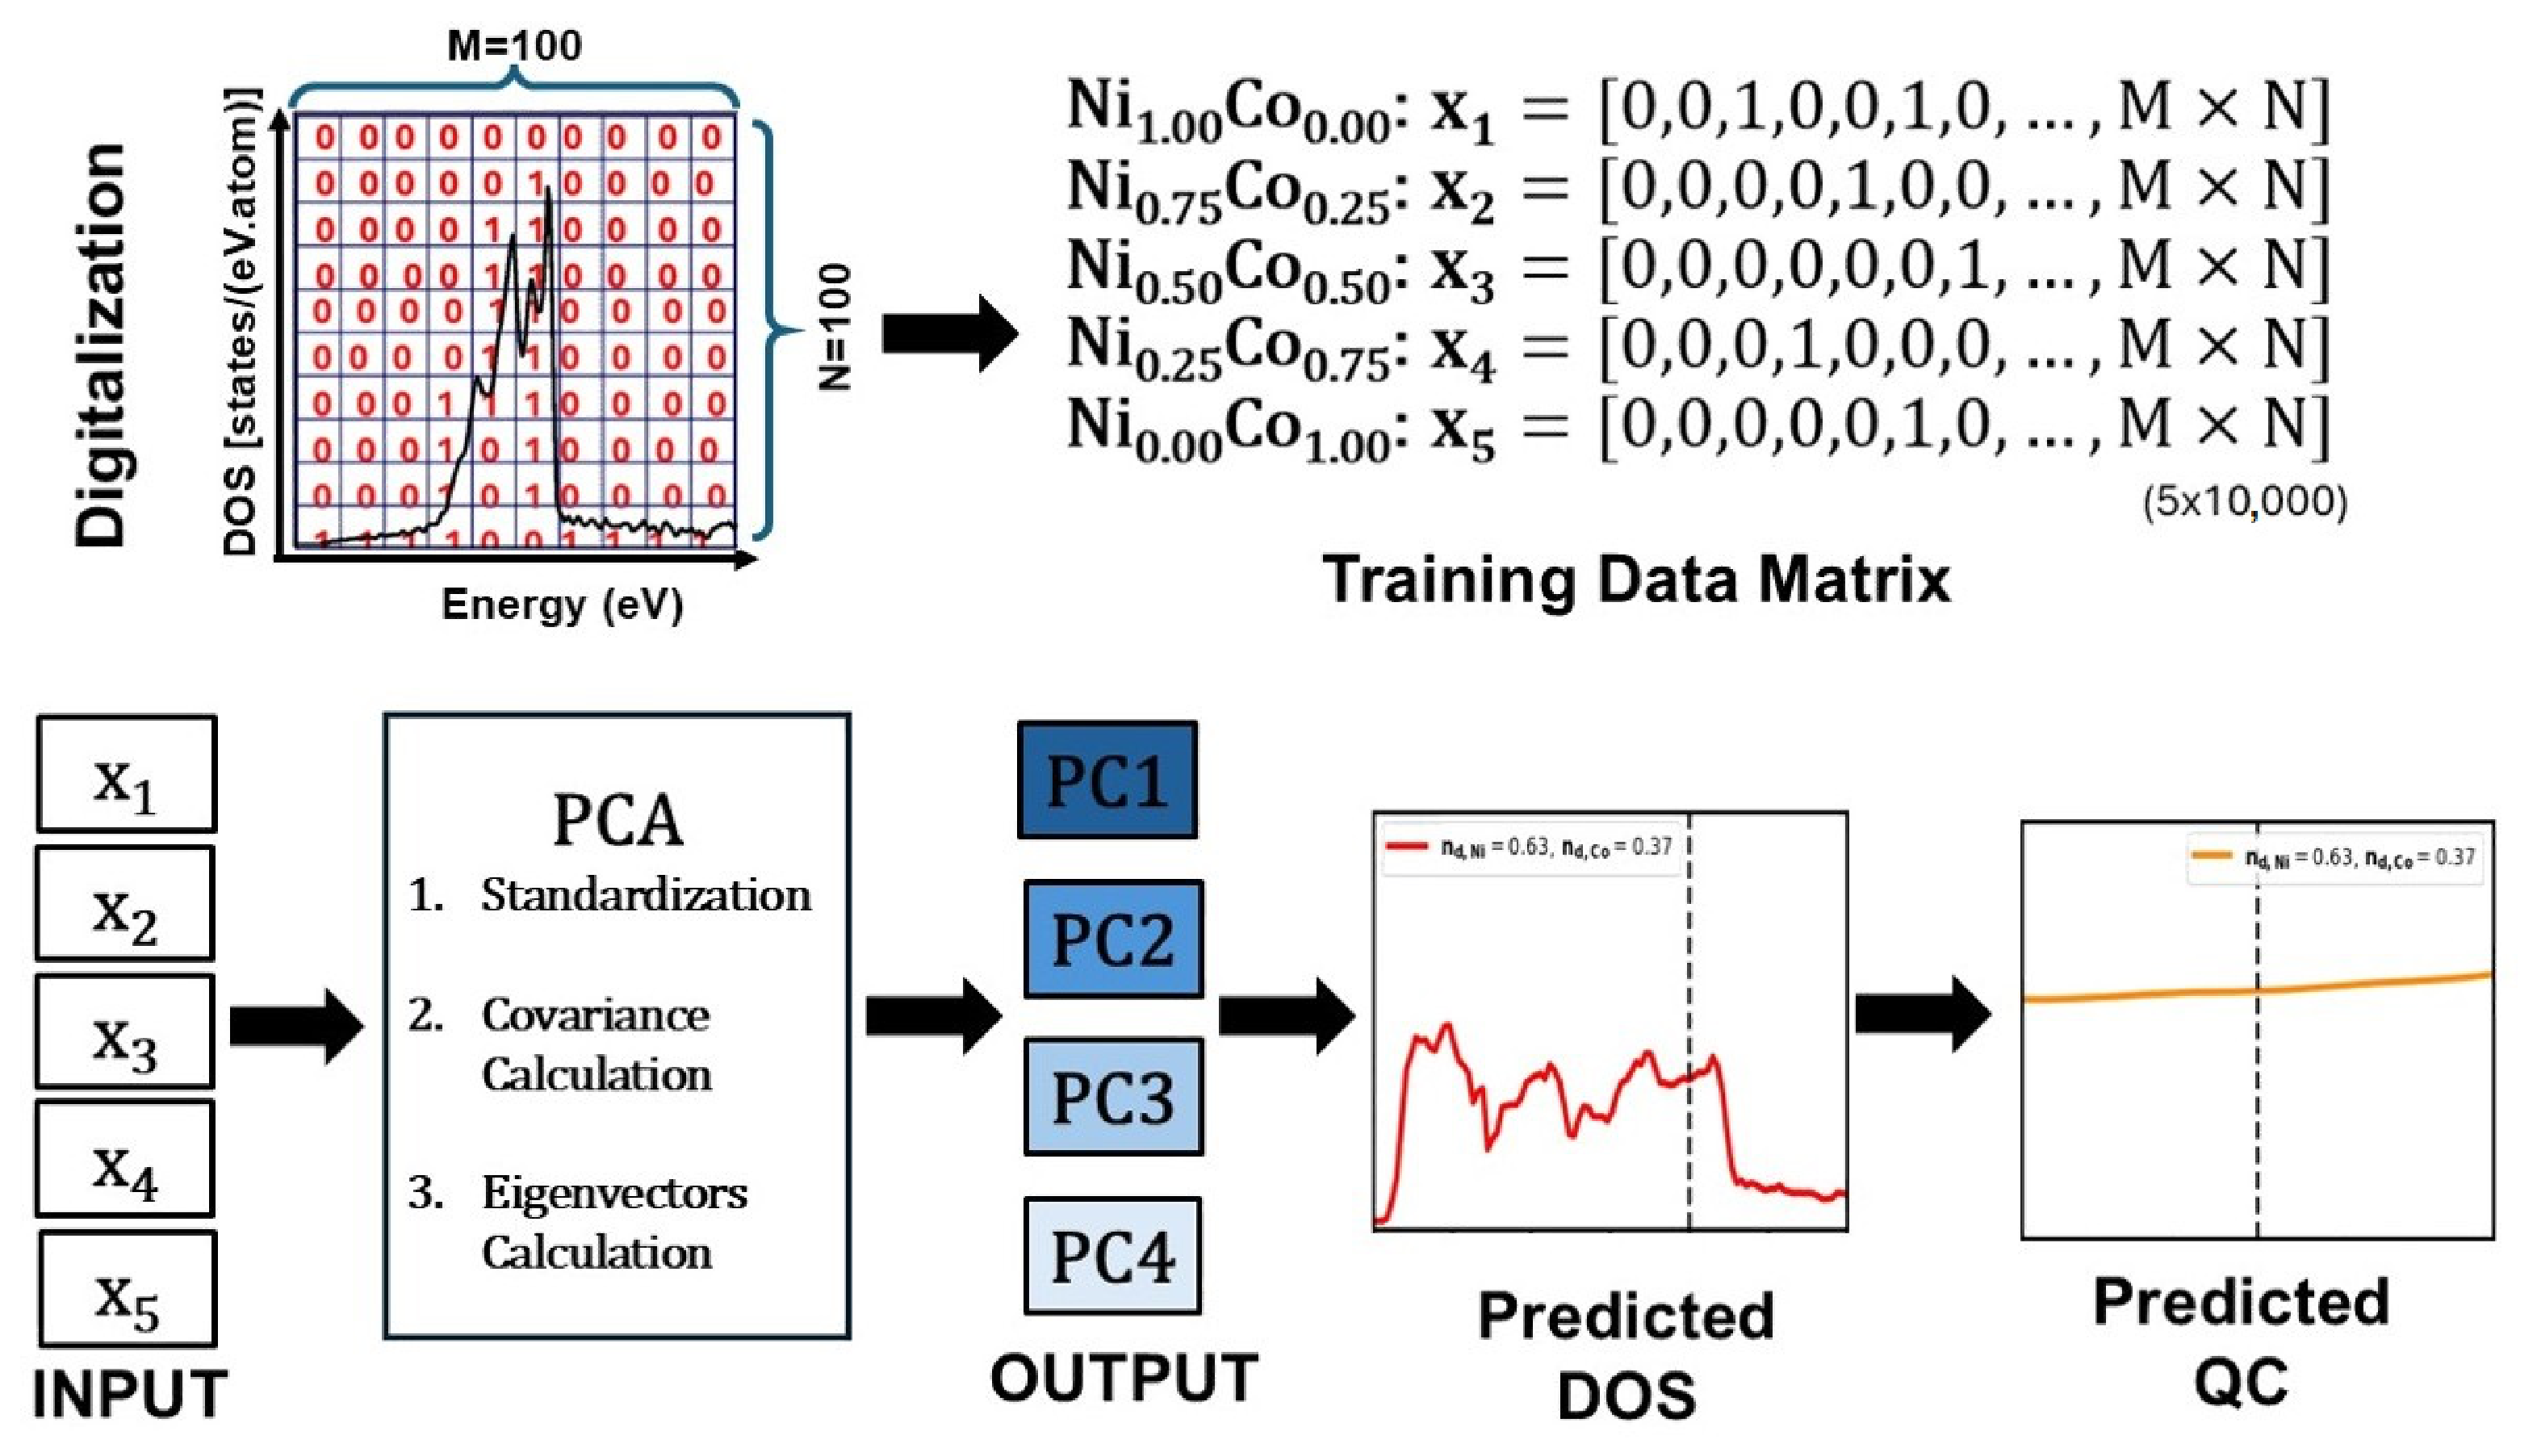
Electronic properties of NixCo1−x alloys were studied using a hybrid DFT+U and PCA-based pattern-learning framework [12] for rapid DOS prediction across 100 compositions. VASP-5.4.4 [13] with PBE-GGA functionals [14] and PAW potentials (520 eV cutoff) were employed. A Monkhorst–Pack grid was used for sampling, and convergence was set at eV for energy and 0.05 eV/Å for forces. Spin-polarized DFT+U [15] (, , eV) addressed localized d-electrons, with Gaussian smearing resolving the DOS near . We employed PCA to reproduce the DOS in a reduced-dimensional domain in an attempt to get closer to the computational scaling of DFT [16]. The training data consisted of DFT-calculated DOS for five anchor compositions (x ). We transformed these DOS curves into image vectors to generate a training matrix . As indicated in Figure 1, we extracted Principal Components (PCs) that represented the dominant DOS features by diagonalizing the covariance matrix . Unseen compositions were predicted by mapping PC coefficients from DOS and atomic descriptors using linear regression. These descriptors include d-orbital occupancy (), mixing factor (), and coordination number (). The reconstruction accuracy () was validated against direct DFT results to ensure a similarity threshold using Equation (1), where is the predicted DOS, is the DFT-calculated DOS, and is the energy interval up to M = 100.
Figure 1.
Schematic diagram of a PCA-based framework for the prediction of DOS and quantum capacitance (QC). This prediction is built on image vectors , , , , and of , , , , and, respectively.
Quantum Capacitance Calculation
The differential quantum capacitance () was derived from the DOS, , using the following relation, Equation (2) [17]:
where is the thermal broadening function at K. The quantum capacitance is calculated from the density of states of the bulk supercell and is reported in units of using Equation (3), where A denotes the surface area of the supercell expressed in . Normalizing the cell-level capacitance by A yields an intrinsic, area-specific quantity that can be compared directly with values reported for surface-dominated systems and two-dimensional materials, in agreement with standard reporting conventions [18]. Expressed in this way, reflects the electronic charge-storage capability per unit surface area and constitutes an intrinsic electronic property derived from the density of states.
3. Results and Discussion
3.1. Crystal Structures and Modeling
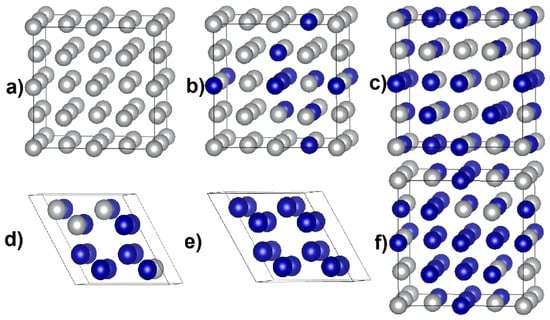
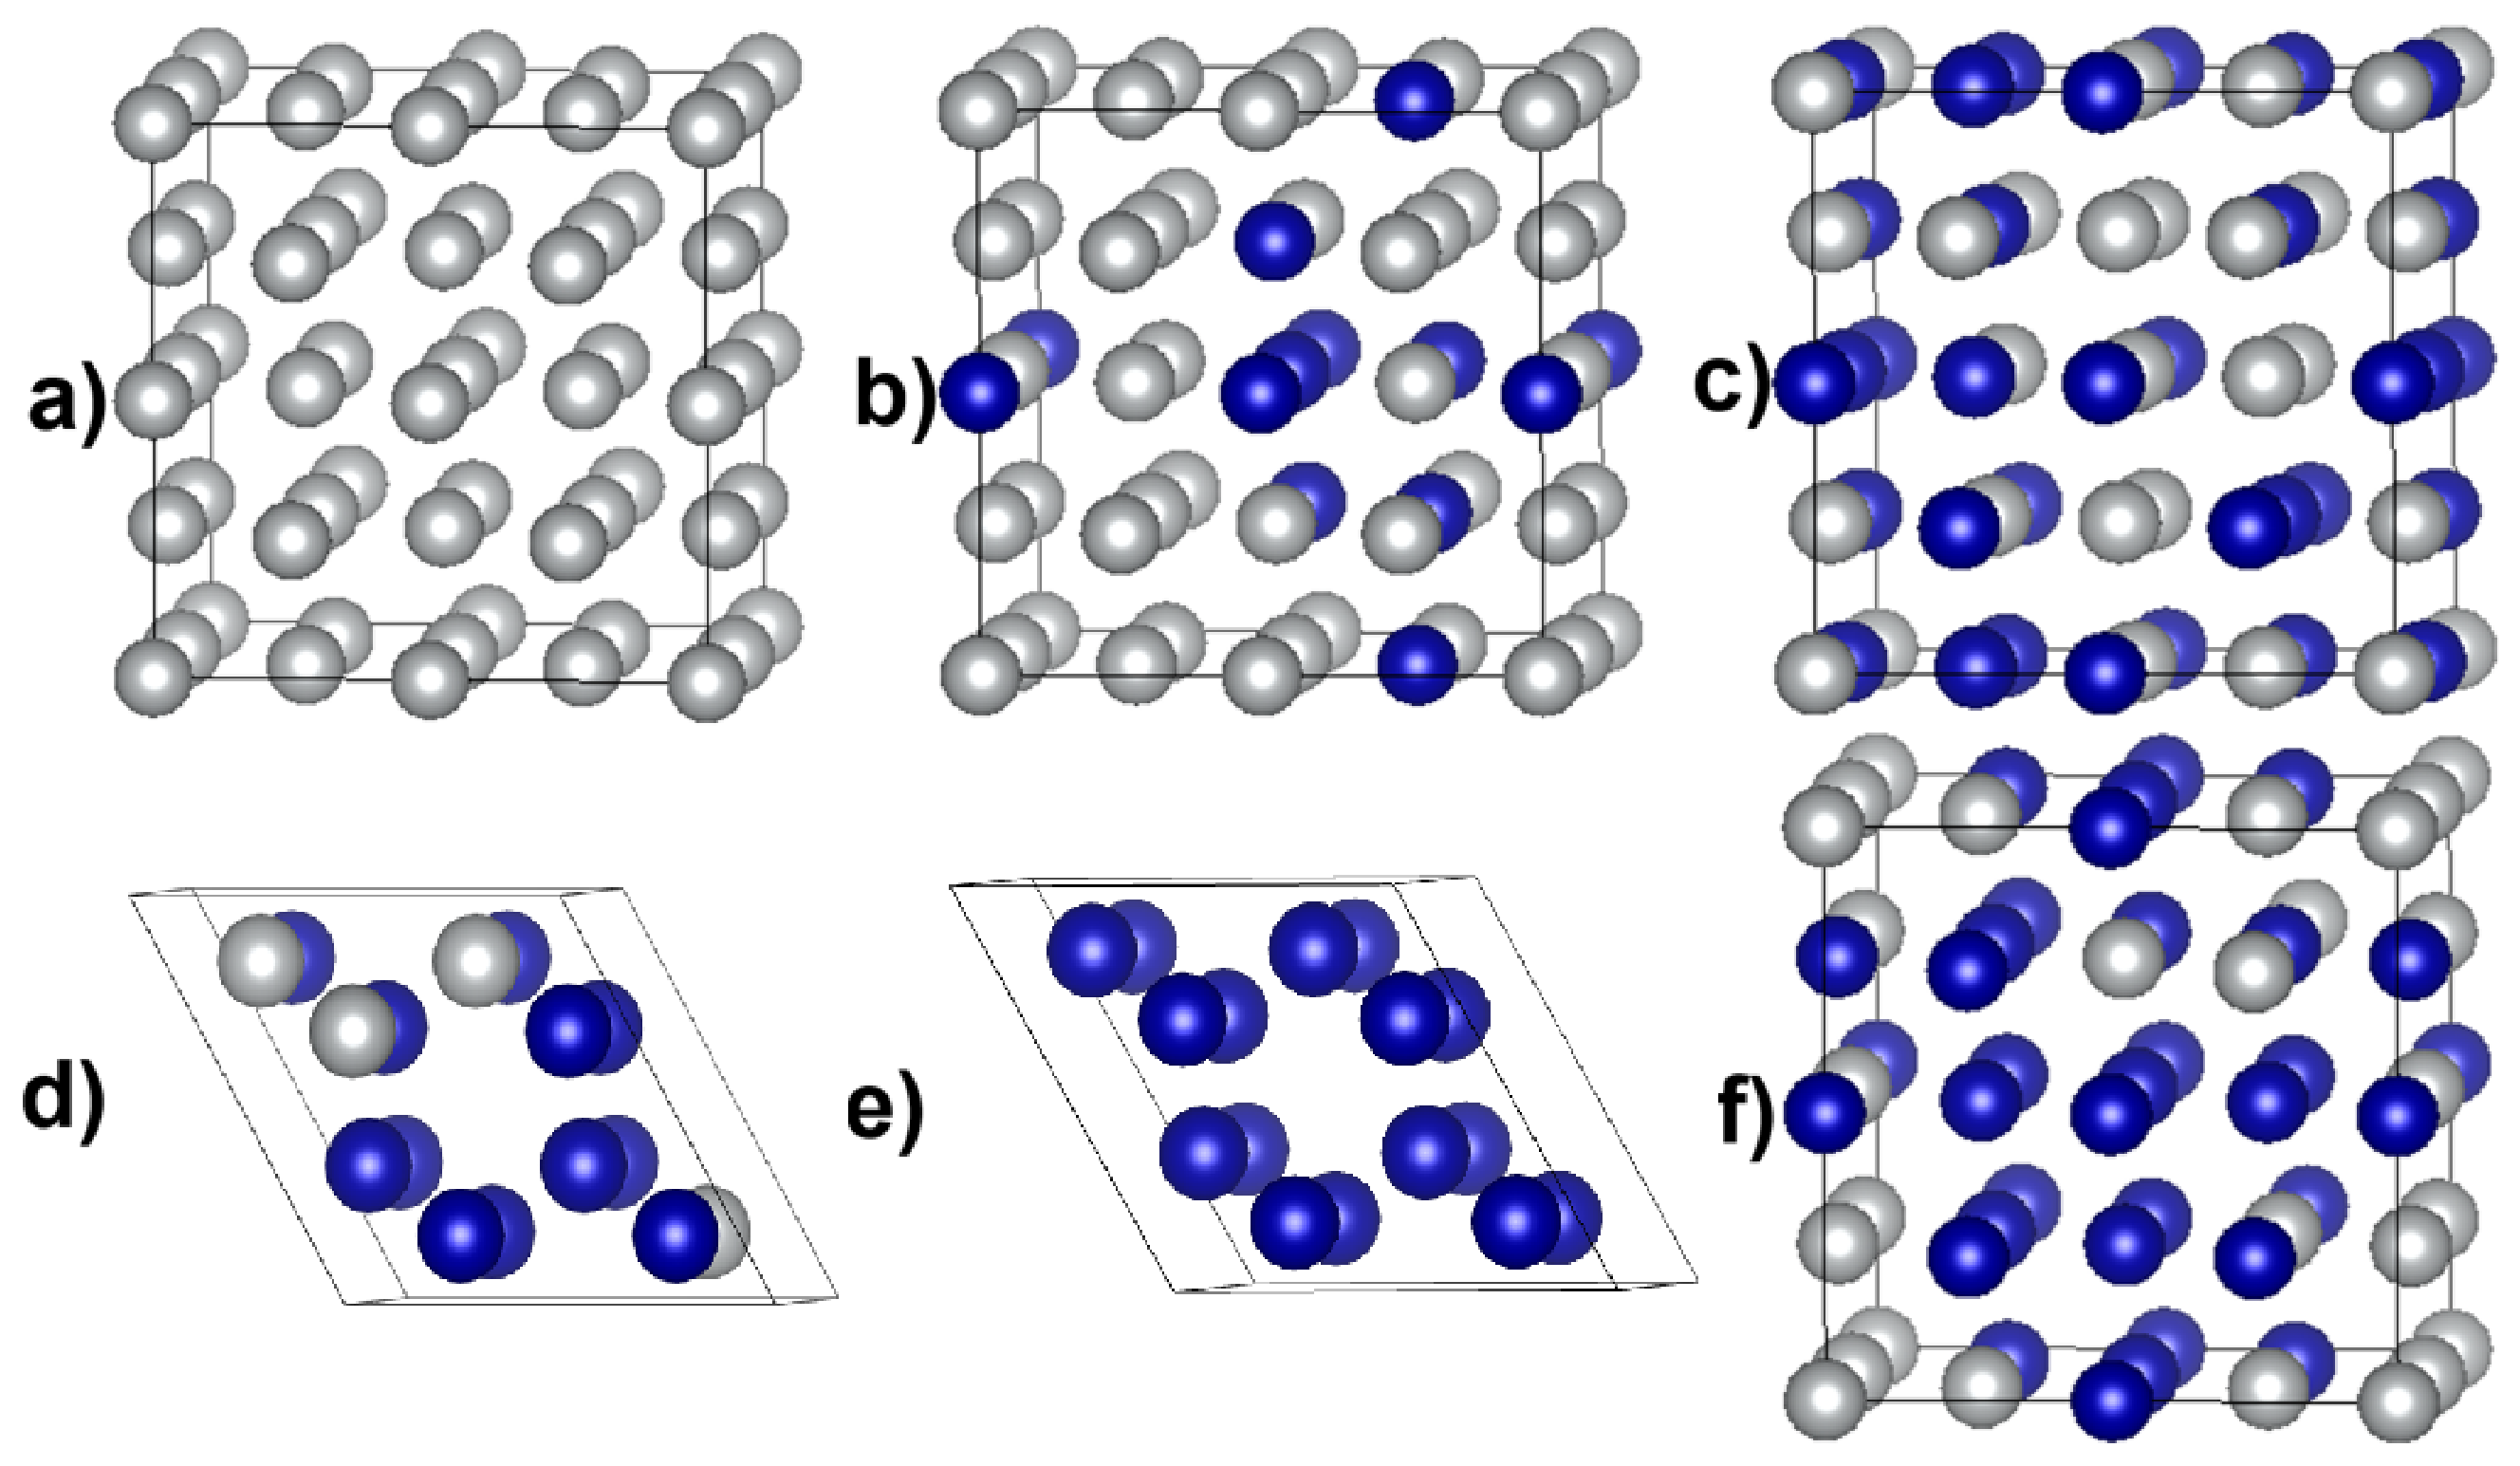
To evaluate the impact of alloying on quantum capacitance (), we modeled NixCo1−x crystals in a face-centered cubic (FCC) and hexagonal close-packed (HCP) lattice as presented in Figure 2.
Figure 2.
FCC and HCP crystal structures of six kinds of the desired NixCo1−x alloys for x . The * is a test alloy. Here, silver circles represent Ni atoms, and blue circles represent Co atoms. Here, (a) pure Ni-metal (FCC), (b) (FCC) alloy, (c) (FCC) alloy, (d) (HCP) alloy, (e) pure Co-metal (HCP), and (f) * (FCC) test alloy are shown.
Pure Ni adopts the face-centered cubic (FCC) structure at ambient conditions, whereas pure Co is hexagonal close-packed (HCP) in its bulk ground state and transforms to FCC only above °C [19]. Here we used an FCC lattice for pure Ni metal, alloy, and alloy. Whereas the pristine Co metal and alloy were modeled as HCP lattices. The percentage of Co determines the crystal lattice structure of Ni-Co alloys; above 70% of Co, the structure will be HCP [20]. The unit cells were expanded into supercells containing 32 atoms for FCC and 16 atoms for HCP primitive crystals to accommodate various stoichiometric ratios, as shown in Figure 2. To replicate the natural randomness of a solid solution, we employed Special Quasirandom Structures (SQS) [21]. This methodology optimizes atom position to correspond to the multi-atomic correlation functions of an ideal random alloy, preventing artificial periodicity. Compositions varied from pure Ni () to pure Co (), which included a test alloy * (FCC) to evaluate the pattern-learning model’s accuracy outside the training set.
3.2. Electronic Structure and DOS Calculations
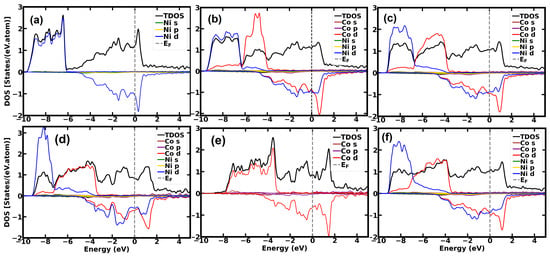
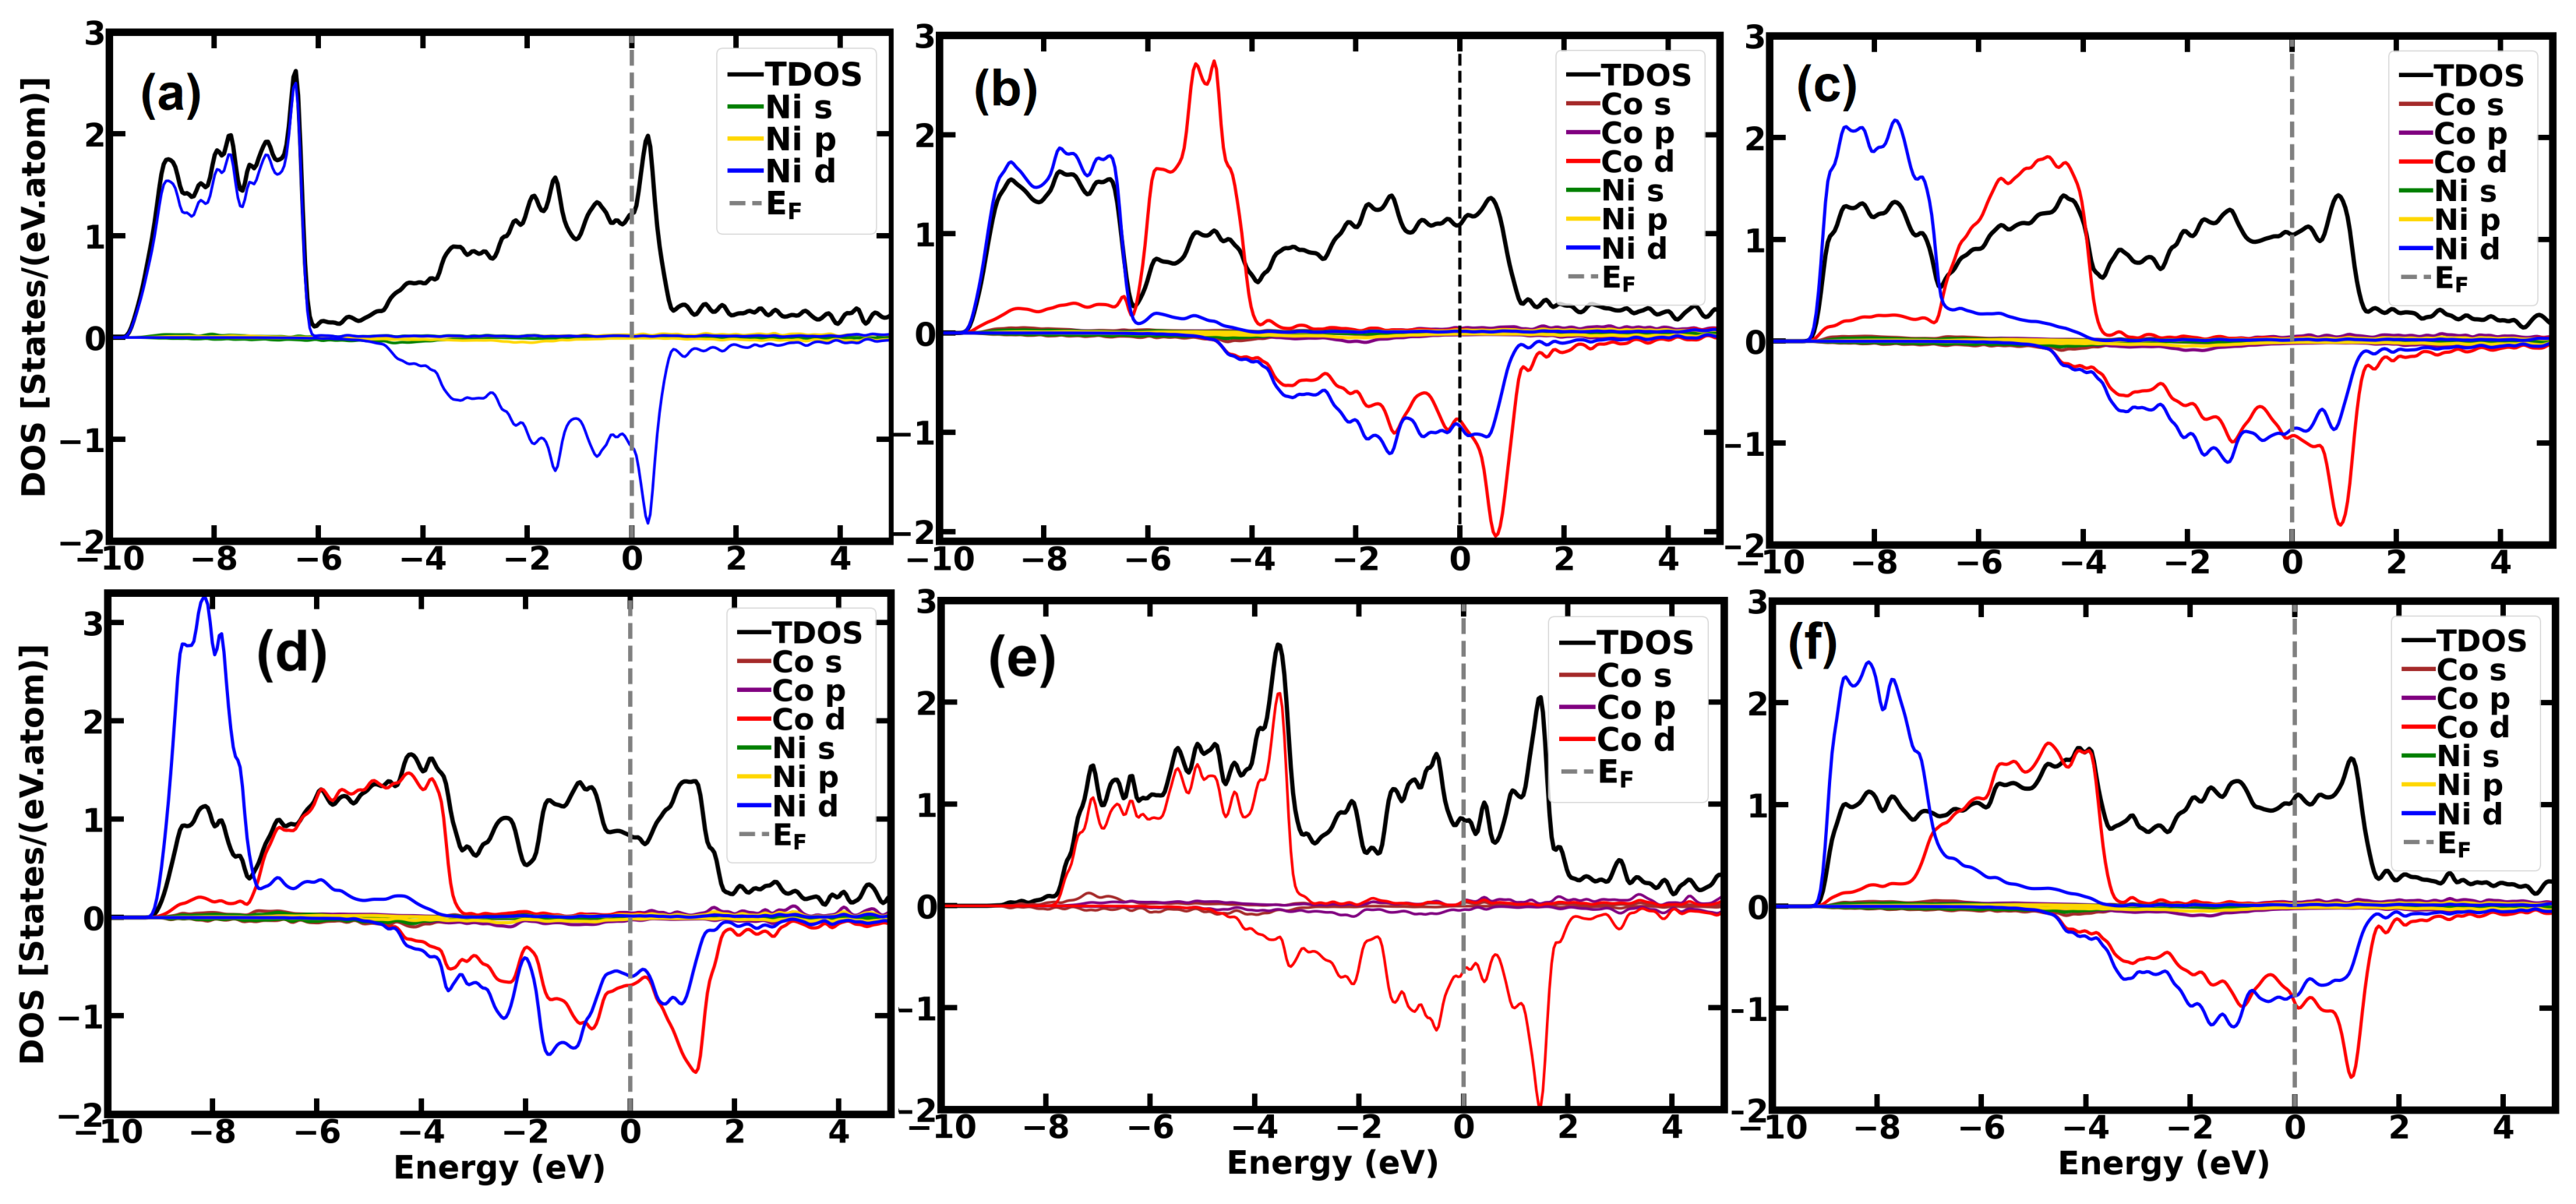
The correlated 3d electrons were analyzed using DFT+U method to compute the spin-polarized DOS. At the Fermi level (), every composition revealed a finite total DOS, indicating that metallic behavior is necessary for high-performance supercapacitor electrodes as shown in Figure 3.
Figure 3.
The total DOS (TDOS) and projected DOS (PDOS) of NixCo1−x alloys using the spin-polarized DFT+U method. Here, (a) pristine Ni, (b) , (c) , (d) , (e) pristine Co, and (f) test alloy. Positive DOS represents a spin-up state, and negative DOS represents a spin-down state; the vertical dashed line represents the Fermi level ( eV).
At ≈−6.5 eV, pristine Ni demonstrates a prominent major-spin peak that is mostly produced by Ni orbitals. The inclusion of Co states expands the d-band through hybridization, resulting in an extreme peak at ≈−4.5 eV in Ni-rich alloys (e.g., ). Alloying usually reduces the electronic distribution near , while pure metals show high DOS peaks. For example, at , the test alloy keeps a stable DOS of ≈1.2 states/(eV·atom) as shown in Figure 3f. This stability of DOS implies that compared to their pure counterparts, certain alloy compositions may offer a more stable electronic environment for charge storage.
3.3. Pattern Learning and Model Validation
Principal Component Analysis (PCA) was used in the pattern-learning method to avoid the computational scaling of conventional DFT. Three structural descriptors were used to train the model: the coordination number (), the d-orbital occupation ratio (), the mixing factor () [12] and coefficient of PC for each image vector of DOS. These descriptors are listed in Table 1.
Table 1.
Descriptors calculated for the understudy NixCo1−x alloys include , , , , and . The test composition: *Ni0.34Co0.66 is highlighted, and training compositions are in regular font.
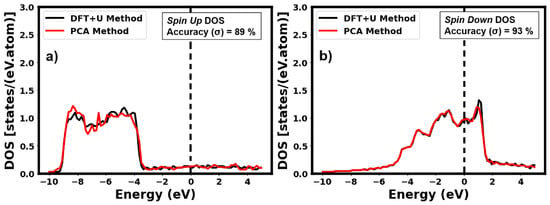
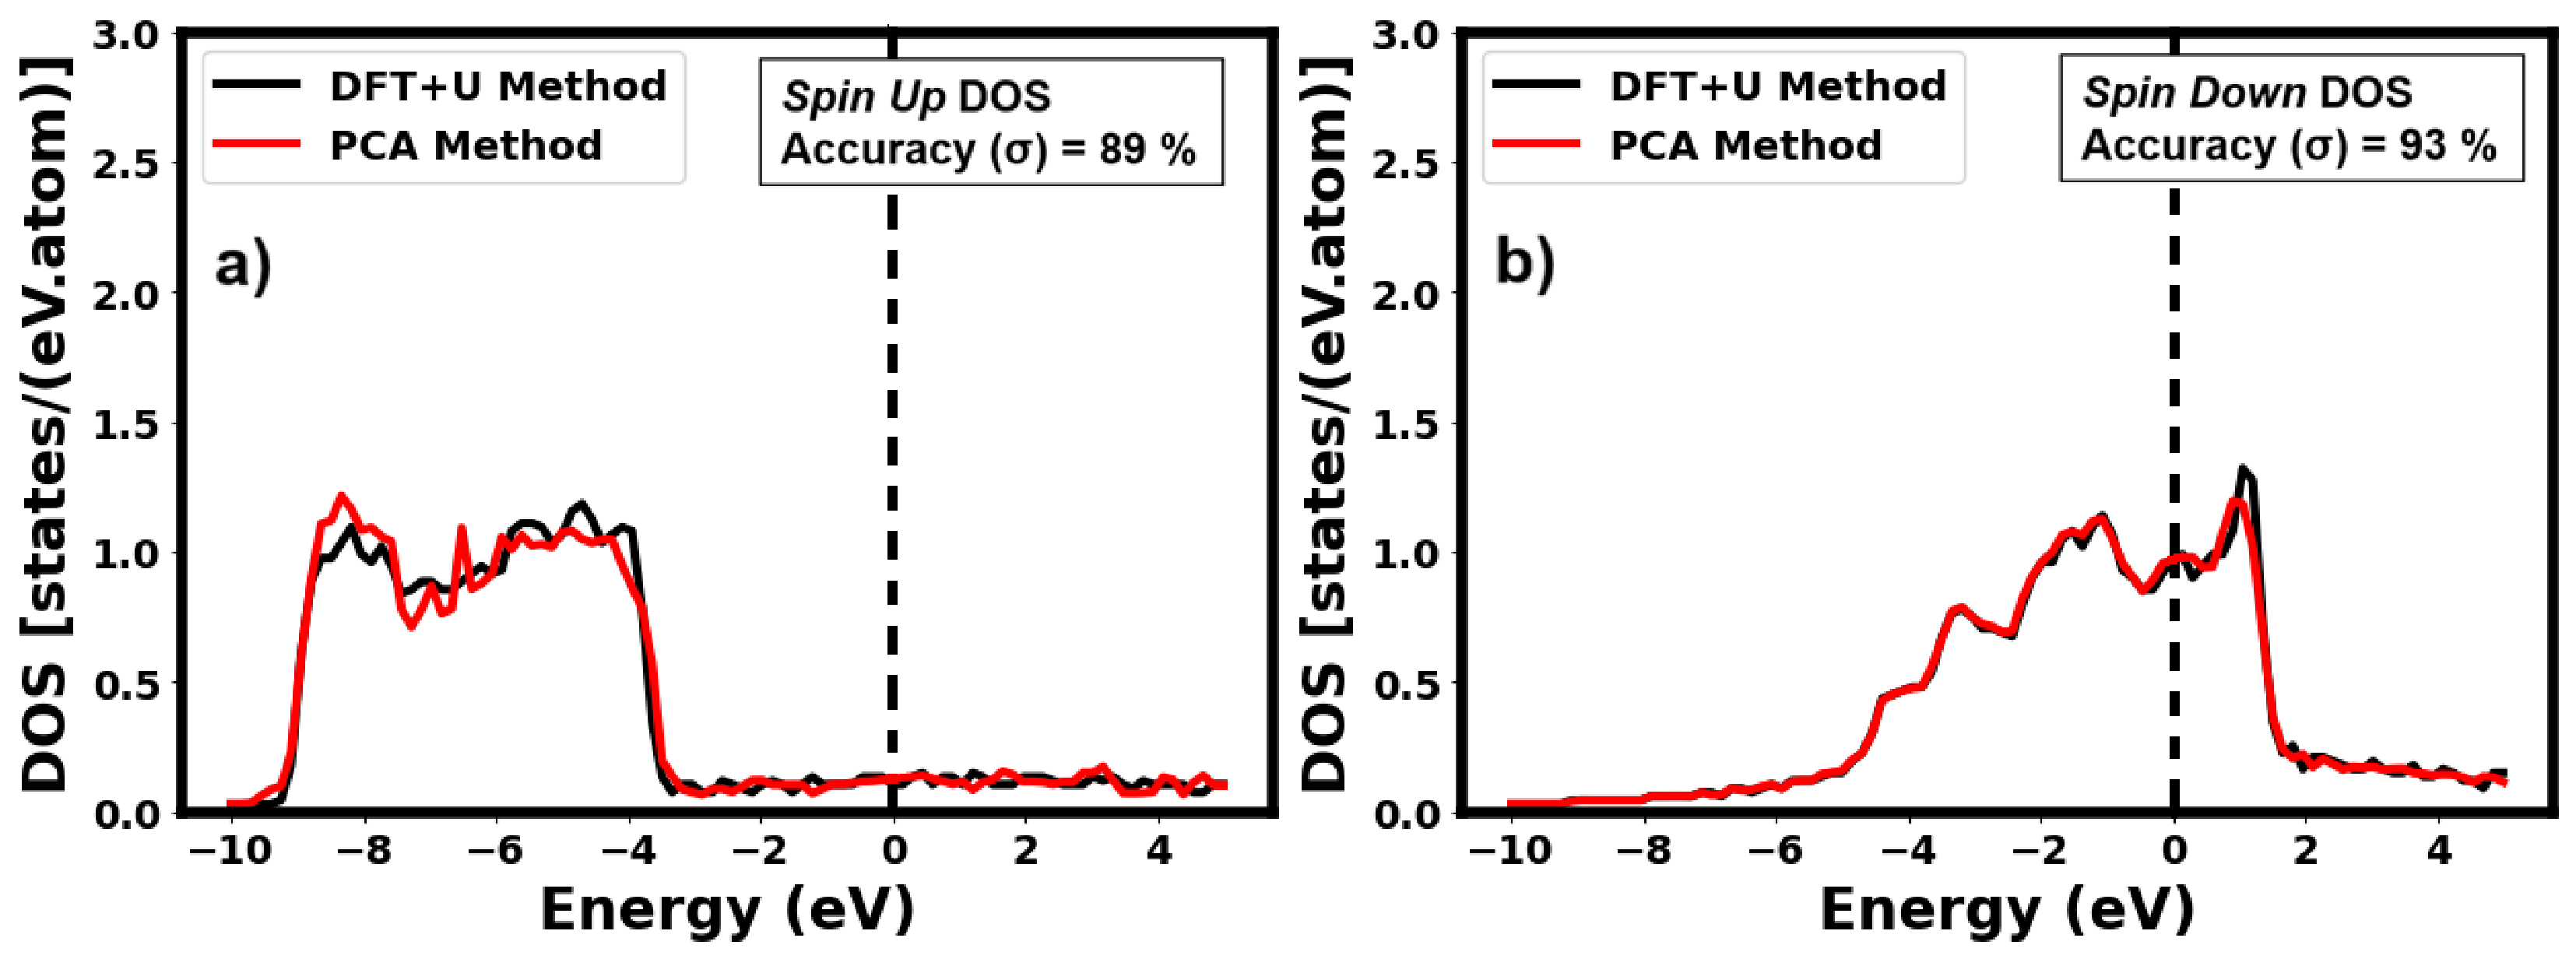
An impressive fit was found upon validation against the *Ni0.34Co0.66 test system, with accuracies of 93% for spin-down DOS and 89% for spin-up DOS as shown in Figure 4. The DOS at the Fermi level, which is the critical parameter for , stayed within 2–3% of the reference DFT results, although there are slight variations (7–11%) in high-energy regions because of the reduction in principal components. A high-throughput screening of the complete composition range was made possible by the quick creation of 100 unique DOS curves due to this efficiency.
Figure 4.
Spin-resolved DOS of the test alloy *Ni0.34Co0.66, comparing the reference DFT+U calculation (black) with the PCA-based prediction (red): (a) spin-up DOS curve and (b) spin-down DOS curve. PCA accurately reconstructed the DFT+U DOS across energy, including spectral features near that determines quantum capacitance, with for spin-up DOS and for spin-down DOS.
3.4. Quantum Capacitance and Optimization
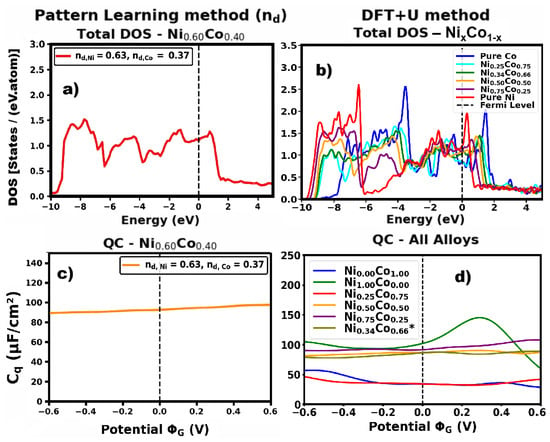
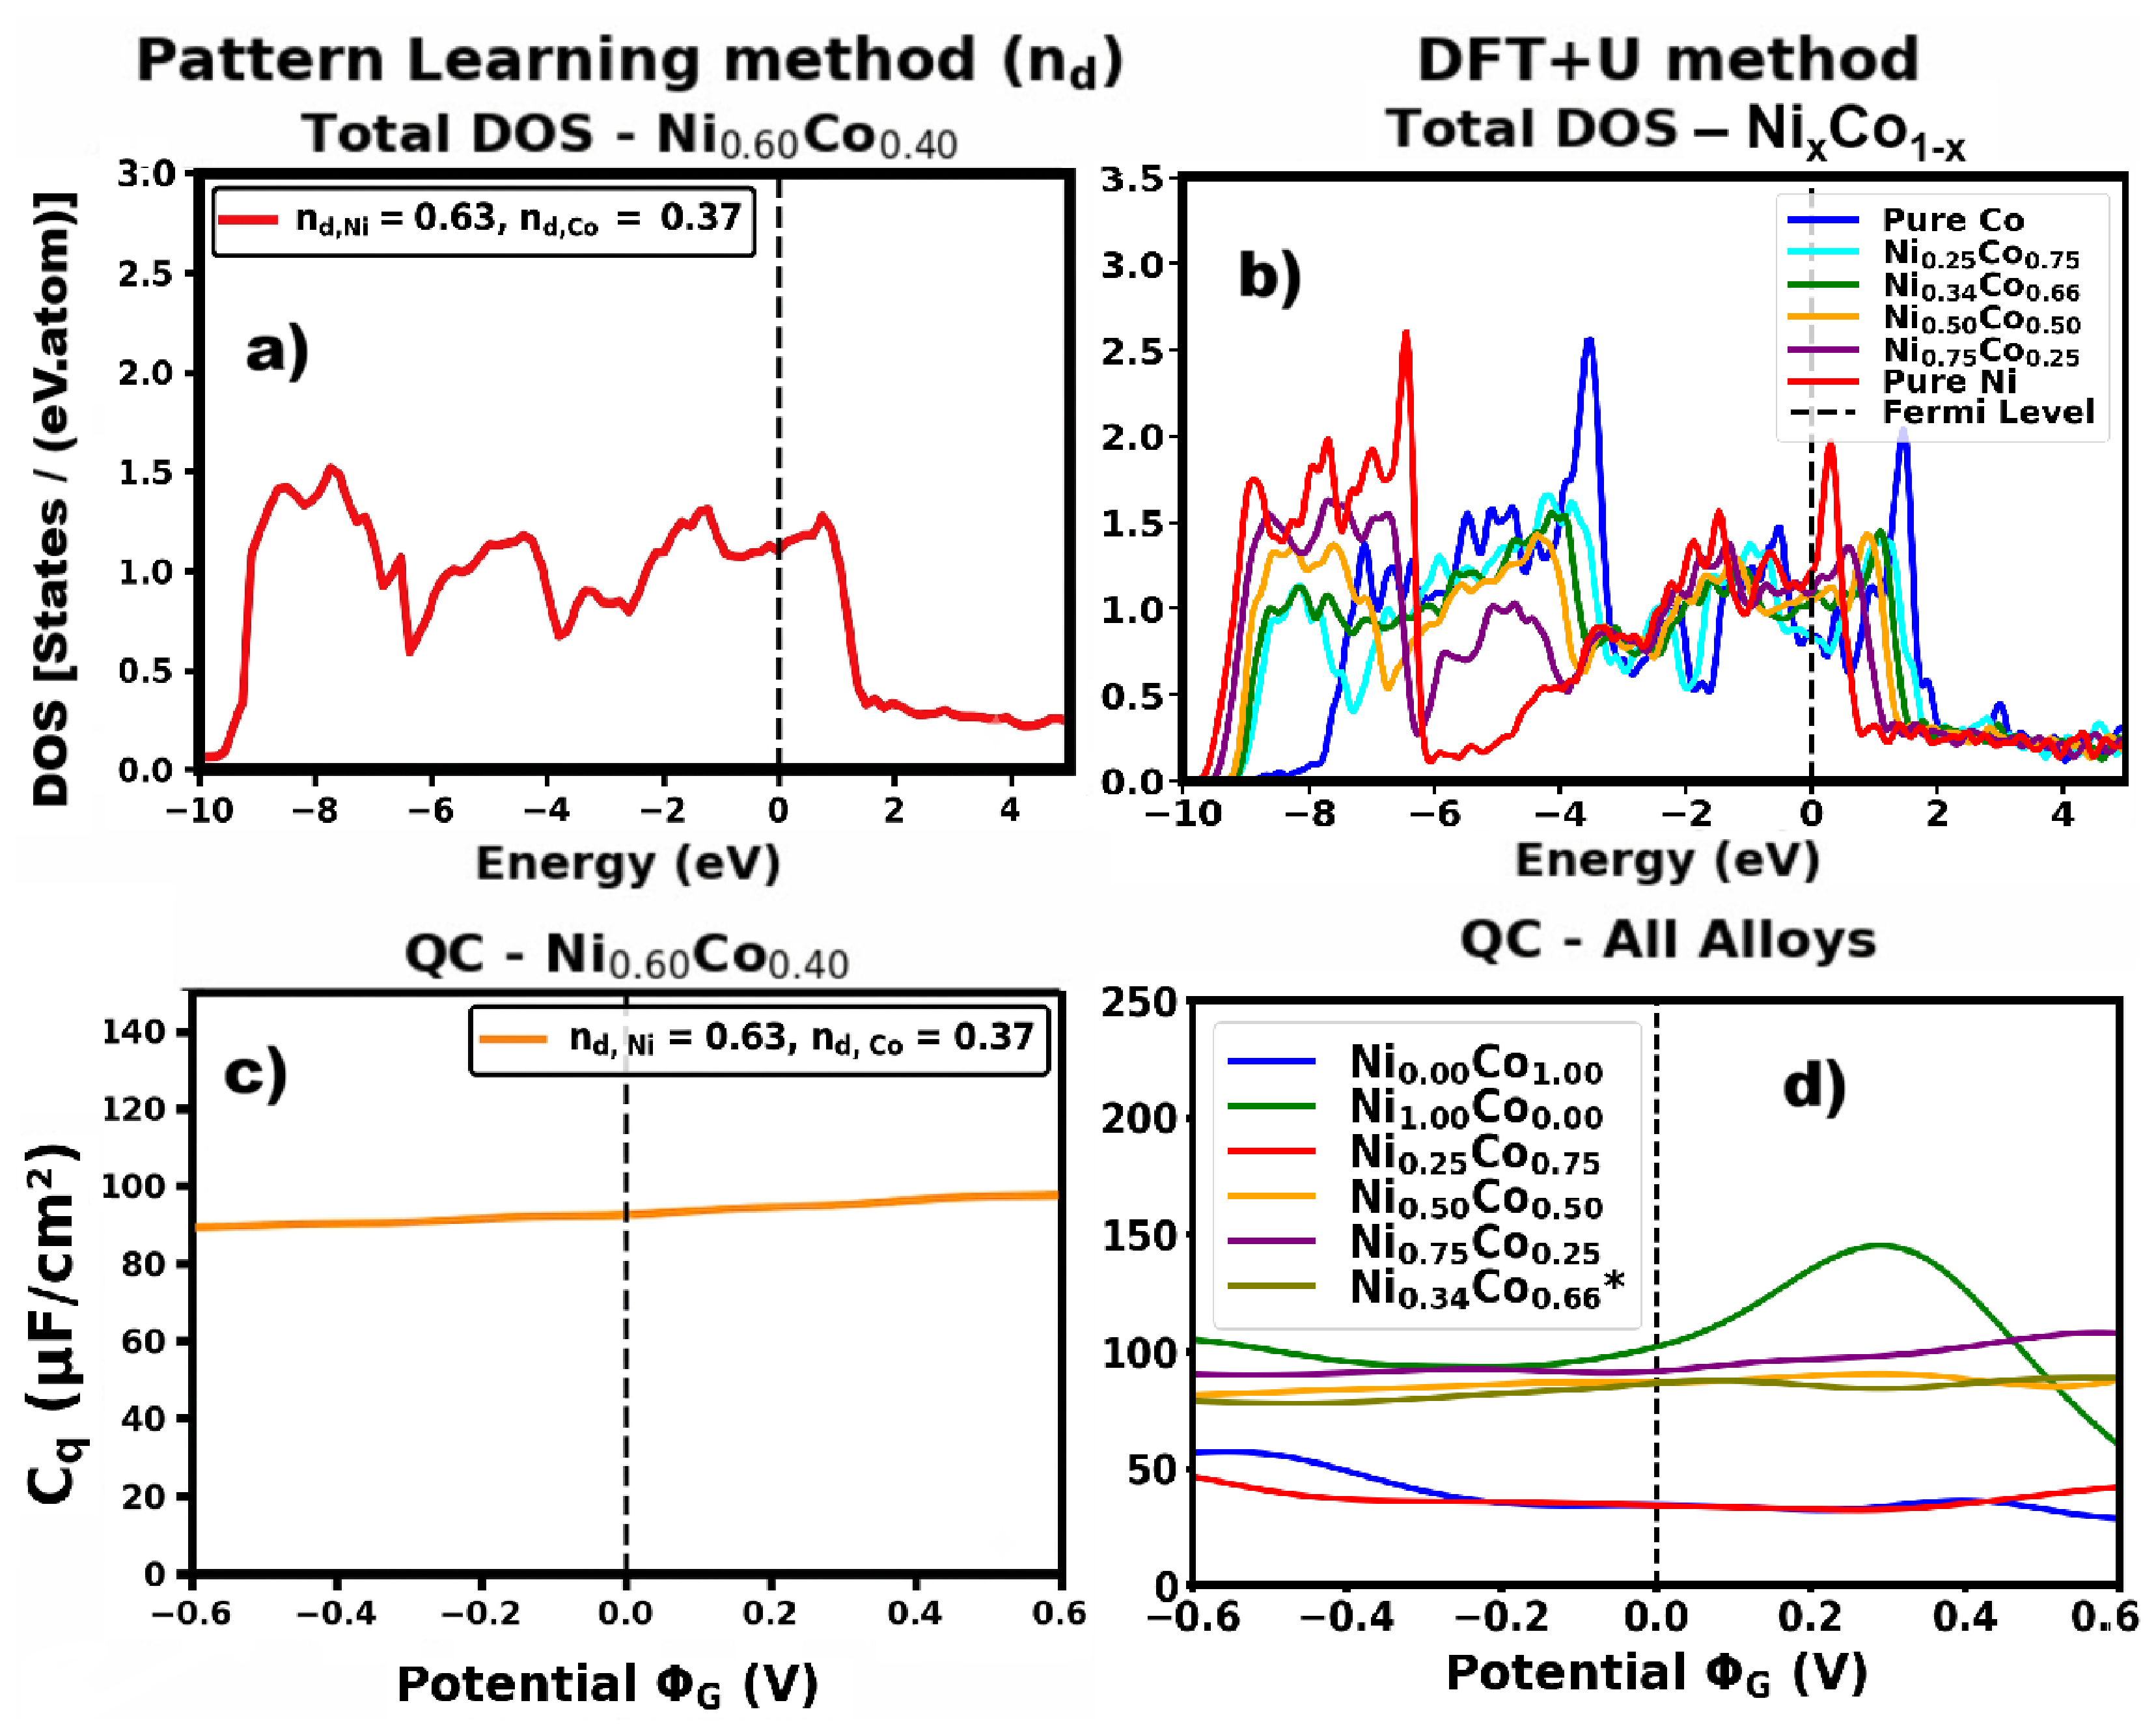
After integrating the predicted DOS curves, as a function of electrode potential () was obtained via Equation (2). Co-rich compositions displayed lower-magnitude, more symmetric profiles up to ≈72 µF/cm2, while Ni-rich alloys ( to ) displayed asymmetric, high-amplitude curves with peaks exceeding 100 µF/cm2 as shown in Figure 5d.
Figure 5.
Identification of Ni0.60Co0.40 as the composition with the maximum ( µF/cm2) in the NixCo1−x. (a) TDOS of Ni0.60Co0.40 reconstructed by the pattern-learning method at and . (b) DFT+U TDOS for the discrete compositions of NixCo1−x. (c) of Ni0.60Co0.40 as a function of the electrode potential , derived from the pattern-learned DOS. (d) for all alloy compositions computed from TDOS of DFT+U.
The best candidate was the composition , as depicted in Figure 5c, because it achieves a balance between a flattened, stable response throughout the potential window, better structural stability than pure Ni, and the high charge-storage capacity of Ni-rich systems with ≈ 90 µF/cm2 [22]. This indicates that the design of stable, high-performance supercapacitor electrodes can be successfully guided by the PCA-based framework.
The entire NixCo1−x sequence was also performed within a single FCC framework using the same DFT+U and PCA-based workflow to verify that our predictions are independent of modeling each composition in its equilibrium ground-state lattice. This is well-supported by the fact that DFT in combination with the SQS method results in accurate energetic properties for the Ni-Co system [23]. Furthermore, it is predicted via DFT that 28% of FCC Co can exit at room temperature [24], which is also experimentally supported in X-ray diffraction studies [25]. Similarly, the pure FCC Co phase exists for nanoparticle sizes [26] that are notably relevant to the nanostructured electrodes. The fully FCC sequence predicted the same µF/cm2 of as the mixed FCC-HCP sequence, confirming that the behavior is influenced by the electronic structure near the Fermi level. The only difference between the two was model accuracy, which was 91% (average of spin-up and spin-down accuracy) for the FCC-HCP series and 93% for the FCC series. The FCC series was more accurate because its single-lattice descriptor space was more uniform.
4. Conclusions
This study demonstrated that the quantum capacitance in face-centered cubic and hexagonal close-packed NixCo1−x alloys exhibited considerable variation with composition, mostly due to the shifting and asymmetry of the d-band at the Fermi level. Our sophisticated spin-polarized DFT+U calculations demonstrated that Ni-rich alloys develop unique electronic asymmetries, therefore enhancing the charge-storage capacities of NixCo1−x alloys under applied electrode biases. The pattern-learning method using PCA and linear regression accelerated the computation of by incorporating pertinent features like the mixing factor (), coordination number (CN), and d-orbital occupation ratio (). This hybrid technique generates the correct total density of states (DOS) and, consequently, in one minute, whereas a traditional DFT calculation for a single alloy composition requires 3 to 4 days, enabling extensive compositional calculations that were previously prohibitively costly. The alloy was determined to be the most suitable for supercapacitor electrodes, based on the study of all 100 curves of NixCo1−x alloys, exhibiting a capacitance of 90 µF/cm2 and commendable stability. Considering the meticulous error (the mean of the spin-up and spin-down error) in the total density of states (DOS), it is determined that the alloys from to are viable candidates for supercapacitor electrodes with 80 µF/cm2. This hybrid methodology integrates theoretical DFT calculations with the PCA-based pattern-learning method to assess binary alloys for supercapacitor applications, achieving an accuracy of .
Author Contributions
Conceptualization, M.S.K.; methodology, M.S.K.; writing, M.S.K.; resources, A.J.; validation, A.J.; review and editing, M.I. All authors have read and agreed to the published version of the manuscript.
Funding
This research received no external funding.
Institutional Review Board Statement
Not applicable.
Informed Consent Statement
Not applicable.
Data Availability Statement
The data will be available on demand.
Conflicts of Interest
The authors declare no conflicts of interest.
References
- Liaqat, M.; Ghadi, Y.Y.; Adnan, M.; Fazal, M.R. Multicriteria Evaluation of Portable Energy Storage Technologies for Electric Vehicles. IEEE Access 2022, 10, 64890–64903. [Google Scholar] [CrossRef] [Scilit]
- Olabi, A.G.; Abbas, Q.; Al Makky, A.; Abdelkareem, M.A. Supercapacitors as Next Generation Energy Storage Devices: Properties and Applications. Energy 2022, 248, 123617. [Google Scholar] [CrossRef] [Scilit]
- Dar, M.A.; Majid, S.; Satgunam, M.; Siva, C.; Ansari, S.; Arularasan, P.; Ahamed, S.R. Advancements in Supercapacitor Electrodes and Perspectives for Future Energy Storage Technologies. Int. J. Hydrogen Energy 2024, 70, 10–28. [Google Scholar] [CrossRef] [Scilit]
- Reiss, H. The Fermi Level and the Redox Potential. J. Phys. Chem. 1985, 89, 3783–3791. [Google Scholar] [CrossRef] [Scilit]
- Khaliq, M.S. Computational Analysis Using Density Functional Theory to Evaluate the Quantum Capacitance of Transition Metal Alloys as Electrode Materials. Ionics 2025, 31, 11293–11305. [Google Scholar] [CrossRef] [Scilit]
- Dai, M.; Zhao, D.; Liu, H.; Zhu, X.; Wu, X.; Wang, B. Nanohybridization of Ni–Co–S Nanosheets with ZnCo2O4 Nanowires as Supercapacitor Electrodes with Long Cycling Stabilities. ACS Appl. Energy Mater. 2021, 4, 2203–2210. [Google Scholar] [CrossRef] [Scilit]
- Boruah, B.; Kalita, B. Alloying Ratio Versus Cluster Size for Reversible Hydrogen Storage in 3d Transition Metal Doped Small Mg Clusters: Dispersion Corrected DFT Study. J. Energy Storage 2023, 72, 108217. [Google Scholar] [CrossRef] [Scilit]
- Meziane, S. Promising Prospects of Aluminum Alloys in the Energy Storage by DFT Analysis. Eur. Phys. J. Plus 2022, 137, 77. [Google Scholar] [CrossRef] [Scilit]
- Anisimov, V.I.; Zaanen, J.; Andersen, O.K. Band Theory and Mott Insulators: Hubbard U Instead of Stoner I. Phys. Rev. B 1991, 44, 943. [Google Scholar] [CrossRef] [Scilit] [PubMed]
- Janovec, J.; Zelený, M.; Heczko, O.; Ayuela, A. Localization Versus Delocalization of d-States Within the Ni2MnGa Heusler Alloy. Sci. Rep. 2022, 12, 20577. [Google Scholar] [CrossRef] [Scilit] [PubMed]
- Schütt, K.T.; Glawe, H.; Brockherde, F.; Sanna, A.; Müller, K.R.; Gross, E.K.U. How to Represent Crystal Structures for Machine Learning: Towards Fast Prediction of Electronic Properties. Phys. Rev. B 2014, 89, 205118. [Google Scholar] [CrossRef] [Scilit]
- Yeo, B.C.; Kim, D.; Kim, C.; Han, S.S. Pattern Learning Electronic Density of States. Sci. Rep. 2019, 9, 5879. [Google Scholar] [CrossRef] [Scilit] [PubMed]
- Kresse, G.; urthmüller, J. Efficient Iterative Schemes for Ab Initio Total-Energy Calculations Using a Plane-Wave Basis Set. Phys. Rev. B 1996, 54, 11169–11186. [Google Scholar] [CrossRef] [Scilit] [PubMed]
- Perdew, J.P.; Burke, K.; Ernzerhof, M. Generalized Gradient Approximation Made Simple. Phys. Rev. Lett. 1996, 77, 3865–3868. [Google Scholar] [CrossRef] [Scilit] [PubMed]
- Cococcioni, M.; de Gironcoli, S. Linear Response Approach to the Calculation of the Effective Interaction Parameters in the LDA+U Method. Phys. Rev. B 2005, 71, 035105. [Google Scholar] [CrossRef] [Scilit]
- Kittel, C. Introduction to Solid State Physics; Wiley: Hoboken, NJ, USA, 2004. [Google Scholar]
- Luryi, S. Quantum capacitance devices. Appl. Phys. Lett. 1988, 52, 501–503. [Google Scholar] [CrossRef] [Scilit]
- Yang, G.M.; Zhang, H.Z.; Fan, X.F.; Zheng, W.T. Density Functional Theory Calculations for the Quantum Capacitance Performance of Graphene-Based Electrode Material. J. Phys. Chem. C 2015, 119, 6464–6470. [Google Scholar] [CrossRef] [Scilit]
- Nishizawa, T.; Ishida, K. The Co (Cobalt) System. Bull. Alloy Phase Diagr. 1983, 4, 387–390. [Google Scholar] [CrossRef] [Scilit]
- Liu, P.; Chen, D.; Wang, Q.; Xu, P.; Long, M.; Duan, H. Crystal structure and mechanical properties of nickel-cobalt alloys with different compositions: A first-principles study. J. Phys. Chem. Solids 2020, 137, 109194. [Google Scholar] [CrossRef] [Scilit]
- Zunger, A.; Wei, S.-H.; Ferreira, L.G.; Bernard, J.E. Special quasirandom structures. Phys. Rev. Lett. 1990, 65, 353. [Google Scholar] [CrossRef] [Scilit] [PubMed]
- Kumar, S.; Majhi, E.; Deshpande, A.S.; Khandelwal, M. Quantum Capacitance: The Large but Hidden Capacitance in Supercapacitors. Carbon Trends 2024, 16, 100385. [Google Scholar] [CrossRef] [Scilit]
- Asadikiya, M.; Drozd, V.; Yang, S.; Zhong, Y. Enthalpies and Elastic Properties of Ni-Co Binary System by Ab Initio Calculations and an Energy Comparison with the CALPHAD Approach. Mater. Today Commun. 2020, 23, 100905. [Google Scholar] [CrossRef] [Scilit]
- Sewak, R.; Dey, C.C.; Toprek, D. Temperature Induced Phase Transformation in Co. Sci. Rep. 2022, 12, 10054. [Google Scholar] [CrossRef] [Scilit] [PubMed]
- Bedi, S.C.; Forker, M. Hyperfine Interactions at Ta Impurities in Cobalt and Cobalt-Hafnium Intermetallic Compounds. Phys. Rev. B 1993, 47, 14948–14960. [Google Scholar] [CrossRef] [Scilit] [PubMed]
- Kitakami, O.; Sato, H.; Shimada, Y.; Sato, F.; Tanaka, M. Size Effect on the Crystal Phase of Cobalt Fine Particles. Phys. Rev. B 1997, 56, 13849–13854. [Google Scholar] [CrossRef] [Scilit]

Disclaimer/Publisher’s Note: The statements, opinions and data contained in all publications are solely those of the individual author(s) and contributor(s) and not of MDPI and/or the editor(s). MDPI and/or the editor(s) disclaim responsibility for any injury to people or property resulting from any ideas, methods, instructions or products referred to in the content. |
© 2026 by the authors. Licensee MDPI, Basel, Switzerland. This article is an open access article distributed under the terms and conditions of the Creative Commons Attribution (CC BY) license.