


Abstract
Urbanization is a global phenomenon that transforms peri-urban landscapes into a mix of land use and land cover in rapidly growing cities. This study examined spatiotemporal dynamics in land use and land cover (LULC) transition in the peri-urban region of Cu Chi in northern Ho Chi Minh city during the 2010–2025 period. Land use and land cover data derived from Sentinel 2 imagery were integrated with Landscape Expansion Index (LEI), landscape fragmentation analysis, Ordinary Least Squares (OLS), Standard Deviational Ellipse (SDE), Kernel Density, and spatial autocorrelation analysis (Global Moran’s I and LI-SA). The results indicate rapid urban expansion accompanied by significant agricultural land conversion and increasing urban spatial connectivity. Edge expansion was identified as the dominant urban growth pattern, while fragmented urban patches gradually evolved into larger and more connected urban cores. Spatial analyses revealed that urban growth mainly followed the northwest-southeast direction and concentrated along transportation corridors. The findings provide important insights for sustainable urban planning and landscape management in rapidly urbanizing peri-urban regions.
1. Introduction
Urbanization affects the structure and configuration of the land and space including natural, agricultural and built-up land cover categories. The spatial structure and condition of the environment vary significantly in the rapidly expanding cities where the field is often characterized with some isolated and disconnected urban fragments especially in peri-urban landscapes surrounding many south-east Asian megacities [1,2]. One of the consequences of urban expansion is the fragmentation of land systems including natural, agricultural and built-up landscapes. Field fragmentation is the process by which a continuous land system breaks into several isolated units which could potentially affect various field composition and configuration characteristics, affecting various ecological functions and biological processes including loss of ecological connectivity and increased spatial complexity [3]. While assessing the spatiotemporal field fragmentation and its driving factors remain challenging, thanks to the availability of modern data collection and mapping technologies such as remote sensing (RS) and geographic information systems (GIS), several studies have identified various field fragmentation and composition characteristics in different landscapes in recent decades [4,5]. Urban growth and expansion have caused important land conversion and field changes in several parts of the world. Land conversion patterns and associated dynamics of land use change can also be examined through identifying their spatial patterns and hotspots where rapid changes happen. For example, mapping spatial structures and morphological characteristics of urban forms can illustrate how and where urban morphologies grow and spread over time and in space [6]. However, studies examining the impacts of urbanization from both spatial and field ecology aspects remains limited particularly in fast-growing urbanization centers. In addition, although there is not one universally acknowledged definition and description of field, field ecologists define it as a heterogeneous area of land consisting of multiple interacting ecosystems, each exhibiting its own ecological characteristics [7].
Although previous studies have documented land use change and urban growth in Ho Chi Minh city and its surrounding areas, most have primarily focused on the magnitude and rate of urban expansion or land conversion. Comparatively fewer studies have investigated how urbanization influences landscape fragmentation and the spatial morphology of urban growth. Moreover, an integrated assessment combining landscape fragmentation analysis with urban growth pattern classification and spatial statistical techniques remains limited, particularly for rapidly urbanizing peri-urban districts.
To address these research gaps, this study investigates the spatiotemporal dynamics of landscape fragmentation under urban expansion in Cu Chi district, Ho Chi Minh city, during the period 2010–2025. Multi-temporal Sentinel-2 imagery was used to produce land use/land cover maps, while the Landscape fragmentation tool (LFT) was employed to characterize landscape fragmentation. The Landscape expansion index (LEI) was subsequently applied to identify dominant urban growth modes, and Kernel density estimation (KDE), standard deviational ellipse (SDE), and Moran’s I analyses were integrated to reveal the spatial evolution and clustering characteristics of urban expansion. The findings provide a comprehensive understanding of urban landscape transformation and offer valuable scientific evidence for sustainable urban planning and land management in rapidly urbanizing regions.
2. Study Area
Based on Resolution No. 1685/NQ-UBTVQH15 and Proposal No. 356/ĐA-CP, dated 9 May 2025, the former Cu Chi District comprises 7 commune level units, namely Cu Chi, Tan An Hoi, Thai My, An Nhon Tay, Nhuan Duc, Phu Hoa Dong, and Binh My. The former Cu Chi district lies in the northern and northwestern parts of Ho Chi Minh City (HCM City), serving as a transition area from the city center to the province of Tay Ninh and Dong Nai, or along the Trans-Asian economic corridor. The unit has witnessed tremendous urban expansion in recent years due to urbanization spillover from the city center, especially in the areas adjoining the former Hoc Mon district and district 12.
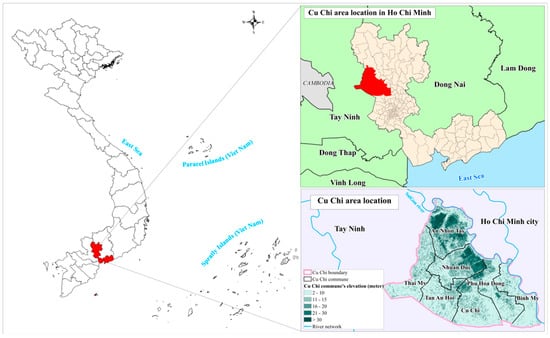
The geographical location and administrative boundaries of the study area are illustrated in Figure 1. The accompanying elevation map presents the spatial distribution of elevation classes, administrative boundaries, and the river network, providing geographical context for the subsequent analysis of land use and land cover changes.
Figure 1.
Location of the Cu Chi study area in Ho Chi Minh City. The left panel highlights Ho Chi Minh City in red within Viet Nam, while the upper-right panel shows the Cu Chi study area in red within Ho Chi Minh City. In the lower-right panel, different colors represent elevation classes (m); the pink line delineates the Cu Chi boundary, black lines indicate commune boundaries, and blue lines represent the river network.
3. Materials and Methods
3.1. Land Use and Land Cover Dataset
This study used the Sentinel-2 10 m Land Use/Land Cover (LULC) Time Series dataset available through ArcGIS Living Atlas of the World. The dataset was developed by Impact Observatory in collaboration with Esri (Redlands, CA, USA) and Microsoft, using Sentinel-2 satellite imagery and deep learning-based classification techniques [6]. The LULC datasets for 2010, 2020, 2024, and 2025 were used to analyze urban spatial changes in the Cu Chi area. The primary land use classes employed in this study included urban land, crop land, forest land, water bodies, and other land.
3.2. Landscape Expansion Index (LEI) Analysis
The Landscape Expansion Index (LEI) was calculated as the ratio of the length of the shared boundary between new urban patches and previous urban patches to the total perimeter of the new urban patches within the buffer zone. It is commonly used to characterize urban expansion, spatial spreading, and urban form [7]. The formula is as follows:
where Lc is the length of the shared boundary between newly developed urban areas and existing urban land; P is perimeter of the newly developed urban patch.
Based on LEI values, urban expansion patterns were classified as follows: LEI > 50 indicates infilling expansion; 0 < LEI < 50 indicates edge expansion; and LEI = 0 indicates outlying expansion.
3.3. Urban Landscape Fragmentation Analysis
Urban landscape fragmentation analysis was used to determine the spatial dispersion and structural changes in urban land in the Cu Chi area between 2010 and 2025. This method helps identify urban expansion in terms of changes in urban structure and connectivity over time [8,9]. The Landscape Fragmentation Tool in ArcMap 10.8 was used to analyze urban fragmentation using the spatial segmentation algorithm developed by Vogt et al. [8]. Urban land was converted into a binary raster (urban and non-urban) prior to analysis. The tool analyzed urban space into Core, Edge, Perforated, and Patch categories to determine spatial concentration and dispersion [10].
3.4. Ordinary Least Squares (OLS) Regression Analysis
The relationship between urban land and other land use classes in Cu Chi area for the period 2010–2025 was evaluated using Ordinary Least Squares (OLS) regression. OLS is a common linear regression method used in spatial and land use studies to assess the impact of independent variables on a dependent variable by minimizing the sum of squared residuals [11]. The data was aggregated at the commune level and analyzed in Minitab 22. The OLS regression can be expressed as follows:
where Y is the dependent variable (urban land); Xn is independent variables (LULC classes); β0 is intercept; βn is regression coefficients of independent variables; ε is random error.
Y = β0 + β1 X1 + β2 X2 + ⋯ + βn Xn + ε
3.5. Spatial Analysis of Urbanization Patterns
3.5.1. Analysis of Urban Spatial Trends Using Standard Deviational Ellipse (SDE)
The Standard Deviational Ellipse (SDE) method was used to examine the spatial characteristics, major orientation, and extent of urban growth. The SDE technique is often used to identify spatial shifts and trends in the direction of a phenomenon over time [12]. Its application in urban research under the urbanization process, particularly in determining the pattern of urban growth [13,14]. Based on the mean center, standard distances along the major and minor axes, and a rotation angle, SDE constructs an ellipse that summarizes the spatial distribution. The spatial dispersion of the ellipse is represented by its size, while its rotation angle shows the primary direction of urban expansion [15].
- The mean center was calculated as follows:where xi, yi are coordinates of spatial feature i; n is total number of spatial features
- The ellipse rotation angle θ was determined as follows [16]:where A = − ; B = 2.
- The standard deviations along the X and Y axes of ellipse [12]:
3.5.2. Analysis of Urban Density Distribution Using Kernel Density Analysis
Kernel Density is a popular spatial statistical technique that estimates the intensity and concentration of a geographic phenomenon based on the presence of neighboring features [17]. This technique has been applied in various studies to examine urban density, built-up concentration, and the clustering of urban expansion [18,19]. Kernel Density estimates the density of spatial points within a search radius by applying a kernel function, which assigns higher weights to features that are closer and lower weights to those that are further away.
where (x) is density value at location x; n is total number of spatial points; h is searching radius (bandwidth); K is kernel function; x the location where density is estimated; xi is location of spatial point i.
3.6. Spatial Autocorrelation Analysis (Global Moran’s I and LISA)
3.6.1. Global Spatial Autocorrelation (Global Moran’s I)
To examine the overall spatial dependence of urban built-up areas, this study applies global spatial autocorrelation analysis using Global Moran’s I [20,21]. This index is widely used to determine whether spatial features are clustered, dispersed, or randomly distributed across a study area. Global Moran’s I is defined as:
where represents the mean observed value across all n spatial units; wij denotes the spatial weights matrix; xi and xj represent the observed values at spatial locations i and j, respectively. S0 is the sum of all spatial weights.
The significance of Moran’s I is evaluated using a Z-score under the assumption of spatial randomness:
where E[I] is the expected value and Var(I) is the variance of Moran’s I under the null hypothesis. A Z-score greater than 1.96 or 2.58 indicates statistical significance at the 5% and 1% levels.
3.6.2. Local Spatial Autocorrelation Analysis (LISA)
Global Moran’s I measure overall spatial autocorrelation of urban built-up areas but cannot identify the location or extent of local clusters. Therefore, additional methods are needed to detect local level spatial dependence across individual units in the study area [22]. To identify local spatial clusters and spatial heterogeneity, this study employs Local Indicators of Spatial Association (LISA) proposed by Anselin (1995) [23]. This method allows for the detection of statistically significant spatial clustering at the local level, revealing spatial dependence patterns that are not observable at the global scale.
Based on LISA results, spatial units are classified into: High-High (H-H), Low-Low (L-L), High-Low (H-L), and Low-High (L-H). H-H and L-L indicate positive spatial autocorrelation, while H-L and L-H represent negative spatial autocorrelation.
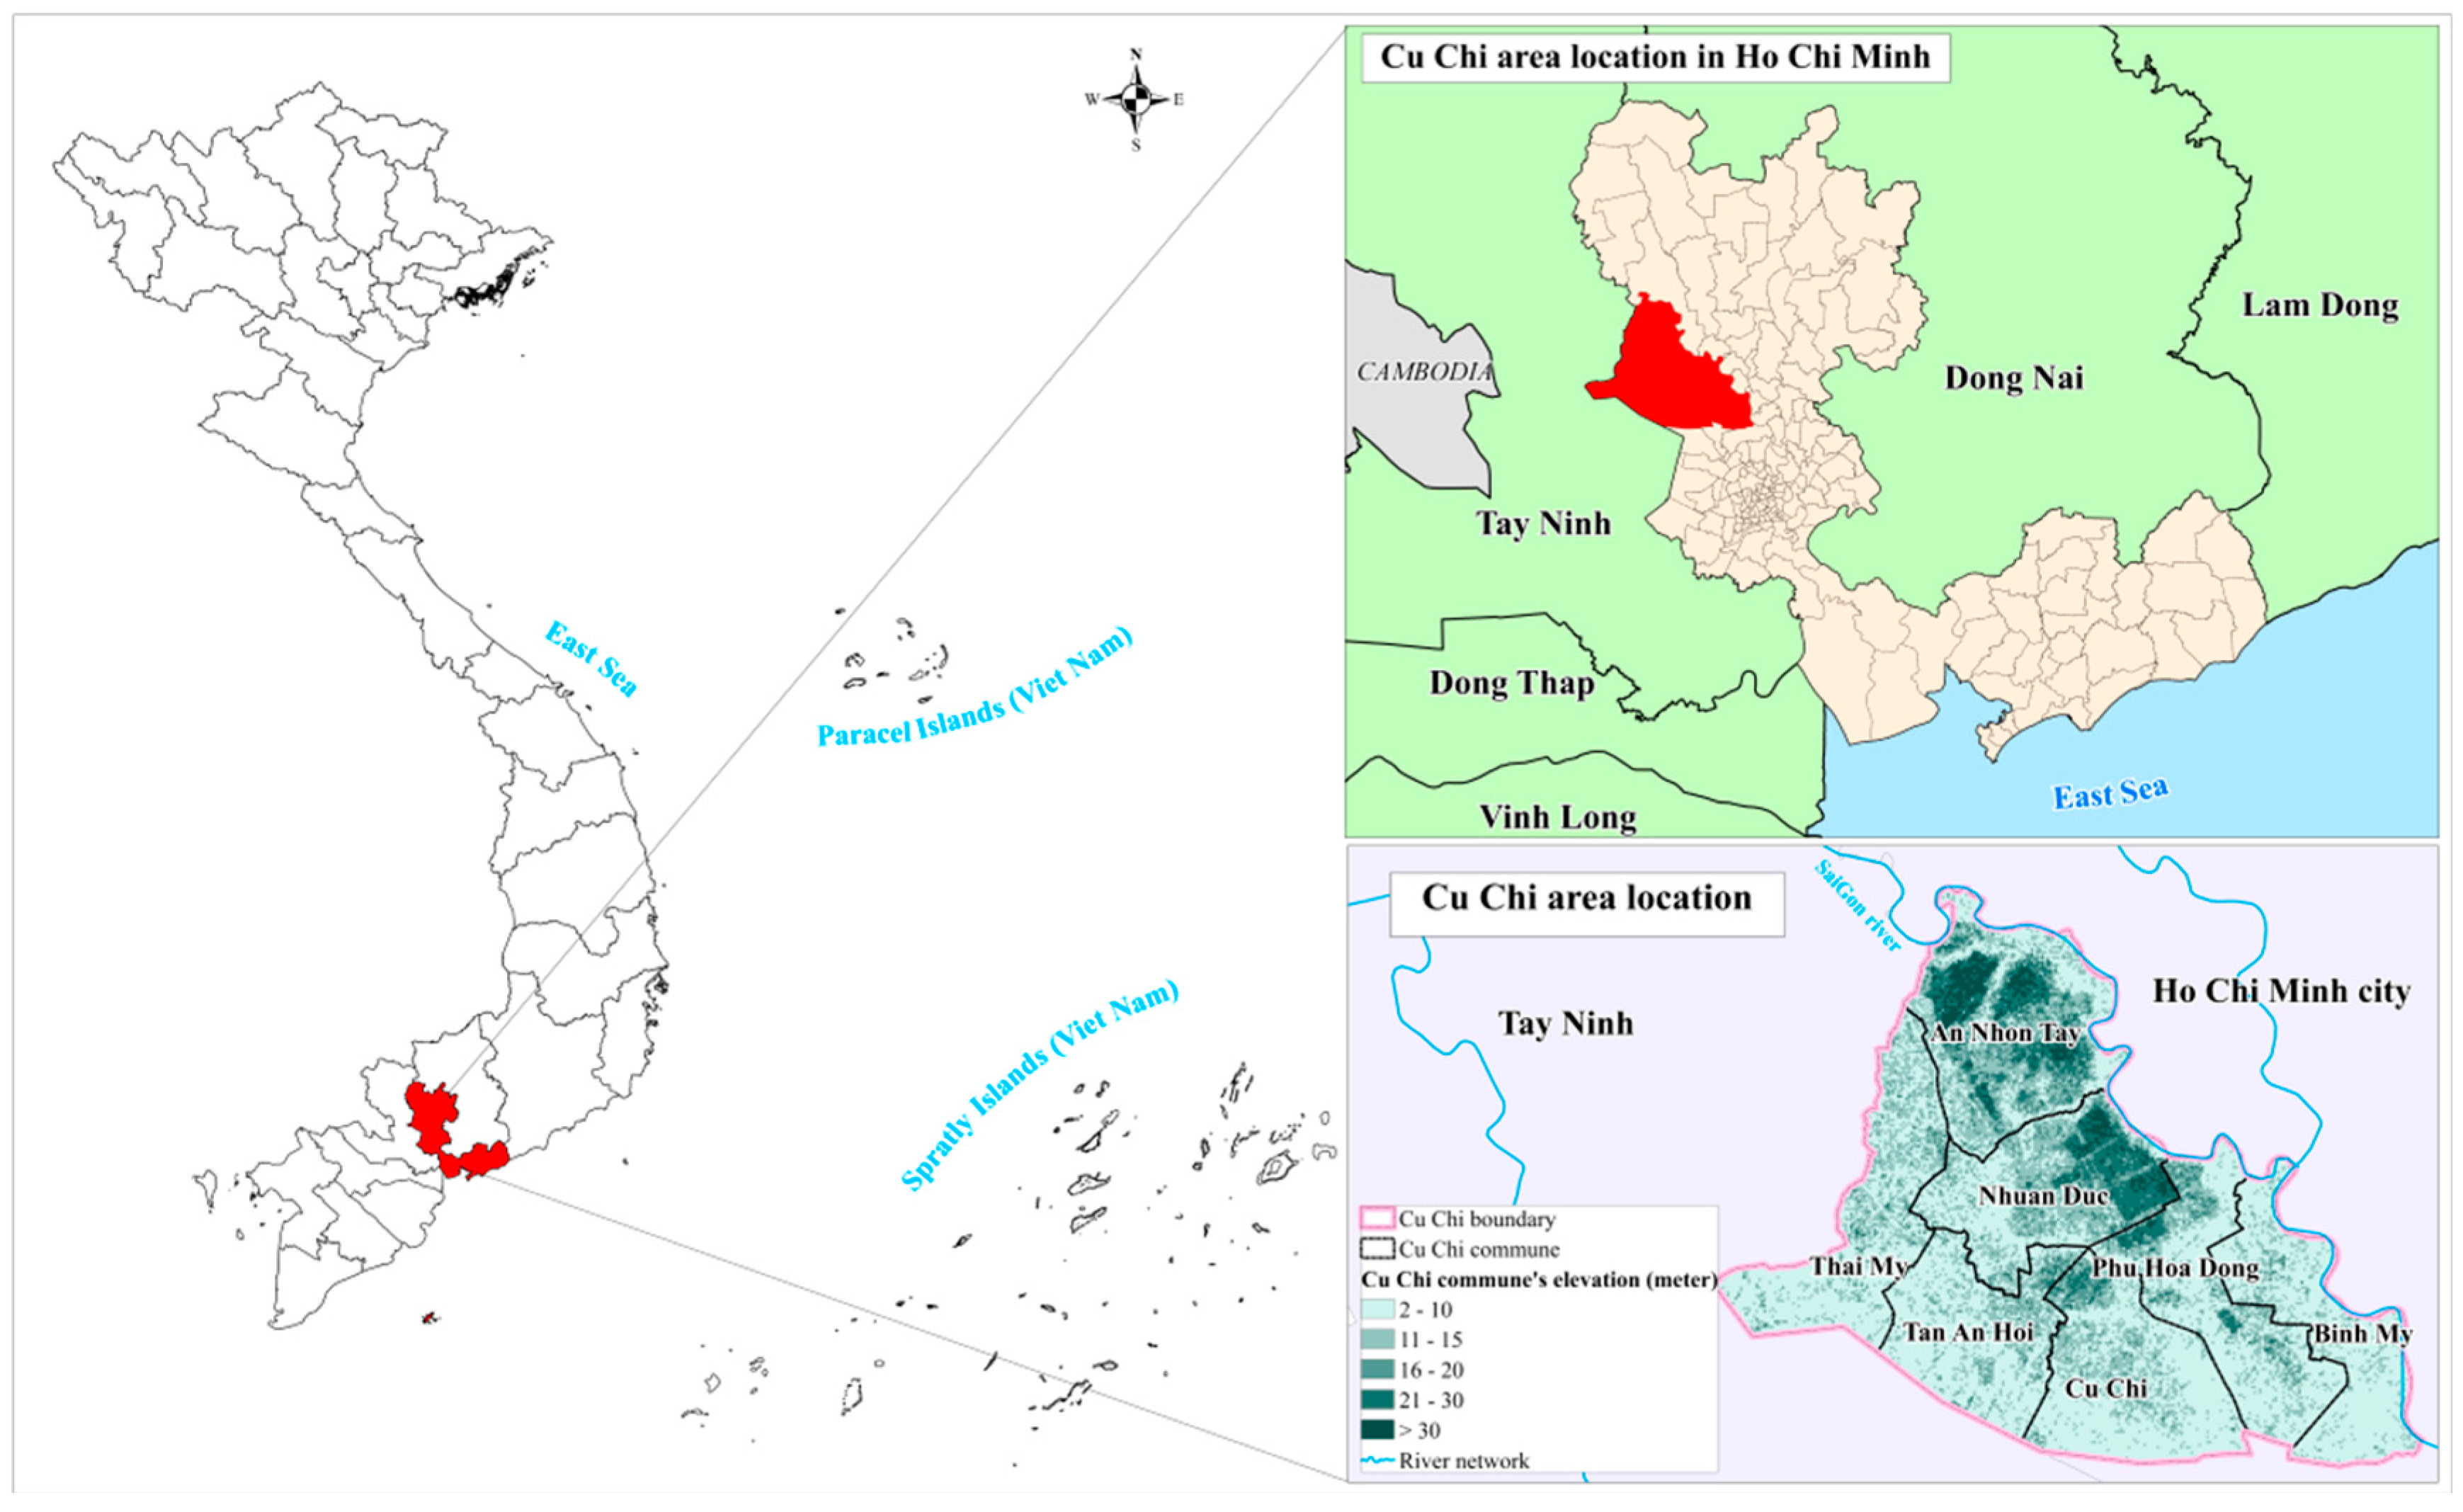
Figure 2 summarizes the overall methodological framework applied to analyze the spatiotemporal dynamics of urban expansion and landscape fragmentation in the Cu Chi area during 2010–2025.
Figure 2.
The overall methodological framework for analyzing the spatiotemporal dynamics of urban expansion and landscape fragmentation in the Cu Chi area.
4. Results and Discussion
4.1. Characteristics of Land Use and Land Cover Change During the 2010–2025 Period
The area statistics for the LULC in the Cu Chi area are summarized in Table 1, providing a basis for comparing changes in land cover composition over the study period. LULC statistics spanning from 2010 to 2025 highlight a remarkable transformation in the northern suburbs of HCM City, especially in the Cu Chi area, driven by rapid urbanization. A key trend observed is the persistent growth of urban land, which corresponds with a reduction in both cropland and forested areas. This shift clearly illustrates the movement away from agricultural landscapes towards more urbanized settings.
Table 1.
Land use and land cover (LULC) area statistics in Cu Chi area during 2010–2025 (ha).
Urban land has experienced significant growth, expanding from approximately 5273 hectares in 2010 to an estimated 20,353 hectares by 2025. This dramatic increase underscores the rapid urbanization process and the intrusion of metropolitan development into adjacent peri-urban spaces. Conversely, cropland has encountered a notable decline, decreasing from about 28,806 hectares to 18,407 hectares. This shift reflects the conversion of agricultural land for residential and infrastructural development. Furthermore, forest areas have suffered considerable losses, particularly during the period from 2010 to 2020, when forest cover plummeted from roughly 8062 hectares to a mere 2671 hectares. Although a slight recovery occurred, with forest cover rising to approximately 3183 hectares by 2025, this figure still represents a significant reduction compared to the 2010 levels. In contrast, water bodies have exhibited only marginal alterations, despite the rapid pace of urban growth.
4.2. Population Pressure and Urban Land Expansion in 2025
Population data used in this study were collected from the official websites of the 7 communes and the official electronic portal of HCM City. These datasets were further cross referenced and compiled through tinhthanhvn.com, to ensure consistency and data completeness prior to the administrative boundary merger implemented on 1 July 2025. Population and built-up land area data for the seven communes in 2025 are summarized in Table 2.
Table 2.
Population and built-up land area of the seven communes in 2025.
The results indicate a noticeable relationship between population distribution and urban land area in 2025. Communes with relatively high population levels, such as Binh My, Cu Chi, and Phu Hoa Dong, generally exhibited large built-up land areas, reflecting increasing pressure on housing demand, transportation infrastructure, and urban services. This pattern suggests that population concentration has played an important role in accelerating urban land expansion within the study area. However, the relationship was not entirely proportional among all communes. For example, An Nhon Tay recorded the largest built-up land area despite having a lower population compared to Binh My and Cu Chi. This finding implies that urban expansion in the area is not solely driven by demographic growth, but is also influenced by spatial planning orientation, land availability, infrastructure development, and suburban expansion processes.
4.3. Ordinary Least Squares Regression Results Between Urban Land and Land Use Classes
To evaluate the relationship between urban land and land use classes in the Cu Chi area, ordinary least squares regression models were applied for 2010, 2020, 2024, and 2025. The OLS regression coefficients and model-fit statistics for the relationships between urban land and other LULC classes across the four study years are summarized in Table 3.
Table 3.
OLS regression coefficients of LULC classes associated with urban land.
Although the OLS model revealed several trends in the relationship between urban land and land use classes, the statistical significance tests indicated that most regression coefficients were not significant at the 95% confidence level (p > 0.05). Among all variables, forest land in 2010 yielded the lowest p-value (p = 0.098), approaching significance at the 10% level. This suggests that forest land may have played a certain role in shaping the spatial structure of the peri-urban landscape during the early stage of urbanization. However, from 2020 onwards, the p-values for this variable exceeded 0.10, indicating that its influence on the spatial distribution of urban land gradually weakened over time.
For cropland, although the regression coefficient changed from positive in 2010 to negative in 2020, the corresponding p-values ranged from 0.303 to 0.980, indicating that this trend was not statistically significant. Similarly, the variables representing other land and water bodies consistently exhibited p-values greater than 0.40 throughout most of the study period, suggesting weak or insignificant linear relationships with urban land. These findings imply that urban expansion in Cu Chi cannot be adequately explained by conventional LULC classes alone, but is likely influenced by multiple interacting factors, including spatial planning strategies, transportation infrastructure development, urban development policies, and broader socioeconomic drivers. The p-values for the LULC variables in the OLS regression models for 2010, 2020, 2024, and 2025 are presented in Table 4 to assess their statistical significance across the study years.
Table 4.
Statistical significance levels (p values) of LULC variables in the OLS.
To evaluate multicollinearity among the independent variables, Variance Inflation Factor (VIF) values were calculated, as presented in Table 5.
Table 5.
Variance Inflation Factor (VIF) values of independent variables in the OLS.
All VIF values remained below 10, indicating no severe multicollinearity. During 2010–2020, cropland and forest land showed relatively higher VIFs, suggesting some correlation among land use classes in the early urban structure. By 2024–2025, VIF values dropped below 2, indicating greater independence among variables as the urban structure became more fragmented and diversified.
4.4. Morphological Characteristics of Urban Expansion from Landscape Expansion Index (LEI)
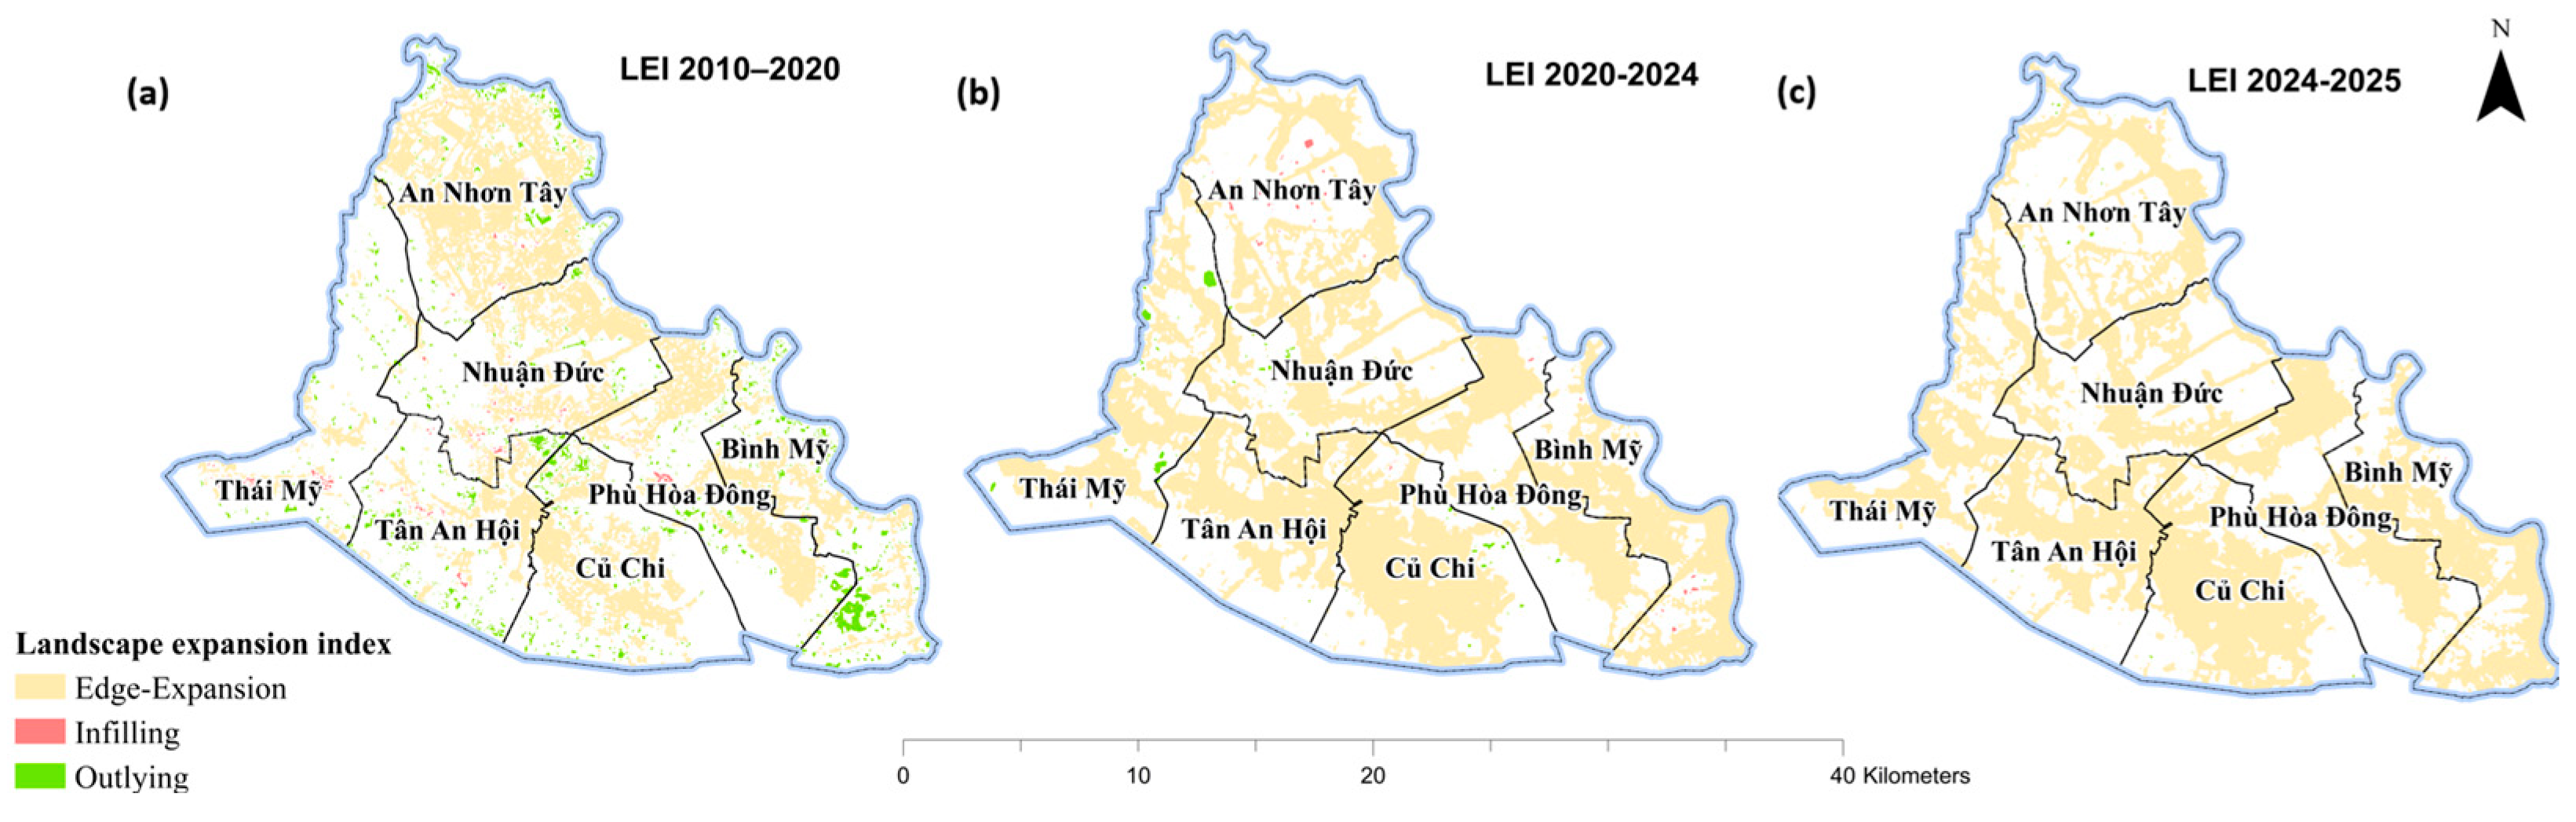
The areas of edge expansion, infilling, and outlying growth identified using the Land Expansion Index (LEI) for the three study periods are summarized in Table 6. The findings from the LEI indicate that the urban expansion within the Cu Chi area from 2010 to 2025 was predominantly characterized by edge expansion, while the roles of infilling and outlying growth were comparatively minimal. Between 2010 and 2020, edge expansion encompassed approximately 11,791.89 hectares, significantly outpacing infilling, which accounted for just 167.61 hectares, and outlying growth at 1329.15 hectares. This trend suggests a pronounced outward extension from existing developed regions. In the subsequent period from 2020 to 2024, edge expansion increased further to 20,724.55 hectares, in stark contrast to the diminutive figures for outlying and infilling growth, which were recorded at 146.58 hectares and 59.73 hectares, respectively. During the final interval of 2024 to 2025, edge expansion continued to dominate at 20,335.85 hectares, while both infilling and outlying growth saw a reduction to negligible amounts of 2.85 hectares and 14.77 hectares.
Table 6.
Urban expansion area based on the LEI classification during 2010–2025.
Collectively, these results substantiate the assertion that urbanization in the Cu Chi area has remained consistently led by edge expansion, with infilling and outlying growth contributing minimally to the overall spatial configuration.
The spatial distribution of these urban expansion types during the three study periods is illustrated in Figure 3. Spatially, edge expansion was widely distributed across most communes, with the highest concentrations in Phu Hoa Dong, Binh My, and Tan An Hoi, reflecting sustained outward growth surrounding existing urban areas. In contrast, outlying growth occurred only in scattered patches within the northern and northwestern communes, particularly An Nhon Tay and Thai My, while infilling remained limited across the study area. Overall, the LEI analysis demonstrates that urban expansion in Cu Chi District was overwhelmingly driven by edge expansion, resulting in a predominantly contiguous urban growth pattern during 2010–2025.
Figure 3.
Spatial Distribution of urban expansion types derived from the landscape expansion index (LEI) during (a) 2010–2020, (b) 2020–2024, and (c) 2024–2025.
4.5. Spatial-Temporal Dynamics of Urban Landscape Fragmentation
Table 7 presents the changes in urban landscape fragmentation categories in the study area during the 2010–2025 period.
Table 7.
Temporal variation in landscape fragmentation classes (2010–2025).
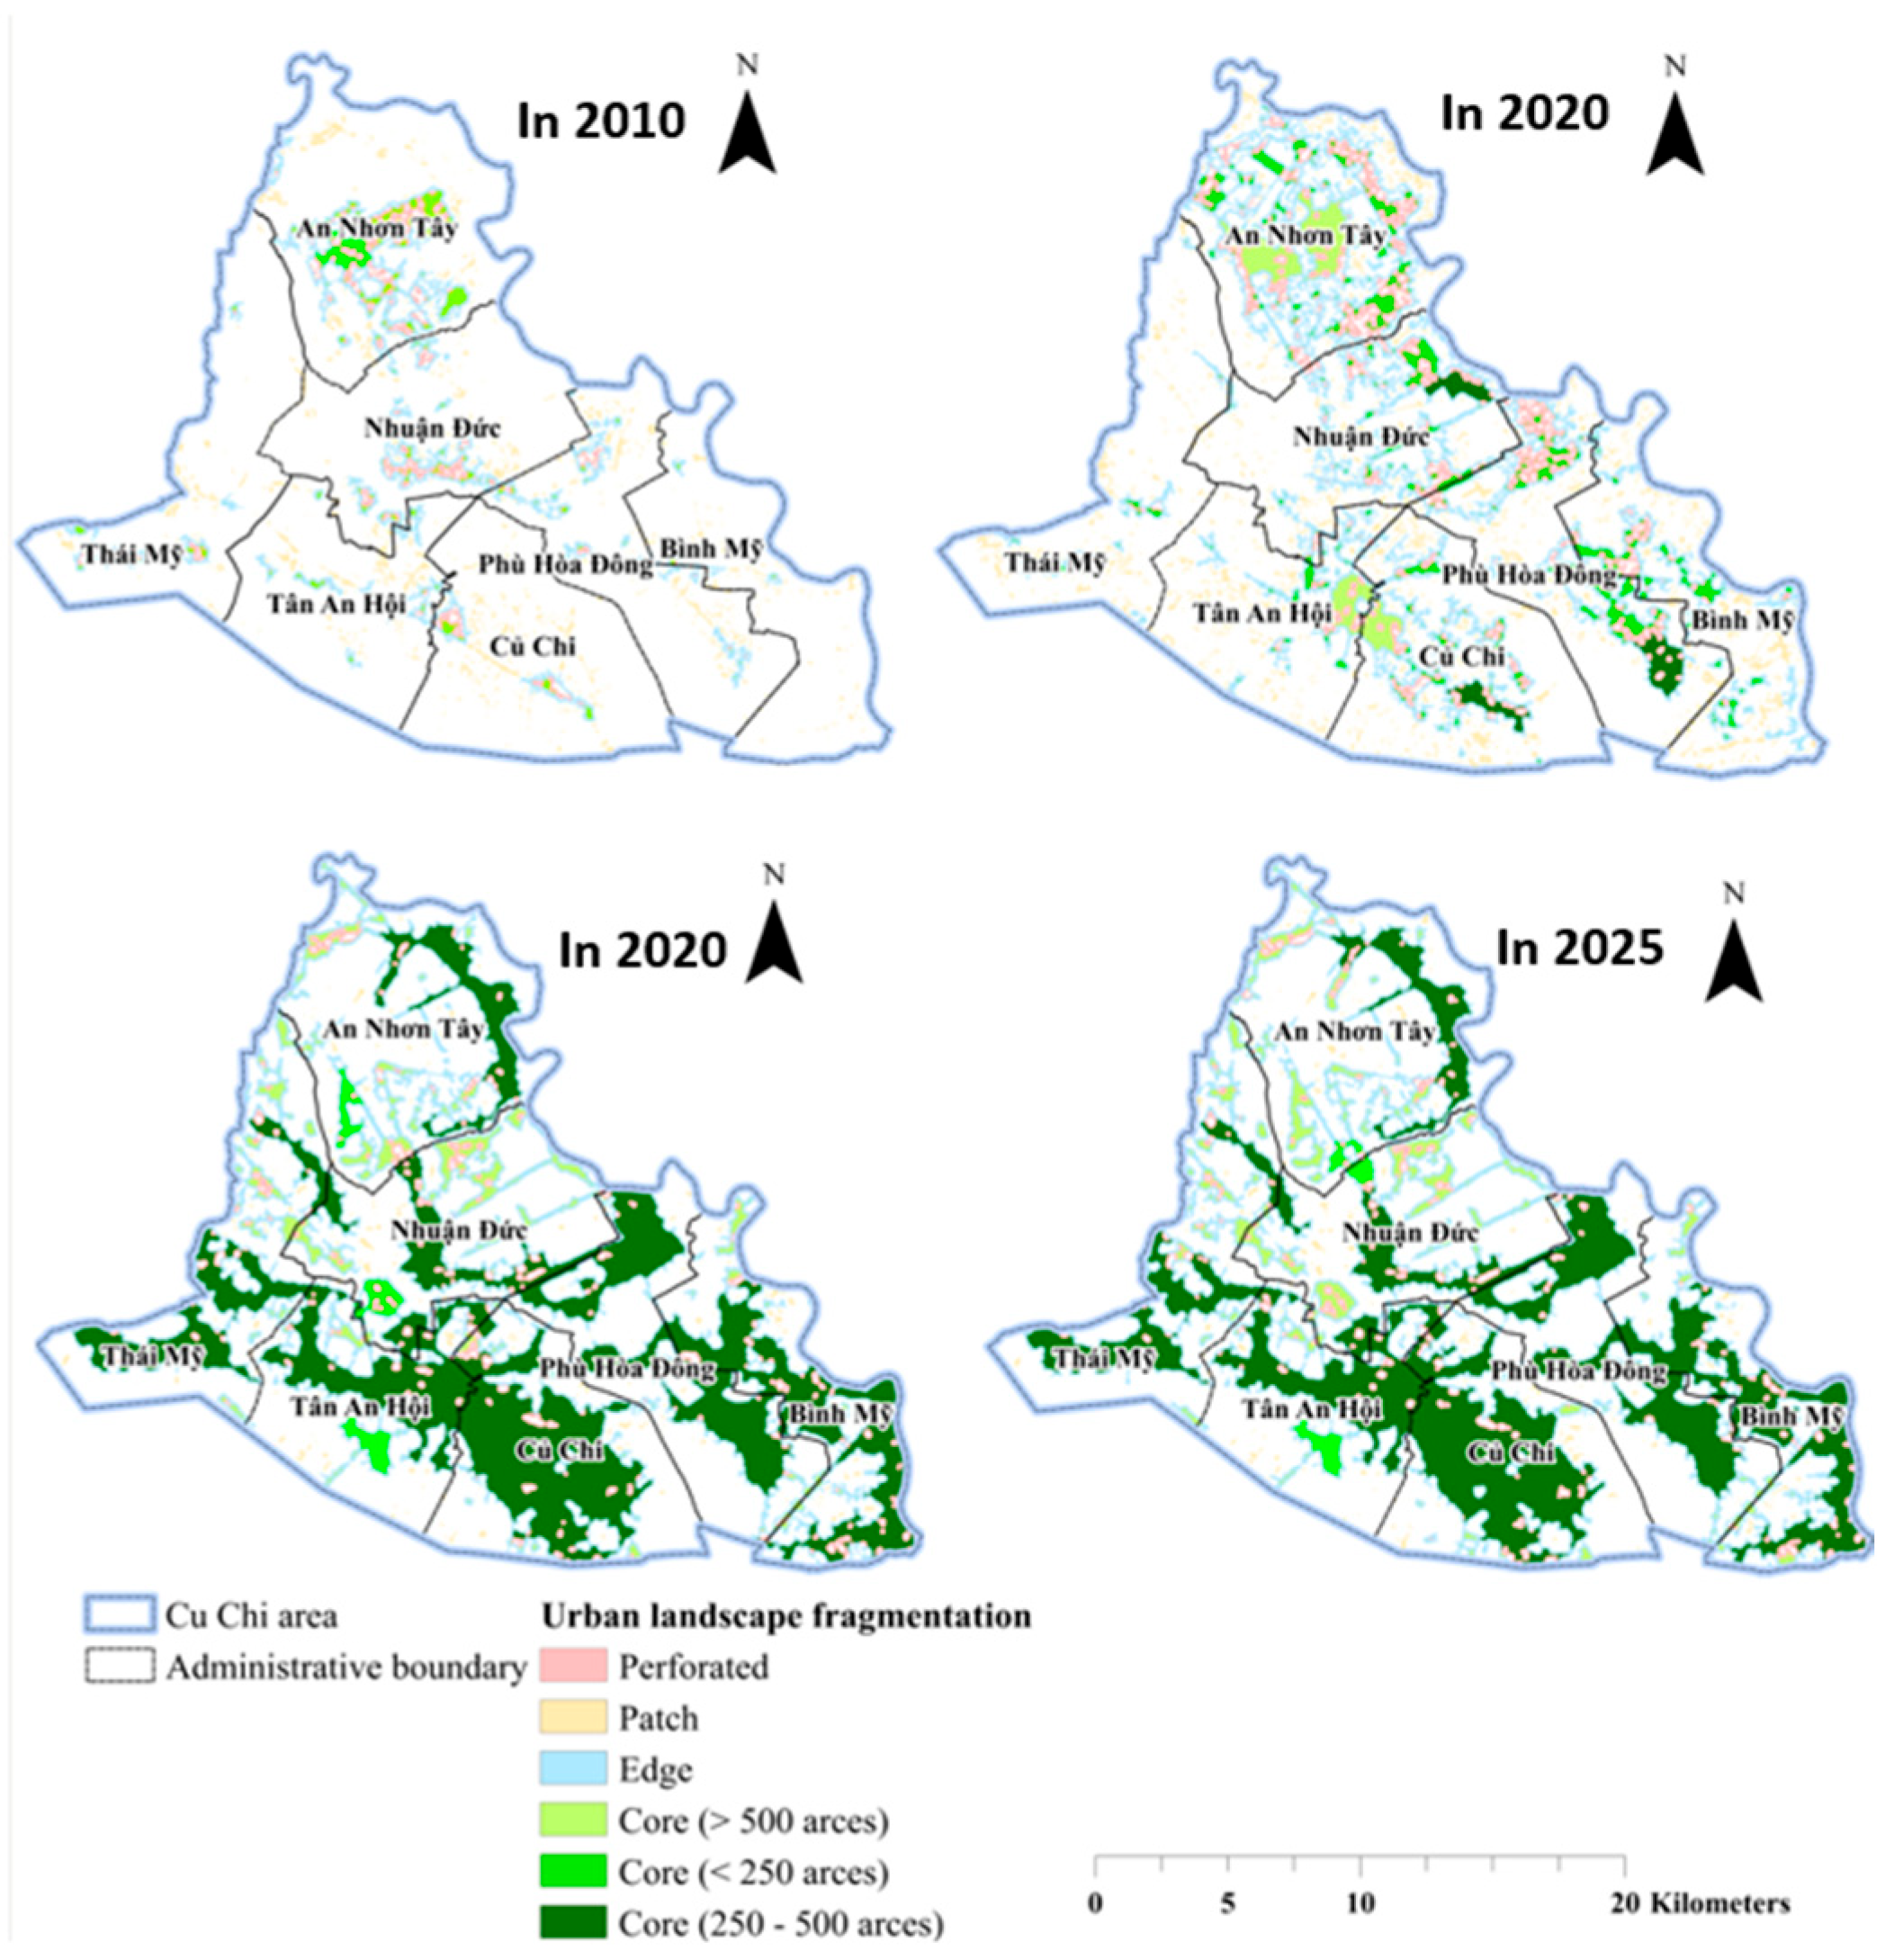
From 2010 to 2025, urban landscape shifted from a fragmented to a more connected and consolidated structure. In 2010, Patch and Edge classes dominated, reflecting dispersed development with limited Core areas. By 2020, Edge and Perforated classes increased and Core areas began to emerge, indicating growing spatial connectivity. In 2024–2025, Core areas expanded strongly while Patch areas declined, showing consolidation of urban patches, although Edge areas remained dominant, reflecting continued expansion in transition zones. Figure 4 shows clear spatial differences in urban landscape fragmentation in Cu Chi during 2010–2025. In 2010, fragmented patches dominated in An Nhon Tay, Tan An Hoi, and Cu Chi commune, with almost no Core areas. By 2020, Edge and Perforated patterns expanded toward Nhuan Duc, Phu Hoa Dong, and Binh My, indicating intensified urban growth along residential corridors. In 2024–2025, Core areas became dominant in Cu Chi, Binh My, and Tan An Hoi, while Edge areas remained widely distributed, reflecting continued expansion in transition zones.
Figure 4.
Spatial-temporal distribution of urban landscape fragmentation patterns.
4.6. Changes in the Directional Distribution of Urban Built-Up Areas
4.6.1. Spatial Directional Trends Using Standard Deviational Ellipse (SDE)
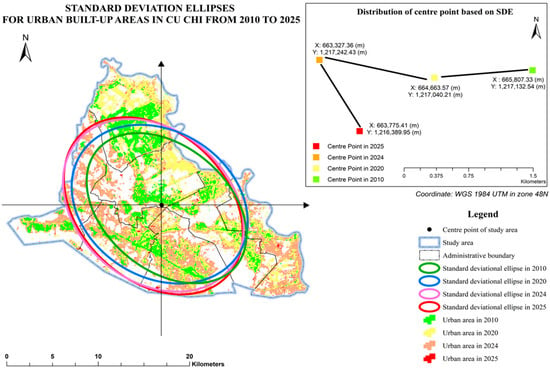
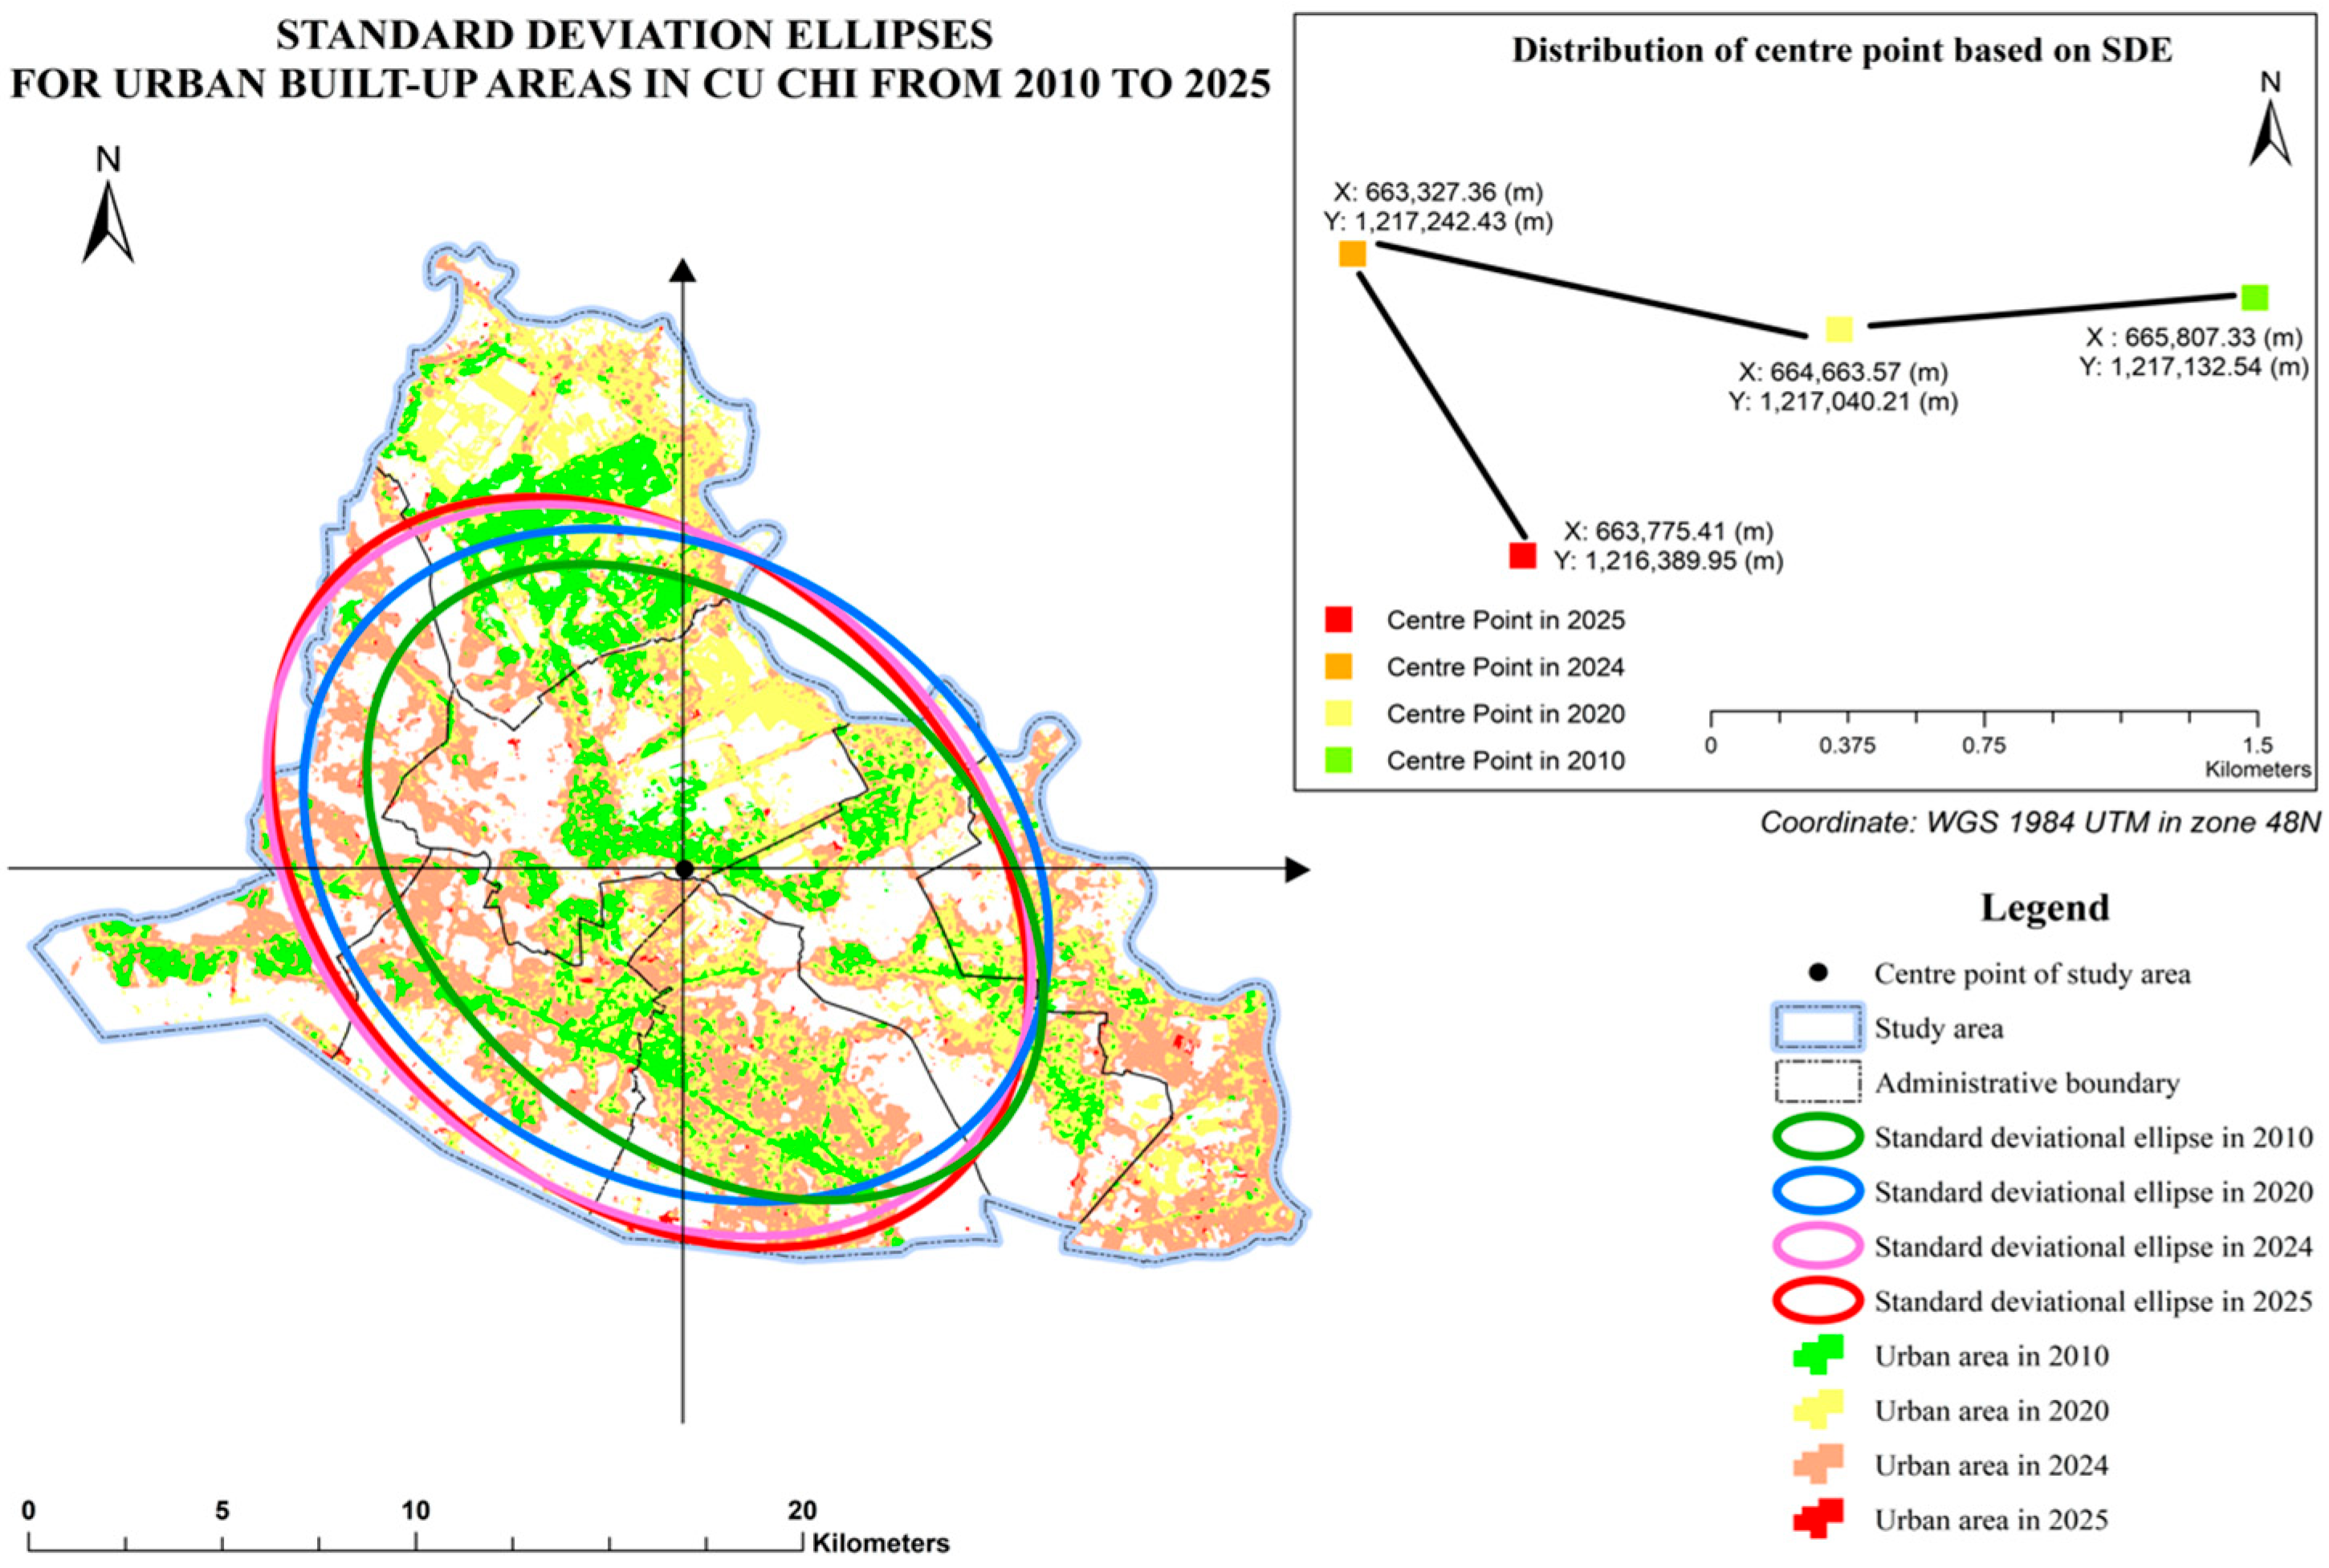
As presented in Table 8, the SDE results reveal notable changes in the spatial distribution of urban areas in Cu Chi between 2010 and 2025. From 2010 to 2024, X StdDist increased from about 10,033.90 m to 11,052.55 m, indicating stronger expansion along the northwest-southeast axis, while Y StdDist rose from 6898.64 m to 8402.09 m, showing gradual multi directional dispersion. By 2025, the pattern changed more clearly, with Y StdDist increasing sharply to 11,325.32 m while X StdDist decreased to 8221.06 m, suggesting a shift toward stronger expansion along the northeast-southwest axis. The rotation angle ranged from approximately 125.970° to 136.930°, indicating a relatively stable overall orientation of urban growth.
Table 8.
Summary of Standard Deviational Ellipse (SDE) parameters during 2010–2025.
Figure 5 shows the spatial distribution and directional trend of urban expansion in Cu Chi based on SDE (2010–2025). Urban growth remained concentrated in the central area, indicated by overlapping ellipses over time. Increasing ellipse size from 2010 to 2024 reflects gradual spatial expansion and dispersion, while the northwest-southeast orientation suggests development along major transport corridors and residential zones.
Figure 5.
Standard deviational ellipses of built-up areas in the Cu Chi area during 2010–2025.
4.6.2. Urban Density Distribution Using Kernel Density Analysis
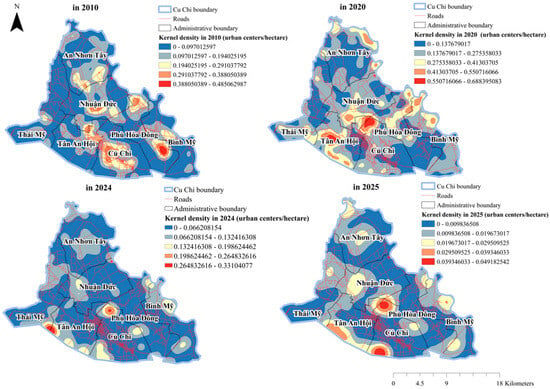
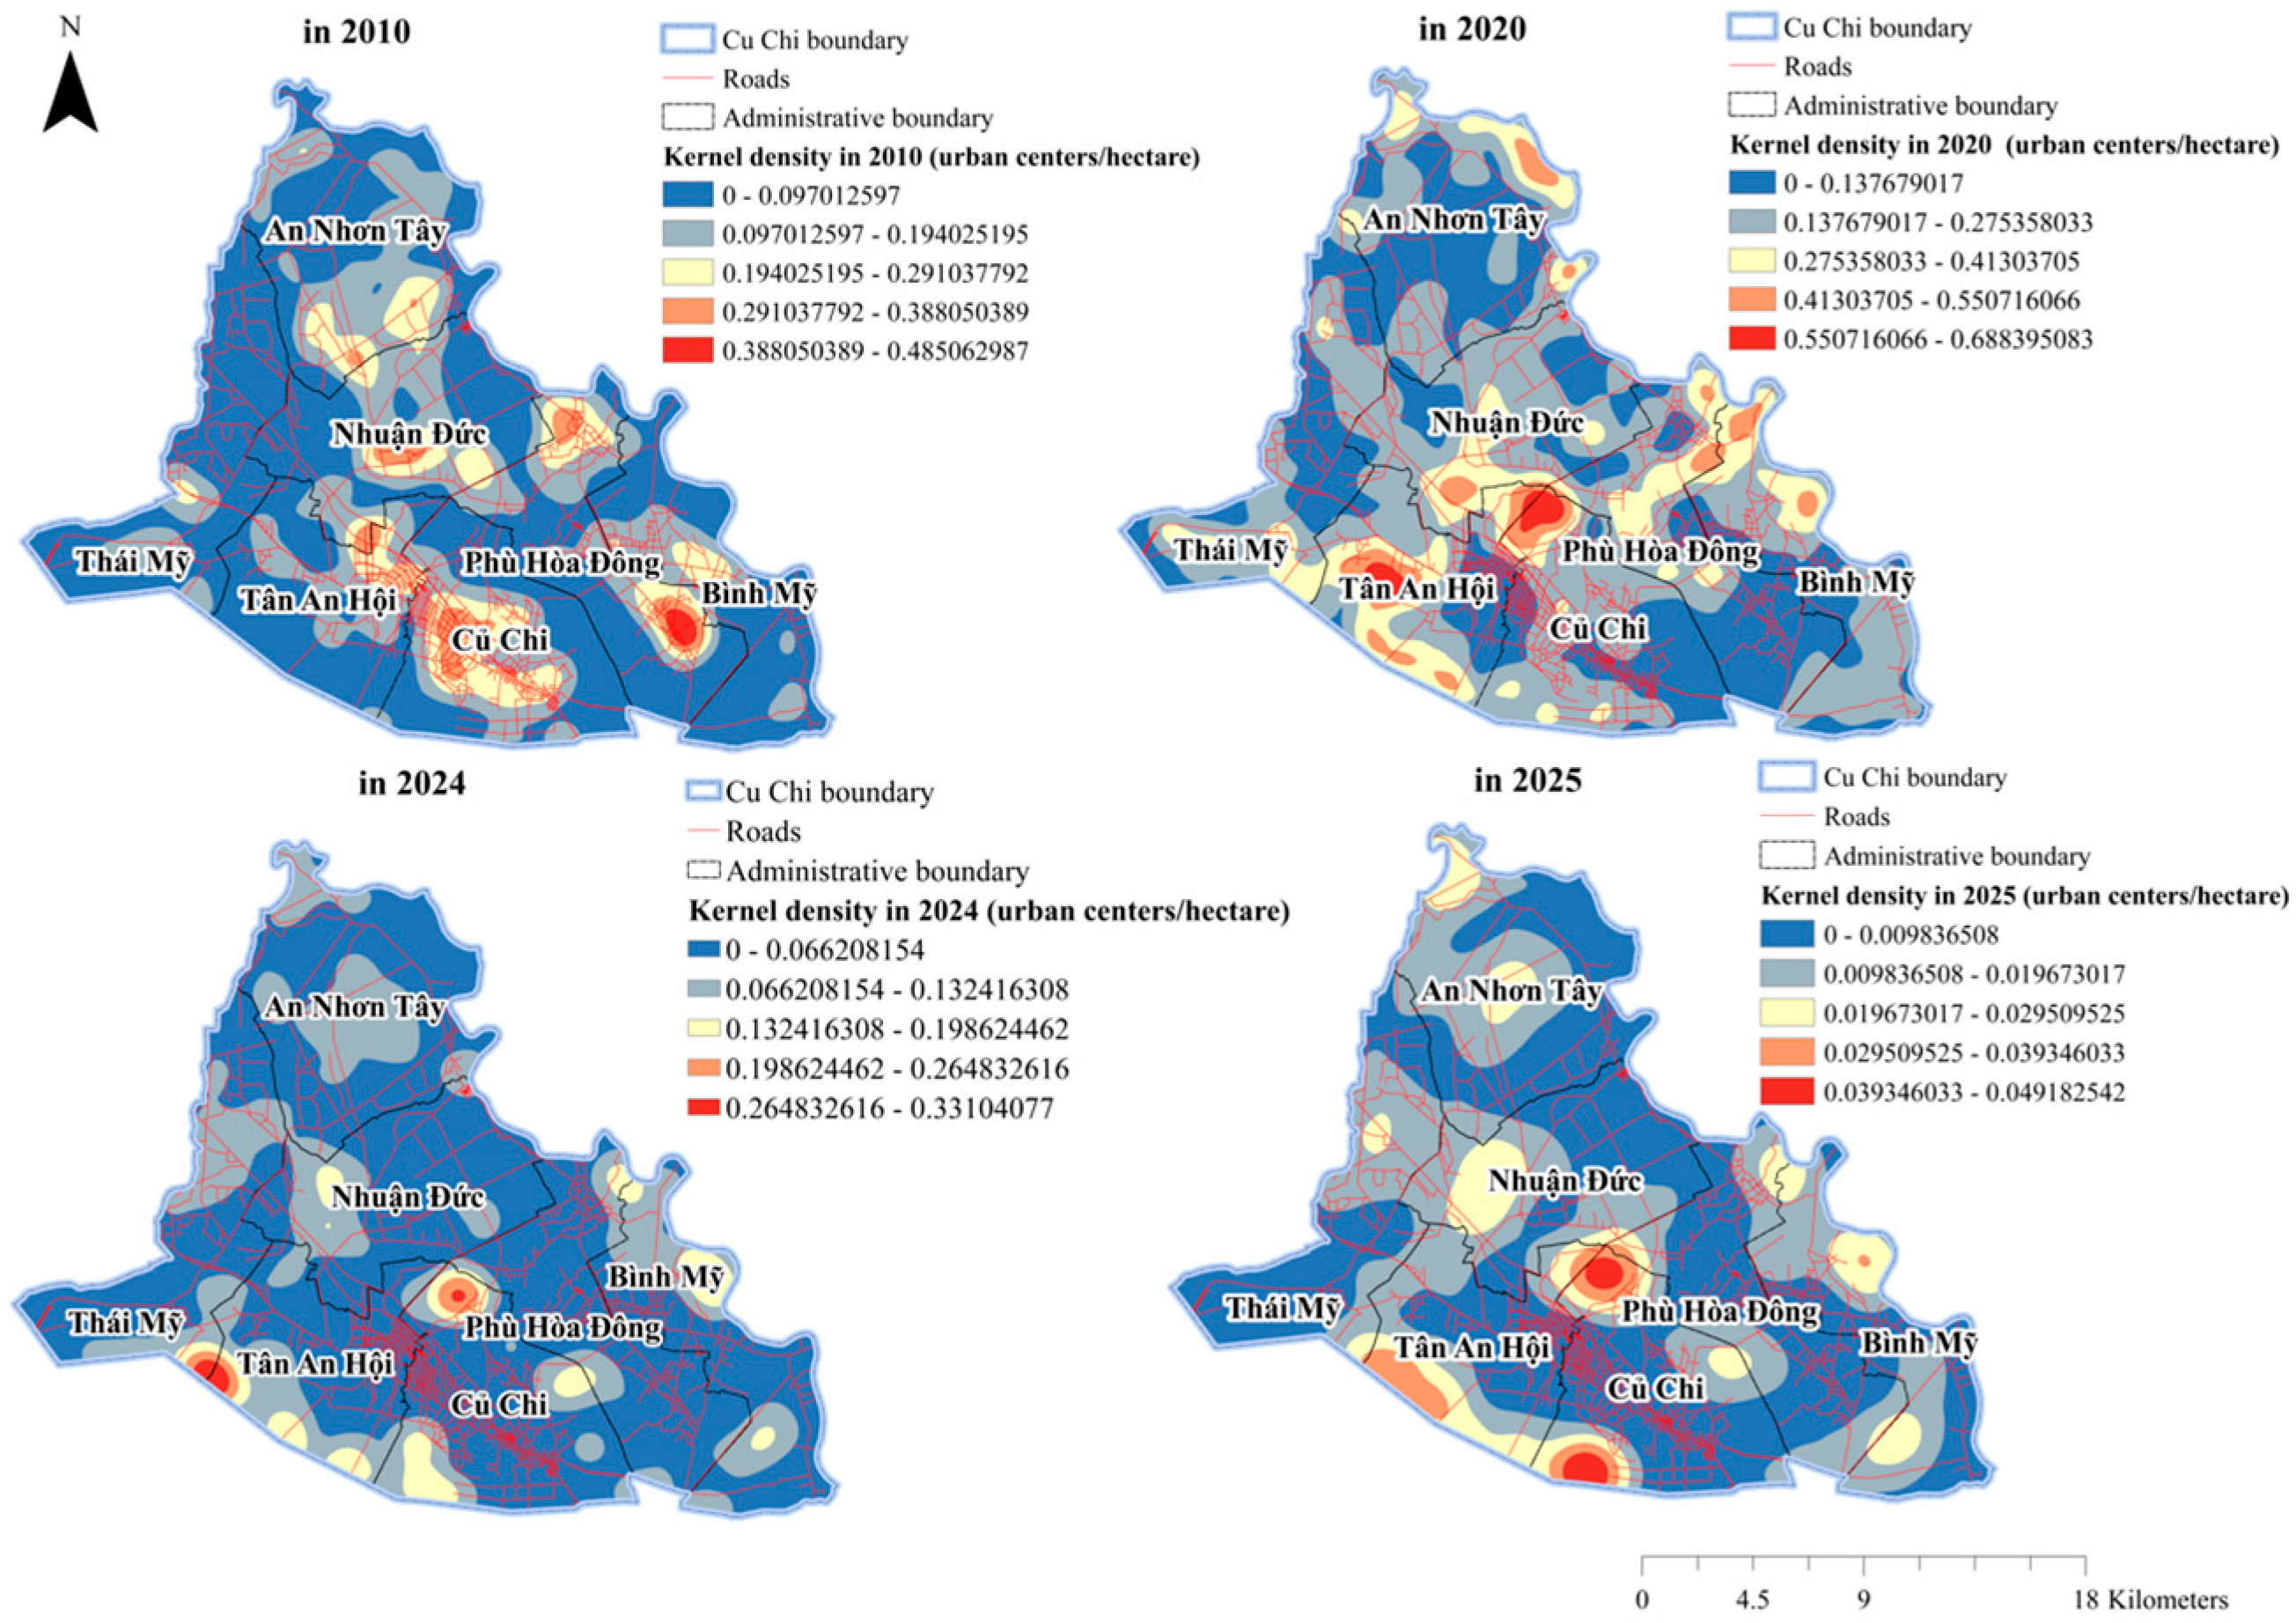
Figure 6 illustrates the spatial distribution of urban density in the Cu Chi area based on Kernel Density analysis during 2010–2025. Urban hotspots were mainly concentrated in the central and southern areas, particularly around Cu Chi, Binh My, and Tan An Hoi. Urban density increased markedly in 2020 along major transportation corridors, then slightly declined during 2024–2025 while remaining spatially concentrated. In contrast, northern communes such as An Nhon Tay and Thai My consistently showed low urban density throughout the study period.
Figure 6.
Spatial distribution of urban density based on Kernel Density analysis in the Cu Chi area.
4.7. Spatial Autocorrelation and Clustering Patterns of Urban Expansion
4.7.1. Global Spatial Autocorrelation Analysis of Urban Expansion
Global Moran’s I value from 2010 to 2025 are close to zero (−0.001681 to 0.002612), indicating very weak spatial dependence and no clear global clustering or dispersion. Expected values remain near zero, supporting spatial randomness, while small differences between observed and expected values confirm no meaningful deviation from a random pattern. Low variance, near zero Z-scores (−0.2448 to 0.1992), and p-values > 0.05 further confirm that the results are not statistically significant. Overall, urban expansion shows weak and non-significant global spatial autocorrelation, suggesting that spatial patterns are mainly driven by localized processes rather than global clustering.
The Global Moran’s I statistics, including the observed and expected indices, variance, z-scores, and p-values for 2010, 2020, 2024, and 2025, are presented in Table 9.
Table 9.
Global Moran’s I statistics for urban expansion (2010–2025).
Overall, the results indicate a weak or statistically non-significant global spatial autocorrelation throughout the period from 2010 to 2025, indicating that urban clustering does not manifest significantly on a global scale. Consequently, urban growth appears to be predominantly influenced by localized processes rather than uniform regional clustering. This underscores the necessity for local scale analyses, such as Local Indicators of Spatial Association (LISA), to more effectively delineate the spatial heterogeneity inherent in the dynamics of urban expansion.
4.7.2. Spatial Distribution of Local Indicators of Spatial Association (LISA)
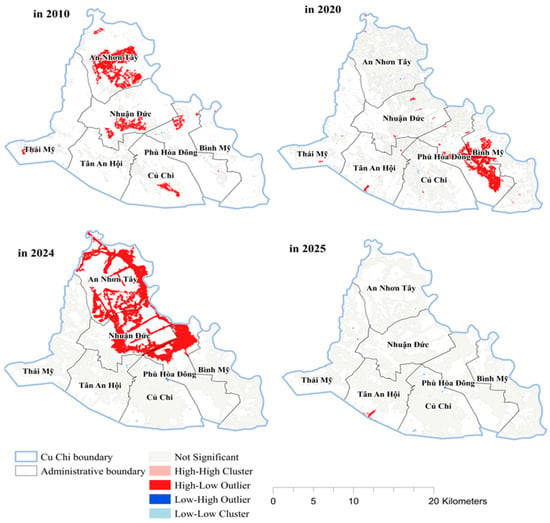
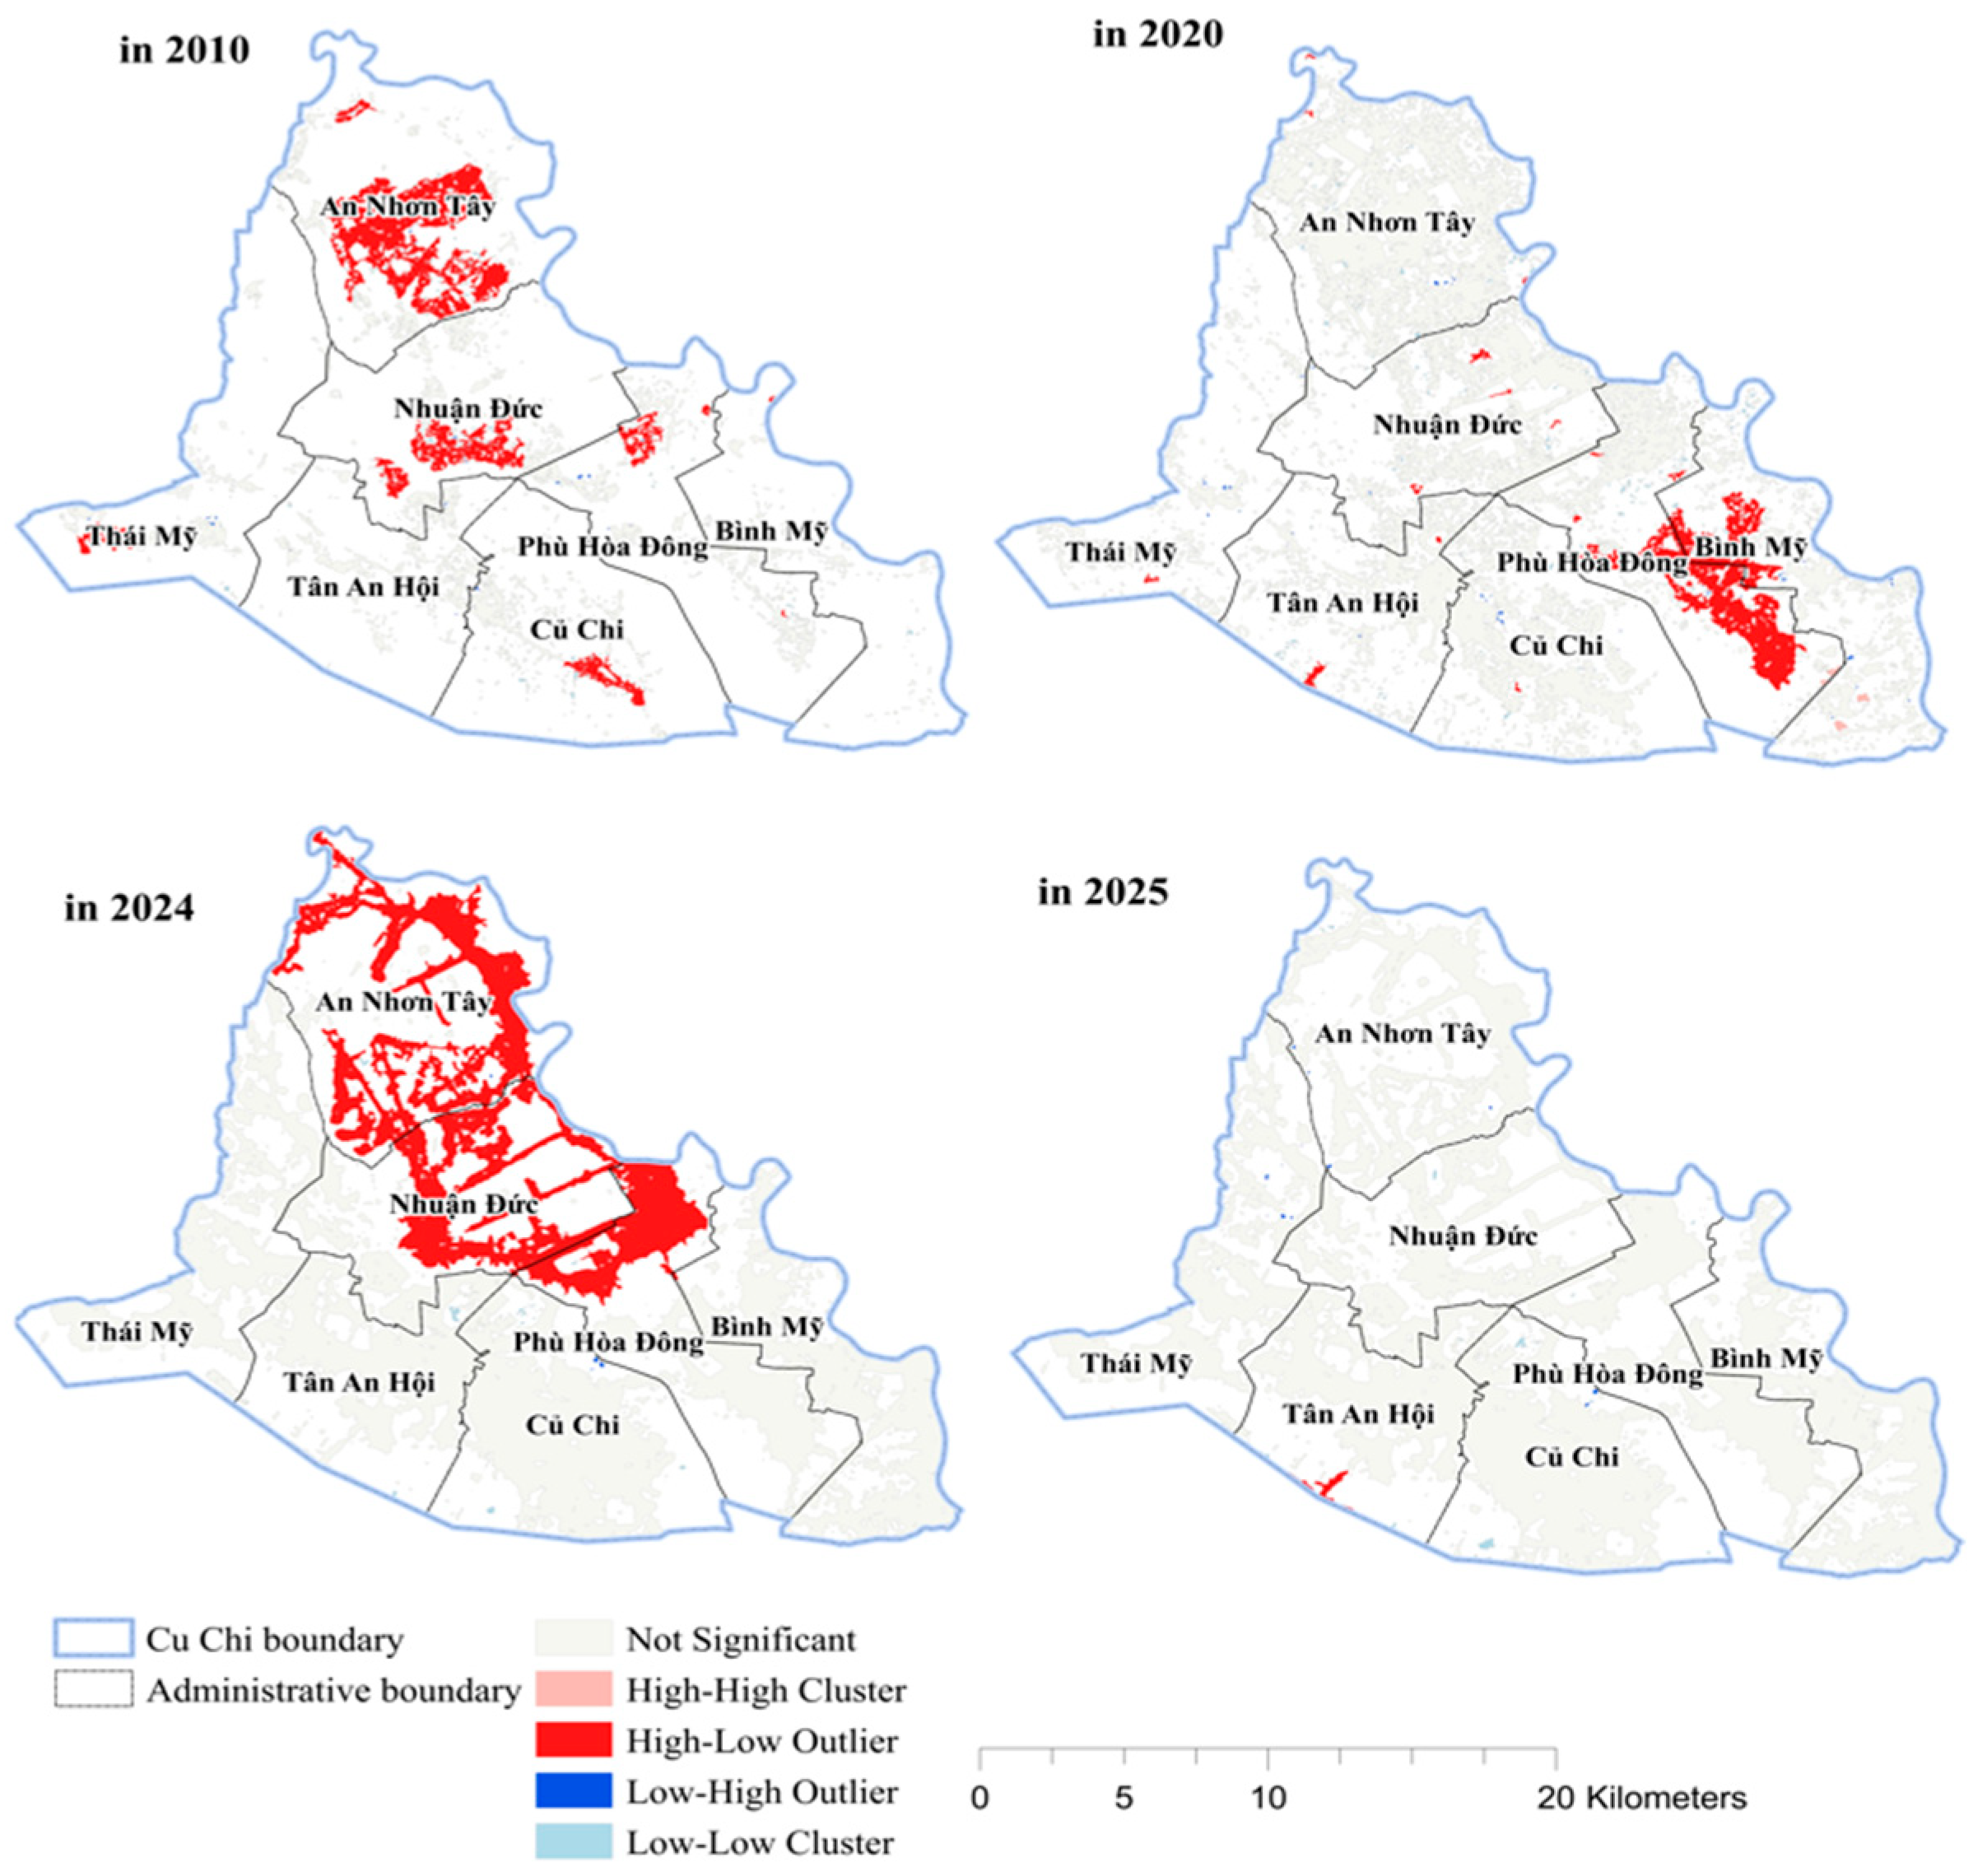
LISA results reveal clear spatiotemporal differentiation in urban expansion patterns during 2010–2025. The Not Significant class dominated and increased substantially over time, indicating weak global clustering and strong spatial heterogeneity. Among statistically significant clusters, the HL (high-low) category occupied the largest area throughout the study period, reflecting high-value urban expansion areas surrounded by lower-value neighboring zones. In contrast, LH (low-high) and LL (low-low) clusters remained relatively limited, while the HH (high-high) cluster appeared only in 2020 and was not spatially persistent.
The areas and classifications of Local Indicators of Spatial Association (LISA) clusters for 2010, 2020, 2024, and 2025 are summarized in Table 10.
Table 10.
Spatial distribution of LISA cluster areas in urban expansion (2010–2025).
The spatial distribution of Local Indicators of Spatial Association (LISA) clusters in the Cu Chi area across 2010, 2020, 2024, and 2025 is illustrated in Figure 7. In 2010, the area was highly fragmented with mainly non-significant patterns and only limited H-L (High-Low) clusters in An Nhon Tay and Nhuan Duc. By 2020, a H-H (High-High) cluster appeared in Binh My along with increasing H-L and L-L (Low-Low) patterns, showing early formation of urban cores. In 2024, H-L clusters expanded in An Nhon Tay and Nhuan Duc, suggesting spatial spillover along development corridors, while L-L areas persisted. By 2025, most areas became non-significant, indicating a diffusion or stabilization of previous clustering, with heterogeneity still prevailing.
Figure 7.
LISA clustering of urban built-up areas in the Cu Chi area from 2010 to 2025.
The urban expansion pattern observed in the Cu Chi area was not only driven by population growth and market forces, but was also closely associated with urban planning orientation and land management policies implemented in the northern peri-urban zone of HCM City. Infrastructure development, the expansion of transportation corridors, and suburban development strategies accelerated the conversion of agricultural land into built-up areas, particularly in communes located near major transportation routes and newly urbanized zones [24].
5. Conclusions
This study investigates the changes in urban growth and landscape fragmentation in Cu Chi from 2010 to 2025, utilizing GIS and spatial statistics. The findings reveal significant urban expansion, primarily due to the conversion of agricultural land and alterations in the peri-urban landscape, with urban areas increasing while cropland and forests diminish. The LEI results suggest that edge expansion is the primary trend, indicating a pattern of urban sprawl rather than a compact development approach. Fragmentation analysis indicates a progression from isolated land patches to more interconnected urban centers, signifying a greater level of spatial integration. Additionally, SDE and Kernel Density analyses highlight a northwest-southeast growth trajectory concentrated along transportation corridors and residential zones. Although Global Moran’s I indicate weak overall spatial autocorrelation, LISA identifies localized clusters and varying spatial characteristics. Ultimately, these findings underscore the ongoing transformation of urban areas and emphasize the need for sustainable planning practices.
Author Contributions
Conceptualization, N.T.N. and C.H.T.; methodology, C.H.T. and V.M.L.; software, C.H.T.; validation, N.T.N., V.M.L. and C.H.T.; formal analysis, C.H.T.; investigation, N.T.N. and V.M.L.; resources, V.M.L. and P.H.T.; data curation, V.M.L. and C.H.T.; writing—original draft preparation, C.H.T.; writing—review and editing, N.T.N., V.M.L., P.H.T. and C.H.T.; visualization, C.H.T.; supervision, P.H.T.; project administration, P.H.T. All authors have read and agreed to the published version of the manuscript.
Funding
The authors would like to sincerely thank the Vietnam Academy of Science and Technology for financially supporting this research through project No. NVKN03.02/26-27.
Institutional Review Board Statement
Not applicable.
Informed Consent Statement
Not applicable.
Data Availability Statement
The Sentinel-2 10 m Land Use/Land Cover (LULC) Time Series dataset is available through ArcGIS Living Atlas of the World (https://livingatlas.arcgis.com/landcover/, accessed on 15 April 2026). Population data were collected from the official websites of the seven communes and the official electronic portal of Ho Chi Minh City, with supplementary cross-checking using tinhthanhvn.com (https://tinhthanhvn.com/, accessed on 29 May 2026).
Conflicts of Interest
The authors declare no conflicts of interest.
References
- Alphan, H. Land use change and urbanization of Adana, Turkey. Land Degrad. Dev. 2003, 14, 575–586. [Google Scholar] [CrossRef] [Scilit]
- Antrop, M. Landscape change and the urbanization process in Europe. Landsc. Urban Plan. 2004, 67, 9–26. [Google Scholar] [CrossRef] [Scilit]
- Forman, R.T.T. Land Mosaics: The Ecology of Landscapes and Regions; Cambridge University Press: Cambridge, UK, 1995. [Google Scholar]
- Schneider, A.; Woodcock, C.E. Compact, dispersed, fragmented, extensive? A comparison of urban growth in twenty-five global cities using remotely sensed data. Urban Stud. 2008, 45, 659–692. [Google Scholar] [CrossRef] [Scilit]
- McGarigal, K.; Marks, B.J. FRAGSTATS: Spatial Pattern Analysis Program for Quantifying Landscape Structure; USDA Forest Service: Portland, OR, USA, 1995.
- Waterman, R. Sentinel-2 Land Cover Explorer: Quickstart Guide. Esri. Available online: https://www.esri.com/arcgis-blog/products/arcgis-living-atlas/imagery/global-land-cover-revealed (accessed on 1 May 2026).
- Liu, X.; Li, X.; Chen, Y.; Tan, Z.; Li, S.; Ai, B. A new landscape index for quantifying urban expansion using multi temporal remotely sensed data. Landsc. Ecol. 2010, 25, 671–682. [Google Scholar] [CrossRef] [Scilit]
- Vogt, P.; Riitters, K.; Estreguil, C.; Kozak, J.; Wade, T.G.; Wickham, J.D. Mapping spatial patterns with morphological image processing. Landsc. Ecol. 2007, 22, 171–177. [Google Scholar] [CrossRef] [Scilit]
- Uuemaa, E.; Mander, Ü.; Marja, R. Trends in the use of landscape spatial metrics as landscape indicators: A review. Ecol. Indic. 2013, 28, 100–106. [Google Scholar] [CrossRef] [Scilit]
- Center for Land Use Education and Research (CLEAR). Landscape Fragmentation Tool (LFT) Version 2.0 User Guide; University of Connecticut: Storrs, CT, USA, 2014. [Google Scholar]
- ESRI. Ordinary Least Squares (OLS) (Spatial Statistics). Available online: https://pro.arcgis.com/en/pro-app/3.3/tool-reference/spatial-statistics/ordinary-least-squares.htm (accessed on 1 May 2026).
- Yuill, R.S. The standard deviational ellipse: An updated tool for spatial description. Geogr. Ann. Ser. B Hum. Geogr. 1971, 53, 28–39. [Google Scholar] [CrossRef] [Scilit]
- Yu, Z.; Chen, L.; Li, L.; Zhang, T.; Yuan, L.; Liu, R.; Wang, Z.; Zang, J.; Shi, S. Spatiotemporal characterization of the urban expansion patterns in the Yangtze River Delta Region. Remote Sens. 2021, 13, 4484. [Google Scholar] [CrossRef] [Scilit]
- Zhao, S.; Da, L.; Tang, Z.; Fang, H.; Song, K.; Fang, J. Ecological consequences of rapid urban expansion: Shanghai, China. Front. Ecol. Environ. 2006, 4, 341–346. [Google Scholar] [CrossRef] [Scilit]
- Mitchell, A. The ESRI Guide to GIS Analysis, Volume 2: Spatial Measurements and Statistics; ESRI Press: Redlands, CA, USA, 2005. [Google Scholar]
- Gong, J. Clarifying the standard deviational ellipse. Geogr. Anal. 2002, 34, 155–167. [Google Scholar] [CrossRef]
- Silverman, B.W. Density Estimation for Statistics and Data Analysis; Chapman and Hall: London, UK, 1986. [Google Scholar]
- Bhat, M.A.; Shafiq, M.U.; Ahmed, P. Urban sprawl and its impact on land use/land cover dynamics of Dehradun City, India. Int. J. Sustain. Dev. World Ecol. 2010, 17, 540–544. [Google Scholar] [CrossRef] [Scilit]
- Li, X.; Yeh, A.G.O. Data mining of cellular automata’s transition rules. Int. J. Geogr. Inf. Sci. 2004, 18, 723–744. [Google Scholar] [CrossRef] [Scilit]
- Cliff, A.D.; Ord, J.K. Spatial Processes: Models and Applications; Pion: London, UK, 1981. [Google Scholar]
- Moran, P.A.P. Notes on continuous stochastic phenomena. Biometrika 1950, 37, 17–23. [Google Scholar] [CrossRef] [Scilit]
- Karami, M.; Dadashi Roudbari, A.; Asadi, M. Investigating the spatial variation of heat islands of Tehran. Int. J. Sci. Res. Publ. 2016, 6, 192–198. [Google Scholar]
- Anselin, L. Local indicators of spatial association—LISA. Geogr. Anal. 1995, 27, 93–115. [Google Scholar] [CrossRef] [Scilit]
- Ho Chi Minh City People’s Committee. Ho Chi Minh City Master Plan Toward 2040 and Vision to 2060; Ho Chi Minh City Department of Planning and Architecture: Ho Chi Minh City, Vietnam, 2023.

Disclaimer/Publisher’s Note: The statements, opinions and data contained in all publications are solely those of the individual author(s) and contributor(s) and not of MDPI and/or the editor(s). MDPI and/or the editor(s) disclaim responsibility for any injury to people or property resulting from any ideas, methods, instructions or products referred to in the content. |
© 2026 by the authors. Licensee MDPI, Basel, Switzerland. This article is an open access article distributed under the terms and conditions of the Creative Commons Attribution (CC BY) license.