


Abstract
The colon tissue can degenerate through abnormal cell growth within the lining of the colon or rectum. These abnormalities are tumors that can be benign (non-cancerous) or malignant (cancerous). When malignant tumors (adenocarcinoma) grow, they put pressure inside the colon and cause potential health risks to patients. Tumor identification remains a challenge for specialists due to the different variations in the appearance, shape, and size of tumors obtained through biopsies. With these considerations, this research proposes a convolutional neural network-based tool to support colorectal adenocarcinoma detection. For this, two sequential phases were carried out: data mining and software development. Regarding data mining, CRISP-DM was used as a methodology to design and evaluate a learning model. Along these lines, 94.8% accuracy, 96.67% precision, 92.8% sensitivity, 96.8% specificity, and 0.946 of F1-score were obtained through the confusion matrix. Next, our convolutional model was implemented within a web application using the waterfall model. Finally, conclusions and future work are described at the end of the paper.
1. Introduction
Colorectal cancer represents approximately 10% of all cancer cases worldwide. It is the third most common type of cancer and the second leading cause of cancer-related mortality. Globally, around 86% of colon cancer cases correspond to the histological type of adenocarcinoma [1].
Adenocarcinoma is a malignant tumor that originates in the glandular cells of the inner lining of the colon and can develop from untreated adenomatous polyps [2]. This tumor typically affects patients over 50 years of age and is associated with lifestyle factors such as a sedentary lifestyle, alcohol consumption, obesity, low intake of fruits and vegetables, and high consumption of processed meats.
Accurate and timely detection of this condition is essential for both healthcare professionals and patients [3]. However, detection presents several challenges; variations in the texture, appearance, and shape of tumors can lead to confusion and inaccurate diagnoses [4].
Currently, artificial intelligence (through deep learning) is a disruptive technology that has facilitated the emergence of CAD (Computer-Aided Detection) systems, which facilitate the early detection of these pathologies and allow the application of specialized treatments [5]; however, its implementation requires high computational demand related to speed and precision for real-time data processing. In this line, it is necessary to overcome this computational limitation and implement solutions that support the identification of this type of cancer quickly and accurately [6]. The use of deep learning algorithms has proven its efficiency and accuracy in various areas, including pattern processing and identification using medical imaging [7] for, e.g., imaging of histopathological lesions [8], cerebral hemorrhages [9], and breast cancer [10]; gastrointestinal endoscopic imaging [11]; thorax imaging [12]; human reproduction imaging [13]; and the study of kidney diseases [14], including methods for classification [15].
With this background, the aim of this research is to develop a tool based on a convolutional neural network (CNN) to support colorectal adenocarcinoma detection. For this purpose, a deep learning model is designed, developed and evaluated to be implemented within a web application.
The sections of the paper are organized as follows. Section 2 describes the methodology, theoretical framework, materials, and methods addressed for this research. Section 3 shows the results obtained and the tool designed from the data mining and software development processes, respectively. Finally, Section 4 compares our findings with previous research; it also highlights the conclusions of the paper and future research.
2. Theoretical Background
This section describes the theoretical principles underlying this research: colon adenocarcinoma and CNN.
2.1. Colon
The colon is the longest part of the large intestine. It is a tubular organ that extends from the cecum (where it connects to the small intestine) to the rectum. In adults, it measures approximately 1.5 m in length and is divided into four main sections: ascending, transverse, descending, and sigmoid [16].
The colon ascends along the right side of the abdominal cavity from the cecum to the hepatic (right colic) flexure. It then continues transversely across the abdomen to the splenic (left colic) flexure. From there, it descends along the left side of the abdomen to the left iliac region. Finally, the colon forms the sigmoid segment, which connects to the rectum [17].
The wall of the colon is composed of several layers of tissue: the mucosa (inner layer), submucosa, muscularis, and serosa (outer layer). The mucosa contains cells that absorb water and electrolytes from intestinal contents. The submucosa supports the colon through nerves, blood vessels, and lymphatic vessels. The muscularis layer facilitates peristaltic movements that propel fecal material. The serosa provides protection and structural support [18]. Consequently, the colon plays an important role in four key digestive functions.
First, the absorption of water and electrolytes (such as sodium and chloride) from food residues, which is essential for maintaining the body’s fluid and electrolyte balance.
Second, the formation and storage of feces. The colon reabsorbs water and converts undigested material into feces, which are temporarily stored in the descending and sigmoid colon prior to defecation.
Third, immune function. The colon contains lymphoid tissue and immune cells, such as lymphocytes and macrophages, which help protect against pathogens, regulate immune responses, and maintain intestinal health.
Fourth, metabolism. Nutrients not absorbed in the small intestine are utilized to support energy homeostasis. This includes the production and use of short-chain fatty acids (such as acetate, propionate, and butyrate), which provide additional energy, maintain the integrity of the intestinal mucosa, and regulate inflammatory responses [17].
2.2. Colon Adenocarcinoma
The colon adenocarcinoma is a malignant colon tumor that originates from the glandular epithelium of the colonic mucosa. Histologically, it is characterized by proliferation of malignant glands, desmoplastic stromal reaction, high mitotic activity, an area of necrosis, possible lymphatic-vascular invasion, variable mucin production (both intracellular and extracellular), and cellular atypia (including enlarged and hyperchromatic nuclei, loss of cell polarity, prominent nucleoli, and an increased nucleus-to-cytoplasm ratio).
Symptoms depend on the tumor’s location. If the tumor is in the right colon, symptoms include abdominal mass, fatigue, iron deficiency anemia, and weight loss. If the tumor is located in the left colon, symptoms include constipation, changes in bowel habits, hematochezia, and intestinal obstruction [16].
2.3. Convolutional Neural Network
A convolutional neural network is a type of deep neural network architecture that is particularly effective for processing and analyzing data with spatial and temporal patterns. A typical CNN consists of three main types of layers: convolutional, pooling, and dense (also known as fully connected) layers [19].
The convolutional layer applies filters (or kernels) that slide across the input image to generate feature maps. Each filter detects specific features, such as edges and textures, extracting relevant information from different regions of the image. Subsequently, nonlinear activation functions (such as ReLU, Rectified Linear Unit) are applied to enable the network to learn more complex representations. ReLU replaces negative values with zero, promoting sparsity and accelerating convergence while mitigating the vanishing gradient problem.
The pooling layer reduces the spatial dimensions of the feature maps while preserving the most relevant information. The most common operations are max pooling and average pooling. Max pooling selects the maximum value within each region, whereas average pooling computes the mean value. Both operations contribute to dimensionality reduction and improve robustness to small spatial variations in the input.
The dense layer performs the final classification based on the extracted features by combining them to predict the category of the input image.
3. Materials and Methods
Methodology and materials are described in this section.
3.1. Methodology
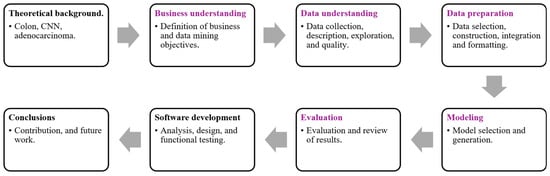
This research is structured into four phases: theoretical background, data mining, web development, and conclusions.
First, the theoretical background is presented. A brief conceptual overview of the colon and its functioning is provided to contextualize the case study. In this context, convolutional neural networks and their principles are explained to address the research problem. In addition, evaluation metrics based on the confusion matrix are described to interpret the results obtained during the data mining process. Finally, the hardware and software used for model development and training are detailed.
Second, the data mining phase is described. The methodology adopted is CRISP-DM (Cross-Industry Standard Process for Data Mining), which consists of the following phases: business understanding, data understanding, data preparation, modeling, and evaluation.
Third, the web development phase is presented. Based on the CNN model selected in the data mining stage, a web application is developed using the waterfall model. This phase includes three main activities: analysis, development, and functional testing.
Finally, the conclusions are outlined, including the contributions and directions for future work. Figure 1 summarizes the tasks involved in each phase.
Figure 1.
Research methodology.
3.2. Confusion Matrix
In the field of artificial intelligence, a confusion matrix is used to evaluate the performance of a supervised learning model based on its predictions. It is represented as a table that summarizes the outcomes in terms of four elements: true positive (TP), false positive (FP), true negative (TN), and false negative (FN). True positives correspond to correctly predicted positive cases, false positives to incorrectly predicted positive cases, true negatives to correctly predicted negative cases, and false negatives to incorrectly predicted negative cases [20].
Based on these elements, several performance metrics can be computed to assess the strengths and weaknesses of a model. The main metrics used in this research are described below:
- Accuracy. The proportion of correct predictions among all predictions. It is calculated using Equation (1).
- Precision. The proportion of correctly predicted positive cases among all positive predictions. It is calculated using Equation (2).
- Recall (Sensitivity). The proportion of actual positive cases correctly identified (i.e., the true positive rate). It is calculated using Equation (3).
- Specificity. The proportion of actual negative cases correctly identified (i.e., the true negative rate). It is calculated using Equation (4).
- F1-score. The harmonic mean of precision and recall provides a balance between both metrics. It is calculated using Equation (5).
- AUC. The area under the ROC (Receiver Operating Characteristic) curve. It represents the probability that the model can distinguish between positive and negative classes. An AUC value close to 1 indicates excellent performance, whereas a value of 0.5 suggests no discriminative ability.
3.3. Hardware and Software
This research required the use of hardware, software, and a training environment.
With respect to software, several frameworks, programming languages, and libraries were employed for both deep learning and web development.
For deep learning, TensorFlow 2.18.0 was used as the primary framework to create, train, and evaluate convolutional neural network models through its high-level API, Keras 3.7.0. Python 3.9 was used as the programming language due to its versatility in machine learning applications. In addition, the following libraries were utilized: NumPy 2.02 (for numerical computations), Pandas 2.2.3 (for data preprocessing and dataset management), Matplotlib 3.10.0 and Seaborn 0.13.2 (for data visualization), OpenCV 4.10.0.84 (for image preprocessing), and scikit-learn 1.6.0 (for model evaluation and validation).
For web development, Flask 3.1.0 was used as a lightweight Python-based web framework, enabling the development of a functional web interface. Additionally, Bootstrap 5.3.3 was employed to design responsive and user-friendly interfaces. HTML was used to structure content, CSS to define visual styles, and JavaScript to add interactivity.
Regarding hardware, the experiments were conducted on a computer with the following specifications: AMD Ryzen 5 PRO 2400G processor (3.60 GHz), 32 GB RAM, 1 TB SSD, NVIDIA GeForce GTX 1050 (3 GB), running Windows 11 Home.
Regarding the training environment, Google Colab (with Python 3.9) was used to train the models with GPU support, facilitating efficient experimentation and development of the CNN model.
3.4. Method
In this section, the data mining stages are described following the CRISP-DM methodology.
3.4.1. Business Understanding
This project aims to develop a tool to support the detection of colorectal cancer through the identification of adenocarcinoma. The proposed tool is designed to improve diagnostic accuracy by reducing false positives and false negatives. In this way, it helps minimize human error associated with visual interpretation, providing more precise and reliable results.
3.4.2. Data Understanding
The dataset was obtained from the Kaggle platform [21]. According to the source, the repository contains a collection of histopathological images of the large intestine, which were carefully selected and validated to ensure patient privacy and confidentiality in compliance with HIPAA (Health Insurance Portability and Accountability Act) regulations. The repository includes images of different types of tissue, providing a wide variety of examples of both healthy tissue and colorectal adenocarcinoma. This is crucial for training artificial intelligence models capable of accurately classifying normal tissue from cancerous tissue. The images are labeled with detailed information about their classification, enabling supervised learning, a fundamental technique for training CNNs that detect visual and structural patterns in histopathological images.
Additionally, the image quality was verified to minimize issues related to low resolution and inadequate lighting conditions. The dataset consists of 10,000 images in JPG format, each with a resolution of 768 × 768 pixels. These images are categorized into two classes:
- Colon adenocarcinoma. This class contains 5000 histopathological images of colon cancer, showing structural alterations in the tissue and atypical cells.
- Benign colon tissue. This class includes 5000 images of normal, non-cancerous colon tissue samples.
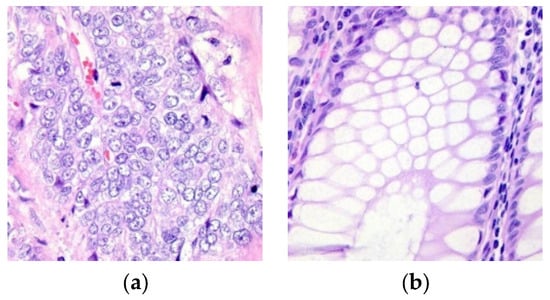
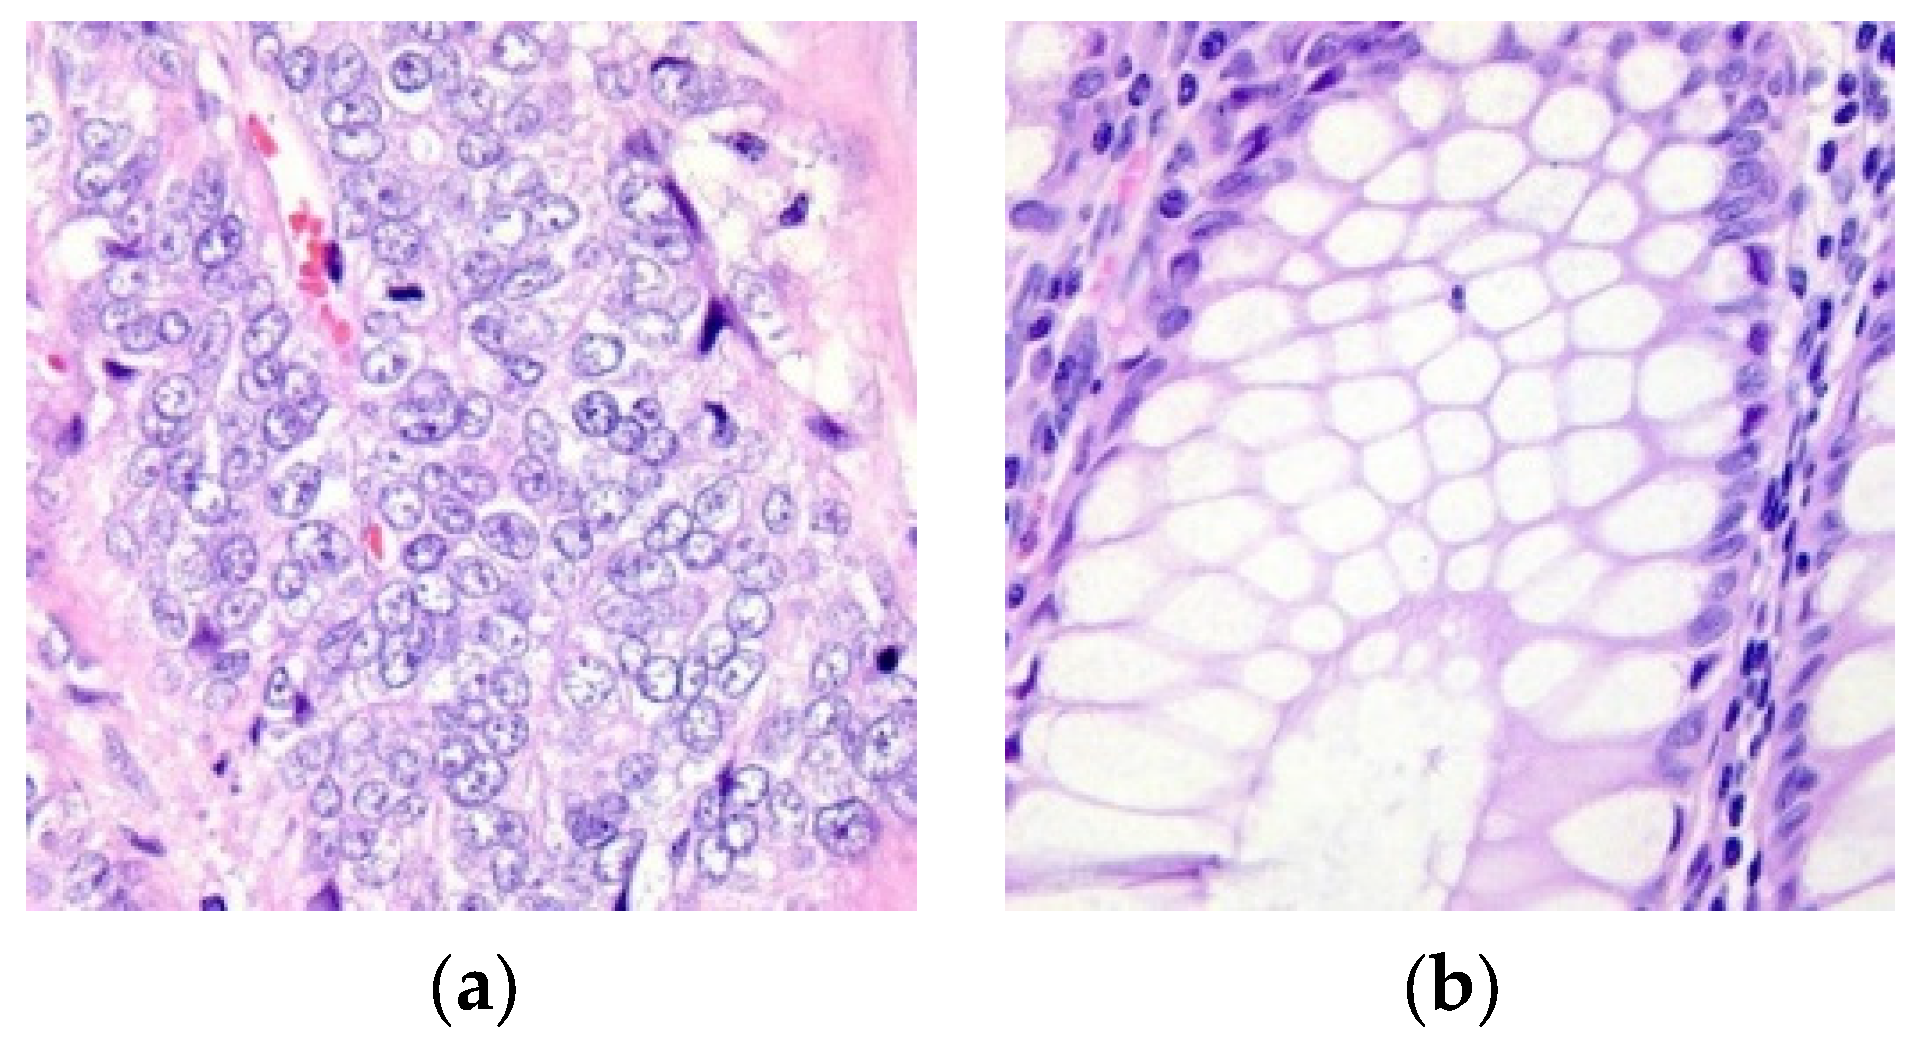
The dataset is balanced, with an equal number of images in each class. This is important to prevent bias during the training, validation, and testing phases, thereby improving the model’s generalization capability and predictive performance. Figure 2 presents sample images from both classes.
Figure 2.
Tissue (a) with adenocarcinoma and (b) benign.
3.4.3. Data Preparation
The dataset was split as follows: 90% for training, 5% for validation, and 5% for testing. To achieve this, source and target directories were defined. The source directory contains the images organized by class, while the target directory stores the images redistributed into three subdirectories (training, validation, and testing).
The images used in this research were obtained from a previously anonymized public repository. Consequently, it is not possible to identify the correspondence between the histological slides and the patients of origin, nor to determine the total number of patients represented in the dataset. The information available in the repository is limited to classifying the images as corresponding to benign tissue or tissue with adenocarcinoma. For this reason, this random splitting process helps prevent the model from learning biased or spurious patterns, thereby improving its ability to generalize.
3.4.4. Modeling
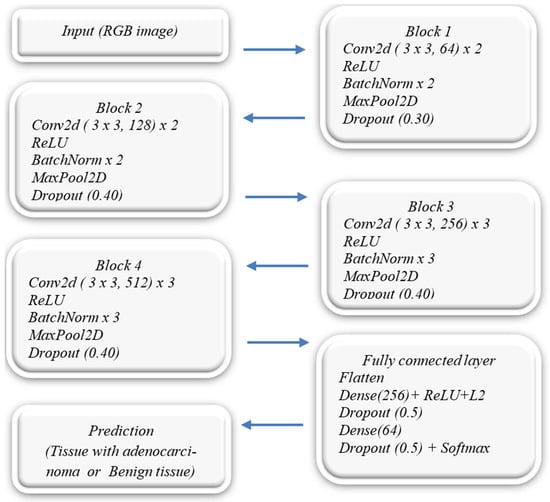
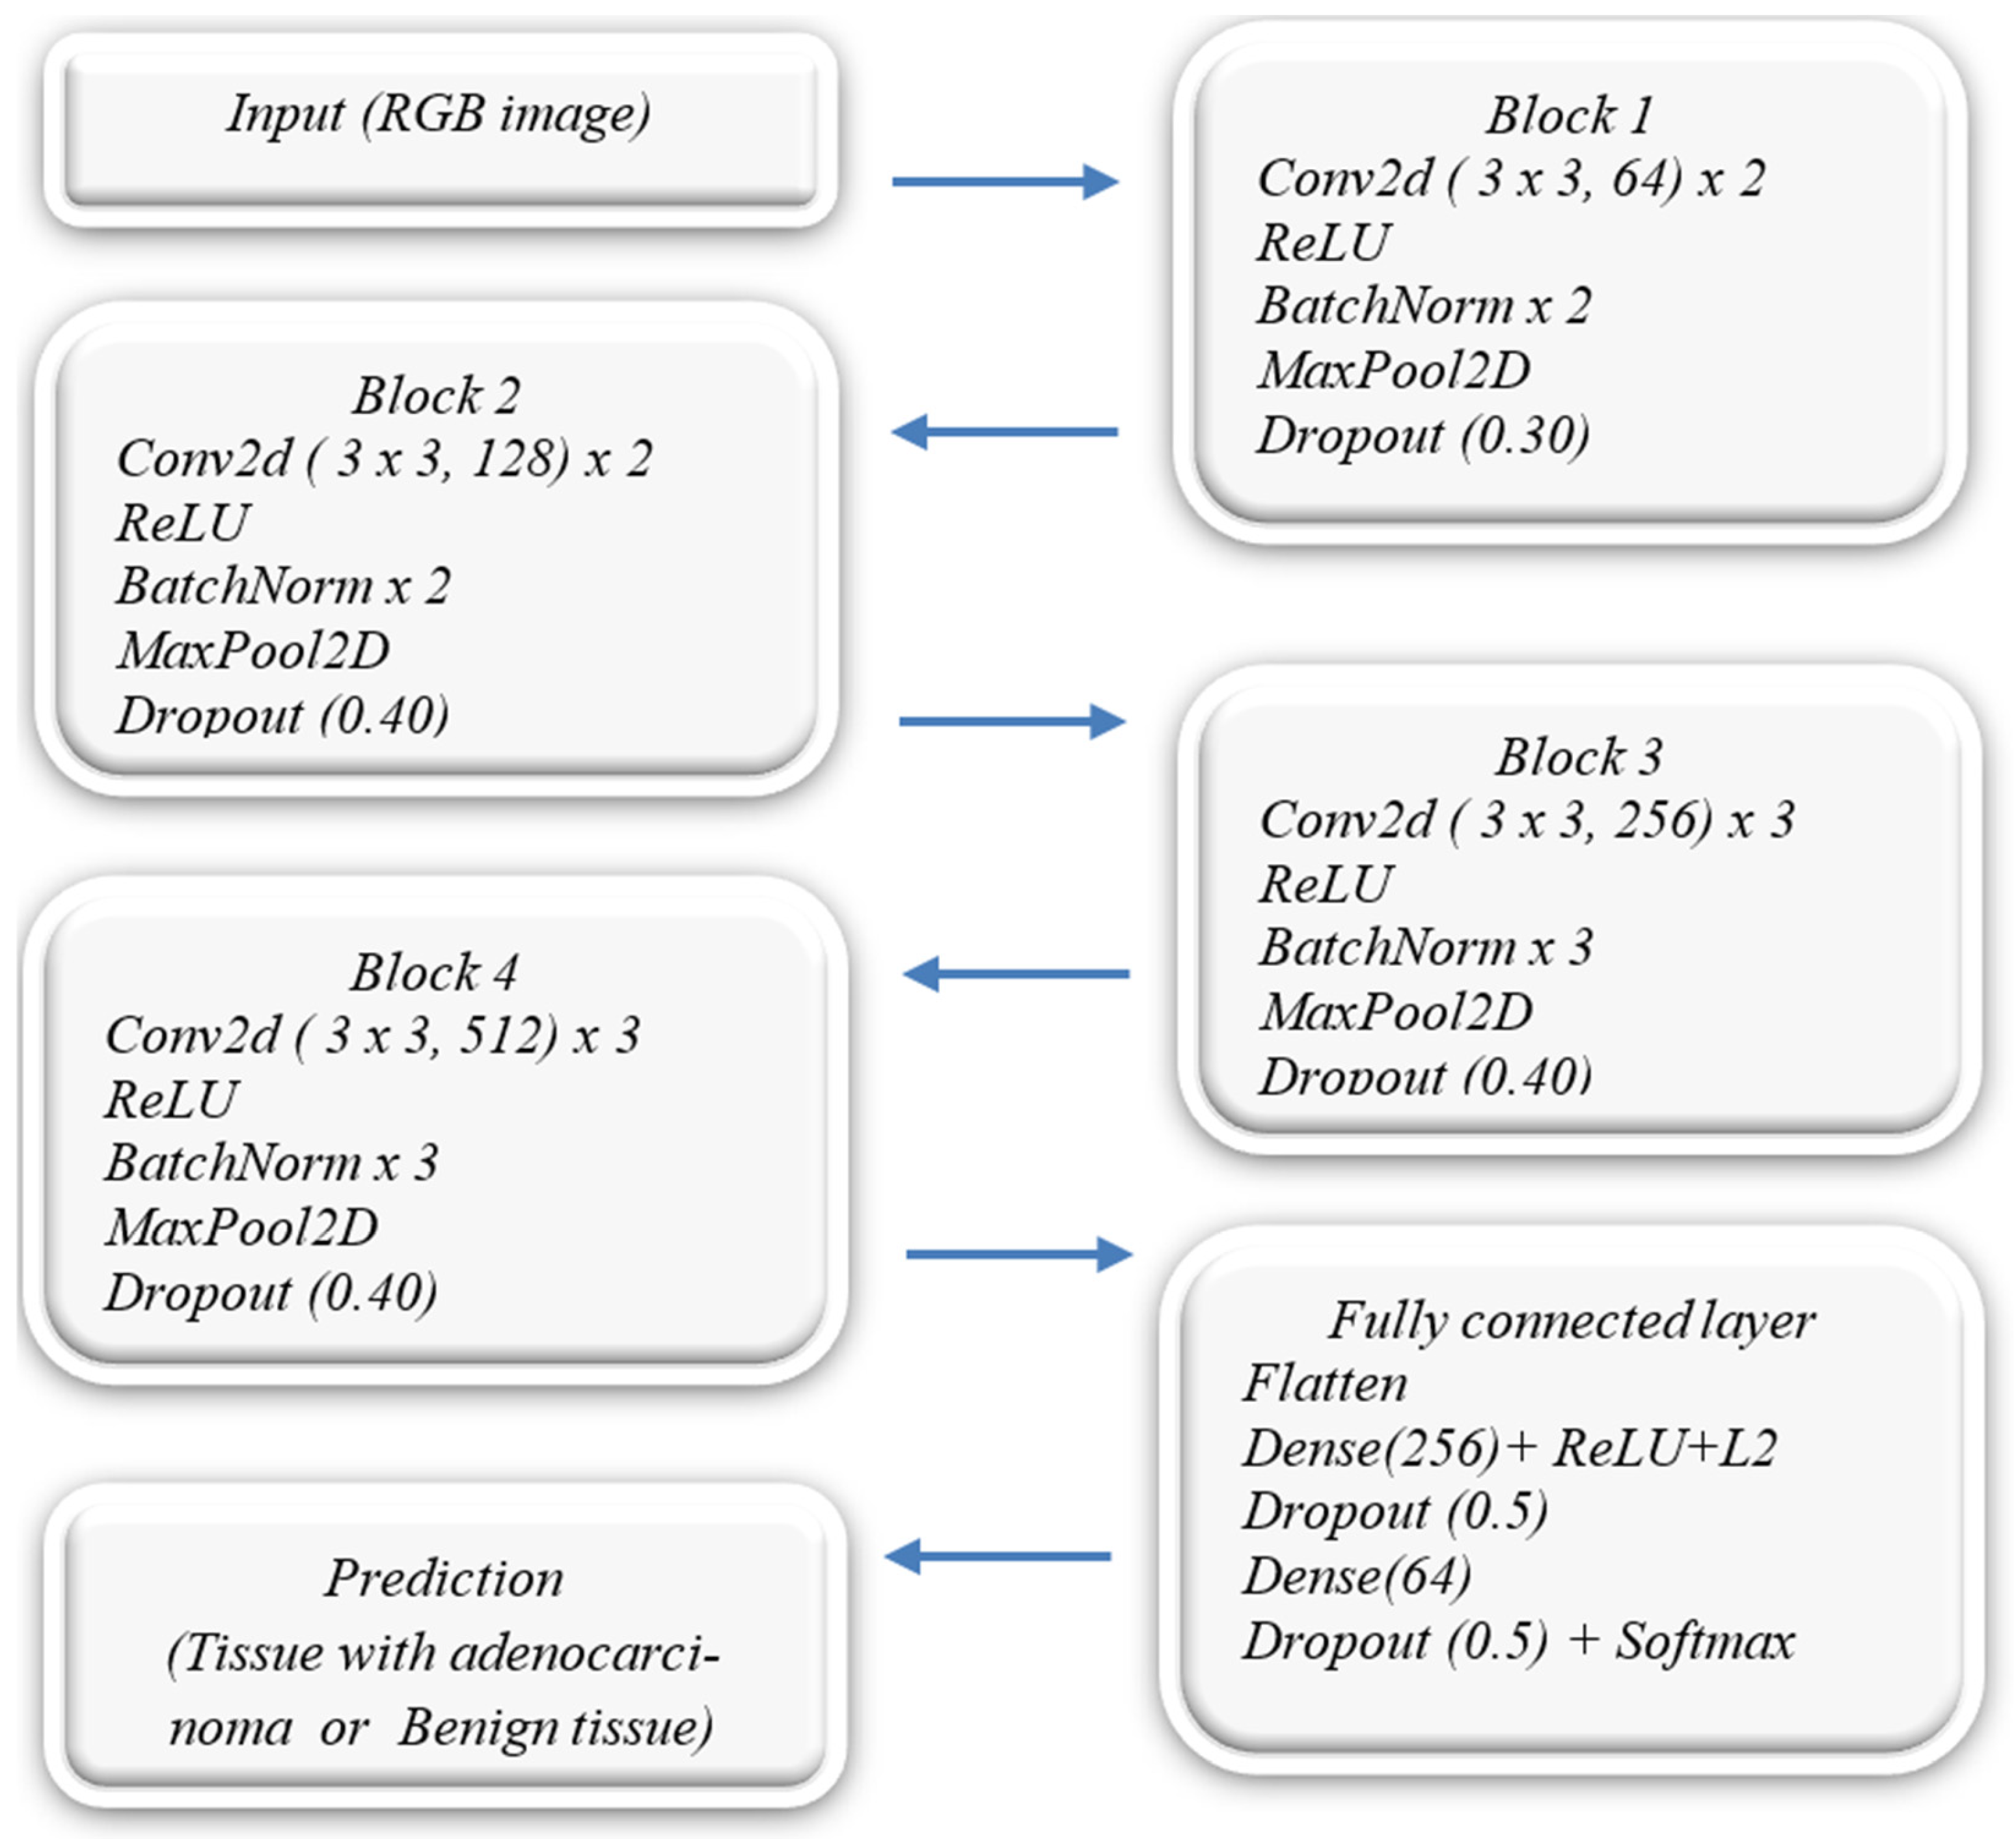
In this phase, two main aspects are considered: the neural network architecture and the model configuration. Regarding the neural network architecture, Figure 3 illustrates the proposed model, which consists of three sequential stages: (i) input, (ii) convolution and pooling, (iii) fully connected and output.
Figure 3.
CNN model from scratch.
- The input layer receives JPG images for processing and classification in the subsequent layers.
- The convolution and pooling stage is composed of four sequential blocks, each including the following operations: (i) Conv2D (for feature extraction), (ii) Batch Normalization (to normalize activations and stabilize training), (iii) MaxPooling2D (to reduce spatial dimensions and retain the most relevant features), and (iv) Dropout (to reduce overfitting and improve generalization). The number of filters in the convolutional blocks is progressively increased (64, 128, 256, and 512), using ReLU activation functions. Dropout layers with rates of 0.3, 0.4, and 0.5 are applied to reduce overfitting during training.
- The fully connected layer begins with a Flatten layer, which converts the 3D feature maps into a one-dimensional vector. This vector is then processed by two dense layers with 256 and 64 neurons, respectively, using ReLU activation and L2 regularization to further reduce overfitting. The output layer consists of a dense layer with a Softmax activation function, which produces probability distributions over two classes: adenocarcinoma and benign colon tissue.
Regarding the model settings, data augmentation techniques and data generators with specific hyperparameters were used to configure the model. The key hyperparameters of this model are as follows.
- Image size. Input images are resized to 224 × 224 pixels, with three channels (RGB).
- Batch size. Set to 96, which defines how many images are processed in each training step.
- Epochs. The model was trained for 10 epochs.
- Optimizer. The Adam optimizer is used.
- Loss function. Categorical_crossentropy is used, suitable for multiclass classification tasks.
- Evaluation metric. Accuracy is used as the model’s performance metric.
- Shuffle. The shuffle option is set to False, meaning that the training data will not be shuffled before each epoch. In this case, since the model is designed to perform binary classification to determine whether a patient has cancer or not, maintaining the order of the data is important.
Data augmentation was applied to generate variations in the images, improving model generalization. The data is loaded using image generators, which allow for efficient processing and feeding of the images into the model. The generators use data augmentations in the training set to improve the model’s generalization capability. These augmentations include rotations, displacements, scaling, and flipping of the images. On the other hand, the validation and test sets are only normalized to ensure an accurate evaluation of the model.
The parameter settings for the ImageDataGenerator function are detailed below.
- Rescale. Pixel values are normalized to the range [0, 1] to ensure faster convergence during training.
- rotation_range. Random rotations of up to 20 degrees are applied to improve the model’s robustness to variations in image orientation.
- width_shift_range and height_shift_range. Horizontal and vertical shifts of up to 20% are applied, enhancing the model’s ability to recognize patterns in different spatial positions.
- shear_range and zoom_range. These parameters apply shearing and zoom transformations, respectively, increasing the diversity of the dataset.
- horizontal_flip. Images are randomly flipped horizontally, helping the model learn directional invariance.
- fill_mode. Specifies how newly created pixels are filled after transformations.
In this context, the training, validation, and testing sets were configured. For each set, a data generator was defined to resize images to 224 × 224 pixels with a batch size of 96. This means that each training step processes 96 images before updating the model weights through backpropagation. Additionally, categorical mode was used for label encoding, and the shuffle parameter was set to false to preserve the original order of the images. During the training phase, the model was compiled using the Adam optimizer. The loss function was defined as categorical cross-entropy, and accuracy was selected as the evaluation metric to measure the proportion of correct predictions. The model was trained for 10 epochs, a value adjusted based on validation performance. The configuration of the data generators is as follows.
- ImageDataGenerator (rescale = 1.0/255, rotation_range = 20, width_shift_range = 0.2, height_shift_range = 0.2, shear_range = 0.2, zoom_range = 0.2, horizontal_flip = True, fill_mode = ‘nearest’)
4. Results and Discussion
4.1. Model Evaluation
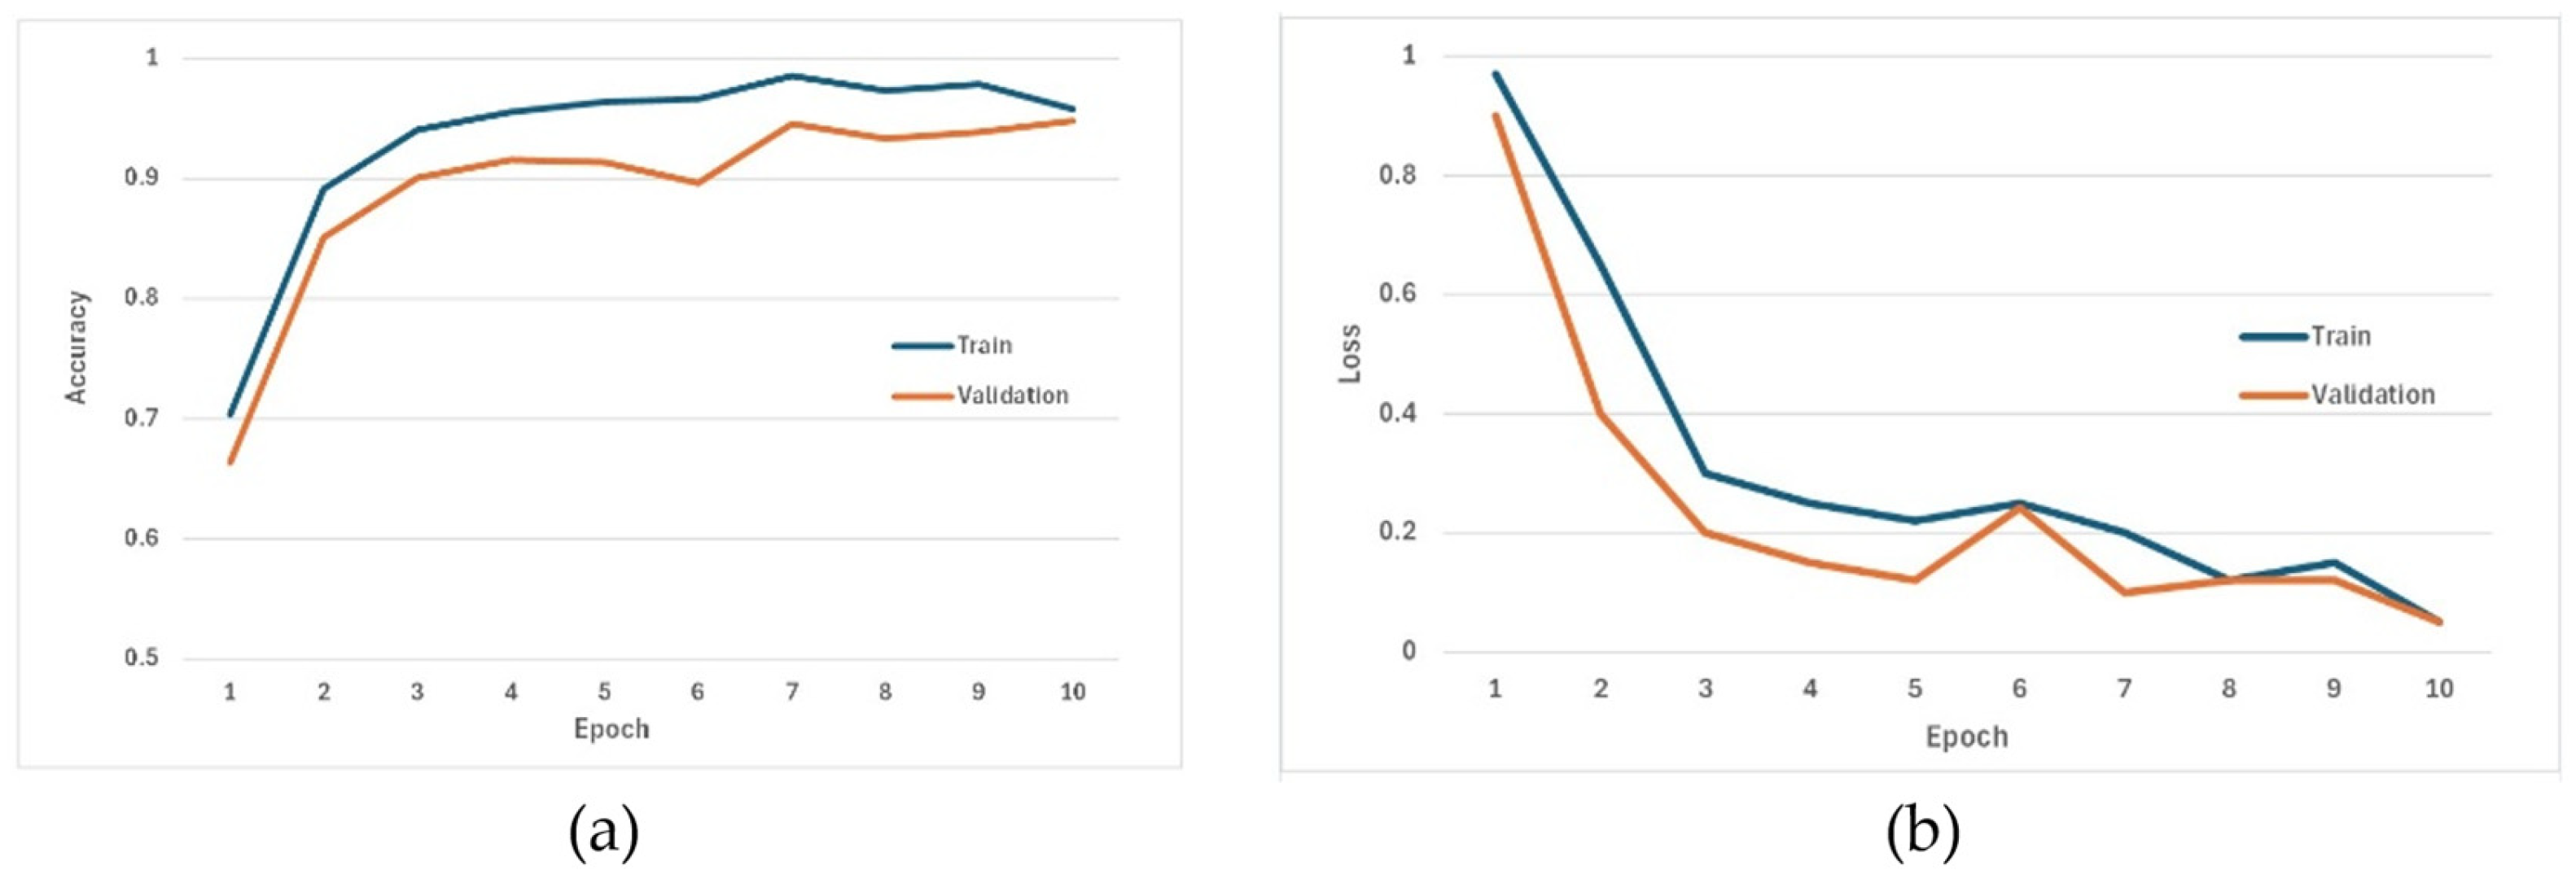
The model evaluation was performed based on three criteria: accuracy, loss, and the confusion matrix. Figure 4a,b illustrates the behavior of accuracy and loss during the training and validation phases.
Figure 4.
(a) Accuracy and (b) Model loss during training and validation stages.
- Regarding model accuracy. Between epochs 1 and 3, a significant increase in accuracy is observed, from 0.70 to 0.94 during training and from 0.66 to 0.90 during validation. This indicates that the network is rapidly capturing the discriminative features of both datasets. From epoch 4 onward, both curves begin to stabilize, fluctuating between 0.96 and 0.99 during training and between 0.91 and 0.95 during validation. This indicates stable convergence. There is no evidence of overfitting because the accuracy during training does not reach 1, and during validation it only shows small fluctuations between 0.94 and 0.90 from epoch 5 onward, before stabilizing at 0.94 in epoch 8. This suggests that Early Stopping can be applied from epoch 8 onward to reduce training time without sacrificing performance.
- Regarding model loss. In the first three epochs, a pronounced reduction in both sets of values is observed, from 0.97 to 0.93 during training and from 0.90 to 0.20 during validation. From epoch 4 onward, the loss continues to decrease slowly until reaching approximately 0.05; this indicates progressive convergence of the model. The training and validation curves maintain very similar trajectories; the small separation between them suggests that the generalization error is low. Furthermore, there is no evidence of overfitting because both losses decrease together, and the validation loss remains slightly lower than the training loss over several epochs.
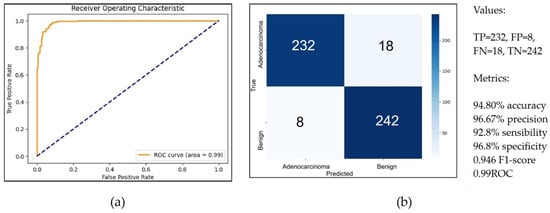
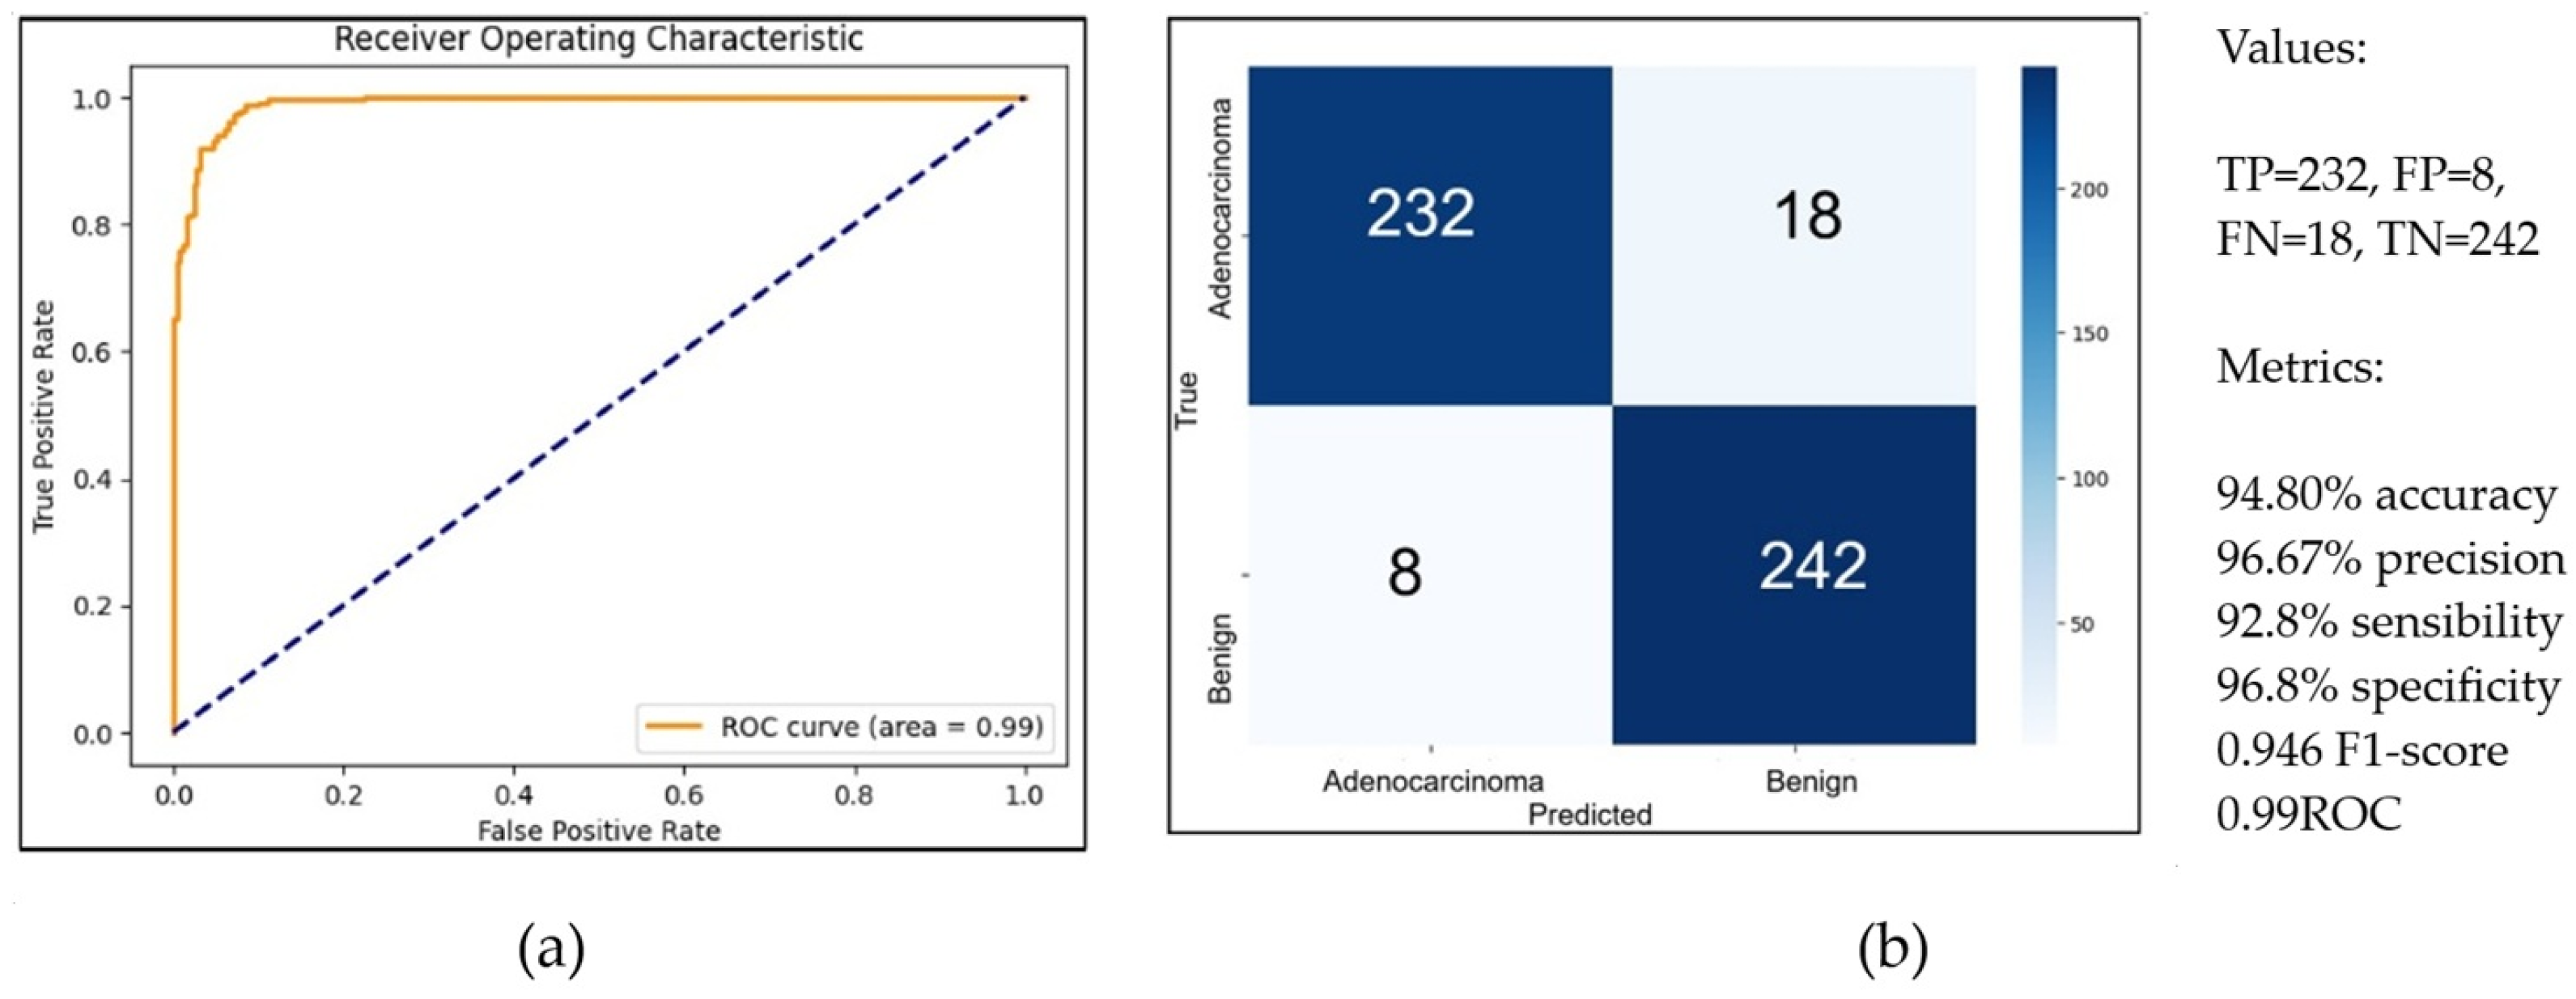
- Regarding the confusion matrix. Performance metrics were derived from its results. In this context, 500 images were used for validation, yielding the following values: TP = 232, FP = 8, FN = 18, and TN = 242. Consequently, the model achieved an accuracy of 94.80%, precision of 96.67%, sensitivity of 92.8%, specificity of 96.8%, an F1-score of 0.946, and an AUC-ROC of 0.99. Figure 5a,b summarizes these results.
Figure 5.
(a) AUC-ROC and (b) Confusion Matrix.
4.2. Application Development
The web application was developed following the phases of the waterfall model, namely: analysis, design, implementation, and testing.
Regarding the analysis phase, three functional requirements were identified: (i) image upload, where the allowed format for image processing is JPG; (ii) image processing, where normalization and augmentation techniques are applied to the dataset; and (iii) result generation, where the application predicts the probability that an image belongs to a specific class.
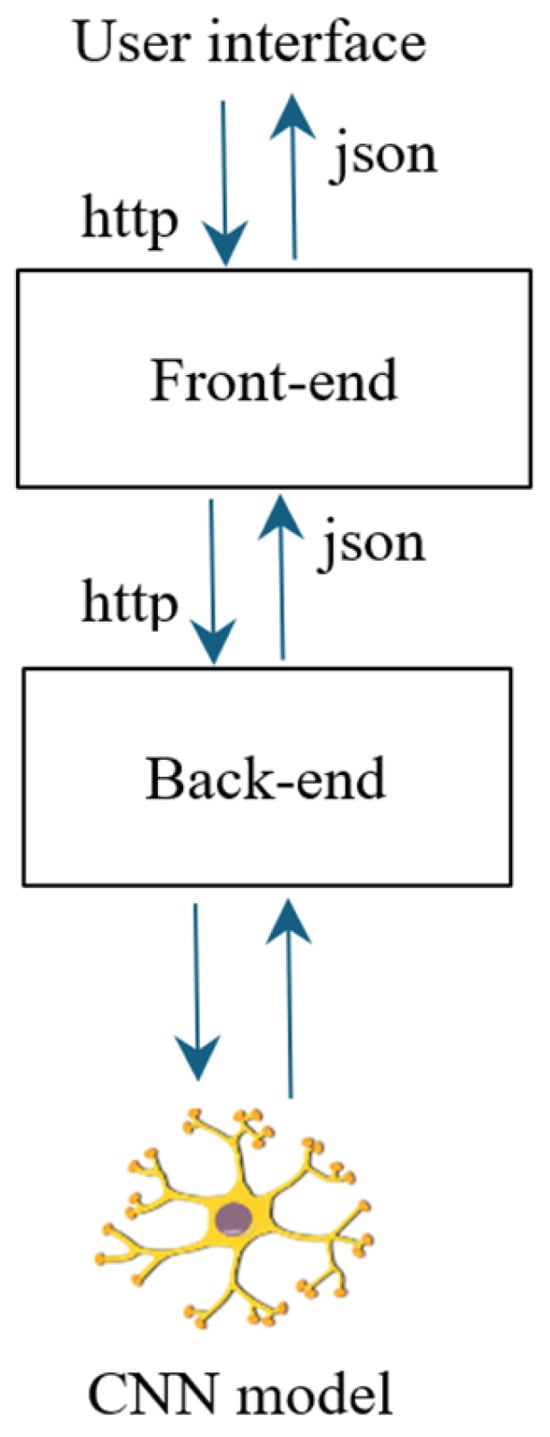
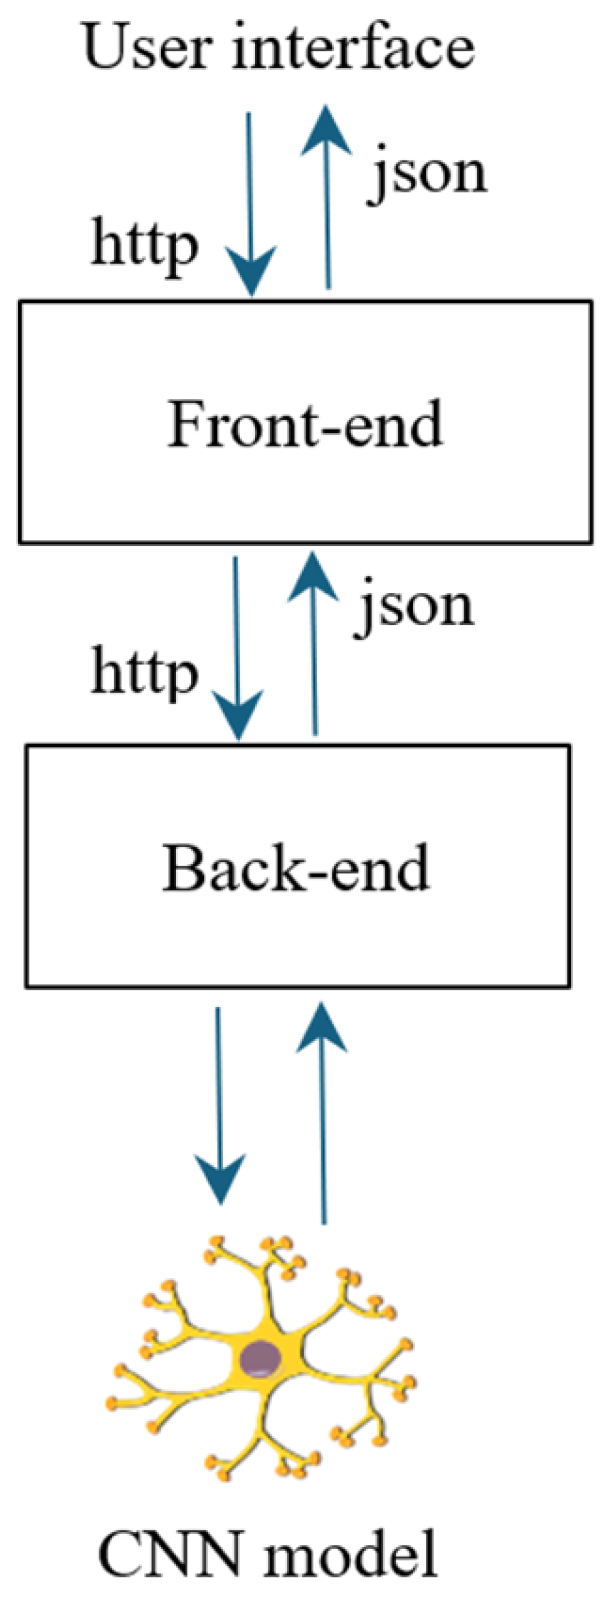
Regarding the design phase, an architecture composed of three components was defined: a web user interface, a server, and a machine learning model. Figure 6 shows the proposed architecture for this case study.
Figure 6.
Architecture design.
- User interface (frontend). This is the presentation layer of the system and manages the interaction between the user and the application. The user interacts with the system through a web form, uploads an image, and receives a prediction or diagnostic result. The uploaded image is sent to the backend server, which processes it and returns the diagnosis generated by the neural network.
- Server (backend). Through a REST API, the server acts as an intermediary between the frontend and the neural network model. It receives the user’s request containing the image and processes it before forwarding it to the neural network. The API manages the model’s output, formats the result, and returns it to the frontend for display to the user.
- Prediction model. The model is developed and pre-trained using TensorFlow. It receives the image sent by the REST API and predicts one of two classes: adenocarcinoma or benign tissue. The prediction is returned to the server and subsequently displayed through the web interface.
Regarding the development, three modules were implemented corresponding to each system layer:
- User interface. This interface was built using standard web technologies such as HTML, CSS, and JavaScript to ensure responsiveness and accessibility across devices. The process begins when the user sends an HTTP request and uploads an image via a web form. Using the JavaScript Fetch API, a POST request is sent to the Flask server’s prediction endpoint. The image is packaged as a FormData object, enabling binary data transmission. This asynchronous request keeps the interface responsive while the server processes the image and generates the diagnosis. The response is received in JSON format and interpreted by JavaScript. It contains the probability associated with each class: adenocarcinoma or benign tissue.
- Backend module. The backend server is the communication layer between the user interface and the machine learning model. It uses a POST method to receive images from the frontend. The server validates the uploaded file, and if it does not meet the required format, an error message is returned in JSON format. If the image is valid, it is forwarded to the prediction module. After obtaining the results, the server packages the output into a JSON object and sends it back to the user interface.
- Prediction module. A TensorFlow-based module was developed and integrated into the backend server. It receives histopathological images and returns classification results with associated probabilities. The trained deep learning model is loaded into memory using Keras, importing the previously trained architecture and weights. Additionally, a preprocessing function resizes the image to 224 × 224 pixels. The model then performs inference and returns the predicted class probabilities for adenocarcinoma and benign tissue.
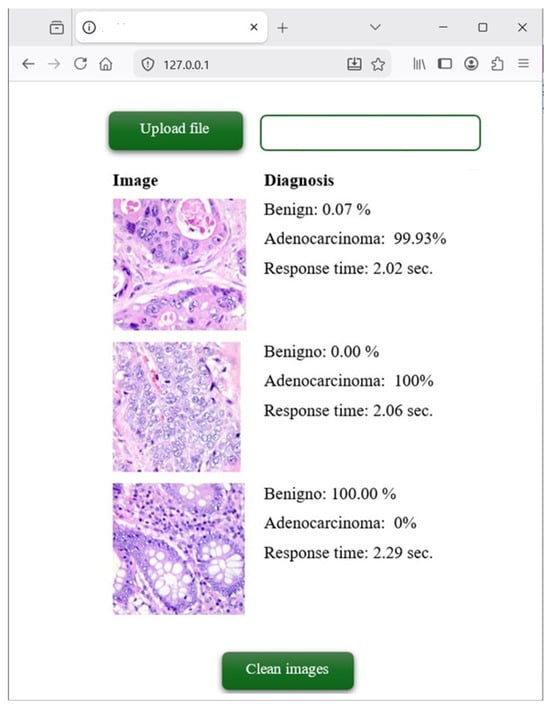
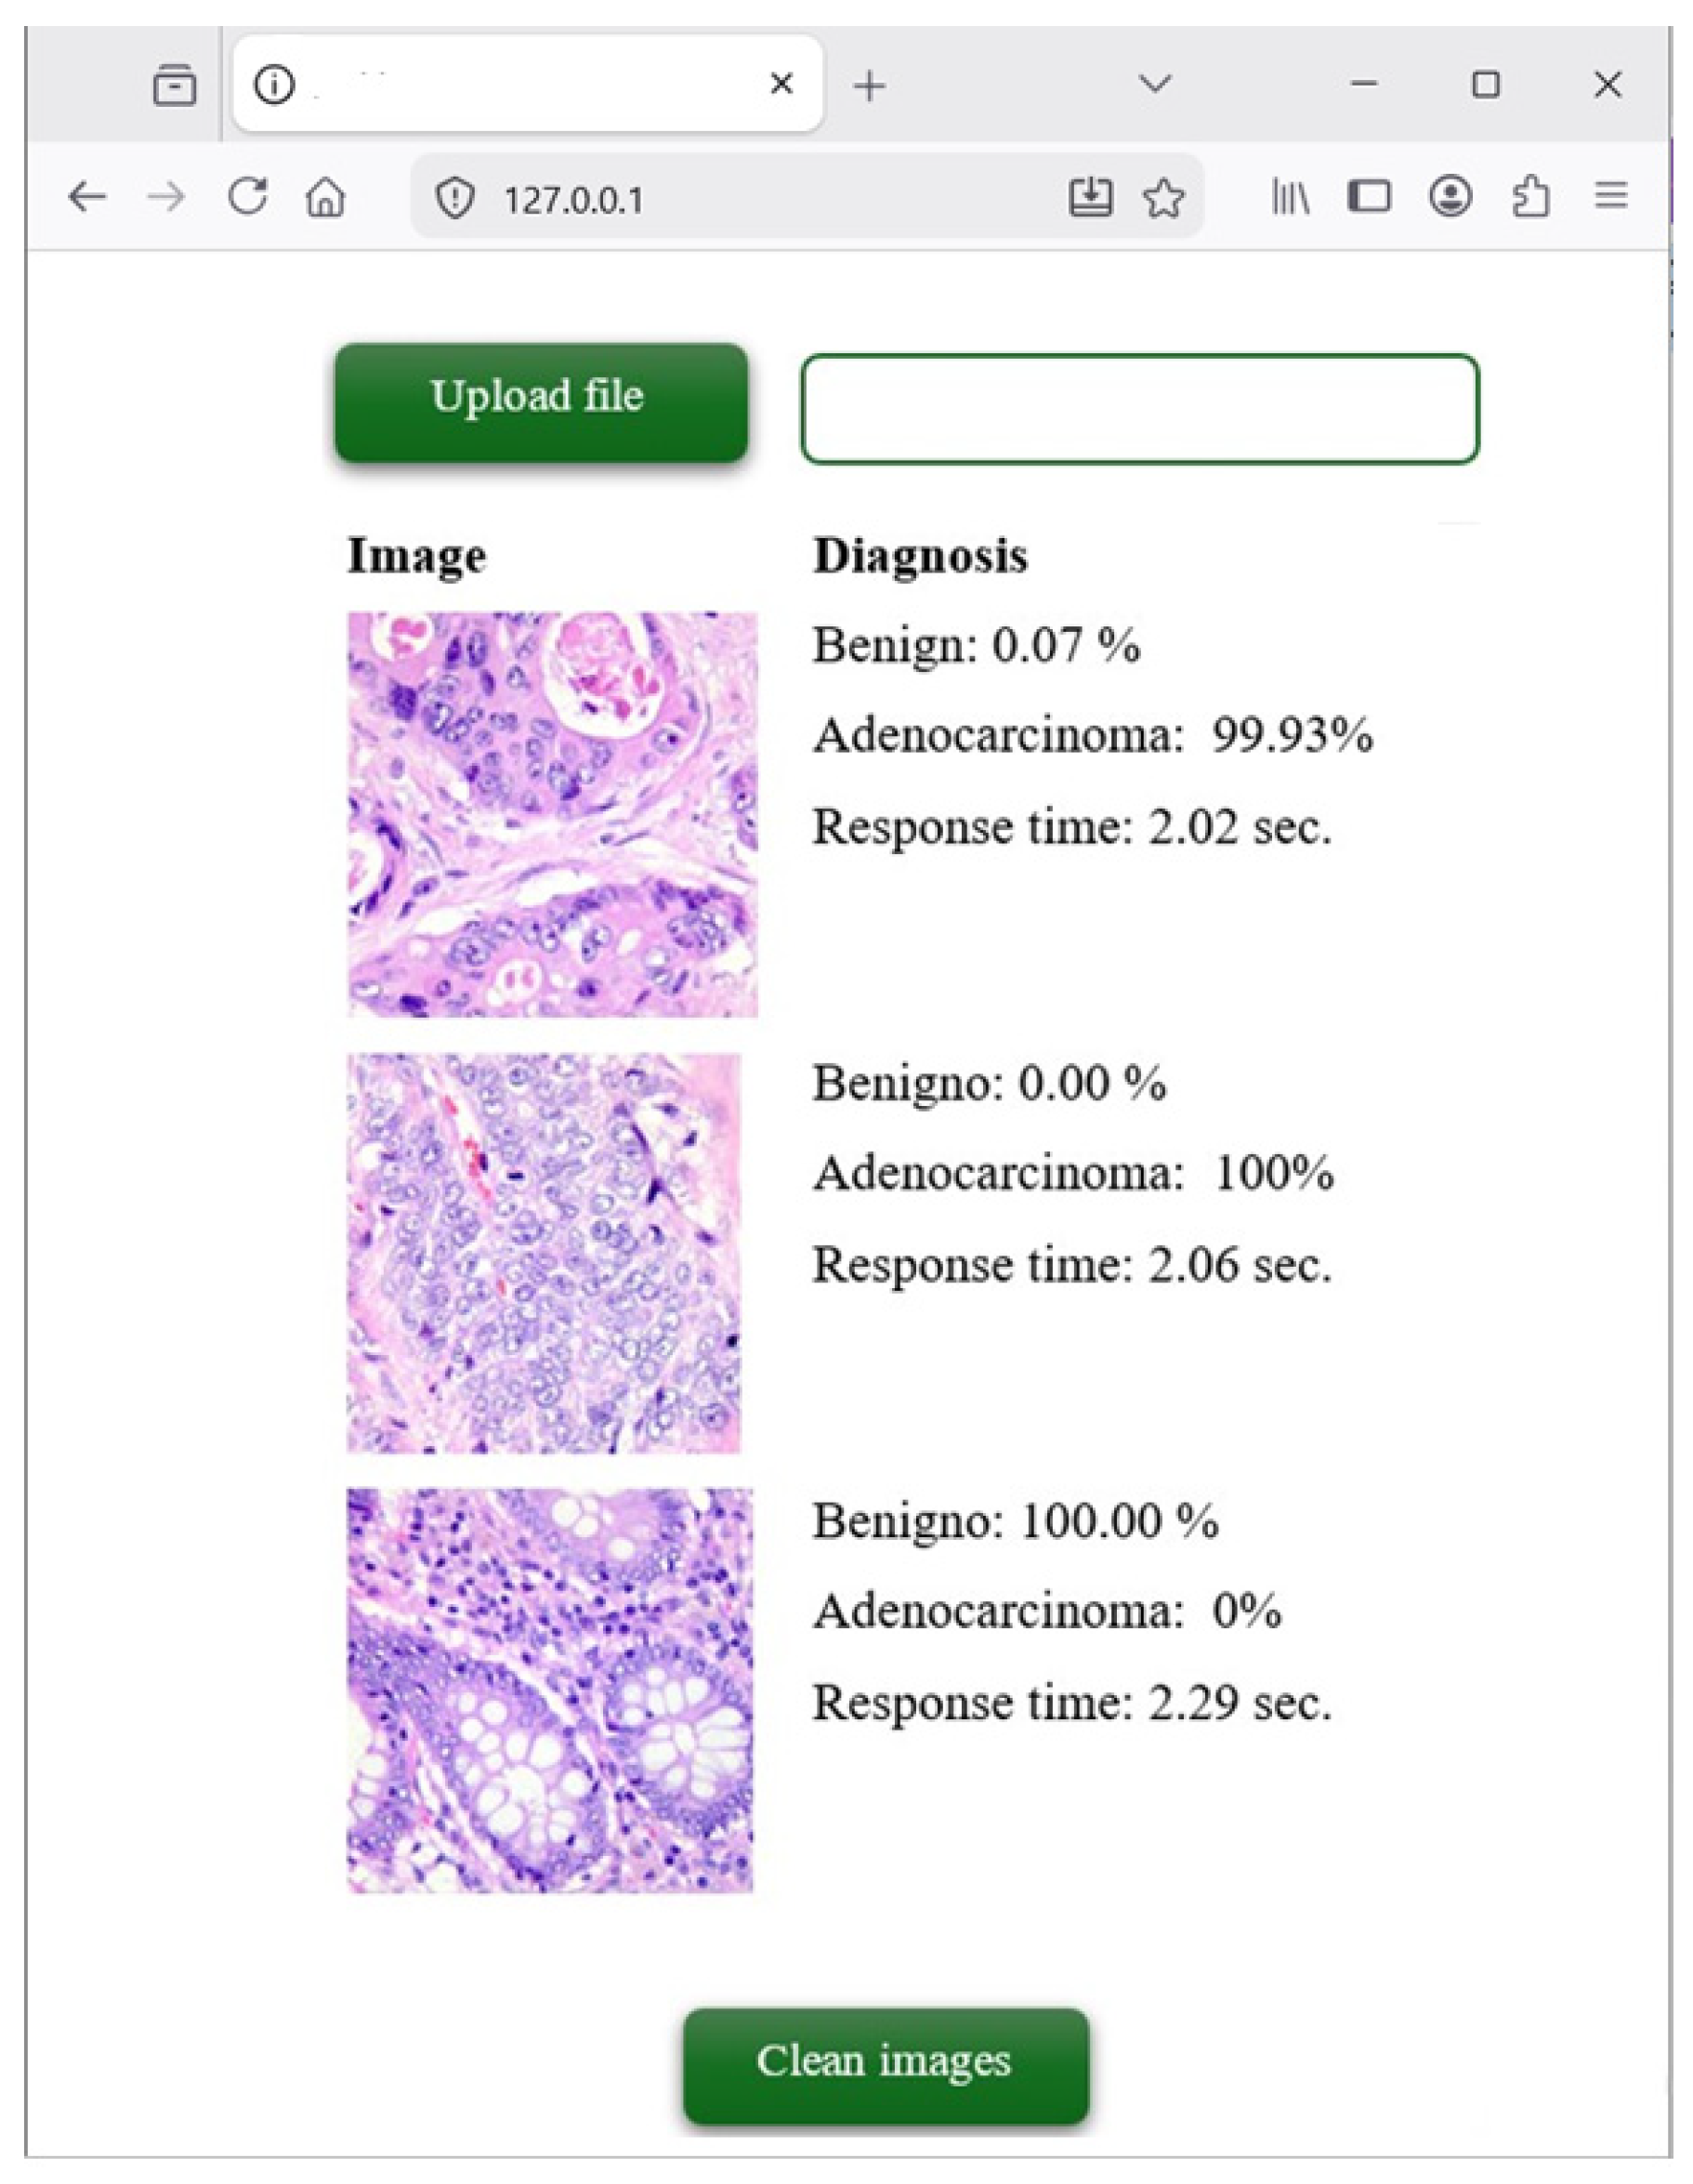
Regarding functional testing, a graphical interface with two buttons was implemented: one for uploading images and another for clearing the diagnostic history. The user uploads an image, and the system immediately displays the diagnosis along with its corresponding probability. Figure 7 shows the web interface used to test the neural network.
Figure 7.
Web application to detect colon adenocarcinoma.
4.3. Comparison with Previous Research
Previous studies have developed and applied machine learning models to support the detection of colon cancer.
Hamida et al. [22] used deep learning models such as ResNet and SegNet, achieving an accuracy of 99.5% on a dataset of 100,000 images. In a subsequent study, Hamida et al. [23] implemented U-Net and Attention U-Net models for colorectal cancer image classification. In this work, Attention U-Net demonstrated a better balance between accuracy and computational efficiency, reaching 95.88% accuracy. Similarly, Kumar et al. [24] applied DenseNet-121 and obtained an accuracy of 98.63% on a dataset of 25,000 images. Additionally, Ibrahim et al. [25] achieved 99% accuracy using a dataset containing both colon and lung cancer images. Notably, the inclusion of multiple cancer types may have influenced the overall model complexity and performance.
Three studies highlight relevant trends for the development of CNN-based classification models, namely: (i) the integration of local and global information through hybrid architectures such as Mamba-CNN [26], (ii) the use of spectral and spatial features in images [27], and (iii) the incorporation of semi-supervised learning strategies to train robust models using a larger set of unlabeled images and a reduced number of annotated images [28]. These advances provide improvements and a foundation for designing CNNs with enhanced diagnostic accuracy and generalizability in real-world clinical settings.
5. Conclusions
5.1. Contributions
This research developed a convolutional neural network-based tool to support colorectal adenocarcinoma detection. To achieve this, two main phases were addressed: data mining and software development.
Regarding the data mining phase, the CRISP-DM methodology was used, providing a structured and systematic approach through five stages: business understanding, data understanding, data preparation, modeling, and evaluation. As a result, a convolutional model was developed, achieving the following performance metrics: 94.8% accuracy, 96.67% precision, 92.8% sensitivity, 96.8% specificity, an F1-score of 0.946, and an AUC-ROC of 0.99.
The proposed convolutional model achieved more stable results and was implemented within a web application. The system was developed following the waterfall model, consisting of four phases: requirements analysis, architecture design, implementation, and functional testing. The resulting application provides an interactive interface that allows users to upload colon images and obtain predictions for two possible classes: adenocarcinoma and benign tissue.
5.2. Future Research
The development of the web application based on convolutional neural networks demonstrates its potential as a supportive tool for healthcare professionals. The proposed models can be applied to different datasets, contributing to the evaluation of their generalization capability. By incorporating additional functionalities, the system could be extended to detect other types of cancer through advanced mechanisms capable of identifying not only irregular patterns but also subtle morphological changes within histopathological images.
This direction opens new possibilities for clinical decision support, reducing diagnostic workload and allowing healthcare professionals to focus on other critical tasks.
Author Contributions
Conceptualization, J.C.M.-T.; Formal analysis, J.C.M.-T.; Investigation, J.C.M.-T., B.H.-F., H.E.R.-M. and L.A.T.-A.; Methodology, J.C.M.-T.; Project administration, J.C.M.-T.; Software, J.C.M.-T., H.E.R.-M. and L.A.T.-A.; Supervision, J.C.M.-T.; Validation, J.C.M.-T. and B.H.-F.; Writing—original draft Preparation, J.C.M.-T.; Writing—review & editing Preparation, J.C.M.-T. All authors have read and agreed to the published version of the manuscript.
Funding
This research received no external funding.
Data Availability Statement
The original contributions presented in this study are included in the article. Further inquiries can be directed to the corresponding author(s).
Conflicts of Interest
The authors declare no conflicts of interest.
References
- Bayas Huilcapi, G.V.; Bayas Huilcapi, M.B.; Jimbo Córdova, G.A.; García Silvera, F.A. Clinical and Epidemiological Characterization of Patients with Colon Cancer. CAMbios-HECAM 2022, 21, 886. [Google Scholar]
- Sood, R.; Badjatia, T.; Bhargava, P. Mucinous Rectal Adenocarcinoma Recurrence: A Case Report and Literature Review. Radiol. Case Rep. 2025, 20, 2189–2193. [Google Scholar] [CrossRef] [Scilit] [PubMed]
- Trecourt, A.; Treilleux, I.; Pissaloux, D.; Donzel, M.; Thamphya, B.; Thirode, F.; Houlier, A.; Paindavoine, S.; Franceschi, T.; Baltrès, A.; et al. Primary Vulvar and Vaginal Adenocarcinomas of Intestinal Type are Closer to Colorectal Adenocarcinomas than to Carcinomas of Müllerian Origin. Mod. Pathol. 2025, 38, 100649. [Google Scholar] [CrossRef] [Scilit] [PubMed]
- Abed, R.; Alhroub, W.; Asbeh, Y.A.; Rabee, A.; Bannoura, S.; Madia, A. A Rare Presentation of Primary Lung Adenocarcinoma Mimicking Bilateral Interstitial Infiltration: A Case Report and Literature Review. Int. J. Surg. Case Rep. 2025, 127, 110899. [Google Scholar] [CrossRef] [Scilit] [PubMed]
- Band, S.S.; Yarahmadi, A.; Hsu, C.C.; Biyari, M.; Sookhak, M.; Ameri, R.; Dehzangi, I.; Chronopoulos, A.T.; Liang, H.W. Application of Explainable Artificial Intelligence in Medical Health: A Systematic Review of Interpretability Methods. Inform. Med. Unlocked 2023, 40, 101286. [Google Scholar] [CrossRef] [Scilit]
- Bazi, I.; Bigi, S.; Chahbi, Z.; Adnor, S.; Ibenyahya, A.; Saalaoui, A.; Elagouri, H.; Wakrim, S. Krukenberg Tumor Secondary to Gallbladder Adenocarcinoma: A Case Report. Radiol. Case Rep. 2025, 20, 2048–2053. [Google Scholar] [CrossRef] [Scilit] [PubMed]
- Fahad, M.; Mobeen, N.E.; Imran, A.S.; Daudpota, S.M.; Kastrati, Z.; Cheikh, F.A.; Ullah, M. Deep Insights into Gastrointestinal Health: A Comprehensive Analysis of GastroVision Dataset Using Convolutional Neural Networks and Explainable AI. Biomed. Signal Process. Control 2025, 102, 107260. [Google Scholar] [CrossRef] [Scilit]
- Su, Z.; Rezapour, M.; Sajjad, U.; Gurcan, M.N.; Niazi, M.K.K. Attention2Minority: A Salient Instance Inference-Based Multiple Instance Learning for Classifying Small Lesions in Whole Slide Images. Comput. Biol. Med. 2023, 167, 107607. [Google Scholar] [CrossRef] [Scilit] [PubMed]
- Inkeaw, P.; Angkurawaranon, S.; Khumrin, P.; Inmutto, N.; Traisathit, P.; Chaijaruwanich, J.; Angkurawaranon, C.; Chitapanarux, I. Automatic Hemorrhage Segmentation on Head CT Scan for Traumatic Brain Injury Using 3D Deep Learning Model. Comput. Biol. Med. 2022, 146, 105530. [Google Scholar] [CrossRef] [Scilit] [PubMed]
- ud din, N.M.; Dar, R.A.; Rasool, M.; Assad, A. Breast Cancer Detection Using Deep Learning: Datasets, Methods, and Challenges Ahead. Comput. Biol. Med. 2022, 149, 106073. [Google Scholar] [CrossRef] [Scilit] [PubMed]
- Su, Q.; Wang, F.; Chen, D.; Chen, G.; Li, C.; Wei, L. Deep Convolutional Neural Networks with Ensemble Learning and Transfer Learning for Automated Detection of Gastrointestinal Diseases. Comput. Biol. Med. 2022, 150, 106054. [Google Scholar] [CrossRef] [Scilit] [PubMed]
- Gayathri, J.L.; Abraham, B.; Sujarani, M.S.; Nair, M.S. A Computer-Aided Diagnosis System for the Classification of COVID-19 and Non-COVID-19 Pneumonia on Chest X-Ray Images by Integrating CNN with Sparse Autoencoder and Feed Forward Neural Network. Comput. Biol. Med. 2022, 141, 105134. [Google Scholar] [CrossRef] [Scilit] [PubMed]
- Zou, S.; Li, C.; Sun, H.; Xu, P.; Zhang, J.; Ma, P.; Yao, Y.; Huang, X.; Grzegorzek, M. TOD-CNN: An Effective Convolutional Neural Network for Tiny Object Detection in Sperm Videos. Comput. Biol. Med. 2022, 146, 105543. [Google Scholar] [CrossRef] [Scilit] [PubMed]
- Liu, X.; Wu, Y.; Chen, Y.; Hui, D.; Zhang, J.; Hao, F.; Lu, Y.; Cheng, H.; Zeng, Y.; Han, W.; et al. Diagnosis of Diabetic Kidney Disease in Whole Slide Images via AI-Driven Quantification of Pathological Indicators. Comput. Biol. Med. 2023, 166, 107470. [Google Scholar] [CrossRef] [Scilit] [PubMed]
- Chen, C.; Mat Isa, N.A.; Liu, X. A Review of Convolutional Neural Network Based Methods for Medical Image Classification. Comput. Biol. Med. 2025, 185, 109507. [Google Scholar] [CrossRef] [Scilit] [PubMed]
- Richiardone, E.; Giolito, M.V.; Al Roumi, R.; Ambroise, J.; Drotleff, B.; Ghesquière, B.; Lupo, B.; Trusolino, L.; Arena, S.; Feron, O.; et al. Acidosis Overrides Molecular Heterogeneity to Shape Therapeutically Targetable Metabolic Phenotypes in Colon Cancers. Cancer Lett. 2025, 613, 217512. [Google Scholar] [CrossRef] [Scilit] [PubMed]
- Hussein, A.A.A.; Okasha, H.; Elzallat, M.; Ghoname, S.I.; Habib, M.R.; Hammam, O.A.; El-dabaa, E.; Salem, M.B. Identification and Exploration of Anticancer Activity of Novel Peptides Isolated from the Edible Bivalve Callista Chione in Hepatic and Colon Cancer Cell Lines. Toxicol. Rep. 2025, 14, 101915. [Google Scholar] [CrossRef] [Scilit] [PubMed]
- Zhou, Q.; Li, D.; Wang, T.; Hu, X. Gut Microbiota Derived DCA Enhances FOLFOX Efficacy via Ugt1a6b Mediated Enterohepatic Circulation in Colon Cancer. J. Hazard. Mater. 2020, 213, 124046. [Google Scholar] [CrossRef] [Scilit] [PubMed]
- Jamsrandorj, A.; Jung, D.; Kumar, K.S.; Arshad, M.Z.; Lim, H.; Kim, J.; Mun, K.R. View-Independent Gait Events Detection Using CNN-Transformer Hybrid Network. J. Biomed. Inform. 2023, 147, 104524. [Google Scholar] [CrossRef] [Scilit] [PubMed]
- Theissler, A.; Thomas, M.; Burch, M.; Gerschner, F. ConfusionVis: Comparative Evaluation and Selection of Multi-Class Classifiers Based on Confusion Matrices. Knowl.-Based Syst. 2022, 247, 108651. [Google Scholar] [CrossRef] [Scilit]
- Borkowski, A.A.; Bui, M.M.; Thomas, L.B.; Wilson, C.P.; Lauren, A.; DeLand, S.M.M. Lung and Colon Histopathological Image Dataset|Kaggle. Available online: https://www.kaggle.com/code/vishnupriya22/lung-and-colon-cancer-classification (accessed on 2 February 2025).
- Ben Hamida, A.; Devanne, M.; Weber, J.; Truntzer, C.; Derangère, V.; Ghiringhelli, F.; Forestier, G.; Wemmert, C. Deep Learning for Colon Cancer Histopathological Images Analysis. Comput. Biol. Med. 2021, 136, 104730. [Google Scholar] [CrossRef] [Scilit] [PubMed]
- Ben Hamida, A.; Devanne, M.; Weber, J.; Truntzer, C.; Derangère, V.; Ghiringhelli, F.; Forestier, G.; Wemmert, C. Weakly Supervised Learning Using Attention Gates for Colon Cancer Histopathological Image Segmentation. Artif. Intell. Med. 2022, 133, 102407. [Google Scholar] [CrossRef] [Scilit] [PubMed]
- Kumar, N.; Sharma, M.; Singh, V.P.; Madan, C.; Mehandia, S. An Empirical Study of Handcrafted and Dense Feature Extraction Techniques for Lung and Colon Cancer Classification from Histopathological Images. Biomed. Signal Process. Control 2022, 75, 103596. [Google Scholar] [CrossRef] [Scilit]
- Ibrahim, A.W. Lung and Colon Cancer Detection|Acc: 99%. Available online: https://www.kaggle.com/code/abdallahwagih/lung-and-colon-cancer-detection-acc-99 (accessed on 5 February 2025).
- Zhu, X.; Bai, L.; Zhang, C.; Liu, H.; Zhang, J. USMamba: A Hybrid Mamba-CNN Network for Breast Tumor Segmentation in Ultrasound Images with Frequency-Graph Perception Fusion. Biomed. Signal Process. Control 2026, 123, 110519. [Google Scholar] [CrossRef] [Scilit]
- Qin, G.; Liu, H.; Li, W.; Zhang, X.; Guo, Y.; Xia, X.-G. UFPF: A Universal Feature Perception Framework for Microscopic Hyperspectral Images. IEEE Trans. Image Process. 2025, 34, 5513–5526. [Google Scholar] [CrossRef] [Scilit] [PubMed]
- Qin, G.; Liu, H.; Zhang, X.; Li, W.; Guo, Y.; Guo, C. Semi-Supervised Medical Hyperspectral Image Segmentation Using Adversarial Consistency Constraint Learning and Cross Indication Network. IEEE Trans. Image Process. 2025, 34, 5414–5428. [Google Scholar] [CrossRef] [Scilit] [PubMed]
Disclaimer/Publisher’s Note: The statements, opinions and data contained in all publications are solely those of the individual author(s) and contributor(s) and not of MDPI and/or the editor(s). MDPI and/or the editor(s) disclaim responsibility for any injury to people or property resulting from any ideas, methods, instructions or products referred to in the content. |
© 2026 by the authors. Licensee MDPI, Basel, Switzerland. This article is an open access article distributed under the terms and conditions of the Creative Commons Attribution (CC BY) license.