


Abstract
This study assesses urban expansion and landscape structural changes in the northern and northwestern areas of Ho Chi Minh City, including District 12, Hoc Mon District, and Cu Chi District during the 2015–2024 period. The methodology integrates Sentinel 2 imagery, Geographic Information Systems (GIS), and eight landscape metrics: Number of Patches, Patch Density, Largest Patch Index, Contagion Index, Interspersion and Juxtaposition Index, Mean Shape Index, Shannon’s Diversity Index, and Simpson’s Diversity Index. These metrics characterize landscape composition and configuration regarding patch quantity, size, fragmentation, diversity, and spatial connectivity. Utilizing these metrics, a Comprehensive Landscape Index was developed via Principal Component Analysis to evaluate overall structural changes driven by urbanization. The results reveal a substantial increase in built-up land alongside a marked decline in agricultural land. Furthermore, the landscape metrics indicate increasing fragmentation and decreasing spatial connectivity in rapidly urbanizing zones. The findings demonstrate that integrating remote sensing, GIS, and landscape analysis is highly effective for monitoring urban expansion and providing crucial data to support sustainable urban planning.
1. Introduction
As urban populations grow and globalization continues, urbanization is one of the major catalysts for dramatic spatial and landscape transformations across the globe [1,2]. Urbanization accelerates changes in land use/land cover (LULC) across not only newly developed areas, but also peri-urban and suburban areas. Changing LULC results in fragmented and ecologically unconnected landscapes, as well as increased environmental stressors like urban heat islands, biodiversity loss, and ecological degradation [3,4,5,6].
The fragmentation of the designs and structures of urban LULC systems has been the focus of modern landscape ecology and urbanization systems research [7]. The complexity of landscape patch designs and the density of LULC within urban regions can be described via metrics based on fragmentation, pattern connectivity, and interaction in quality and quantity. The design of urban areas can be based on these metrics [8]. The rapid changes in urban LULC systems over time have been effectively monitored using advancements in remote sensing and GISs [9].
Ho Chi Minh City (HCM City) is one of the fastest urbanizing cities in Vietnam. It has been developing under a concentrated multicentric urban model [10]. As the urban core becomes more crowded, urban growth has gradually moved toward the northern and northwestern suburban districts. This includes District 12, Hoc Mon District, and Cu Chi District. The rapid development of transportation, industrial zones, and residential areas has sped up the change of agricultural land into built-up land. This shift has significantly changed the spatial structure and landscape features of the area studied.
However, studies on urbanization in Vietnam, especially in HCM City, have mostly focused on land use change and urban growth using area statistics. There are few approaches that emphasize landscape ecology and analyze spatial structure through landscape metrics. In the context of multicentric urban development in HCM City, there is a lack of integrated studies that combine land use and land cover dynamics with landscape metrics and overall landscape indices. These studies are needed to evaluate urban spatial changes in suburban areas.
Therefore, this study aimed to analyze land use and land cover changes and measure landscape structure from 2015 to 2024. We used Sentinel 2 imagery, GIS, and landscape metrics. Additionally, this study developed a Comprehensive Landscape Index to assess the overall changes in spatial structure due to urbanization.
2. Study Area
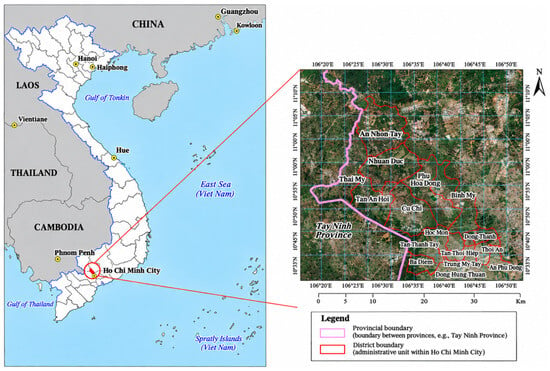
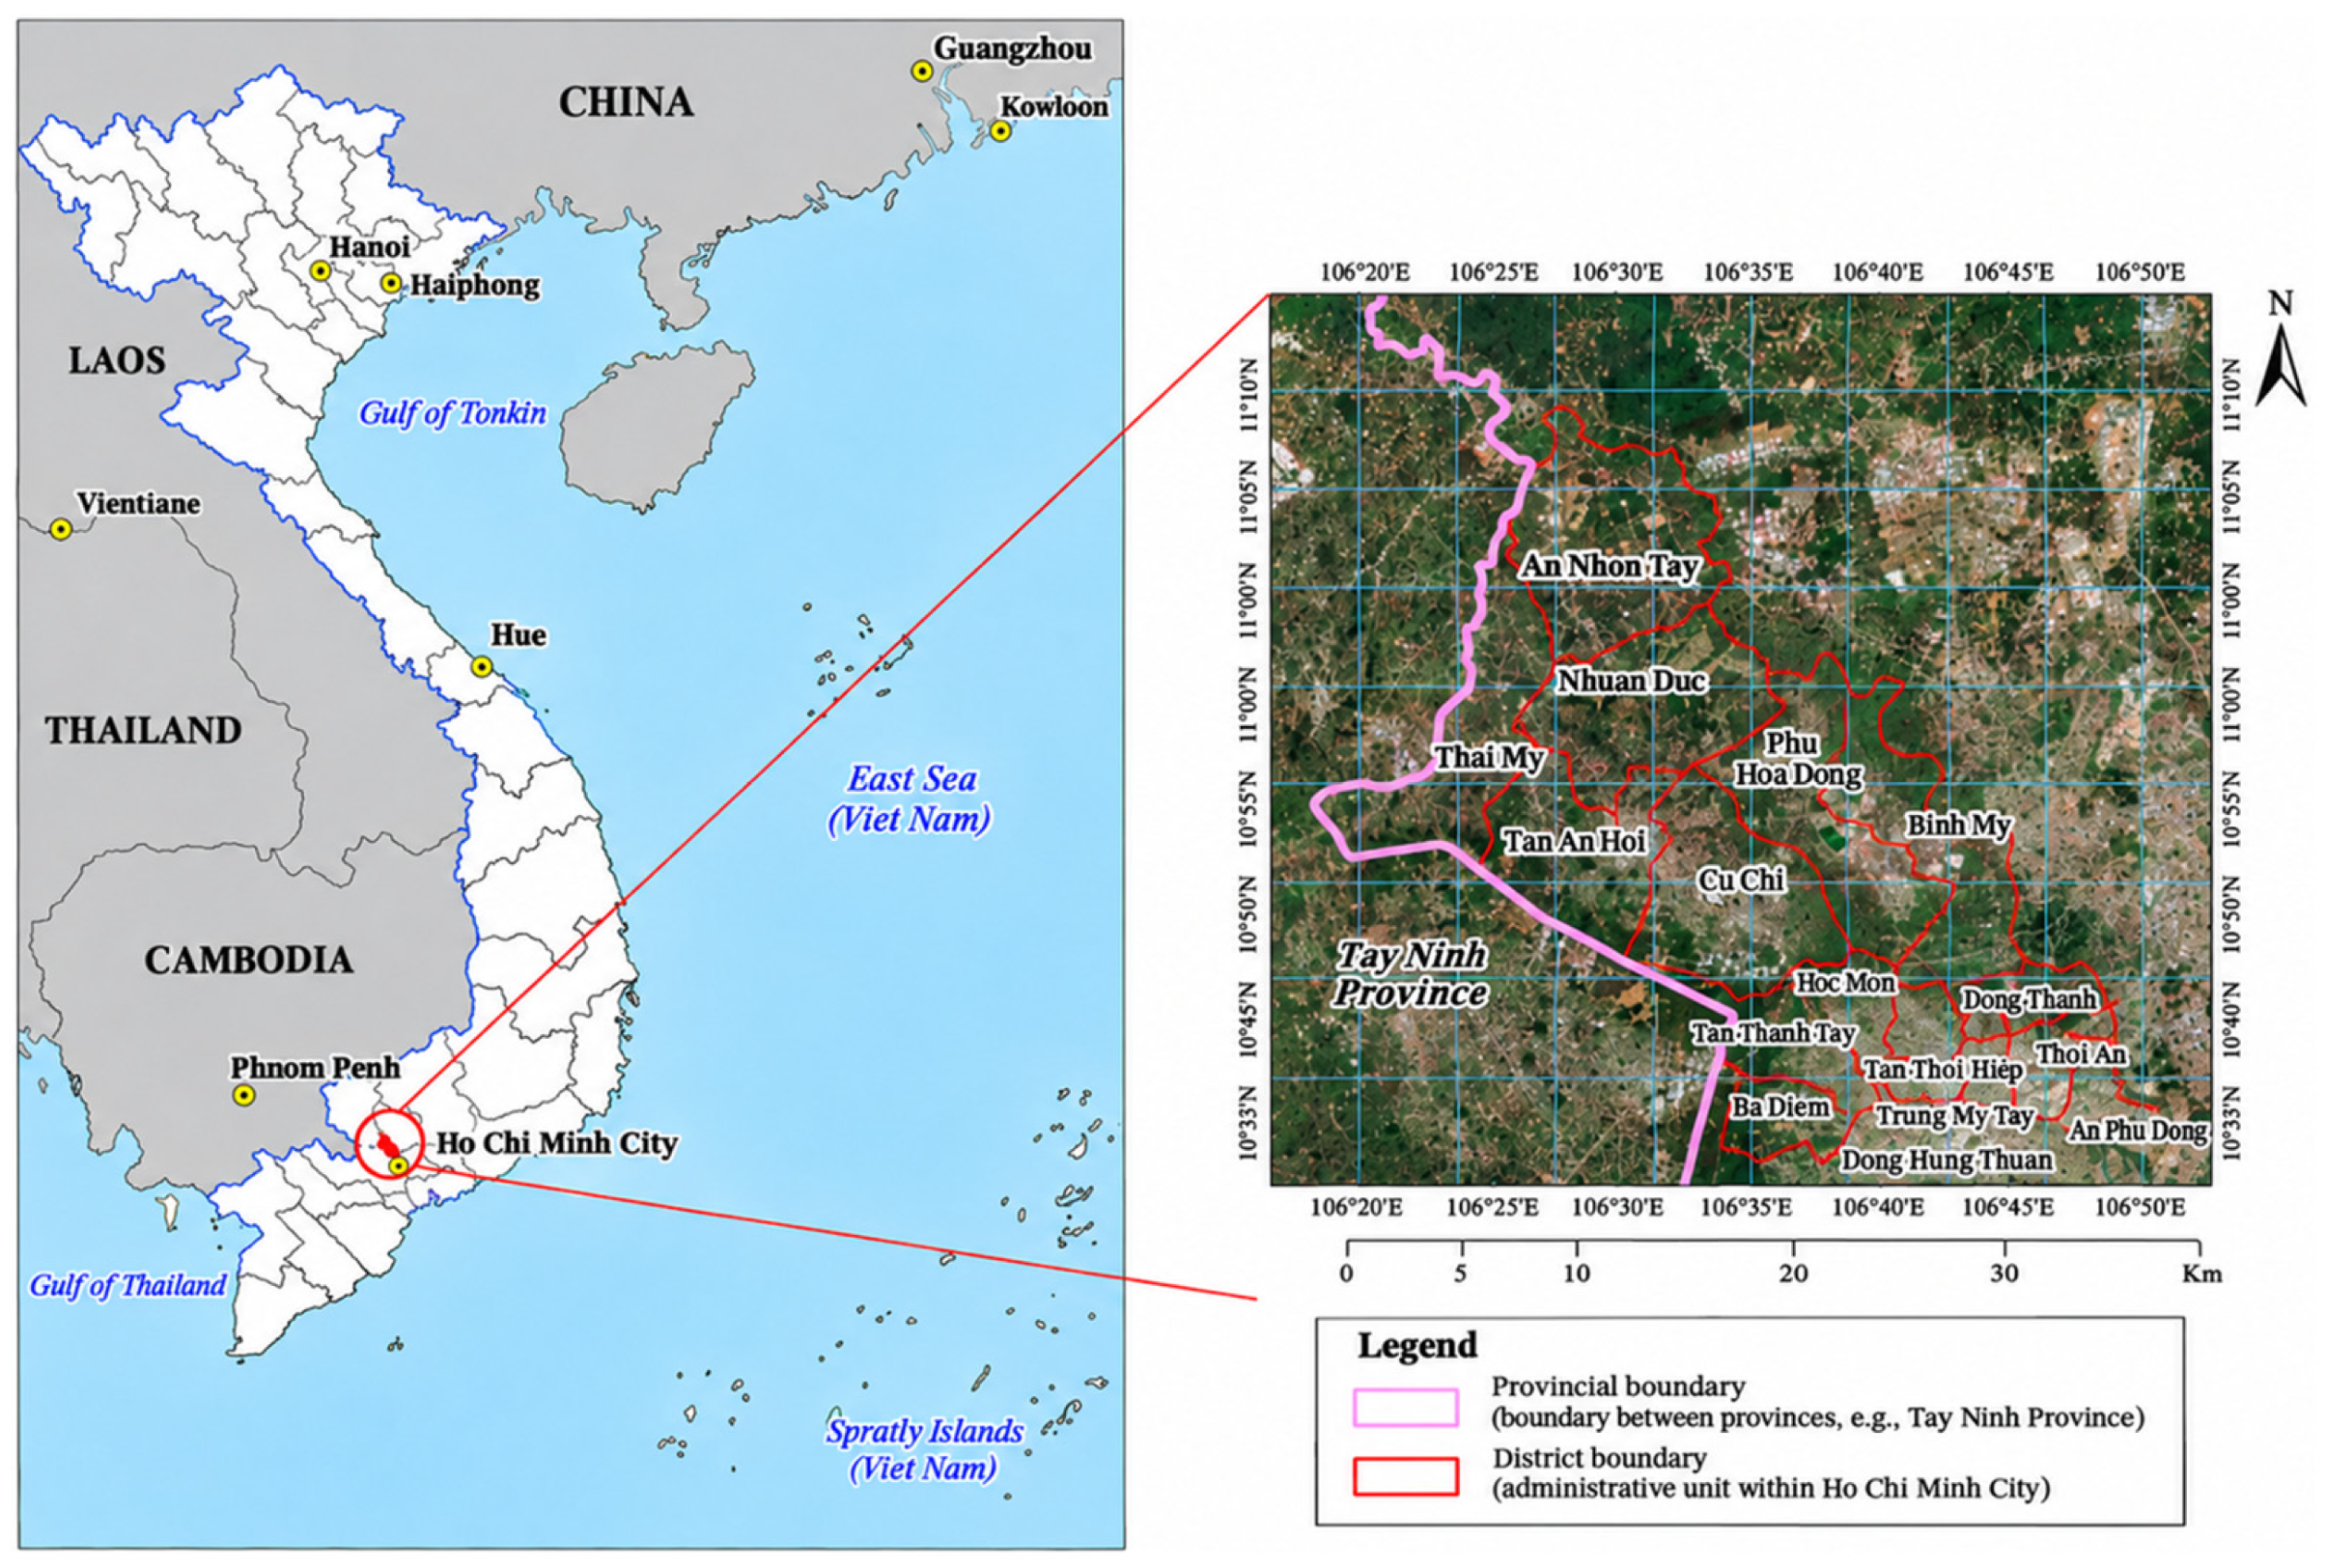
The study area is located in the northern and northwestern parts of HCM City, including District 12, Hoc Mon District, and Cu Chi District (before the administrative reorganization that took effect on 1 July 2025, under the two-tier local government model). Figure 1 illustrates the study area prior to the administrative boundary merger in Ho Chi Minh City. This area plays an important role in the multicentric urban development strategy of HCM City and represents a transitional zone between the urban core and peri-urban rural areas.
Figure 1.
The study area is located in the northern and northwestern parts of HCM City, based on the new administrative boundaries established after 1 July 2025.
Over the past decade, the study area has undergone rapid urbanization, particularly along major transportation corridors such as National Highway 22, National Highway 1A, and Ring Road 3. The expansion of infrastructure, residential areas, and industrial zones has accelerated the conversion of agricultural land into built-up areas. Despite these changes, substantial agricultural and green spaces remain, especially in Cu Chi District, reflecting the heterogeneous peri-urban landscape typical of rapidly growing Asian cities [11,12].
3. Materials and Methods
3.1. Satellite Image Data
This study used Level 2A Sentinel 2 imagery, which had been atmospherically corrected to the bottom of atmosphere reflectance and standardized to the UTM/WGS 84 coordinate system (Zone 48N). The preprocessing procedures included image enhancement, band combination, and clipping to the study area. Sentinel 2, developed by the European Space Agency under the Copernicus Programme, is a multispectral satellite dataset consisting of 13 spectral bands with high spatial resolution (10 m) and a 5-day revisit cycle through the combined operation of Sentinel 2A and Sentinel 2B. Satellite images were selected for the years 2015, 2018, 2020, 2022, and 2024, with low cloud cover percentages ranging from 0 to 2.4%, ensuring high reliability for land cover change analysis.
3.2. Support Vector Machine Algorithm for Land Use and Land Cover Classification
Object-Based Image Analysis (OBIA) was applied to improve land cover classification accuracy. Sentinel 2 imagery was segmented in eCognition 10.3 using a multiresolution segmentation algorithm to generate image objects based on spectral, shape, and spatial characteristics [13]. Spectral, textural, and shape features extracted from these objects were then used as input variables for the Support Vector Machine (SVM) classifier to categorize land use and land cover types, including (i) built-up land, (ii) agricultural land, (iii) forest land, (iv) bare land, and (v) water bodies.
Classification accuracy was evaluated using overall accuracy and the Kappa coefficient based on ground reference points [14].
where r is the total number of columns in the error matrix; xii represents the number of observed pixels in row i and column i (along the main diagonal); xi+ is the total number of observed pixels in row i; x+i is the total number of observed pixels in column i; and N is the total number of observed pixels in the error matrix.
3.3. Analysis and Assessment of Spatial Landscape Structure Dynamics Using Landscape Metrics
Urban landscape fragmentation analysis was applied to evaluate the degree of spatial dispersion and structural changes of urban land in the Cu Chi area during 2010-2025. This method allows for the identification of urban expansion trends through changes in urban morphology and spatial connectivity over time [15,16]. All landscape metrics were calculated at the landscape level to provide an overall assessment of landscape structure and spatial fragmentation dynamics across the entire study area. The landscape metrics used to characterize landscape structure, along with their abbreviations, descriptions, and measurement units, are summarized in Table 1.
Table 1.
Description of landscape metrics used for landscape structure analysis.
3.4. Comprehensive Landscape Index (CLI) Using Principal Component Analysis
The Comprehensive Landscape Index (CLI) was developed to quantify overall landscape characteristics and spatial changes during the study period. First, Principal Component Analysis (PCA) was applied to the eight landscape metrics at the landscape level to reduce multicollinearity and standardize variables using min-max normalization:
where βni is the loading coefficient of landscape metric and Xn the ith principal component.
The principal components explaining approximately 80% of the cumulative variance were then integrated to construct the final CLI [17]:
where Fim is the score of m-th principal component for observation i, M is the number of retained components, and αm is the weight of the m-th component, defined as ratio of its explained variance to the total variance explained by the M retained components:
where λm is the eigenvalue (explained variance) of the m-th principal component.
3.5. Sensitivity Analysis Using the Coefficient of Variation
The coefficient of variation (Cv) was used to evaluate the variability of landscape metrics [18]:
Based on previous studies [19], Cv values were classified into five levels ranging from low to high variability. In landscape ecology, CV has also been used to assess the sensitivity of landscape pattern metrics to differences in image classification and post-processing approaches [20]. These applications provide a methodological basis for using CV to compare the relative variability of landscape indicators.
In this study, the calculated CV values were classified into five levels of variability using a classification scheme applied in previous remote-sensing research [21]. The calculated Cv values were grouped into five levels of variability, ranging from low to high, according to the thresholds presented in Table 2.
Table 2.
Classification of landscape variability based on the coefficient of variation (Cv).
4. Results and Discussion
4.1. Overall Trends of Land Use and Land Cover Change
The object-based classification approach combined with the Support Vector Machine (SVM) algorithm produced reliable LULC maps, with Kappa coefficients of 0.81 (2015), 0.83 (2018), 0.81 (2020), 0.79 (2022), and 0.90 (2024). These results indicate relatively high classification accuracy throughout the study period. The area statistics for the five LULC classes across these observation years are summarized in Table 3.
Table 3.
Land use and land cover (LULC) area statistics in Cu Chi area during 2010-2024 (ha).
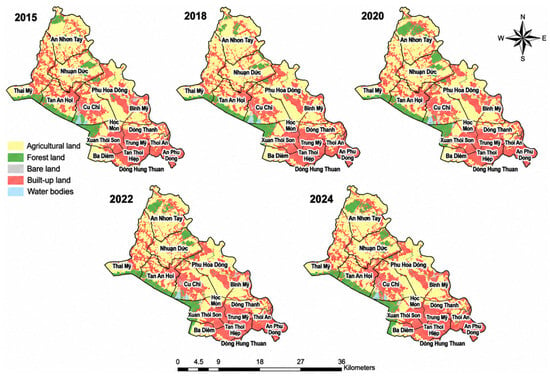
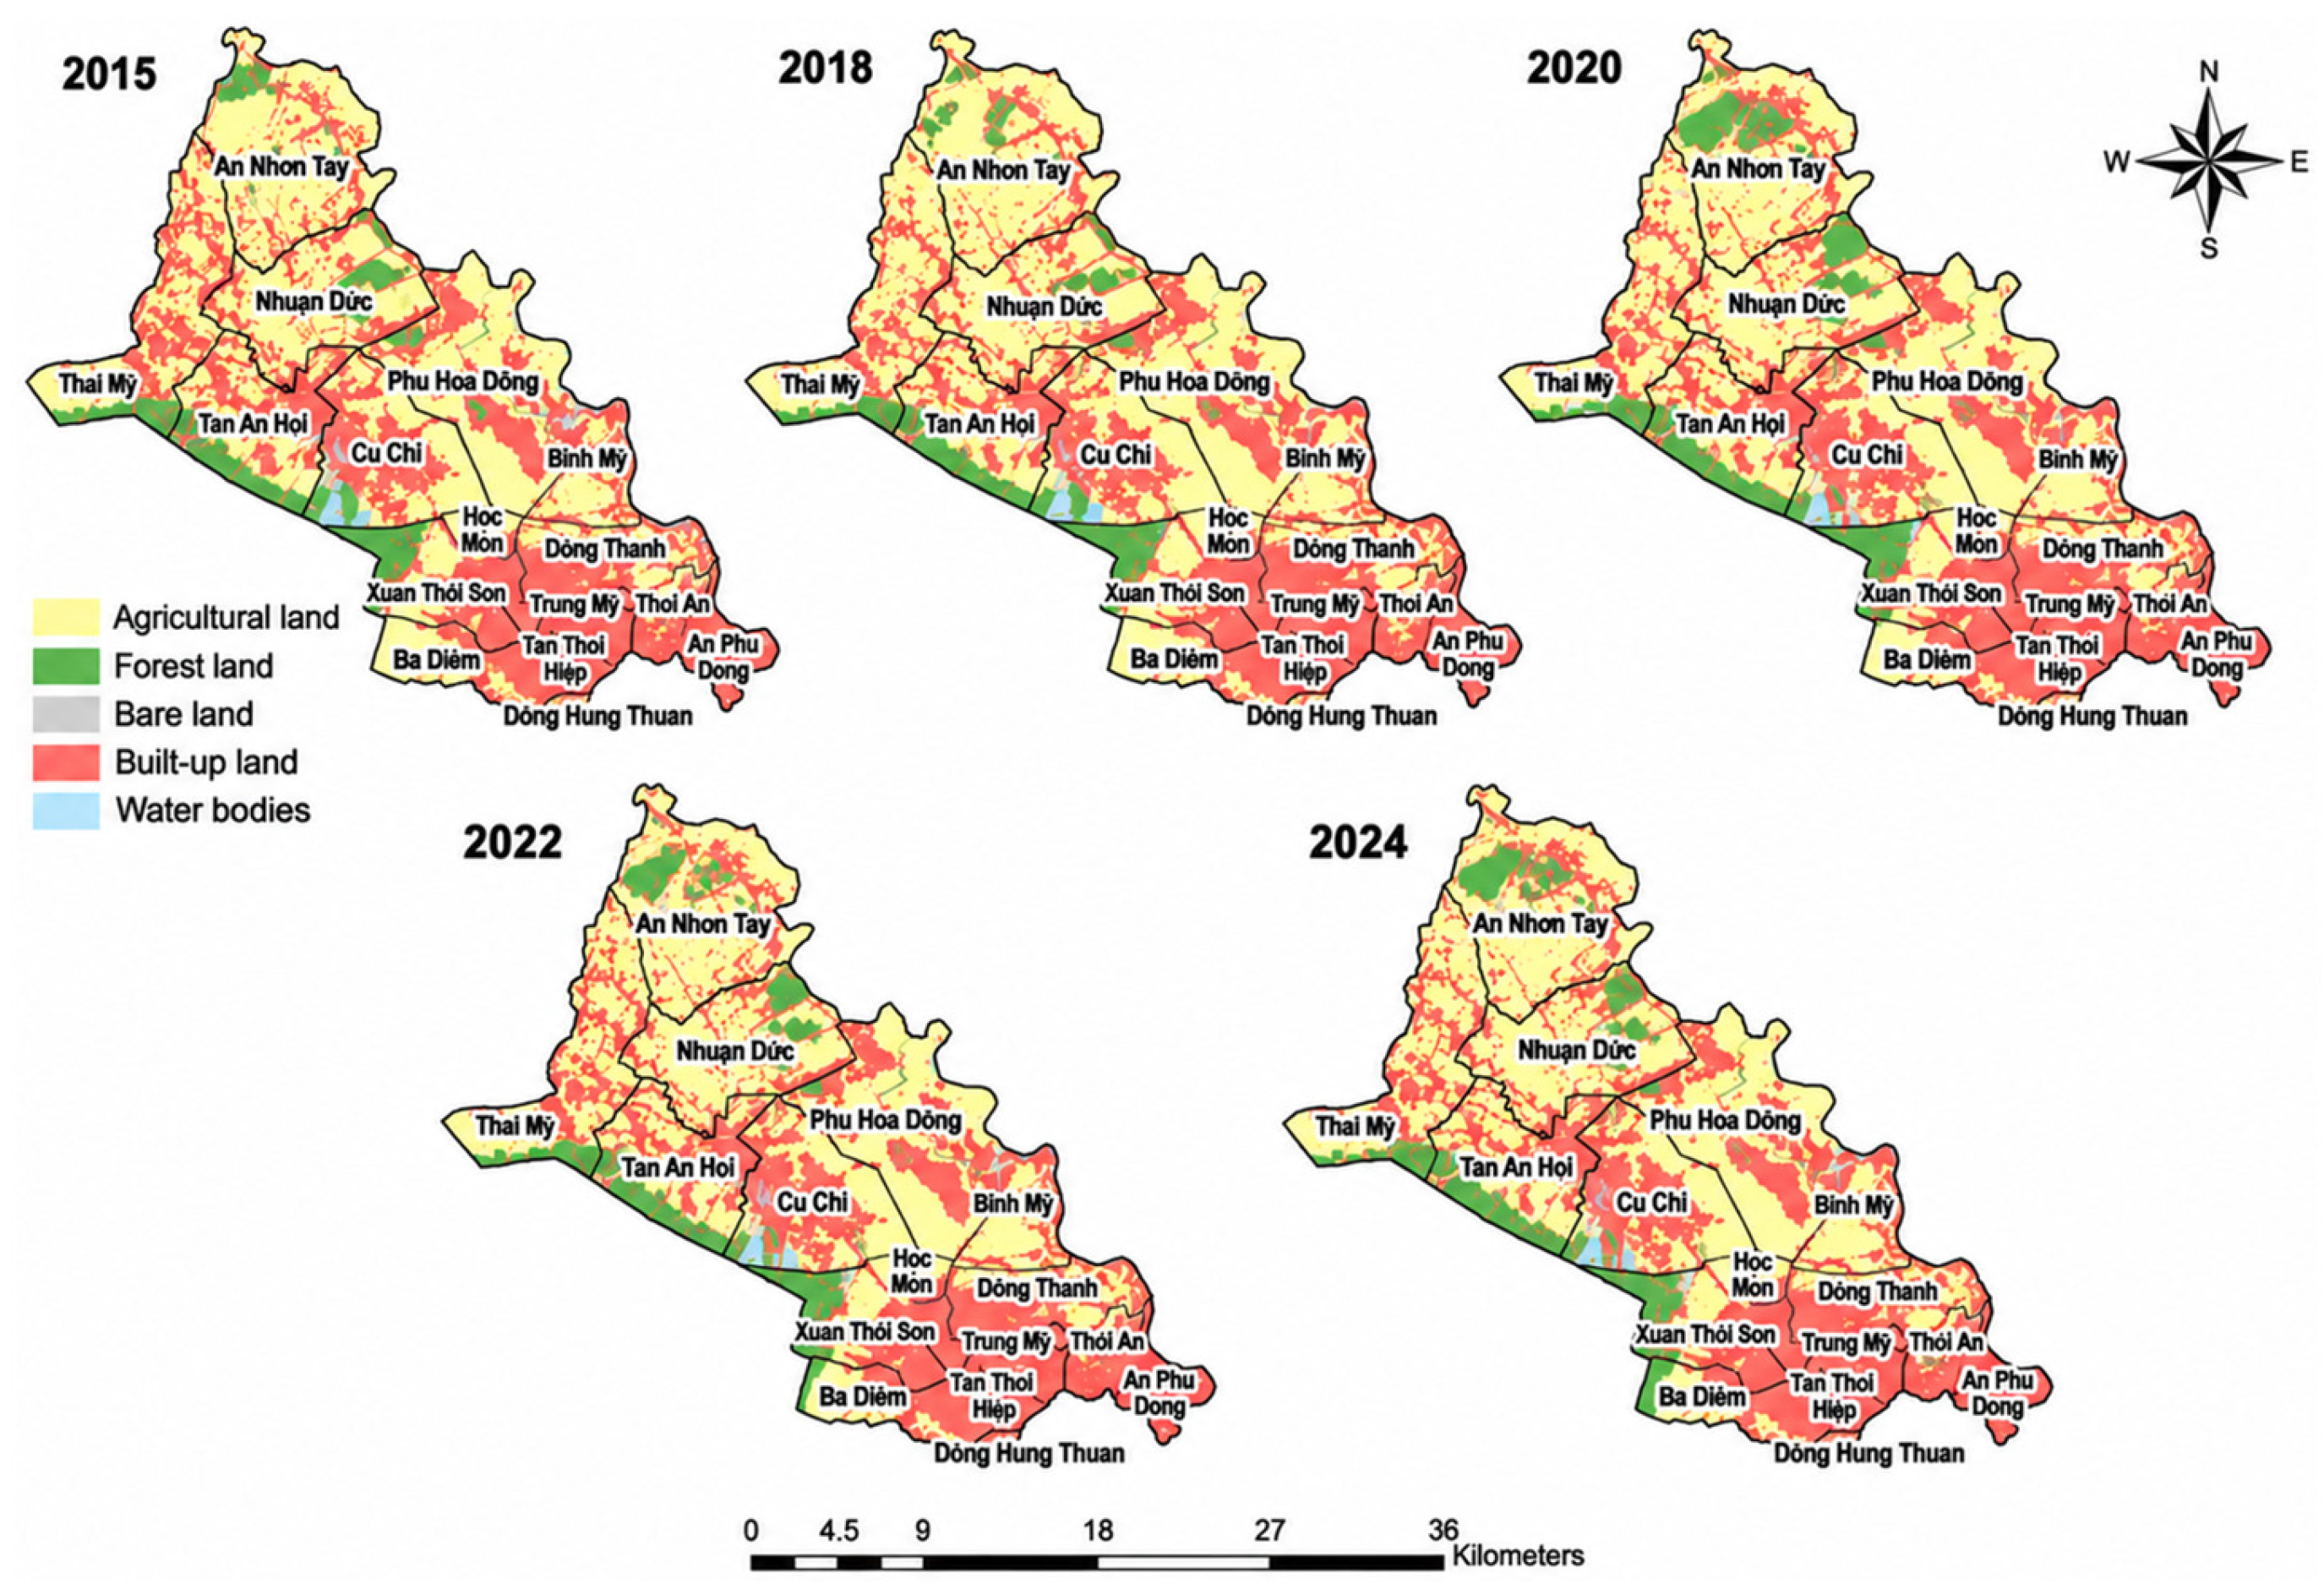
LULC statistics indicate a clear urbanization trend in northern and northwestern Ho Chi Minh City from 2015 to 2024. Driven by residential, infrastructure, and industrial development, built-up land expanded continuously from 23,552.44 ha to 26,896.81 ha. Conversely, rapid urban-industrial conversion caused agricultural land to drop significantly from 27,388.04 ha to 23,826.89 ha. Meanwhile, forest land fluctuated with a slight overall net increase, water bodies grew gradually after 2018, and bare land remained low with minimal changes. Based on the LULC classification results for the 2015-2024 period in the northern part of HCM City (Figure 2), the land cover structure exhibits clear spatial differentiation and has been strongly influenced by the urbanization process.
Figure 2.
Land use and land cover (LULC) dynamics in the north and northern region of Ho Chi Minh City from 2015 to 2024.
- -
- Built-up land and agricultural land: Built-up land shows a continuous expansion trend, with a high concentration in the southern part (Hoc Mon District and District 12) and subsequent outward growth toward the central area of Cu Chi along National Highway 22. In contrast, although agricultural land remains the dominant land cover type and occupies most of the core communes of Cu Chi, it has been continuously converted and serves as the primary land reserve for urban expansion.
- -
- Water bodies: The water surface class maintains a relatively stable spatial configuration throughout the study period, primarily defined by the Sai Gon River basin and the associated canal network.
- -
- Bare land: Bare land is mainly associated with areas undergoing land preparation for infrastructure development or agricultural fields left fallow after harvesting.
- -
- Forest land: Forest land exhibits a highly concentrated distribution pattern, occurring mainly in the northern and western communes of Cu Chi (e.g., An Nhon Tay, Nhuan Duc, and Thai My). These forested areas are closely associated with the Cu Chi Tunnels Historical Site complex, the Cu Chi Botanical Garden, and plantations of Acacia hybrid and rubber trees within the study area.
4.2. Dynamics of Landscape Structure Under Urbanization During 2015-2024
The landscape metrics reveal substantial changes in landscape structure during 2015-2024 under rapid urbanization processes in the northern and northwestern areas. The values of the eight-landscape metrics for each observation year are summarized in Table 4.
Table 4.
Landscape metrics at the landscape level during 2015-2024.
For Group 1 metrics related to landscape density, edge, and dominance (NP, PD, and LPI), the Number of Patches (NP) and Patch Density (PD) generally decreased from 2015 to 2022, indicating a reduction in the number of fragmented patches and a tendency toward landscape aggregation. However, both metrics increased again in 2024, suggesting renewed fragmentation associated with accelerated urban expansion. The Largest Patch Index (LPI) decreased markedly from 27.56 in 2015 to 16.51 in 2024, indicating a reduction in landscape dominance and increasing spatial heterogeneity.
For Group 2, the Mean Shape Index (SHAPE_mn) increased from 1.60 in 2015 to 1.88 in 2022 before slightly declining in 2024. This trend reflects increasing complexity and irregularity of landscape patch shapes due to urban expansion.
For Group 3 diversity metrics, Shannon’s Diversity Index (SHDI) and Simpson’s Diversity Index (SIDI) remained stable throughout the study period, indicating that overall landscape diversity changed only slightly despite substantial land conversion processes.
For Group 4 metrics related to contagion and interspersion, the Contagion Index (CONTAG) fluctuated slightly around 63-65, suggesting relatively stable landscape aggregation and connectivity at the landscape level. Conversely, the Interspersion and Juxtaposition Index (IJI) decreased after 2015. This indicates reduced intermixing and greater spatial segregation among land cover types due to intensifying urbanization pressure.
4.3. Analysis of Comprehensive Landscape Index
This study quantified a series of landscape metrics at the landscape level, including: (i) Number of Patches (NP); (ii) Patch Density (PD); (iii) Largest Patch Index (LPI); (iv) Contagion Index (CONTAG); (v) Interspersion and Juxtaposition Index (IJI); (vi) Mean Shape Index (SHAPE_mn); (vii) Shannon’s Diversity Index (SHDI); and (viii) Simpson’s Diversity Index (SIDI). These eight metrics represent various aspects of landscape structure, including patch quantity, size, fragmentation, adjacency, diversity, and spatial connectivity, thereby providing a comprehensive assessment of overall landscape structure.
4.3.1. Analysis of Comprehensive Landscape Structure Metrics
The PCA results indicate strong covariation among landscape metrics during 2015–2024. In 2018, 2020, and 2022, the first principal component (PC1) explained a very high proportion of total variance, ranging from 86.63% to 92.78%, indicating that most landscape information could be represented by a single dominant gradient. In contrast, 2015 and 2024 showed relatively higher contributions from the second principal component (PC2), accounting for 30.28% and 25.40% of the variance, respectively. This suggests the presence of at least two meaningful dimensions of landscape variation during these years. The cumulative explained variance of PC1 and PC2 exceeded 98% in all years, while the remaining components contributed less than 1% and were therefore excluded from further analysis. The eigenvalues and explained and cumulative variance of the first two principal components across the five observation years are presented in Table 5.
Table 5.
Eigenvalues and explained variance of the first two principal components.
4.3.2. PCA Loading Structure and Landscape Metrics Analysis
The PCA loading structure remained highly stable throughout 2015-2024. Metrics including Simpson’s Diversity Index (SIDI), Shannon’s Diversity Index (SHDI), Mean Shape Index (SHAPE_mn), Largest Patch Index (LPI), and Number of Patches (NP) consistently showed high positive loadings on PC1 (approximately 0.39–0.40), while the Contagion Index (CONTAG) remained around 0.37. Patch Density (PD) had relatively lower loadings (0.27–0.29), indicating an intermediate role between aggregation and fragmentation processes. In contrast, the Interspersion and Juxtaposition Index (IJI) exhibited very low loadings on PC1 but extremely high negative loadings on PC2 (approximately −0.99), indicating that PC2 primarily captured the independent variation in IJI. This suggests that while most landscape metrics formed a coherent structural group represented by PC1, IJI reflected distinct spatial intermixing and fragmentation characteristics.
The PCA loading coefficients for the Number of Patches (NP), Patch Density (PD), Largest Patch Index (LPI), Mean Shape Index (SHAPE_mn), Contagion Index (CONTAG), Interspersion and Juxtaposition Index (IJI), Shannon’s Diversity Index (SHDI), and Simpson’s Diversity Index (SIDI) across the five observation years are summarized in Table 6.
Table 6.
Summary of loading coefficients derived from eigenvalues and eigenvectors.
4.3.3. Construction of the Comprehensive Landscape Index (CLI)
In 2018, 2020, and 2022, PCA results showed that PC1 explained over 98% of the total variance, indicating a highly unified structural pattern. PC1 exhibited strong positive loadings for SIDI, SHDI, SHAPE_mn, LPI, NP, and CONTAG, while IJI contributed negligibly. Therefore, CLI for these years was defined solely based on PC1. The resulting principal component equations and the corresponding CLI formulations for 2018, 2020, and 2022 are presented in Table 7.
Table 7.
Principal component equations and CLI for 2018, 2020, and 2022.
For 2015 and 2024, PC1 explained only 68-73% of variance, indicating a multi-dimensional structure. PC2 captured an independent gradient dominated by IJI. Thus, CLI was constructed as a weighted combination of PC1 and PC2 based on explained variance. The equations for the PC1 and PC2, together with the variance-weighted CLI formulations for 2015 and 2024, are presented in Table 8.
Table 8.
Principal component equations and CLI for 2015 and 2024.
4.3.4. Sensitivity Analysis of Landscape Indicators
The sensitivity of landscape indicators was assessed using the coefficient of variation (Cv), which reflects the relative variability of each metric over the 2015–2024 period. Higher Cv values indicate stronger responsiveness to landscape structural changes, whereas lower values suggest greater temporal stability. This analysis provides a comparative assessment of the degree of variability exhibited by individual landscape metrics across the five observation years, helping to distinguish indicators that respond more strongly to landscape structural changes from those that remain relatively stable over time. The mean values, standard deviations, coefficients of variation, and corresponding sensitivity classifications for the selected landscape metrics are summarized in Table 9.
Table 9.
Sensitivity of landscape metrics (2015–2024).
The results show that spatial configuration metrics such as NP and PD exhibit the highest variability (Cv = 29.9%), followed by LPI (26.7%), clearly reflecting ongoing fragmentation processes and changes in patch size distribution. In contrast, diversity and connectivity-related indices such as SHDI, SIDI, and CONTAG display very low variability (Cv < 5%), indicating relatively stable landscape composition and connectivity patterns. IJI and SHAPE_mn show moderately low variability, suggesting minor adjustments in spatial interspersion and patch geometry.
Overall, landscape dynamics during the study period are primarily driven by spatial fragmentation processes (NP, PD, LPI), while compositional diversity and connectivity remain relatively stable. These findings are consistent with PCA results, where fragmentation-related variables dominate the principal variation axis, confirming that changes in the Composite Landscape Index (CLI) mainly reflect spatial structural dynamics rather than land-cover compositional change.
5. Conclusions
Overall, the results demonstrate a clear and consistent trajectory of urban-driven landscape transformation during 2015–2024 in the northern and northwestern areas of Ho Chi Minh City. Land use change analysis reveals continuous expansion of built-up areas accompanied by a substantial decline in agricultural land, indicating strong pressure from urbanization and infrastructure development. The increase in built-up land together with the decrease in agricultural and forest land may lead to higher air pollution in the study area. Urbanization increases transportation, construction activities, and energy consumption, while the reduction in vegetation cover decreases the capacity to absorb emissions and particulate matter. Therefore, this land use change trend may increase environmental pressure and negatively affect air quality in the study area.
The integrated PCA-based Composite Landscape Index (CLI), together with sensitivity analysis, further confirms that landscape dynamics are predominantly governed by spatial configuration rather than land-cover composition. Metrics associated with fragmentation (NP, PD, LPI) exhibit the highest variability and dominate the principal component structure, whereas diversity and contagion-related indices contribute marginally to temporal change. Consequently, the CLI effectively captures spatial structural reorganization induced by urbanization, providing a robust framework for monitoring and quantifying landscape evolution in rapidly urbanizing peri-urban systems.
Author Contributions
Conceptualization, C.H.T. and H.T.L.; methodology, C.H.T. and P.H.T.; software, C.H.T.; validation, C.H.T. and M.C.B.; formal analysis, C.H.T.; investigation, C.H.T.; resources, H.T.L. and T.N.N.; data curation, C.H.T.; writing—original draft preparation, C.H.T.; writing—review and editing, C.H.T., H.T.L., P.H.T., M.C.B. and T.N.N.; visualization, C.H.T.; supervision, H.T.L. and P.H.T.; project administration, P.H.T. All authors have read and agreed to the published version of the manuscript.
Funding
The authors would like to sincerely thank the Vietnam Academy of Science and Technology for financially supporting this research through project No. NVKN03.02/26-27.
Institutional Review Board Statement
Not applicable.
Informed Consent Statement
Not applicable.
Data Availability Statement
Publicly available datasets were analyzed in this study. The Sentinel-2 imagery can be found via the Copernicus Data Space Ecosystem: https://dataspace.copernicus.eu/.
Conflicts of Interest
The authors declare no conflicts of interest.
References
- Seto, K.C.; Güneralp, B.; Hutyra, L.R. Global forecasts of urban expansion to 2030 and direct impacts on biodiversity and carbon pools. Proc. Natl. Acad. Sci. USA 2012, 109, 16083–16088. [Google Scholar] [CrossRef] [Scilit]
- Li, Y.; Zhen, W.; Luo, B.; Shi, D.; Li, Z. Analyzing spatial–temporal characteristics and influencing mechanisms of landscape changes in the context of urban expansion using remote sensing. Remote Sens. 2024, 16, 2113. [Google Scholar] [CrossRef] [Scilit]
- Elmi, M.; Rouhani, A.; Keshavarz, E. Landscape metrics for urbanization and land-use change monitoring from remote sensing images: A case of Shiraz Metropolis, Iran. Int. J. Earth Sci. Knowl. Appl. 2022, 4, 43–50. [Google Scholar]
- Foley, J.A.; DeFries, R.; Asner, G.P.; Barford, C.; Bonan, G.; Carpenter, S.R.; Chapin, F.S.; Coe, M.T.; Daily, G.C.; Gibbs, H.K. Global consequences of land use. Science 2005, 309, 570–574. [Google Scholar] [CrossRef] [Scilit]
- Baez, P.O.; Barona, P.C.; Bogaert, J. Characterizing landscape patterns in urban–rural interfaces. J. Urban Manag. 2021, 10, 46–56. [Google Scholar] [CrossRef] [Scilit]
- Wang, J.; Chen, Y.; Liao, W.; He, G.; Tett, S.F.B.; Yan, Z.; Zhai, P.; Feng, J.; Ma, W.; Huang, C. Anthropogenic emissions and urbanization increase risk of compound hot extremes in cities. Nat. Clim. Change 2021, 11, 1084–1090. [Google Scholar] [CrossRef] [Scilit]
- Peng, J.; Wang, Y.; Zhang, Y.; Wu, J.; Li, W.; Li, Y. Evaluating the effectiveness of landscape metrics in quantifying spatial patterns. Ecol. Indic. 2010, 10, 217–223. [Google Scholar] [CrossRef] [Scilit]
- Bhatta, B.; Saraswati, S.; Bandyopadhyay, D. Quantifying the degree-of-freedom, degree-of-sprawl and degree-of-compactness in urban growth using remote sensing data. Appl. Geogr. 2010, 30, 96–111. [Google Scholar]
- Li, J.; Li, C.; Zhu, F.; Song, C.; Wu, J. Spatiotemporal pattern of urbanization in Shanghai, China between 1989 and 2005. Landsc. Ecol. 2013, 28, 1545–1565. [Google Scholar] [CrossRef] [Scilit]
- Kontgis, C.; Schneider, A.; Fox, J.; Saksena, S.; Spencer, J.; Castrence, M. Monitoring peri-urbanization in the Greater Ho Chi Minh City metropolitan area. Appl. Geogr. 2014, 53, 377–388. [Google Scholar] [CrossRef] [Scilit]
- McGee, T.G. The emergence of desakota regions in Asia: Expanding a hypothesis. In The Extended Metropolis: Settlement Transition in Asia; Ginsburg, N.J., Koppel, B., McGee, T.G., Eds.; University of Hawaii Press: Honolulu, HI, USA, 1991; pp. 3–26. [Google Scholar]
- Friedmann, J. Becoming urban: Peri-urban dynamics in Vietnam and China. Pac. Aff. 2011, 84, 425–434. [Google Scholar] [CrossRef] [Scilit]
- Bishop, Y.M.M.; Fienberg, S.E.; Holland, P.W. Discrete Multivariate Analysis: Theory and Practice; MIT Press: Cambridge, MA, USA, 1975. [Google Scholar]
- Benz, U.C.; Hofmann, P.; Willhauck, G.; Lingenfelder, I.; Heynen, M. Multi-resolution, object-oriented fuzzy analysis of remote sensing data for GIS-ready information. ISPRS J. Photogramm. Remote Sens. 2004, 58, 239–258. [Google Scholar] [CrossRef] [Scilit]
- Hao, R.; Yu, D.; Liu, Y.; Liu, Y.; Qiao, J.; Wang, X.; Du, J. Impacts of changes in climate and landscape pattern on ecosystem services. Sci. Total Environ. 2017, 579, 718–728. [Google Scholar] [CrossRef] [Scilit]
- Horodnic, V.-D.; Bistricean, P.-I.; Mihăilă, D.; Efros, V. Application of landscape metrics and GIS techniques for assessment of land use and land cover changes in the Suceava river basin, Romania. In Proceedings of the 5th International Scientific Conference GEOBALCANICA, Sofia, Bulgaria, 13–14 June 2019; pp. 591–609. [Google Scholar]
- Liu, S.; Li, X.; Chen, L.; Zhao, Q.; Zhao, C.; Hu, X.; Li, J. A New Approach to Investigate the Spatially Heterogeneous in the Cooling Effects of Landscape Pattern. Land 2022, 11, 239. [Google Scholar] [CrossRef] [Scilit]
- Khare, V.; Khare, C.; Nema, S.; Baredar, P. Data visualization and descriptive statistics of solar energy system. In Decision Science and Operations Management of Solar Energy Systems; Academic Press: Cambridge, MA, USA, 2023; pp. 33–75. [Google Scholar]
- He, Z.; Yue, T.; Chen, Y.; Mu, W.; Xi, M.; Qin, F. Analysis of spatial and temporal changes in vegetation cover and driving forces in the Yan River Basin, Loess Plateau. Remote Sens. 2023, 15, 4240. [Google Scholar] [CrossRef] [Scilit]
- Mas, J.-F.; Gao, Y.; Pacheco, J.A.N. Sensitivity of Landscape Pattern Metrics to Classification Approaches. For. Ecol. Manag. 2010, 259, 1215–1224. [Google Scholar] [CrossRef] [Scilit]
- Rogerson, P.A. Statistical Methods for Geography: A Student’s Guide, 5th ed.; SAGE Publications: London, UK, 2019. [Google Scholar]

Disclaimer/Publisher’s Note: The statements, opinions and data contained in all publications are solely those of the individual author(s) and contributor(s) and not of MDPI and/or the editor(s). MDPI and/or the editor(s) disclaim responsibility for any injury to people or property resulting from any ideas, methods, instructions or products referred to in the content. |
© 2026 by the authors. Licensee MDPI, Basel, Switzerland. This article is an open access article distributed under the terms and conditions of the Creative Commons Attribution (CC BY) license.