


Abstract
Early-age concrete shrinkage strongly influences crack formation, serviceability, and durability. Although shrinkage mechanisms and prediction methods are well documented, measured early-age deformations can differ substantially from standard predictions under specific environmental conditions. This study experimentally investigates early concrete shrinkage and evaluates the adequacy of Eurocode-based prediction models. One concrete mix was tested using unreinforced standard and large-scale specimens and reinforced concrete slabs under controlled laboratory and on-site conditions. Two humidity levels, approximately 40% and 100% RH, were maintained at about 16 °C. Shrinkage was monitored from casting to 56 days using optical fibre sensors, resistance strain gauges, inductive displacement sensors, and mechanical extensometers. The results show pronounced differences between measured and Eurocode-predicted shrinkage, particularly at early ages. At 40% RH, the standard model approaches the measured magnitude at later ages but does not reproduce the rapid initial development. At 100% RH, it substantially underestimates shrinkage because drying shrinkage is assumed to be zero. The findings indicate that early-age shrinkage is inadequately represented in current formulations, especially under high-humidity curing, with implications for crack control and durability.
1. Introduction
Concrete shrinkage prediction is important for the design and service-life assessment of reinforced concrete structures [1,2,3]. Although standards such as Eurocode 2, fib Model Code 2010, and ACI guidelines provide established calculation methods, practical measurements may differ from predictions during setting and early hardening, particularly under specific environmental conditions or for non-conventional concrete mixes [4,5,6]. This discrepancy is important because early shrinkage can initiate cracks that affect serviceability and durability [3,5]. Proper mix design, curing, and reinforcement can mitigate these effects, but reinforcement designed from standard long-term shrinkage predictions may not fully address the initial cracking stage [5].
Early-age shrinkage comprises capillary, autogenous, and drying components [7,8]. Capillary shrinkage develops during setting as water is lost from the surface [9,10]; autogenous shrinkage results from hydration and internal self-desiccation [11,12]; and drying shrinkage develops through moisture loss to the environment [1,2]. Their relative contribution depends strongly on concrete composition and environmental conditions [12,13]. Identifying the effective “time zero” is also important because tensile stresses can begin to induce cracking from this point [14].
The fundamental aim of the research was to experimentally investigate early-age concrete shrinkage under specific environmental conditions and to compare the measured development with standard predictions. The program included unreinforced cube, beam, and large-block specimens, as well as large reinforced concrete slabs, all made with the same concrete mix [15]. Measurements were performed under controlled laboratory conditions and in the environment of the planned structure.
- Capillary shrinkage occurs during setting while the concrete is still plastic and is associated with rapid surface water loss [9,10]. It is particularly relevant under low humidity, warm, or drafty conditions [16].
- Autogenous shrinkage results from cement hydration, including chemical shrinkage and internal self-desiccation, and can be significant during the first days after casting, especially for low water-to-cement ratio concretes [17].
- Drying shrinkage results from moisture loss from the pore system to the environment and develops over a longer period [1,2]. Ambient relative humidity and curing conditions strongly affect its magnitude [3].
Existing analytical models were primarily calibrated for conventional concrete compositions and environmental conditions. Their applicability may therefore be limited when concrete composition or environmental conditions differ from those represented in the calibration data [18,19].
2. Materials and Methods
The experimental program combined optical fibre sensors, resistance strain gauges, inductive displacement sensors, and manual mechanical measurements. Using multiple techniques enabled cross-validation of results and assessment of measurement reliability. Two 20-foot refrigerated containers were used as climate chambers [5].
During the first 7 days, both containers were maintained at nearly 100% RH. Subsequently, container “A” was adjusted to approximately 40% RH, while container “T” remained at 100% RH for the full 56-day measurement period. The temperature was maintained at approximately 16 °C. The applied concrete mix is given in Table 1 and contained CEM III/A 32.5 N LH/SR blast furnace slag cement, metakaolin, superplasticizer, and shrinkage-reducing admixtures [5].
Table 1.
The experimental concrete mix design (per 1 m3 of fresh concrete) [5].
Compressive strength was measured at 3, 5, 7, 10, 14, 21, 28, 35, 42, 49, and 56 days using three 15 × 15 × 15 cm cubes per age; the 28-day compressive elastic modulus was also determined. Flexural-tensile strength was measured at 3, 7, 14, 21, 28, and 56 days using three 15 × 15 × 60 cm beams per age, with elastic moduli determined during bending tests. The strength specimens were also used for shrinkage measurements before fracture [5].
Specimens were stored in containers “A” and “T” at 40% and 100% RH, respectively. The resulting strength-related shrinkage series could be measured until the compression test.
Shrinkage of the small specimens was measured using a Pfender-type mechanical extensometer over a 100 mm gauge length, thermally compensated resistance strain gauges, and inductive displacement sensors [5].
Each container also contained one 80 × 80 × 80 cm unreinforced large specimen for shrinkage monitoring. Four methods were used for its monitoring: the three techniques applied to the small specimens and embedded/surface optical fibre sensors. Internal optical sensors were arranged in two perpendicular directions at the specimen centre [5].
Most surface measurements started after the first day because the sensors and measuring devices required a sufficiently strong concrete surface. Embedded optical sensors in the large specimens and slabs provided measurements from casting. Temperature and humidity were continuously monitored, and internal concrete temperature was also measured in the large specimens. The type of instruments are listed in Table 2 [5].
Table 2.
Summary of measuring instruments and sensors used in the experiment [5].
Large reinforced concrete slabs measuring 400 × 400 × 30 cm were cast in the actual underground construction environment of the planned structure. The slabs contained Ø16/75 mm top and bottom reinforcement meshes in two directions. The concrete mix was identical to that used for the laboratory specimens, and measurements continued to day 56 using optical sensors, including internal, reinforcement-mounted, and surface strain sensors and optical thermometers [5].
Data was recorded and processed using Catman Easy data acquisition software (v5.3). Sampling frequencies were 1 Hz in the containers and 0.1 Hz for the on-site slabs. UPS and battery backup were used for power-loss protection [5].
3. Experimental Results
3.1. Environmental Parameters and Strength Results
Container temperatures remained nearly constant except for a temporary increase between days 10 and 24 caused by an air-conditioning malfunction in container “A”; affected data were filtered. The internal concrete temperature remained stable. Mean air temperatures were 16.1 °C in “A” and 15.2 °C in “T” [5].
At 28 days, mean compressive strength was 70.40 MPa in container “A” and 64.40 MPa in “T”; at 56 days it was 74.10 and 67.90 MPa, respectively, an 8.4% difference. Both exceeded the planned characteristic strength of 53 MPa, which was reached by approximately day 11–12. Flexural-tensile strength between 28 and 56 days was 5.35 MPa in “A” and 8.16 MPa in “T”—a 34.4% difference in favour of the saturated environment [5].
At the tested age, the tensile and compressive elastic moduli in “T” were 48,650 and 54,025 MPa, respectively, while in “A” they were 42,632 and 42,500 MPa. The data was summarized in Table 3 [5].
Table 3.
Mechanical strength and stiffness characteristics measured in the experiment [5].
3.2. Critical Evaluation of Shrinkage Measurement Methods
Inductive displacement sensors were unsuitable for the experiment. Some instruments showed constant readings or physically implausible swelling, while another produced highly fluctuating data. These results prevented their reliable use for shrinkage evaluation [5].
Resistance strain gauges also produced unusable readings in several saturated-environment tests because high humidity softened the adhesive layer and caused false displacements. In the drier “A” container they operated reliably; the valid filtered data showed good repeatability. The shrinkage data was summarized in Table 4 [5].
Table 4.
Standard deviation (S.D.) and coefficient of variation (C.V.) of shrinkage measurements on day 56 [5].
Embedded optical sensors measured mean internal shrinkage of 0.23‰ in container “A” and 0.27‰ in container “T”, with maximum values of 0.25‰ and 0.33‰, respectively. Mean surface shrinkage was 0.31‰ in “A” and 0.23‰ in container “T”, with maxima of 0.47‰ and 0.32‰. Thus, the saturated environment produced higher internal but lower surface shrinkage [5].
3.3. Results of On-Site Reinforced Slab Measurements
The on-site slabs experienced air temperatures of 16.8–17.7 °C, increasing RH from 55% to 90%, and internal temperatures of 14.4–15.7 °C. Because reinforcement restrained shrinkage, direct comparison with the unreinforced specimens was not possible. We used the unreinforced shrinkage in the finite element model, within the material model of concrete. Then, with the measured data we could validate the model. At day 56, mean internal and surface shrinkage were 0.44‰ and 0.37‰, respectively [5].
4. Numerical Simulation
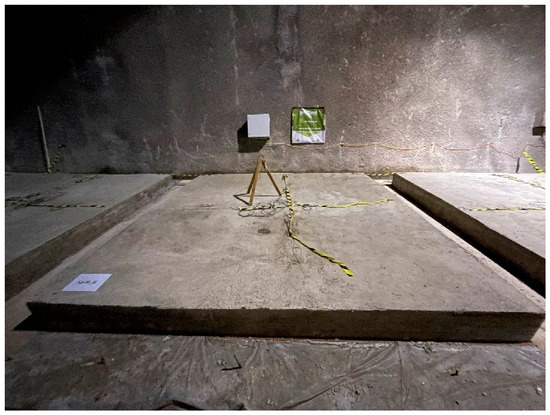
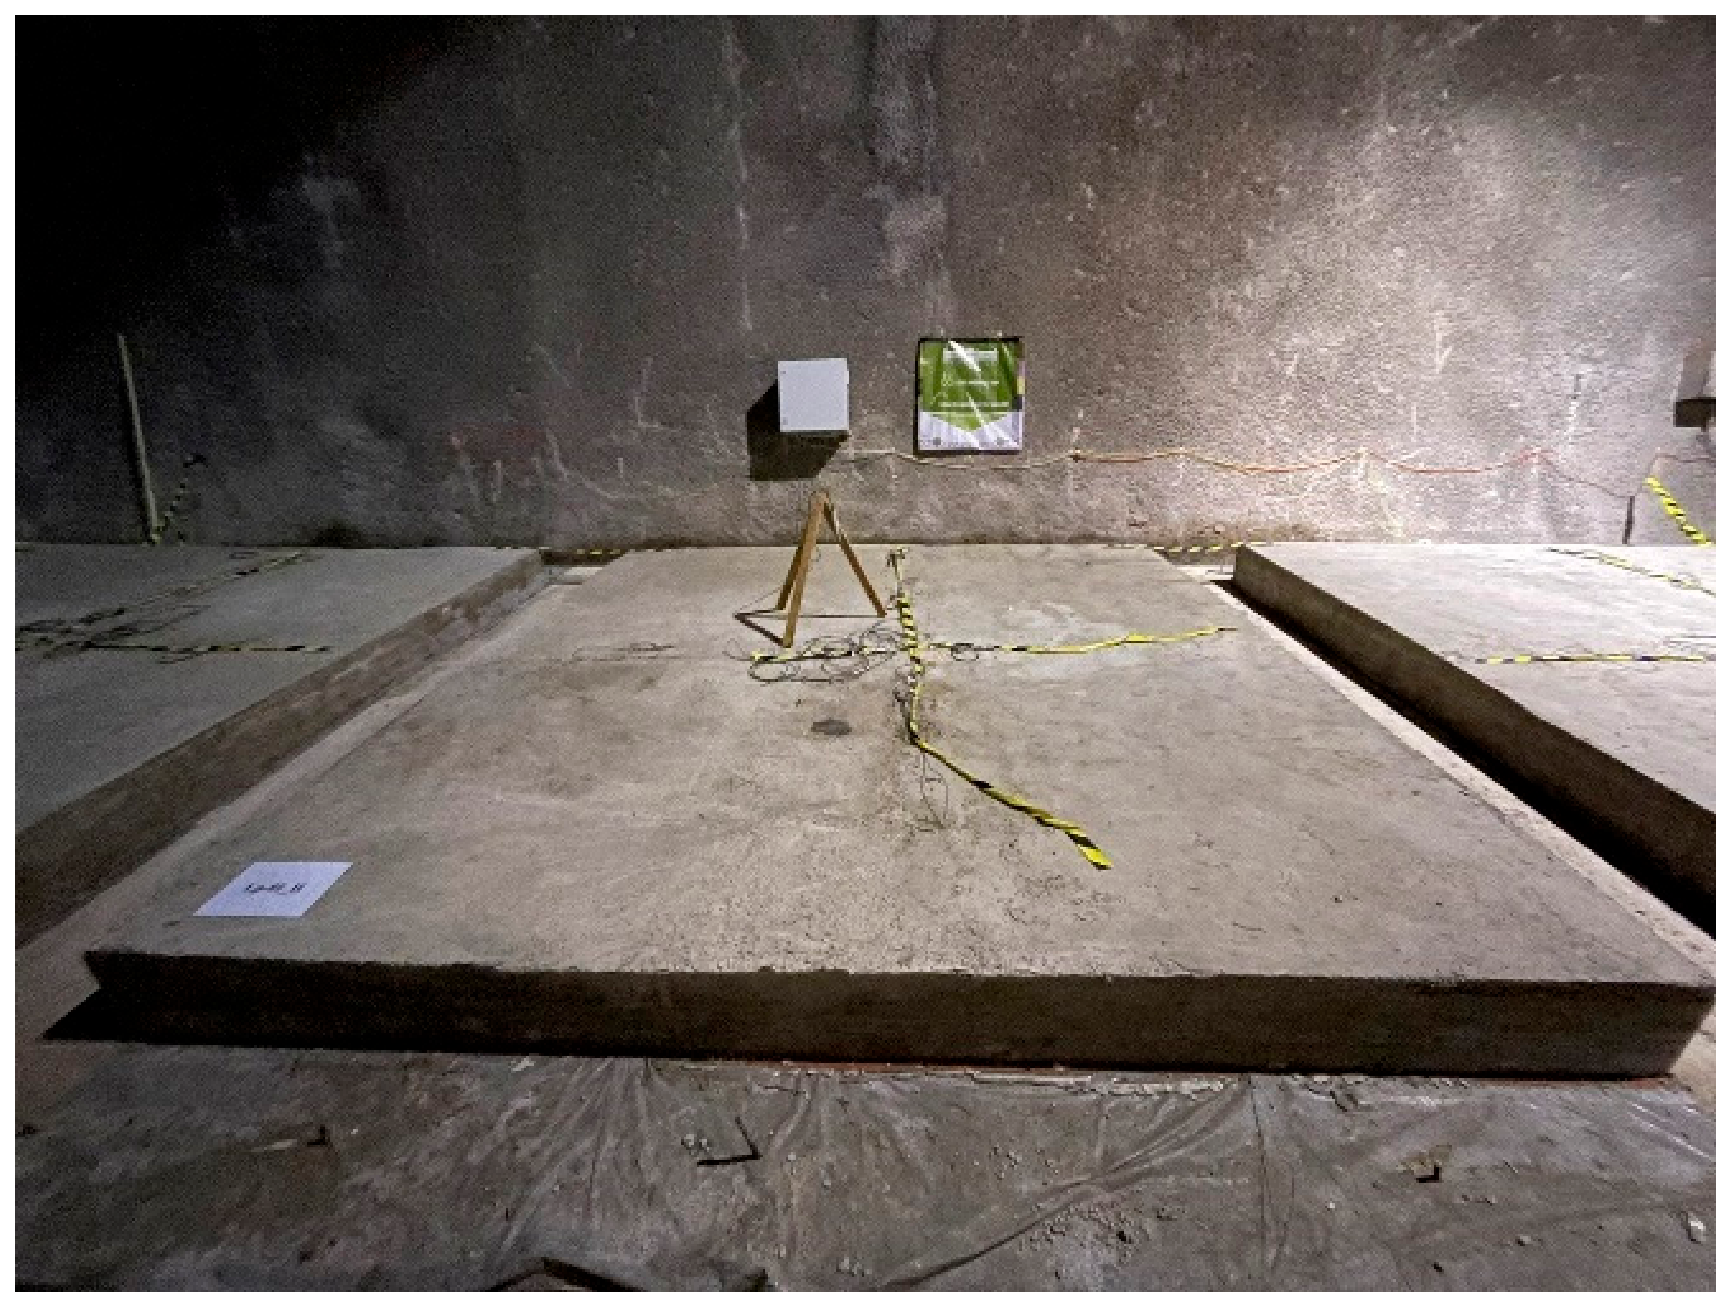
To evaluate the practical implications of the shrinkage measurements on structural behaviour, comprehensive numerical simulations were carried out. The models were developed using the ATENA 3D non-linear finite element software, which is tailored especially for reinforced concrete structures. Three distinct geometric models were created to correspond identically to the large, reinforced test slabs that were cast and monitored on site (Figure 1).
Figure 1.
The three large, reinforced test slabs were cast and monitored on site.
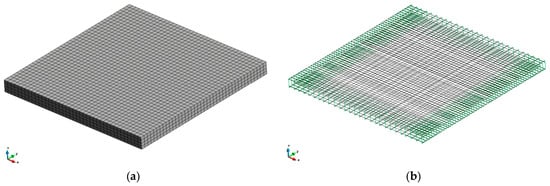
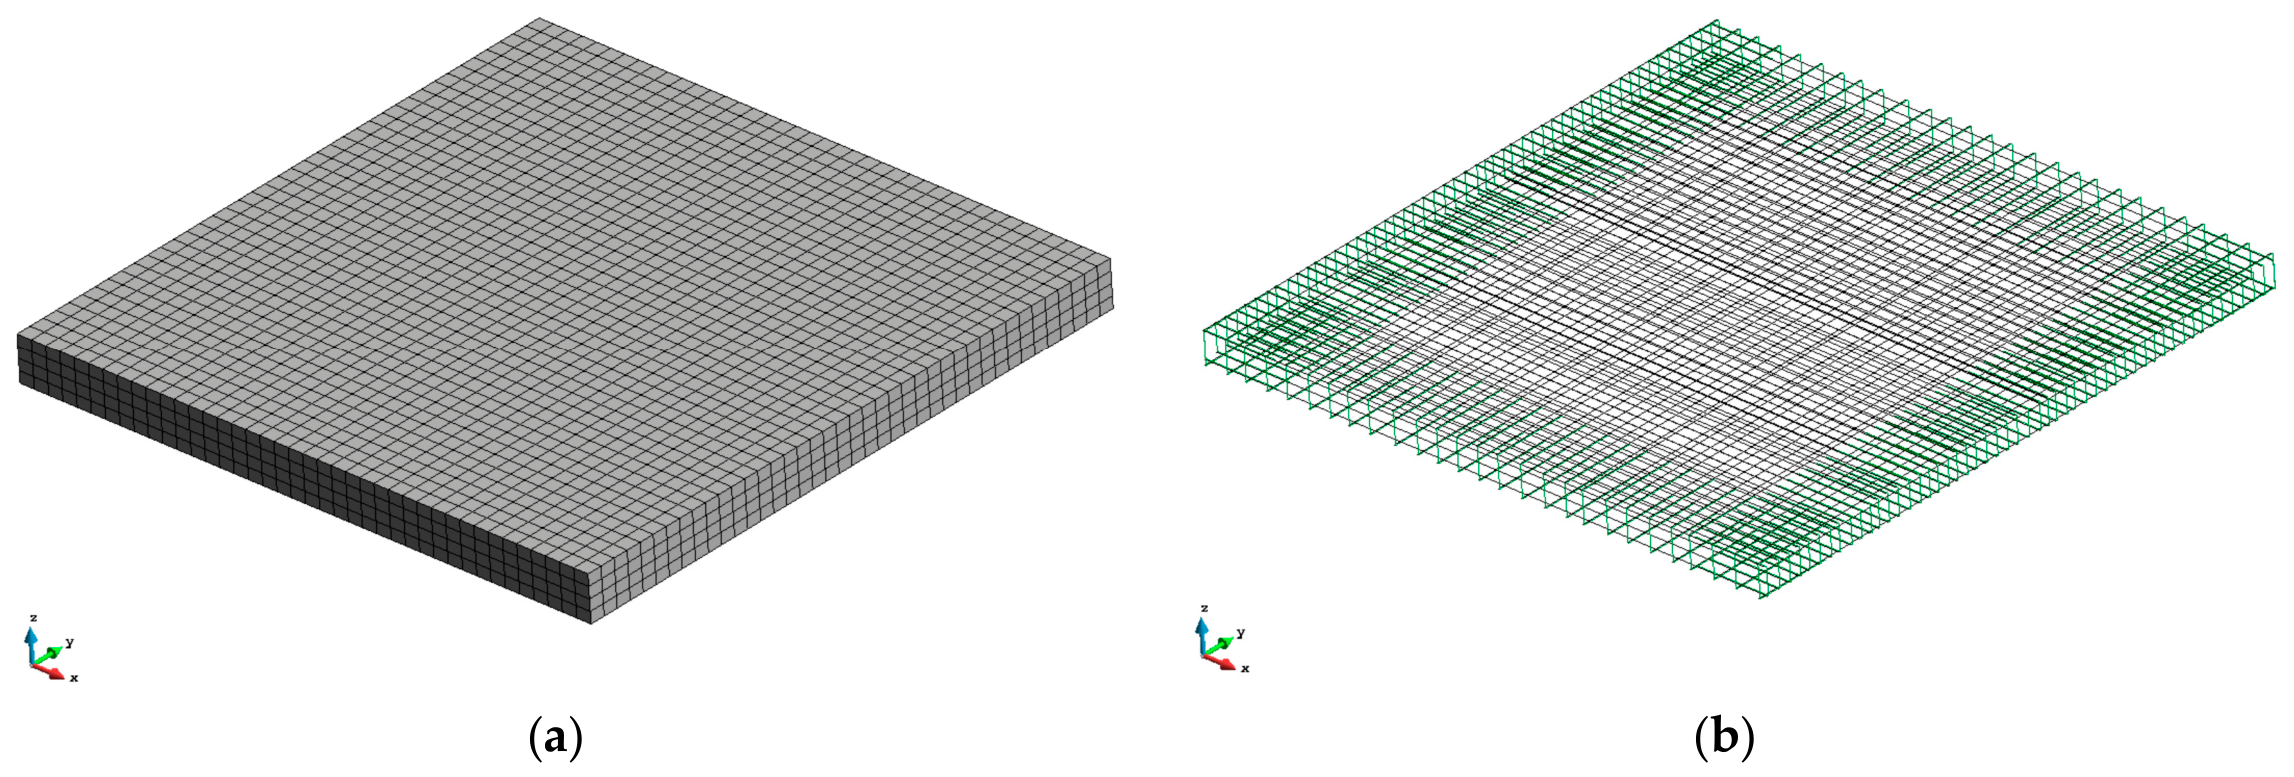
The numerical models utilized 20-node hexahedral (brick) elements with quadratic interpolation functions. To capture accurate stress gradients, an average mesh size of 7.5 cm was enforced, resulting in approximately 6400 elements per slab (Figure 2). Idealized concrete geometries were used, but the reinforcement elements (modelled as discrete 1D bars with bond-slip characteristics) were placed precisely according to on-site positional surveys conducted prior to casting. The boundary conditions included non-linear spring supports to represent the sliding friction and normal support provided by the underlying blind concrete layer separated by a foil sheet.
Figure 2.
The elements of the finite element model: (a) Finite element mesh of the concrete part; (b) finite elements of the reinforcement in the slab.
Material parameters for the concrete were derived directly from the laboratory tests of specimens stored in container “A” (40% RH), as this initial curing environment most closely matched the on-site curing conditions. Because concrete strength is highly time-dependent, the compressive strength, flexural-tensile strength, and elastic modulus were defined by fitting quadratic functions to the discrete laboratory data starting from day 3. Finally, the shrinkage load was applied uniformly as an imposed strain based on the mean values measured by optical sensors inside the unreinforced large block from container “A”. Calculations were performed on mean level.
The finite element model was not utilized to predict the development or magnitude of the concrete shrinkage itself. Instead, the primary objective was to predict the structural response, specifically the internal stresses and deformations within the reinforced concrete elements. To achieve this, the experimentally measured shrinkage was used as a driving input parameter.
5. Discussion
5.1. Comparison of Standard and Measured Shrinkage Displacements
The standard calculations used the constants summarized in Table 5, initially with the planned strength parameters (fcm = 43 MPa, fck = 35 MPa) and 7 days of moist curing [5].
Table 5.
Theoretical ultimate shrinkage values calculated based on Eurocode standard [5].
For container “T” at 100% RH, the standard formulation gives 0.000‰ drying shrinkage because the humidity-dependent term becomes zero; consequently, only autogenous shrinkage is predicted. Table 6 compares the experimental and standard values at 56 days [5].
Table 6.
Comparison of experimental and standard shrinkage values on day 56 [5].
Because the measured compressive strength exceeded the planned value, the standard calculation was also calibrated using the measured 28-day strength of 70.40 MPa. The resulting 56-day values are given in Table 7.
Table 7.
Standard shrinkage values calibrated with the actually measured compressive strength (70.40 MPa) on day 56 [5].
5.2. Results of FEM Simulation
The numerical simulation results were extensively validated against the optical strain measurements recorded by the embedded concrete sensors and reinforcement-mounted sensors within the on-site slabs (Lp-01_I, Lp-01_II, Lp-01_III). The comparison revealed critical insights regarding early-age structural modelling.
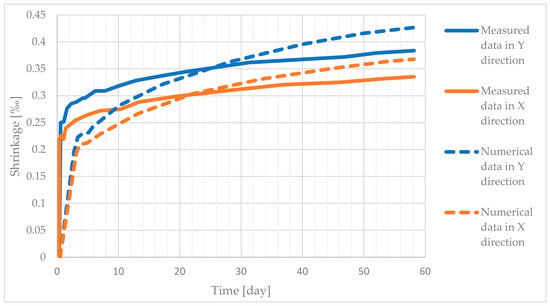
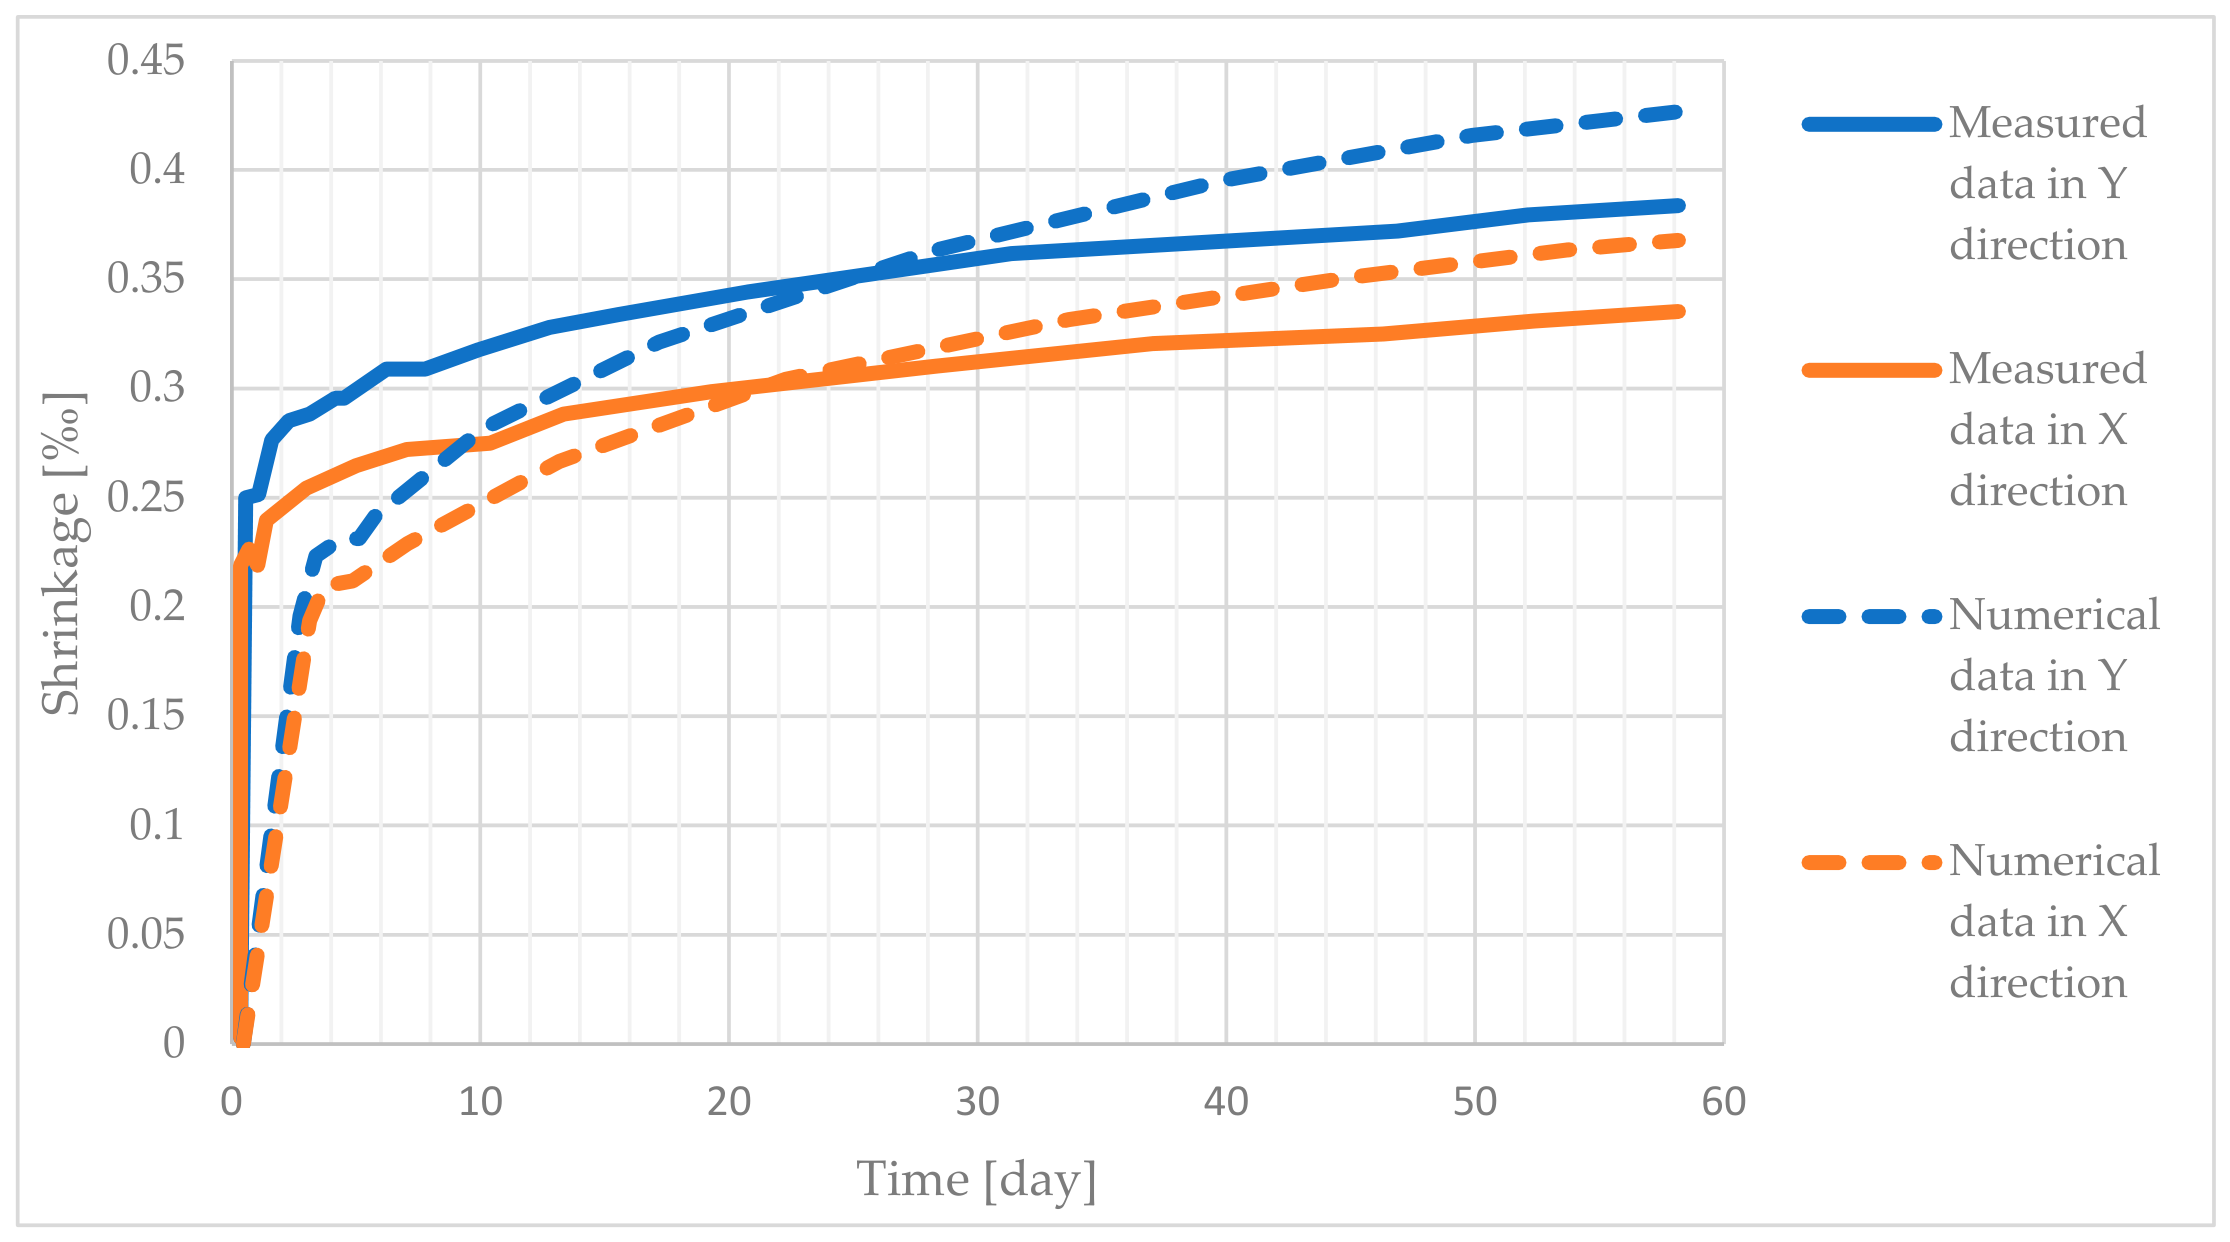
During the initial 0–3 days, the FEM model significantly underestimated the actual internal shrinkage strains measured by the optical sensors. This discrepancy originates from the fundamental limitation that standard concrete material models are not natively calibrated for the plastic state and the very early hydration phase—during which stiffness is negligible—and non-linear creep mechanisms dominate. Because concrete strength data was only available from day 3 onward, the initial phase could not be analytically validated without artificial calibration (Figure 3).
Figure 3.
Comparison of the numerically calculated and measured shrinkage data in the Lp-01_I specimen.
Between days 3 and 7, the numerical model showed a 20–55% underestimation of the strain values, though the modelling accuracy improved rapidly as the concrete matrix solidified. From day 7 up to day 56, the numerical simulation demonstrated high precision, effectively tracking both the internal concrete deformations and the surface strains. By the end of the 56-day period, the relative deviation between the measured reinforcement strains and the modelled reinforcement strains reduced to an impressive 1–10%. The model successfully captured the anisotropic strain behaviour caused by the reinforcement layout (e.g., higher strains in the Y-direction than the X-direction due to asymmetrical rebar meshing), proving that advanced non-linear FEM accurately simulates shrinkage-induced structural stresses once the initial hardening phase is completed (Figure 3).
6. Conclusions
6.1. Comparison Between Standard and Measured Shrinkage
Comparison of the experimental results with the standard model identifies three main shortcomings of the Eurocode shrinkage correlations:
- Early-age shrinkage develops substantially faster than assumed by the Eurocode 2 relationships, with the decisive part of the deformation occurring during the first two weeks.
- At high or saturated humidity (100% RH), the standard model predicts 0.048‰ shrinkage compared with measured values of 0.214–0.262‰. By neglecting drying shrinkage at 100% RH, the standard model substantially underestimates the total shrinkage.
- At 40% RH, the calibrated standard value of 0.443‰ approaches the measured strain-gauge value of 0.389‰ at day 56, but the development over time differs. Much of the shrinkage occurs during the first 10–14 days, whereas the standard model predicts a later, more gradual increase.
- Numerical simulations (ATENA 3D) accurately predict the shrinkage-induced deformations and reinforcement strains after the initial curing period (post 5–7 days), yielding errors well within acceptable engineering margins (1–10%).
- Standard calculation models struggle to simulate the initial 0–3 days of deformation without specific calibration, highlighting a gap in standard finite element approaches regarding plastic and very early-age concrete states.
- From a measurement perspective, surface-bonded resistance strain gauges and inductive displacement sensors were unreliable under high humidity. Embedded fibre optic sensors and mechanical extensometers provided the most suitable measurements for tracking early and internal shrinkage.
6.2. Conclusions of the FEM Simulation
The non-linear 3D finite element modelling carried out in ATENA 3D provided valuable insights into the numerical predictability of early-age shrinkage-induced deformations and internal restraint stresses in reinforced mass concrete slabs:
- Accuracy in the hardened state (Days 7–56): The numerical model showed excellent agreement with on-site optical sensor data. From day 7 onward, the deviations in concrete and reinforcement strains steadily decreased, reaching a 1–10% margin by day 56.
- Limitations at early age (days 0–3): The model significantly underestimated internal shrinkage during the first three days. Standard continuum and bond-slip models do not capture the plastic/early hydration phase, during which experimental strength parameters were also unavailable.
- Structural behaviour and restraint: The discrete reinforcement model effectively reproduced localized stress concentrations at bar laps and captured the directional strain anisotropy caused by asymmetric reinforcement layouts.
- Design applicability: Once initial hardening occurs (after ~5 days), non-linear FEM serves as a reliable tool for crack risk assessment and structural design under restrained shrinkage conditions.
6.3. Conclusions of the Experiments
While the present study provides valuable insights into early-age concrete shrinkage and its numerical modelling, the conclusions should be slightly qualified by the scope of the research. It must be noted that the findings are based on a single specific concrete mixture (incorporating CEM III/A 32.5 N LH/SR cement and metakaolin) and a limited range of environmental conditions (constant temperature of ∼16 °C with 40% and 100% RH). Consequently, the specific shrinkage magnitudes and early-age deviations from the standard models may vary for different concrete compositions or fluctuating environmental factors. Further experimental investigations involving diverse concrete mixes are recommended to generalize these results.
Author Contributions
Writing—Original Draft, T.S.F. and S.F.I.; Data Curation, T.S.F. and S.F.I.; Formal Analysis, S.F.I.; Writing—Review and Editing, I.H., Z.R. and K.K.; Supervision, I.H., Z.R. and K.K.; Resources, I.H., Z.R. and K.K.; Investigation, I.H. and Z.R.; Project Administration, Z.R.; Funding Acquisition, I.H.; Conceptualization, I.H., Z.R. and K.K.; Software, I.H. and Z.R.; Validation, I.H. and Z.R. All authors have read and agreed to the published version of the manuscript.
Funding
This research received no external funding.
Institutional Review Board Statement
Not applicable.
Informed Consent Statement
Not applicable.
Data Availability Statement
The data that has been used is confidential.
Acknowledgments
Administrative support was provided by Public Limited Company for Radioactive Waste Management. During the preparation of this work the authors used DeepL (https://www.deepl.com/) in order to improve the English translation and grammar of the article. After using this tool/service, the authors reviewed and edited the content as needed and takes full responsibility for the content of the publication.
Conflicts of Interest
The authors declare no conflicts of interest.
Abbreviations
The following abbreviations are used in this manuscript:
| RH | Relative humidity |
| UPS | Uninterruptible Power Supply |
| SD | Standard deviation |
| CV | Coefficient of variation |
References
- Bažant, Z.P.; Baweja, L. Creep and shrinkage prediction model for analysis and design of concrete structures. Mater. Struct. 1995, 28, 357–365. [Google Scholar] [CrossRef] [Scilit]
- Baroghel-Bouny, V. Water vapour sorption experiments on hardened cementitious materials. Cem. Concr. Res. 2007, 37, 414–437. [Google Scholar] [CrossRef] [Scilit]
- Lura, P.; van Breugel, K.; Maruyama, I. Effect of curing temperature and type of cement on early-age shrinkage. Cem. Concr. Res. 2001, 31, 1867–1872. [Google Scholar] [CrossRef] [Scilit]
- Pickett, G. Effect of aggregate on shrinkage of concrete. J. Am. Concr. Inst. 1956, 52, 581–590. [Google Scholar] [CrossRef] [Scilit] [PubMed]
- Iván, S.F.; Farkas, T.S.; Roszevák, Z.; Koris, K.; Haris, I. Early-age concrete shrinkage under controlled conditions. Case Stud. Constr. Mater. 2026, 25, e06363. [Google Scholar] [CrossRef] [Scilit]
- Acker, P.; Bažant, Z.P. Microprestress-solidification theory for concrete creep. J. Eng. Mech. 2001, 127, 671–680. [Google Scholar]
- Springenschmid, R. Prevention of Thermal Cracking in Concrete at Early Ages; E & FN Spon: London, UK, 1998. [Google Scholar]
- Maruyama, I.; Lura, P. Properties of early-age concrete relevant to cracking in massive concrete. Cem. Concr. Res. 2019, 123, 105770. [Google Scholar] [CrossRef] [Scilit]
- Bentur, A.; Mindess, S. Fibre Reinforced Cementitious Composites; CRC Press: London, UK, 2006. [Google Scholar]
- Jensen, O.M.; Hansen, P.F. Autogenous deformation and change of the relative humidity in silica fume-modified cement paste. Cem. Concr. Res. 1996, 26, 1001–1007. [Google Scholar]
- Neville, A.M. The confused world of shrinkage and creep. Mater. Struct. 2004, 37, 763–774. [Google Scholar]
- Weiss, W.; Kovler, K. Internal curing to reduce plastic shrinkage cracking. Acids Mater. J. 2004, 101, 21–31. [Google Scholar]
- Frosch, R.J. Another look at cracking and crack control in reinforced concrete. Acids Struct. J. 1999, 96, 437–442. [Google Scholar] [CrossRef] [Scilit] [PubMed]
- Lura, P.; Jensen, O.M.; van Breugel, K. Autogenous shrinkage in high-performance cement paste. Cem. Concr. Res. 2003, 33, 223–232. [Google Scholar] [CrossRef] [Scilit]
- Justnes, H. Mechanisms of autogenous shrinkage. Cem. Concr. Compos. 2004, 26, 723–731. [Google Scholar] [CrossRef] [Scilit]
- Gowripalan, N. Autogenous shrinkage of concrete at early ages. In Proceedings of the 25th Australasian Conference on Mechanics of Structures and Materials; Springer: Singapore, 2020; Volume 37, pp. 269–276. [Google Scholar]
- Meddah, M.S.; Tagnit-Hamou, A. Evaluation of Rate of Deformation for Early-Age Concrete Shrinkage Analysis and Time Zero Determination. J. Mater. Civ. Eng. 2011, 23, 1076–1086. [Google Scholar] [CrossRef] [Scilit]
- Kovler, K.; Zhutovsky, G. Overview and future trends of shrinkage research. Mater. Struct. 2006, 39, 827–847. [Google Scholar] [CrossRef] [Scilit]
- He, Z.-H.; Zhu, H.-N.; Zhang, M.-Y.; Shi, J.-Y.; Du, S.-G.; Liu, B. Autogenous shrinkage and nano-mechanical properties of UHPC containing waste brick powder derived from construction and demolition waste. Constr. Build. Mater. 2021, 306, 124869. [Google Scholar] [CrossRef] [Scilit]

Disclaimer/Publisher’s Note: The statements, opinions and data contained in all publications are solely those of the individual author(s) and contributor(s) and not of MDPI and/or the editor(s). MDPI and/or the editor(s) disclaim responsibility for any injury to people or property resulting from any ideas, methods, instructions or products referred to in the content. |
© 2026 by the authors. Licensee MDPI, Basel, Switzerland. This article is an open access article distributed under the terms and conditions of the Creative Commons Attribution (CC BY) license.