


Abstract
A considerable proportion of the existing reinforced concrete buildings were designed according to older seismic provisions and are characterised by insufficient transverse reinforcement, inadequate confinement, and limited deformation capacity. The reliable assessment of such structures requires numerical models capable of representing both flexural and shear-controlled degradation mechanisms. This paper investigates the influence of nonlinear shear modelling on the pushover response of an existing reinforced concrete wall building. A dual-layer shell modelling approach is proposed in which the flexural response is represented by a refined layer of fibre-shell elements, while the shear response is modelled independently using a separate shell layer with a degrading nonlinear shear material. The corresponding nodes of the two layers are connected by massless rigid beams to ensure deformation compatibility. The approach was implemented in PERFORM-3D, and nonlinear static analyses were performed in the X and Y directions using lateral load patterns based on the corresponding first-mode shapes. Models with linear elastic and nonlinear shear behaviour were compared. In the Y direction, the models produced similar global capacity curves, although the predicted locations of the concrete crushing differed. In the X direction, nonlinear shear modelling changed the governing degradation mechanism and the location of critical damage, while the pronounced reduction in lateral resistance occurred at a drift ratio of approximately 1.6%, compared with 1.1% in the linear elastic shear model.
1. Introduction
The housing stock in the Republic of Croatia, particularly in its urban centres, is largely characterised by the intensive residential construction that took place during the second half of the 20th century [1,2]. Driven by rapid post-war rehabilitation between the 1960s and late 1980s, these buildings were designed and executed in accordance with the technical regulations and structural codes of that era, such as the landmark 1964 [3] and 1981 Yugoslav seismic codes [4]. While these regulations represented significant milestones in introducing seismic design forces after catastrophic regional earthquakes, they lack the modern, controlled energy dissipation of the earthquake-resistant design that formed the backbone of modern standards like Eurocode 8 [5].
The inherent seismic vulnerability of the existing reinforced concrete (RC) buildings from this period results from a predictable series of structural deficiencies [6]. These structures often feature remarkably low longitudinal and transverse reinforcement ratios and may contain smooth reinforcing bars with limited bond capacity. Critical regions of cross-sections, such as column or wall bases and beam–column joints, typically lack proper confinement due to widely spaced and poorly detailed stirrups. Anchorage and lap-splice detailing may also be inadequate, with insufficient development lengths and lap splices frequently concentrated at the same cross-section, increasing the risk of premature bond-slip failure. Furthermore, the detailing practices of the time did not account for capacity design principles, and longitudinal reinforcement bars are frequently unrestrained against buckling. A particularly critical issue is the systemic lack of adequate shear reinforcement in structural walls and columns. Under cyclic seismic loading, these deficiencies drastically limit the displacement capacity of the members and may induce brittle failure mechanisms well before the structure can develop stable hysteretic behaviour and dissipate energy through ductile mechanisms.
When evaluating such substandard structures, traditional linear elastic analysis methods—which are still widely utilised in standard engineering practice due to their simplicity—prove highly inadequate. Linear models rely on global force reduction factors i.e., behaviour factors, to approximate nonlinear behaviour. This assumption severely misrepresents the actual physical response of a structure characterised by low ductility and mixed failure modes. Linear elastic tools can be blind to local, brittle failure mechanisms that can trigger progressive collapse before global yielding is ever reached. Consequently, they tend to either output unrealistically high, economically unfeasible strengthening demands or, worse, completely overlook critical local vulnerabilities, leading to flawed mitigation strategies.
To overcome these limitations, the application of nonlinear numerical models is essential for an accurate and realistic assessment of structural performance. Nonlinear static or nonlinear dynamic analyses allow engineers to explicitly simulate the progressive damage within a structure by accounting for material nonlinearity, geometric effects, i.e., P-D, and the complex interactions of stiffness and strength degradation under cyclic loading.
This paper presents an advanced analytical framework utilising nonlinear models calibrated to capture the distinct behaviour of substandard RC elements. By accurately tracing the force–displacement capacity curves and identifying the exact sequence of plastic hinge formation and critical failure mechanisms, this framework provides a foundation for the selection and optimisation of seismic strengthening strategies. The subsequent sections outline the formulation of the nonlinear model using PERFORM 3D v10 [7] software.
2. Modelling of Flexural Behaviour
2.1. Shear Walls
Shear walls are often the main lateral force-resisting elements in buildings due to their dimensions and the relatively large amount of longitudinal reinforcement. In the case of flexure-controlled ductile behaviour, most of the energy is dissipated in the plastic hinges of the walls. Therefore, it is of great importance to utilise an appropriate approach to model wall behaviour.
2.1.1. Fibre Modelling Approach
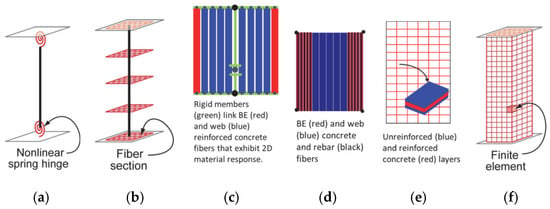
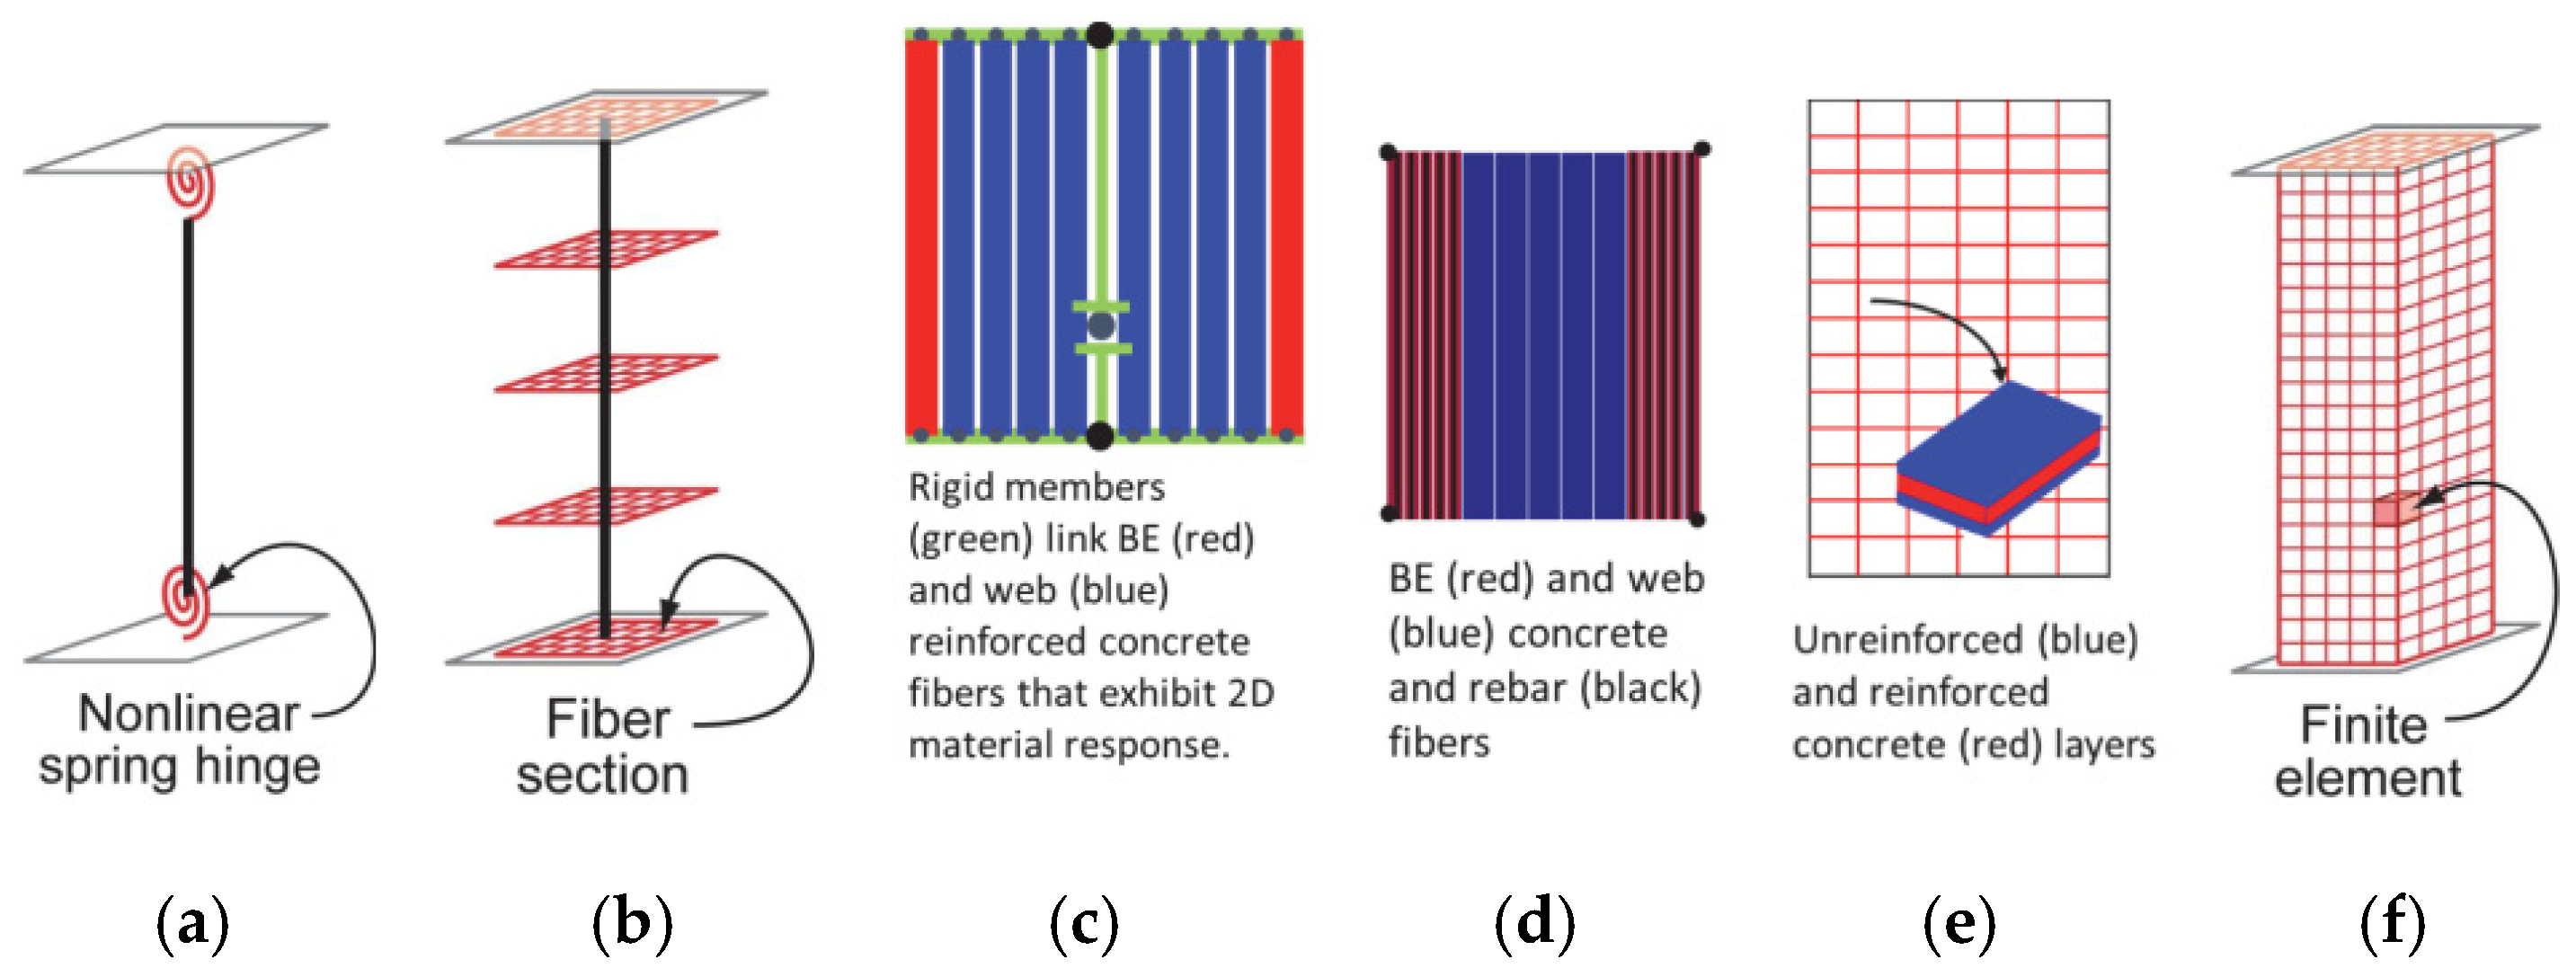
The nonlinear behaviour of flexure-controlled shear walls can be modelled using multiple approaches, as shown in Figure 1. The simplest approaches consist of beam-type elements with lumped plasticity hinges representing the nonlinear behaviour concentrated in plastic hinge regions. The most complex models employ three-dimensional nonlinear continuum elements (e.g., Abaqus, ATENA). Such highly complex models are generally more suitable for capturing the local behaviour of structural details rather than the behaviour of entire building systems due to their high computational cost and long analysis time. Therefore, in selecting an appropriate modelling approach, there is always a trade-off between the desired level of accuracy, the ability to capture various phenomena, and computational cost [8].
Figure 1.
Various NL models for simulating nonlinear response of concrete walls: (a) lumped plasticity approach, (b) fibre-type beam element, (c) beam–column element with flexure–shear interaction, (d) fibre-shell element, (e) layered-shell element, (f) 3D continuum elements, reprinted from [8].
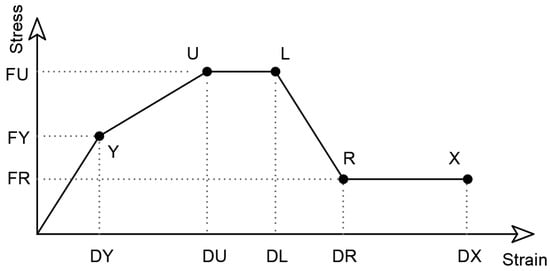
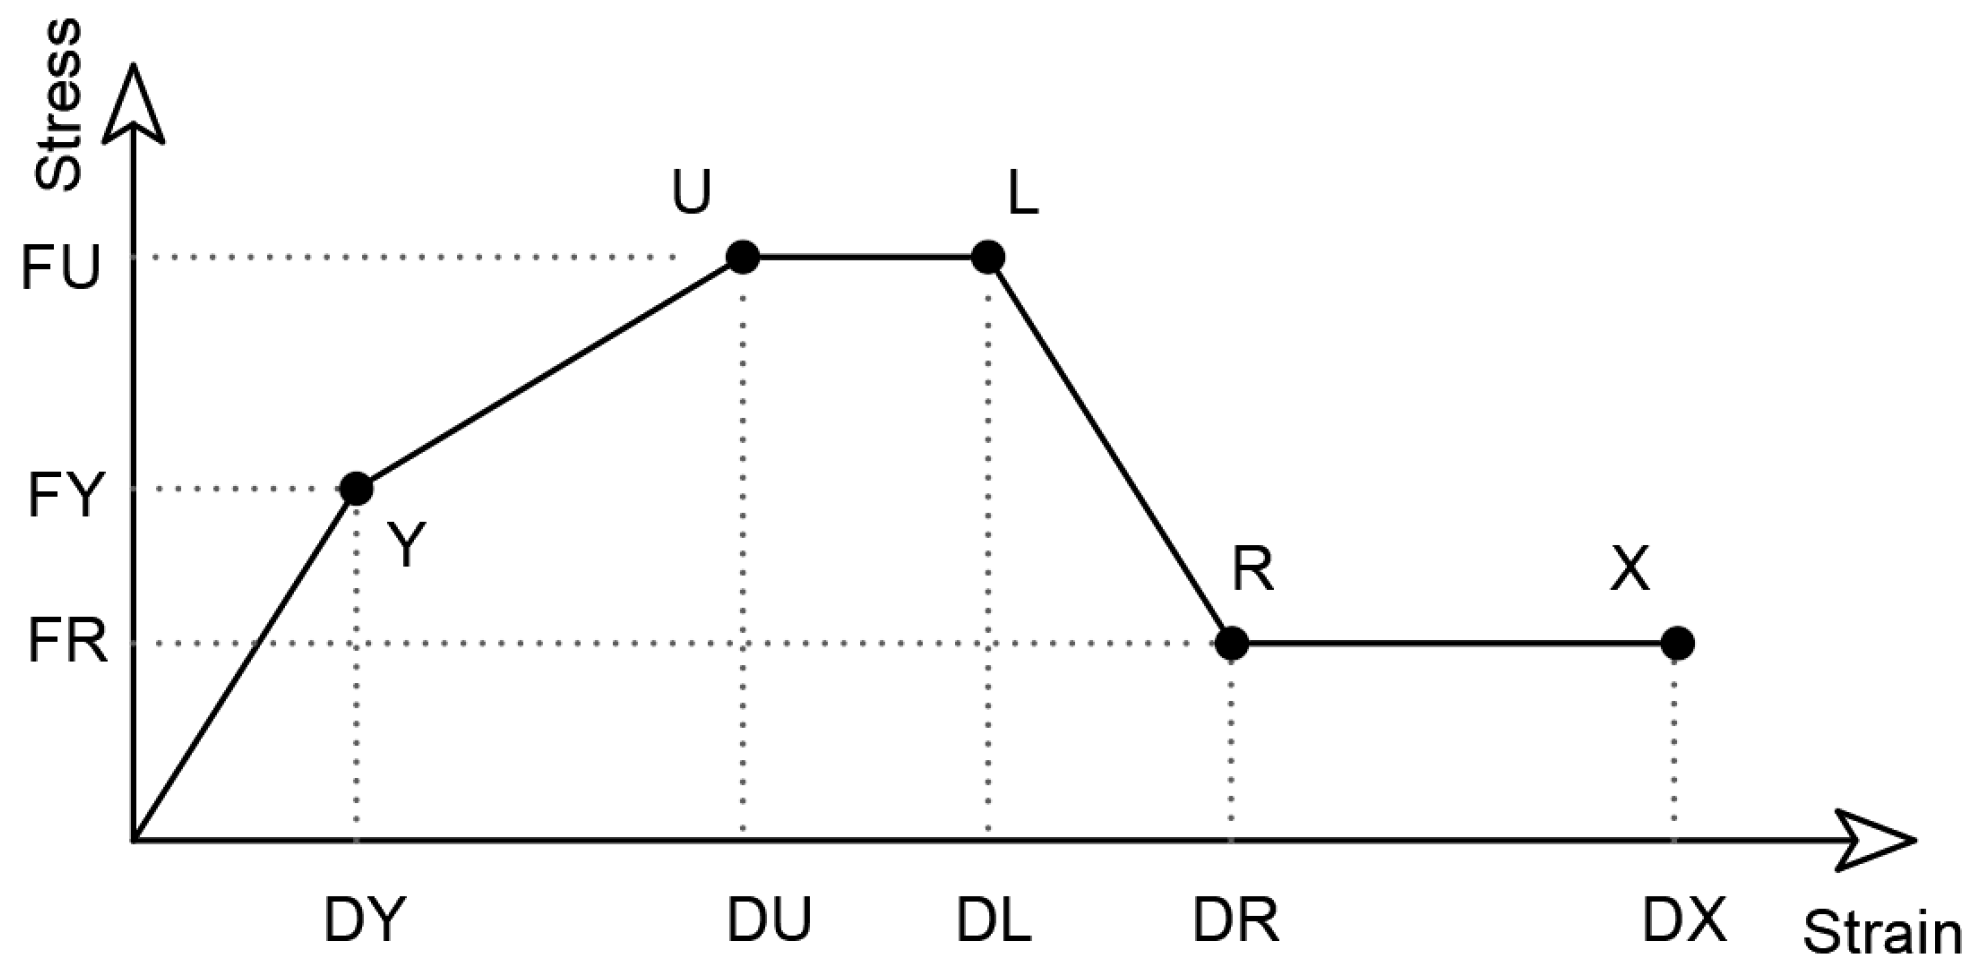
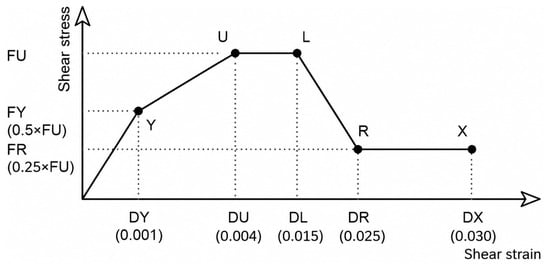
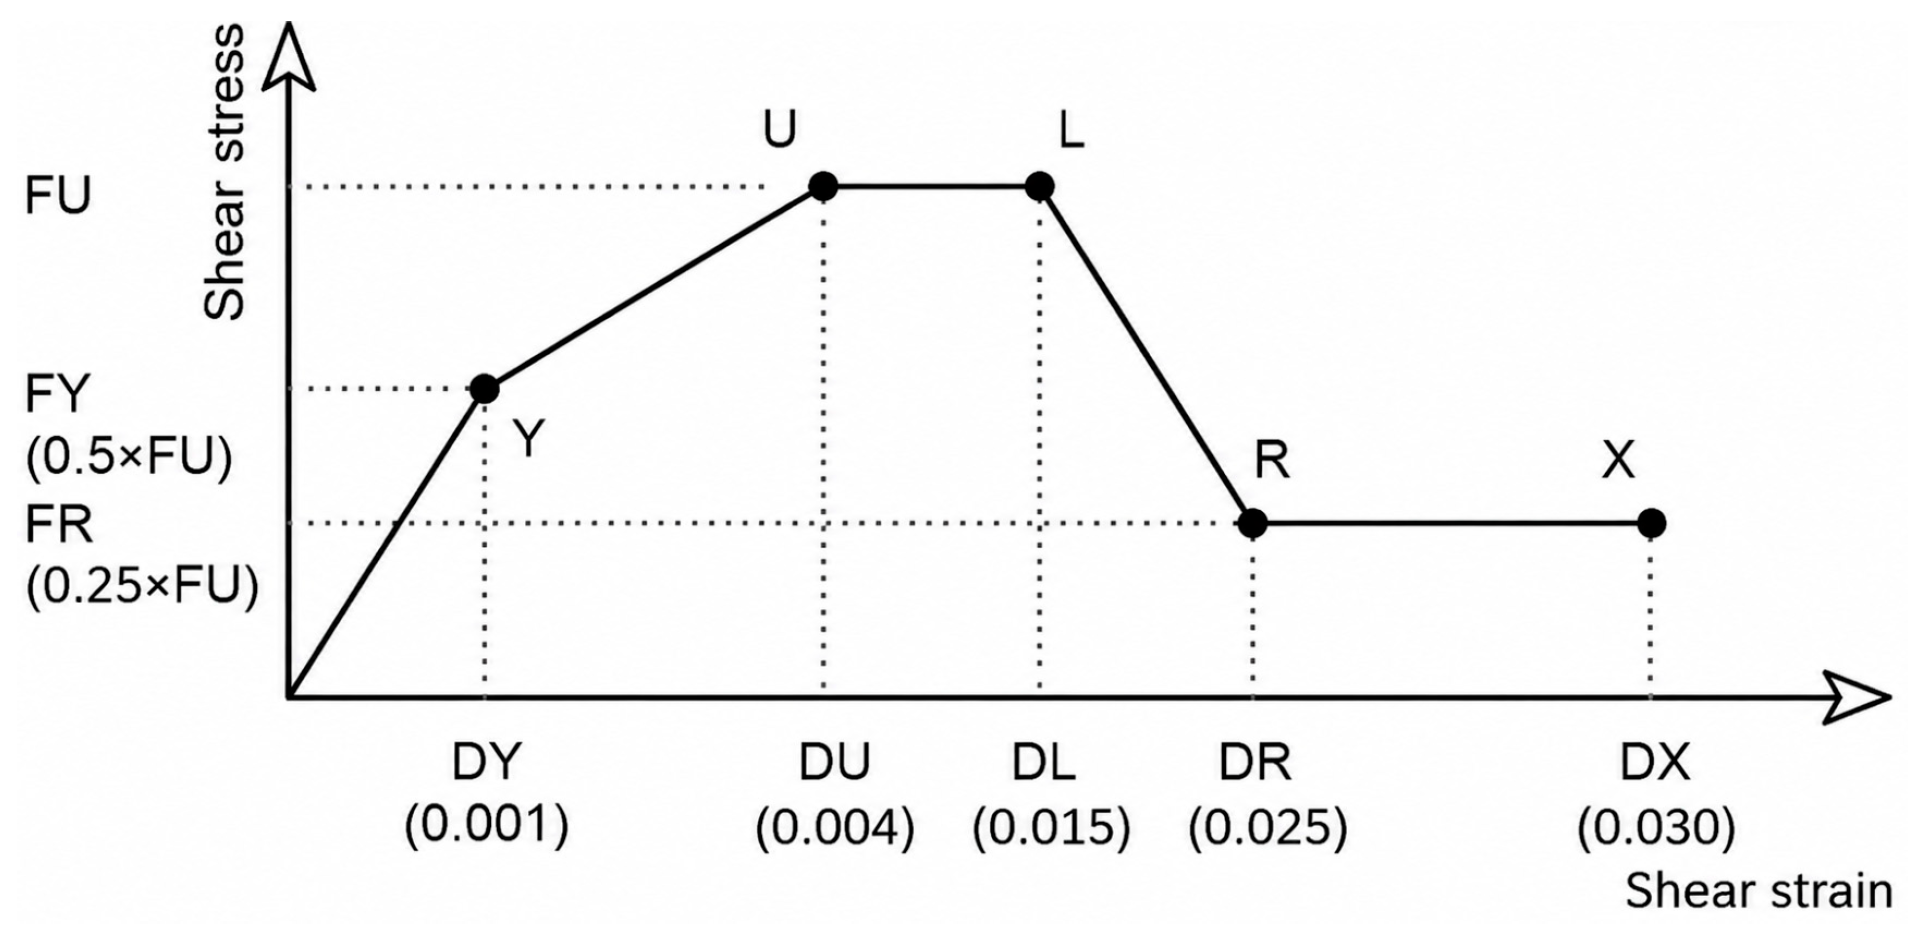
In this study, the authors utilised fibre-shell elements to capture the flexural behaviour of shear walls using the Shear Wall Element in PERFORM-3D [7], as an optimal balance between computational cost and modelling capabilities. The general material stress–strain curve used for all material models is shown in Figure 2. The material response is represented by a piecewise linear relationship: the initial elastic response extends to the yield point Y, followed by strain hardening up to the peak strength FU and a plateau between points U and L. Beyond point L, the strength degrades to the residual value FR at point R, which is then maintained up to the ultimate strain at point X.
Figure 2.
General material stress–strain curve.
2.1.2. Regularisation of Concrete Material Model
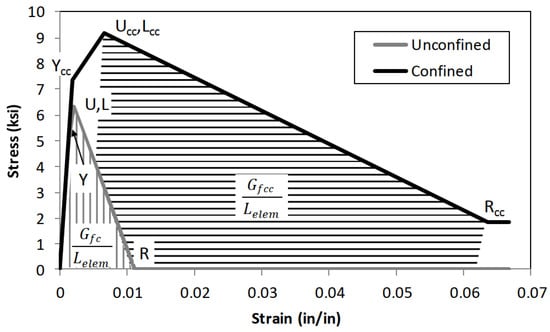
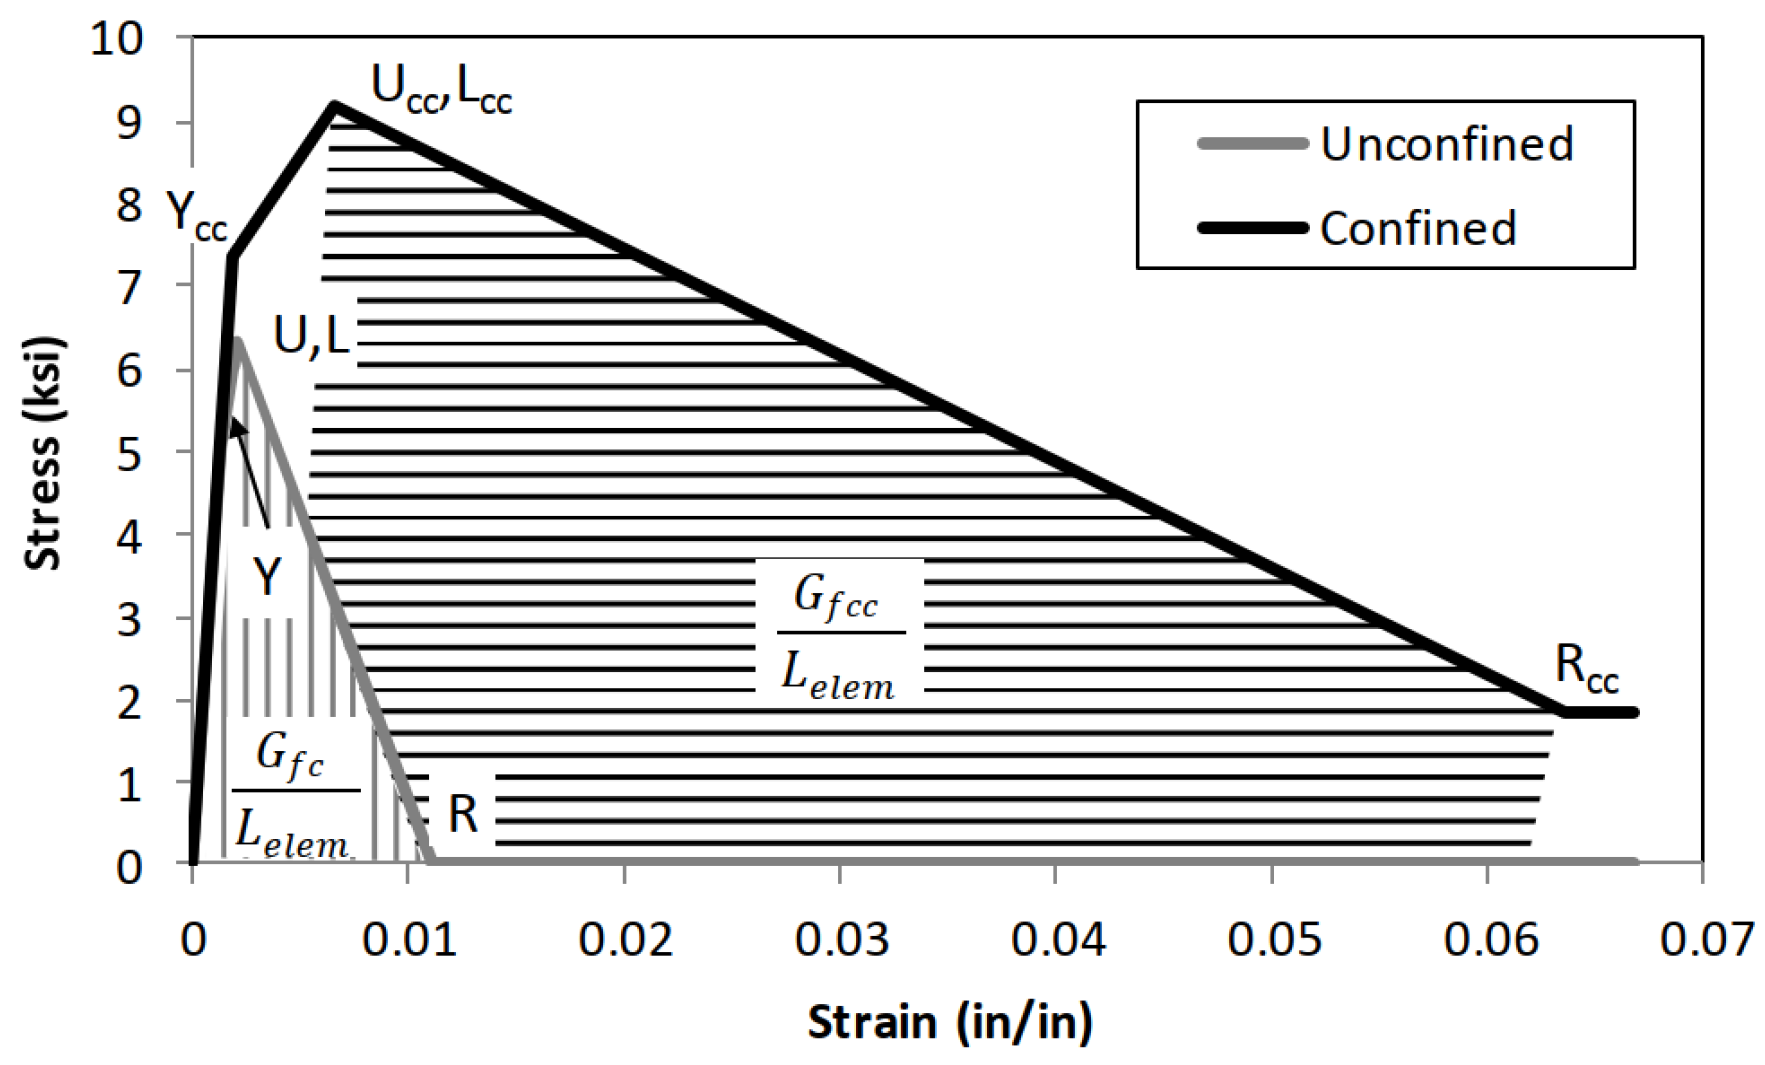
Strain localisation is a well-known issue in nonlinear finite element analysis, particularly when materials are modelled using constitutive laws with a descending branch in the stress–strain relationship. This phenomenon is also present in PERFORM-3D elements and must be properly addressed to ensure reliable numerical results. One common approach is to define the mesh size in accordance with the expected or known plastic hinge length, which is frequently adopted in the design of new structures, where the plastic hinge length is often assumed as the storey height or a certain percentage of the wall length. In this study, the second approach was adopted, in which the stress–strain relationship was regularised by considering both the finite element length and the compressive fracture energy of concrete [9]. As illustrated in Figure 3, the descending post-peak branch was adjusted so that the energy dissipated per unit volume corresponded to the compressive fracture energy divided by the characteristic element length, Gfc/Lelem for unconfined concrete and Gfcc/Lelem for confined concrete. Consequently, the ultimate compressive strain was dependent on the element size: larger elements corresponded to lower ultimate strains, whereas smaller elements allowed larger ultimate strains. This procedure preserves the intended energy dissipation, reduces mesh sensitivity, and improves numerical stability.
Figure 3.
Regularised concrete stress–strain diagram, reprinted from [9].
2.1.3. Reinforcement Buckling Effect
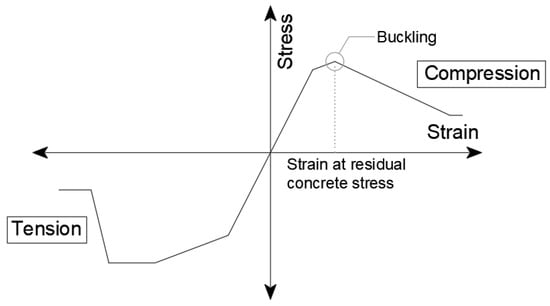
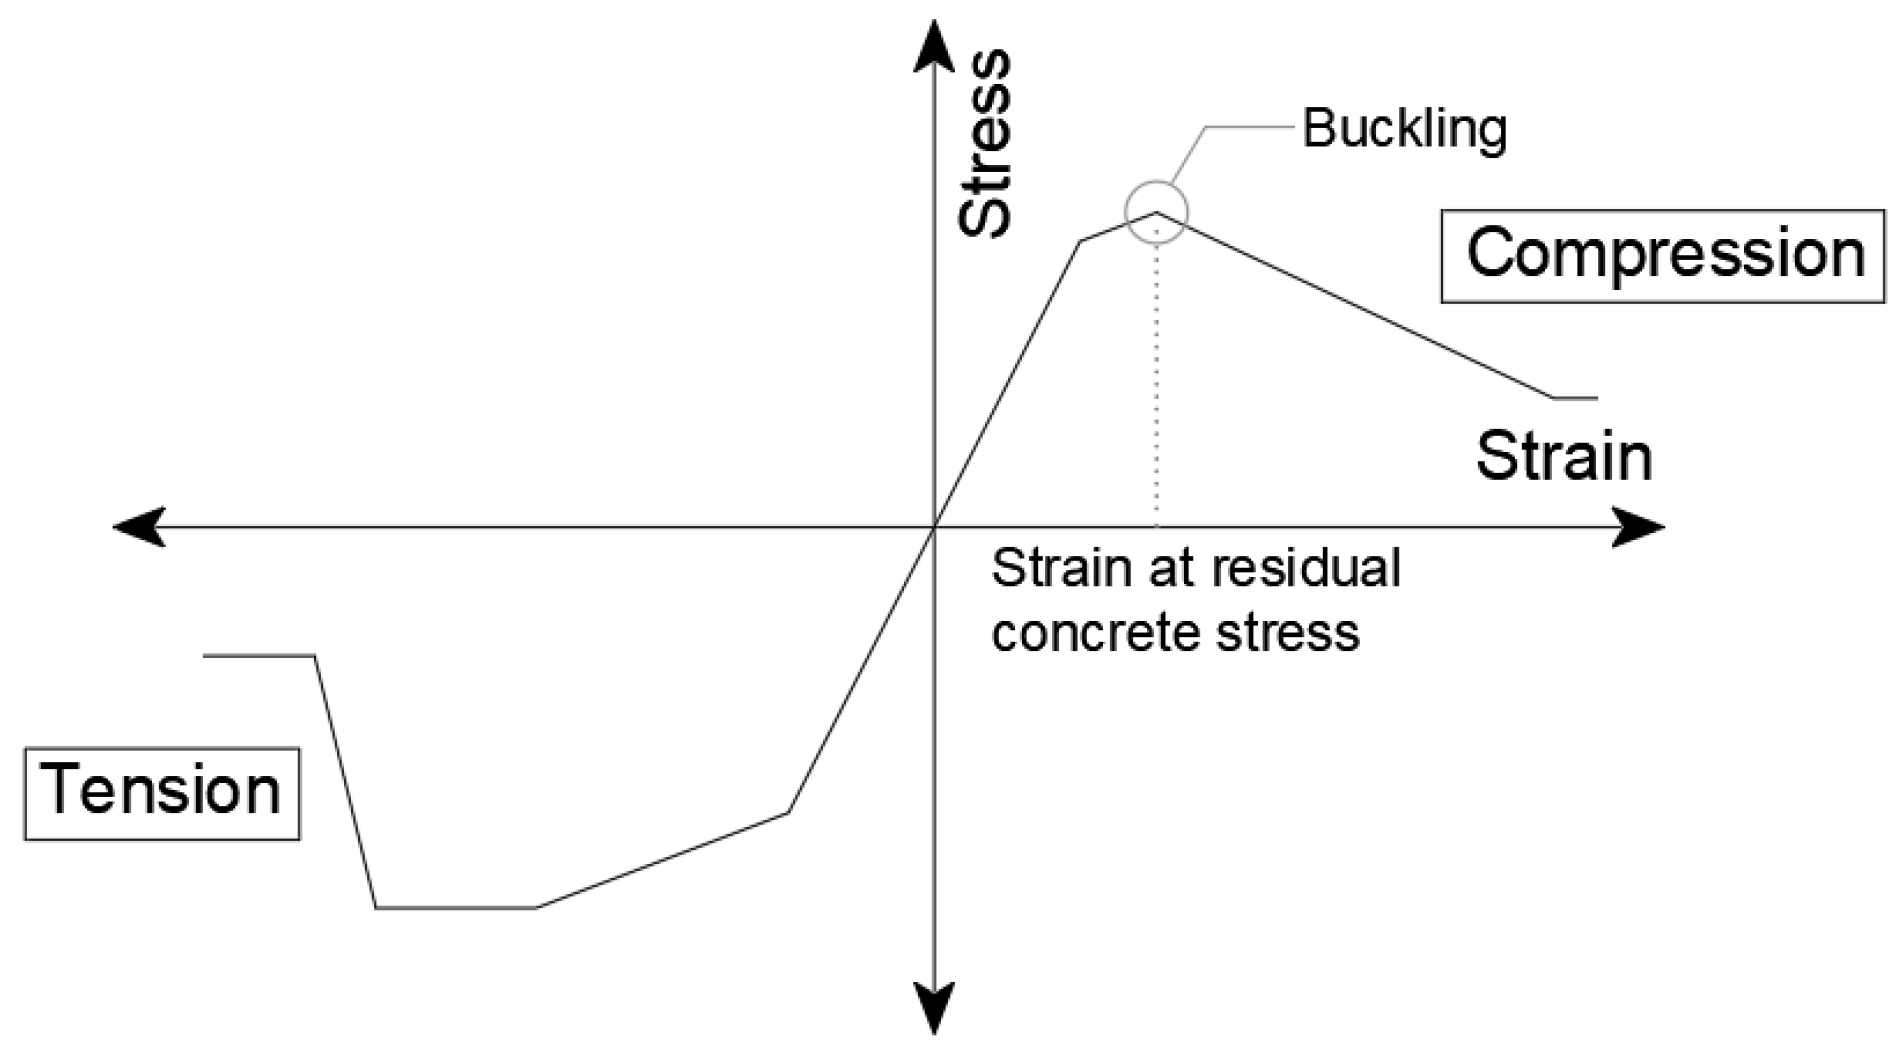
Rebar buckling was modelled by reducing steel compression stress to the residual value after strain at the residual value of concrete stress [10], from which we simulated the disappearance of the lateral restraint of the reinforcing bars after the crushing of concrete, Figure 4.
Figure 4.
Effect of buckling on steel material model, reprinted from [10].
2.1.4. Monitoring of Wall Flexural Behaviour
Limit states were defined according to EN 1998-3 [11] as rotation of wall base, where steel inelastic strains are expected. Wall rotations were monitored using four node rotation gauges.
2.2. Beams and Columns
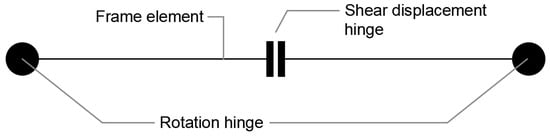
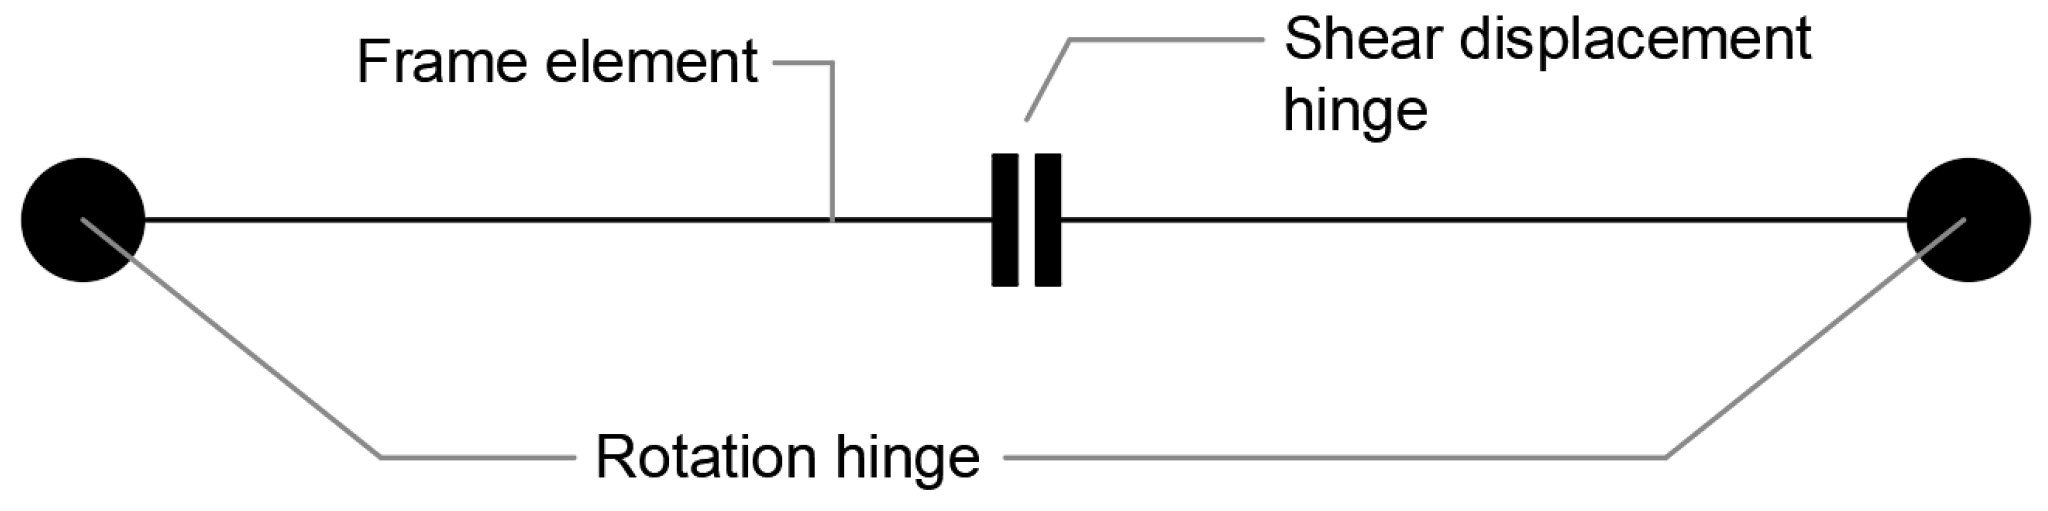
Nonlinear behaviour of beams and columns was modelled using Frame Elements [7]. Beam and column compound consisted of lumped rotation hinges, shear-displacement hinge and frame elements in between, as shown in Figure 5. Framing was achieved by using embedded elements according to [12].
Figure 5.
Frame/column compound.
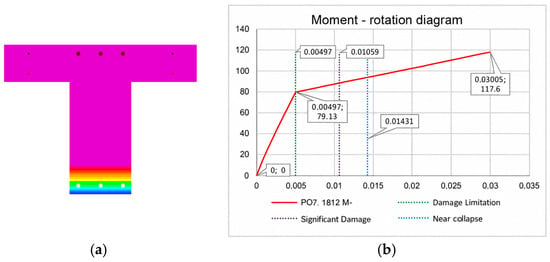
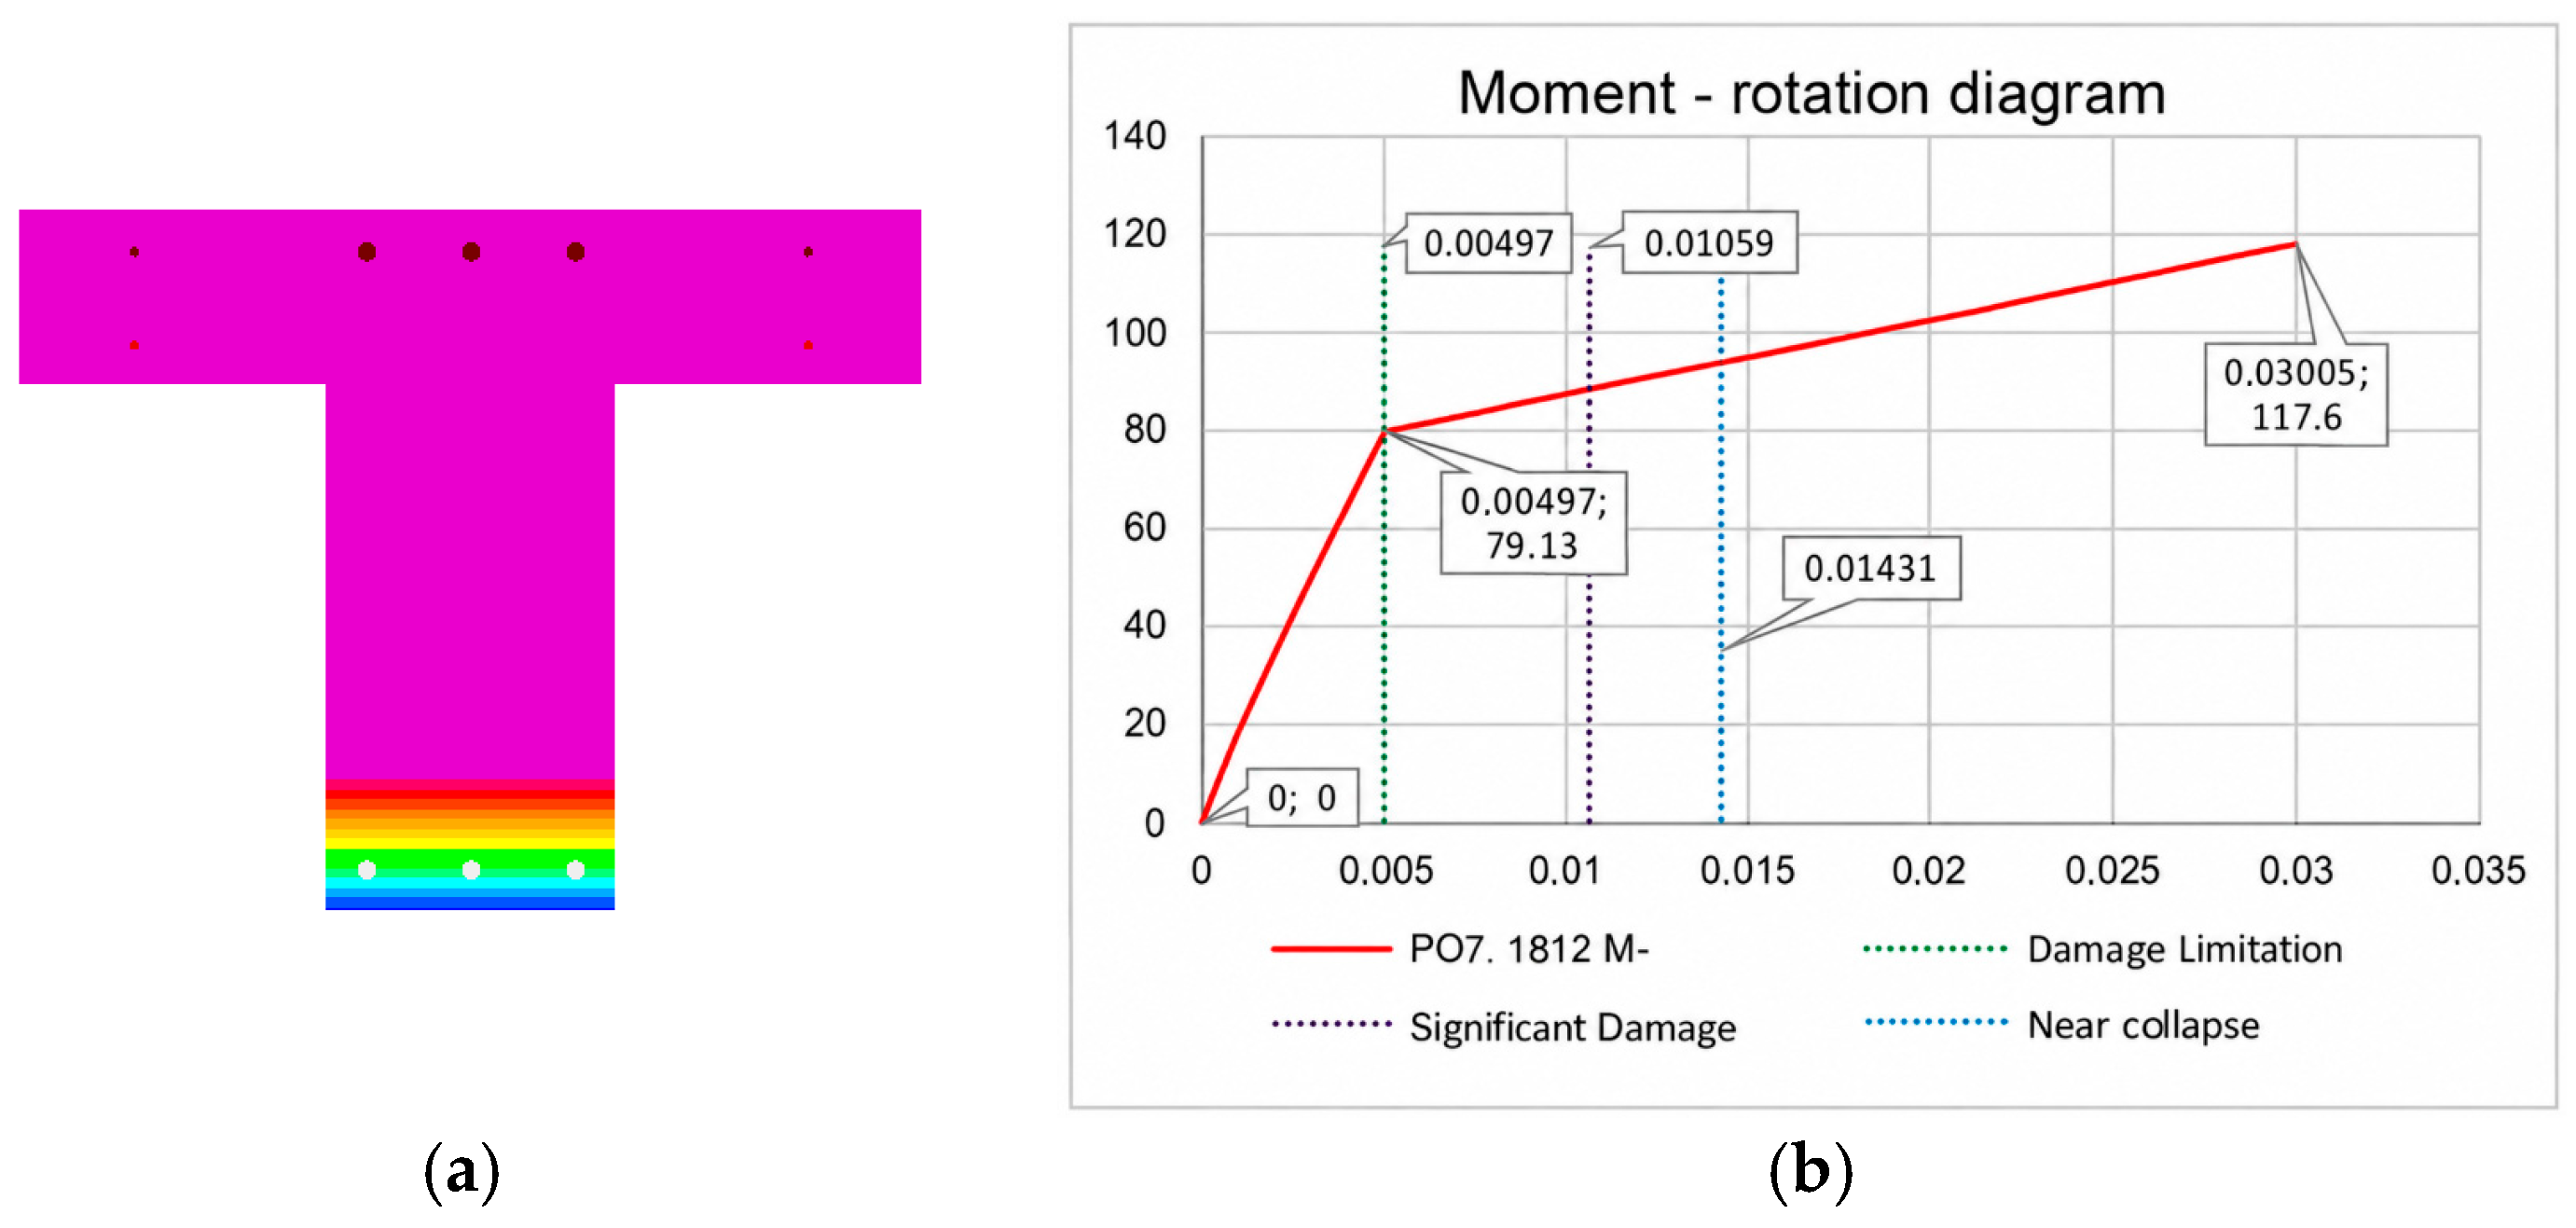
Special attention was dedicated to defining effective flange width and calculation of resistance moments at beam ends like “T”- and “L”-shaped cross-sections in vicinity of installations shafts, which resulted in a large number of defined plastic hinges. For each characteristic beam cross-section, cross-section analysis was performed using SAP2000 [13], and the corresponding rotation of limit states was calculated according to EN 1998-3 [11], as shown in Figure 6.
Figure 6.
(a) Cross-section analysis, (b) moment–rotation diagram.
After the calculated ultimate rotation is reached, the model assumes a reduction in resistance to 1% of the peak value and allows further rotation up to 0.10 rad to improve numerical stability and facilitate convergence of the analysis.
3. Modelling of Shear Behaviour
Although shear failures are commonly classified as brittle failure mechanisms according to Eurocode 8 [11], we modelled shear behaviour as a form of limited ductile behaviour. This modelling approach was motivated by experimental observations indicating that vertical structural elements may retain their gravity load-carrying capacity even after reaching peak shear resistance, until the shear capacity degrades to its residual value [14]. In this manner, the redistribution of internal forces within statically indeterminate structures is enabled, which may be particularly beneficial for older reinforced concrete buildings characterised by a low amount of transverse reinforcement in vertical elements.
3.1. Shear Walls
The shear behaviour of the walls was modelled using an inelastic shear material model [7]. The material model was defined as trilinear material with strength degradation. The strain parameters were determined from [15].
The peak shear resistance of the walls was calculated in accordance with EN 1992-1-1 [16], together with the relevant seismic provisions of EN 1998-1-1 [17] and EN 1998-3 [11]. The corresponding shear stress values were obtained by dividing the calculated wall resistance by the effective modelled wall area. Since the analysed walls were subjected to relatively low normalised axial load levels and their available shear were approximately equal to the shear forces required to develop their full flexural strengths, the nonlinear shear backbone parameters were selected as shown in Figure 7.
Figure 7.
Schematic shear stress–shear strain relationship.
At point Y, the shear strain was set to 0.001 and the corresponding shear stress to 50% of the peak shear stress, in accordance with [8].
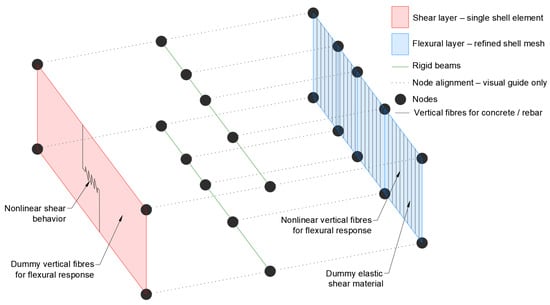
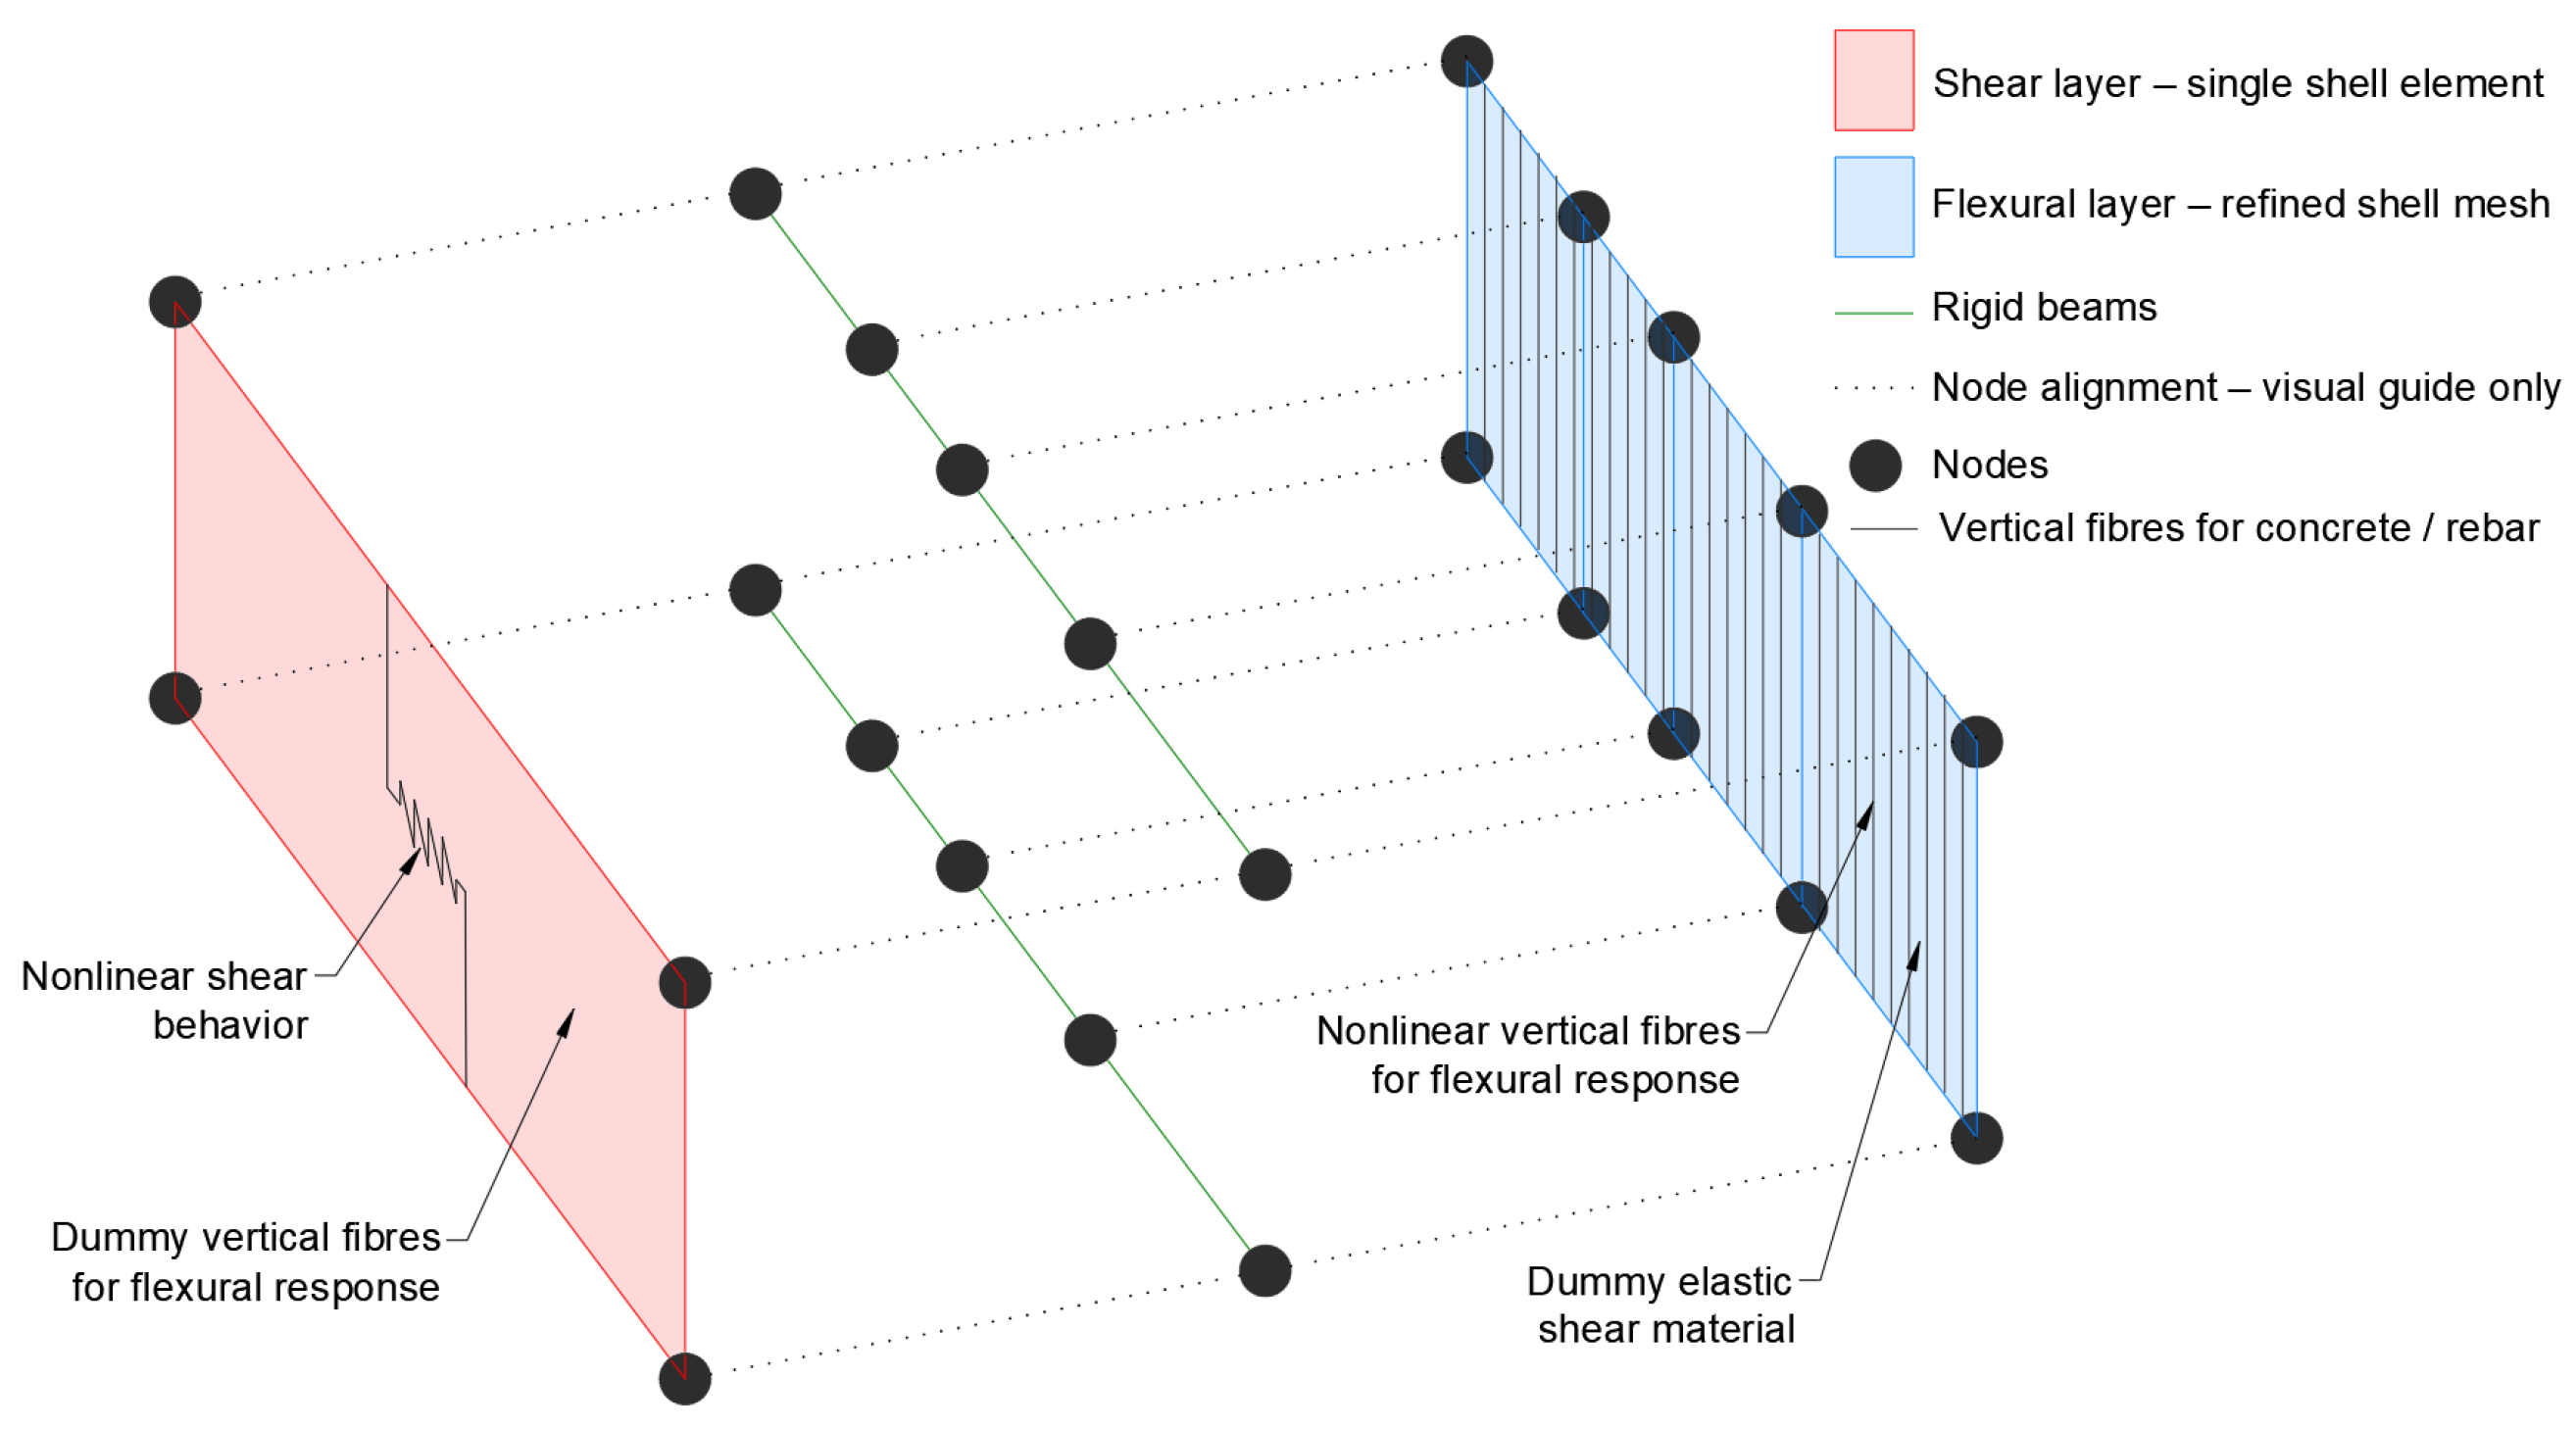
In order to mitigate strain localisation in walls that were modelled with multiple elements per member length, a new modelling approach was developed in which the flexural and shear responses of the wall are represented by two superimposed layers of shell elements. The first layer is dedicated to modelling the flexural behaviour and may be discretised into as many elements along the wall length, as required. In this layer, the actual concrete and reinforcement material models are assigned to the fibres, while the shear response is deactivated by assigning a dummy elastic shear material with very low strength (0.01 MPa) and shear modulus (G = 1 MPa).
The second layer is used exclusively to capture the shear behaviour. In this layer, the flexural response is suppressed by assigning dummy concrete and reinforcement materials negligible stiffness and strength, whereas the nonlinear shear response is represented by the proposed shear constitutive model. To ensure compatible deformations between the two layers, all corresponding nodes are connected by massless rigid beams. Figure 8 presents an exploded view of the wall model, illustrating the separate flexural and shear layers and the rigid beams connecting the corresponding nodes. In the numerical model, the two layers are superimposed.
Figure 8.
Exploded view of wall model.
This approach enables the flexural response to be represented using a refined mesh while mitigating the localisation of the shear deformations that may occur when degrading shear material models are assigned independently to multiple shell elements.
It should be emphasised that the shear behaviour was modelled independently of the flexural behaviour, as the software did not provide the capability to account for the interaction between in-plane shear forces, bending moments, and axial forces on strength and deformation capacity degradation within the wall elements.
3.2. Beams and Columns
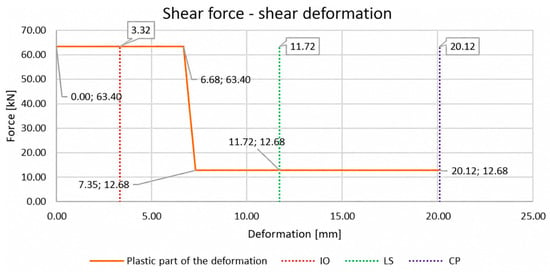
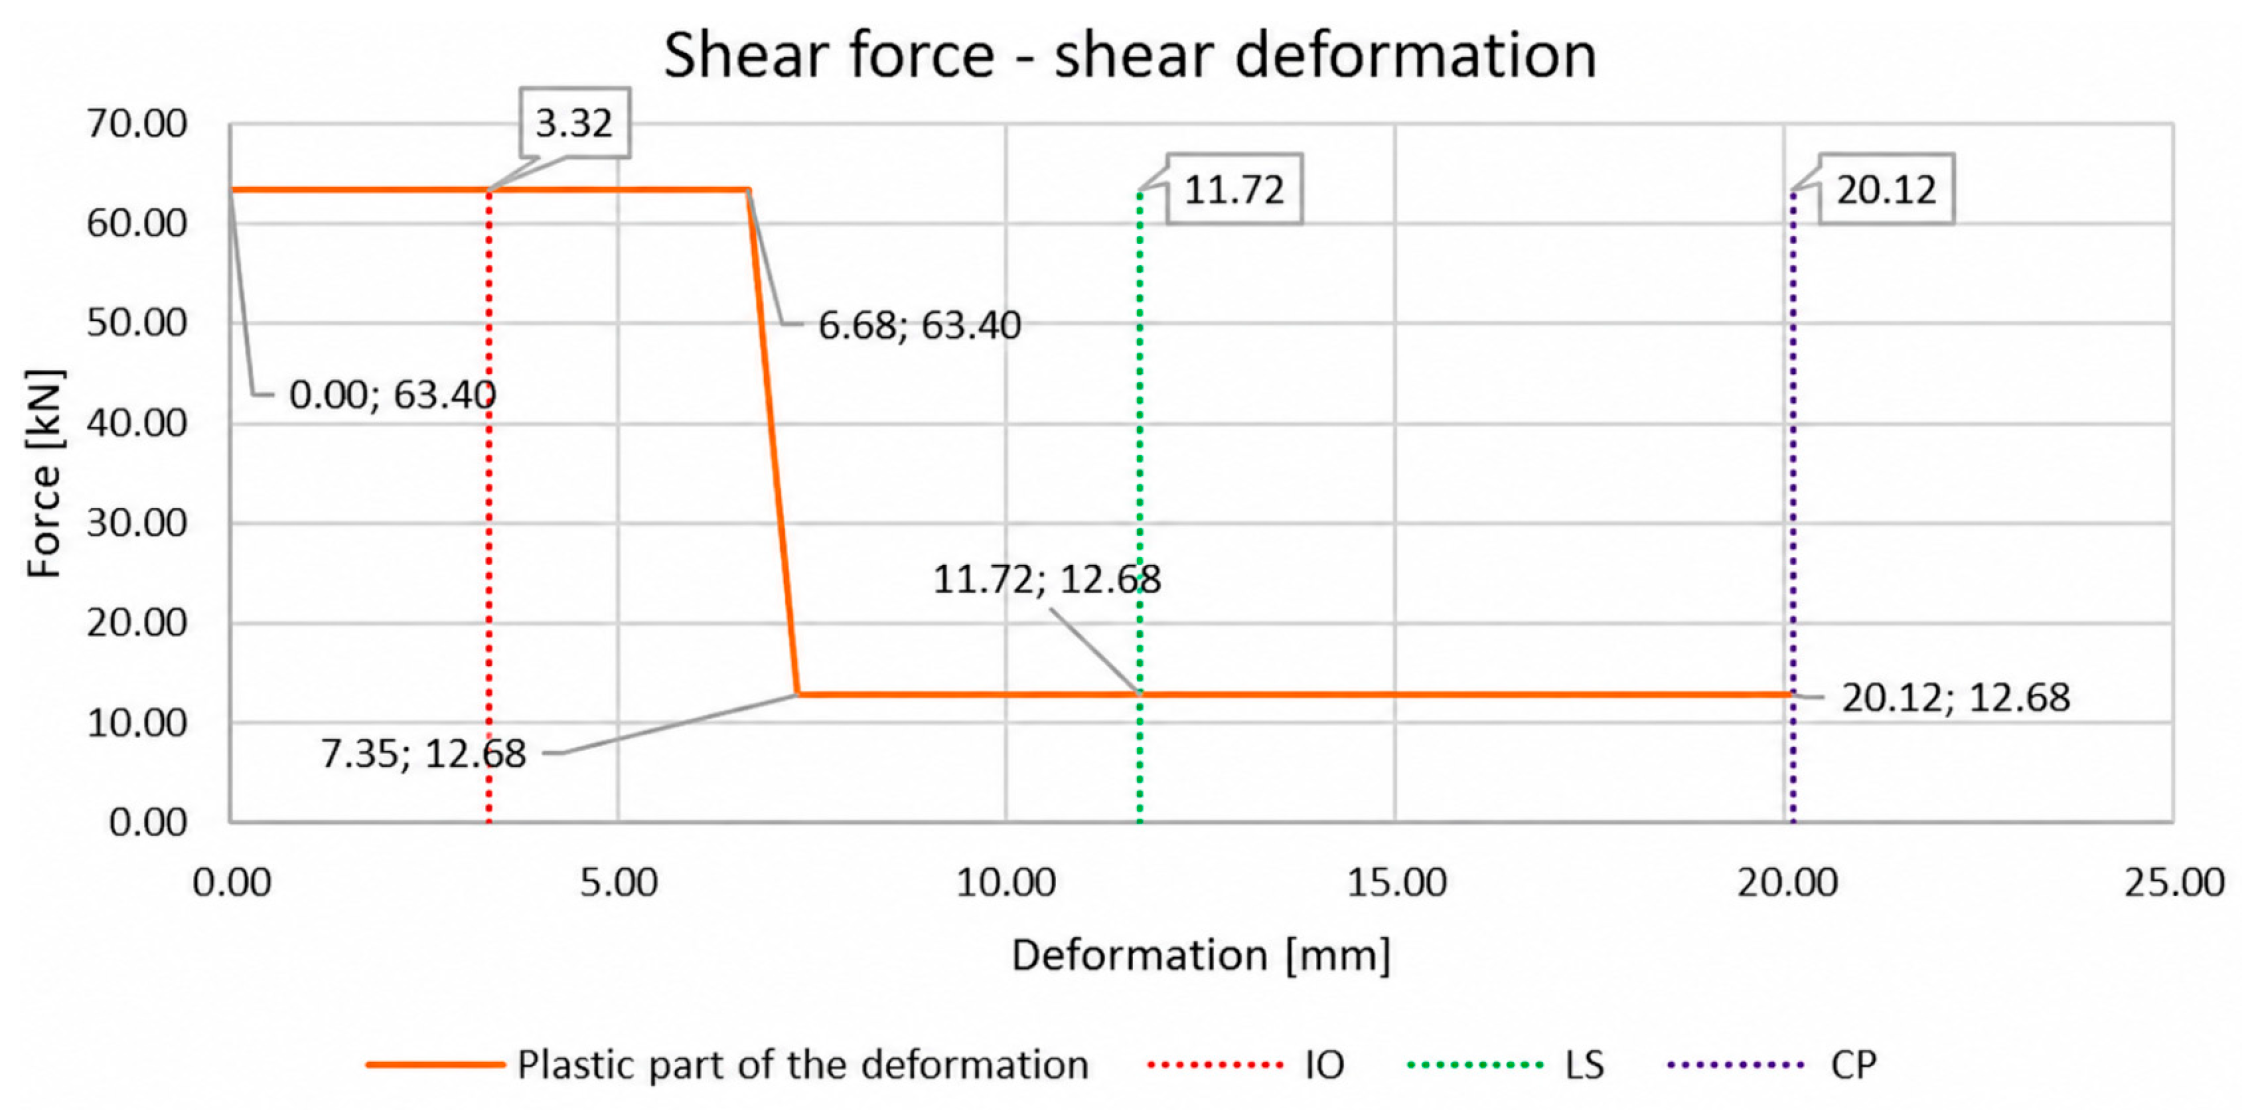
The shear behaviour of the beams and columns was modelled using lumped plasticity shear hinges of the “Shear Hinge, Displacement Type” [7], with an elastic response followed by a plastic plateau and subsequent strength degradation. The peak shear resistance was calculated according to EN 1992:2023 [16], together with the relevant seismic provisions of EN 1998-1-1 [17] and EN 1998-3 [11]. Since the Eurocode provisions generally treat shear failure as brittle and do not provide explicit deformation parameters for nonlinear shear–hinge modelling, the shear deformation limits and acceptance criteria were adopted from ASCE 41-23 [15]. The ASCE 41-23 performance levels Immediate Occupancy (IO), Life Safety (LS), and Collapse Prevention (CP) are broadly comparable to the Eurocode 8 Damage Limitation (DL), Significant Damage (SD), and Near Collapse (NC) limit states, respectively; however, this correspondence is qualitative because the two standards adopt different seismic hazard levels, verification formats, and component acceptance criteria. A fully brittle idealisation based solely on the Eurocode resistance criteria would predict shear failure of the beams at very small drift ratios and introduce an abrupt loss of resistance, which could also cause numerical convergence difficulties. Therefore, the degrading shear–hinge relationship shown in Figure 9 was adopted.
Figure 9.
Example of shear displacement hinge diagram.
4. P-D Effects
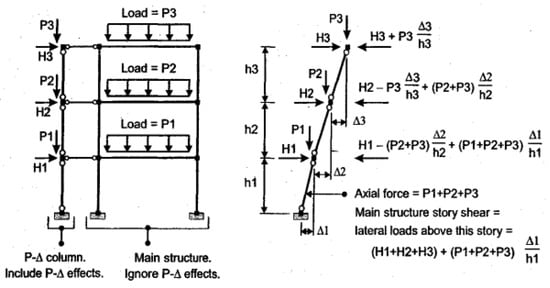
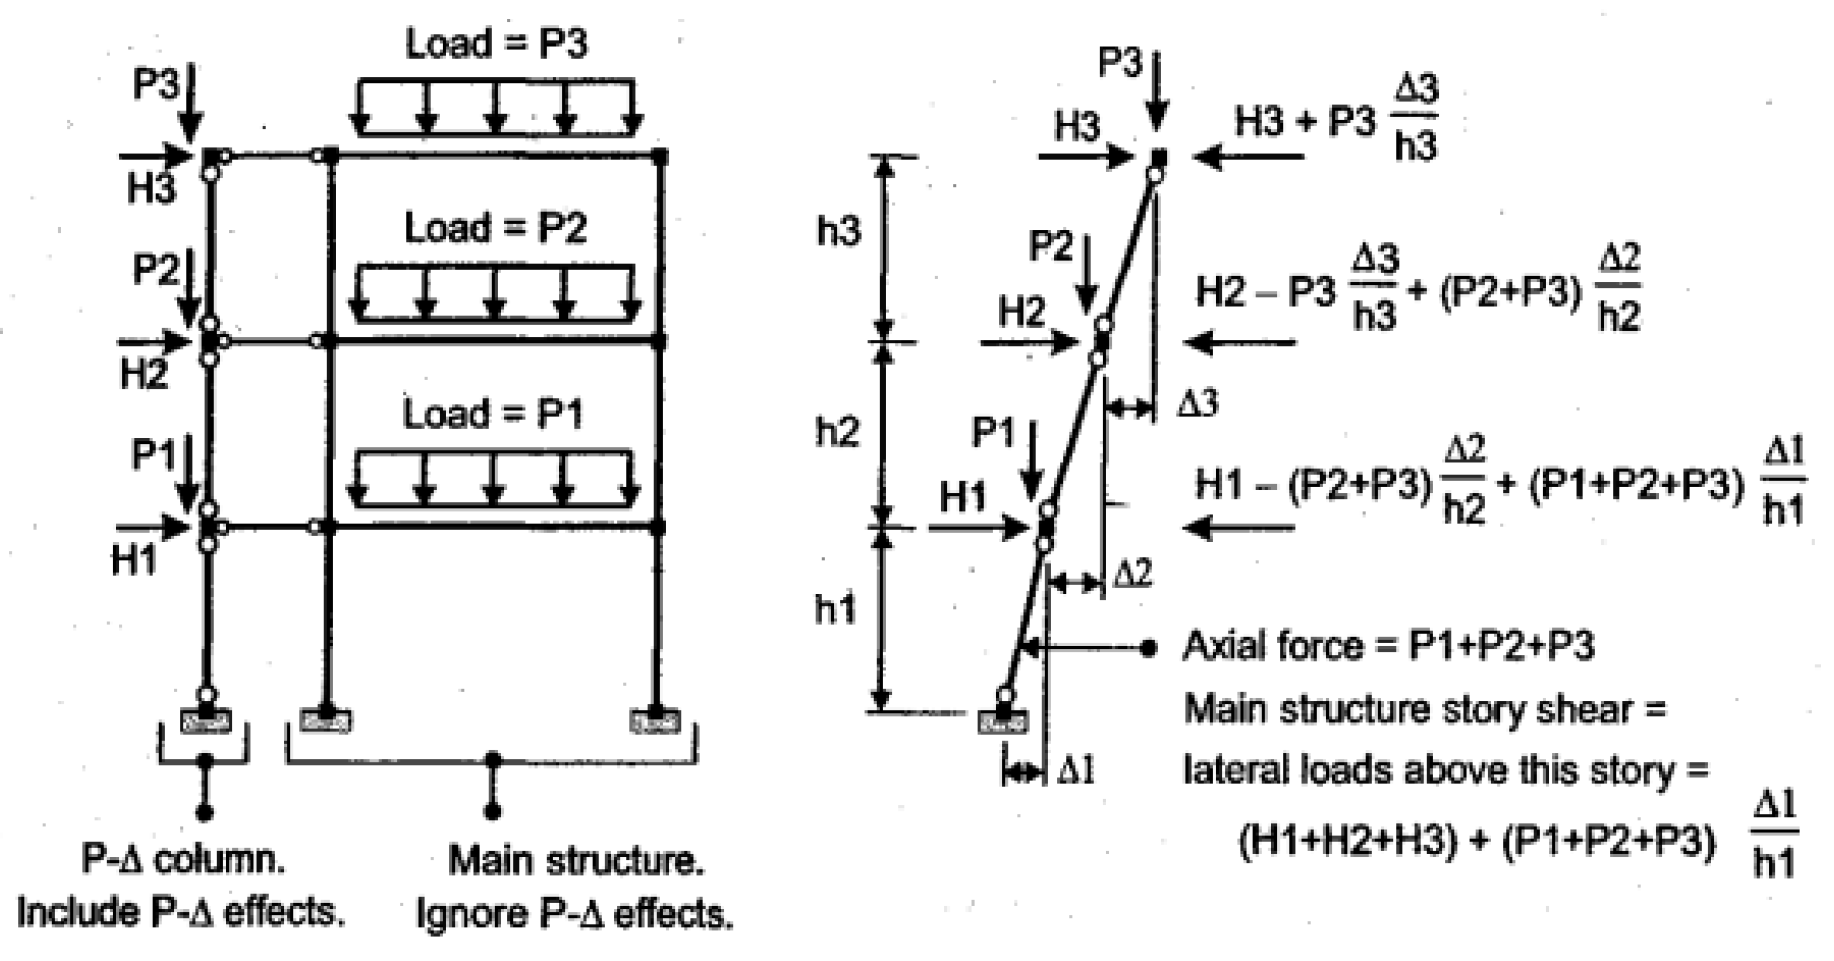
P-D effects were taken into account by incorporating the P-D column as described in [18]. This concept, Figure 10, involves a P-D column connected to the main structure with a pinned connection or kinematically constrained with a “rigid diaphragm” to other nodes of the same level. All gravity load is applied on the structural elements as on the P-D column, and P-D effects are considered only in the P-D column.
Figure 10.
P-D column in multi-storey buildings, reprinted from [18].
5. Case Study Building
The building is located in Zagreb. The design documentation was prepared during 1965 and 1966. The building has an approximately regular rectangular plan with overall dimensions of 20.60 m × 19.35 m. The total height of the structure, measured from the underside of the foundation slab to the top edge of the parapet, is 57.85 m. The building consists of a basement, a ground floor, and 18 upper stories. The top two levels accommodate service areas.
The ceiling structure of the basement and the 16th floor is composed of a monolithic reinforced concrete slab with a thickness of 15 cm, while the floor structures of the remaining stories were constructed using prefabricated prestressed hollow-core slabs, also with a thickness of 15 cm.
The foundation system is composed of a reinforced concrete foundation slab with a thickness of 90 cm, founded on a gravel layer at a depth of 3.61 m below ground level.
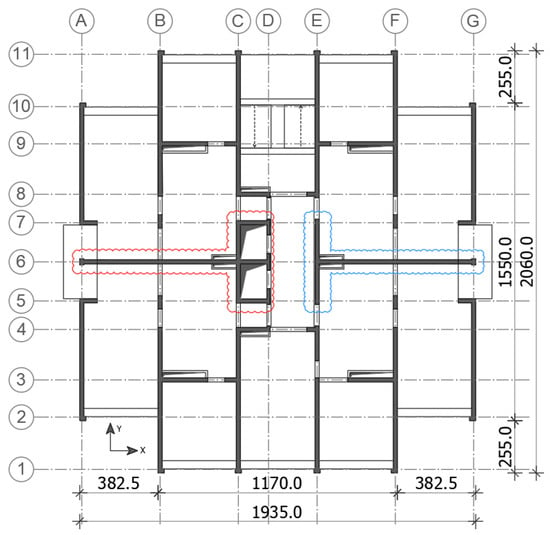
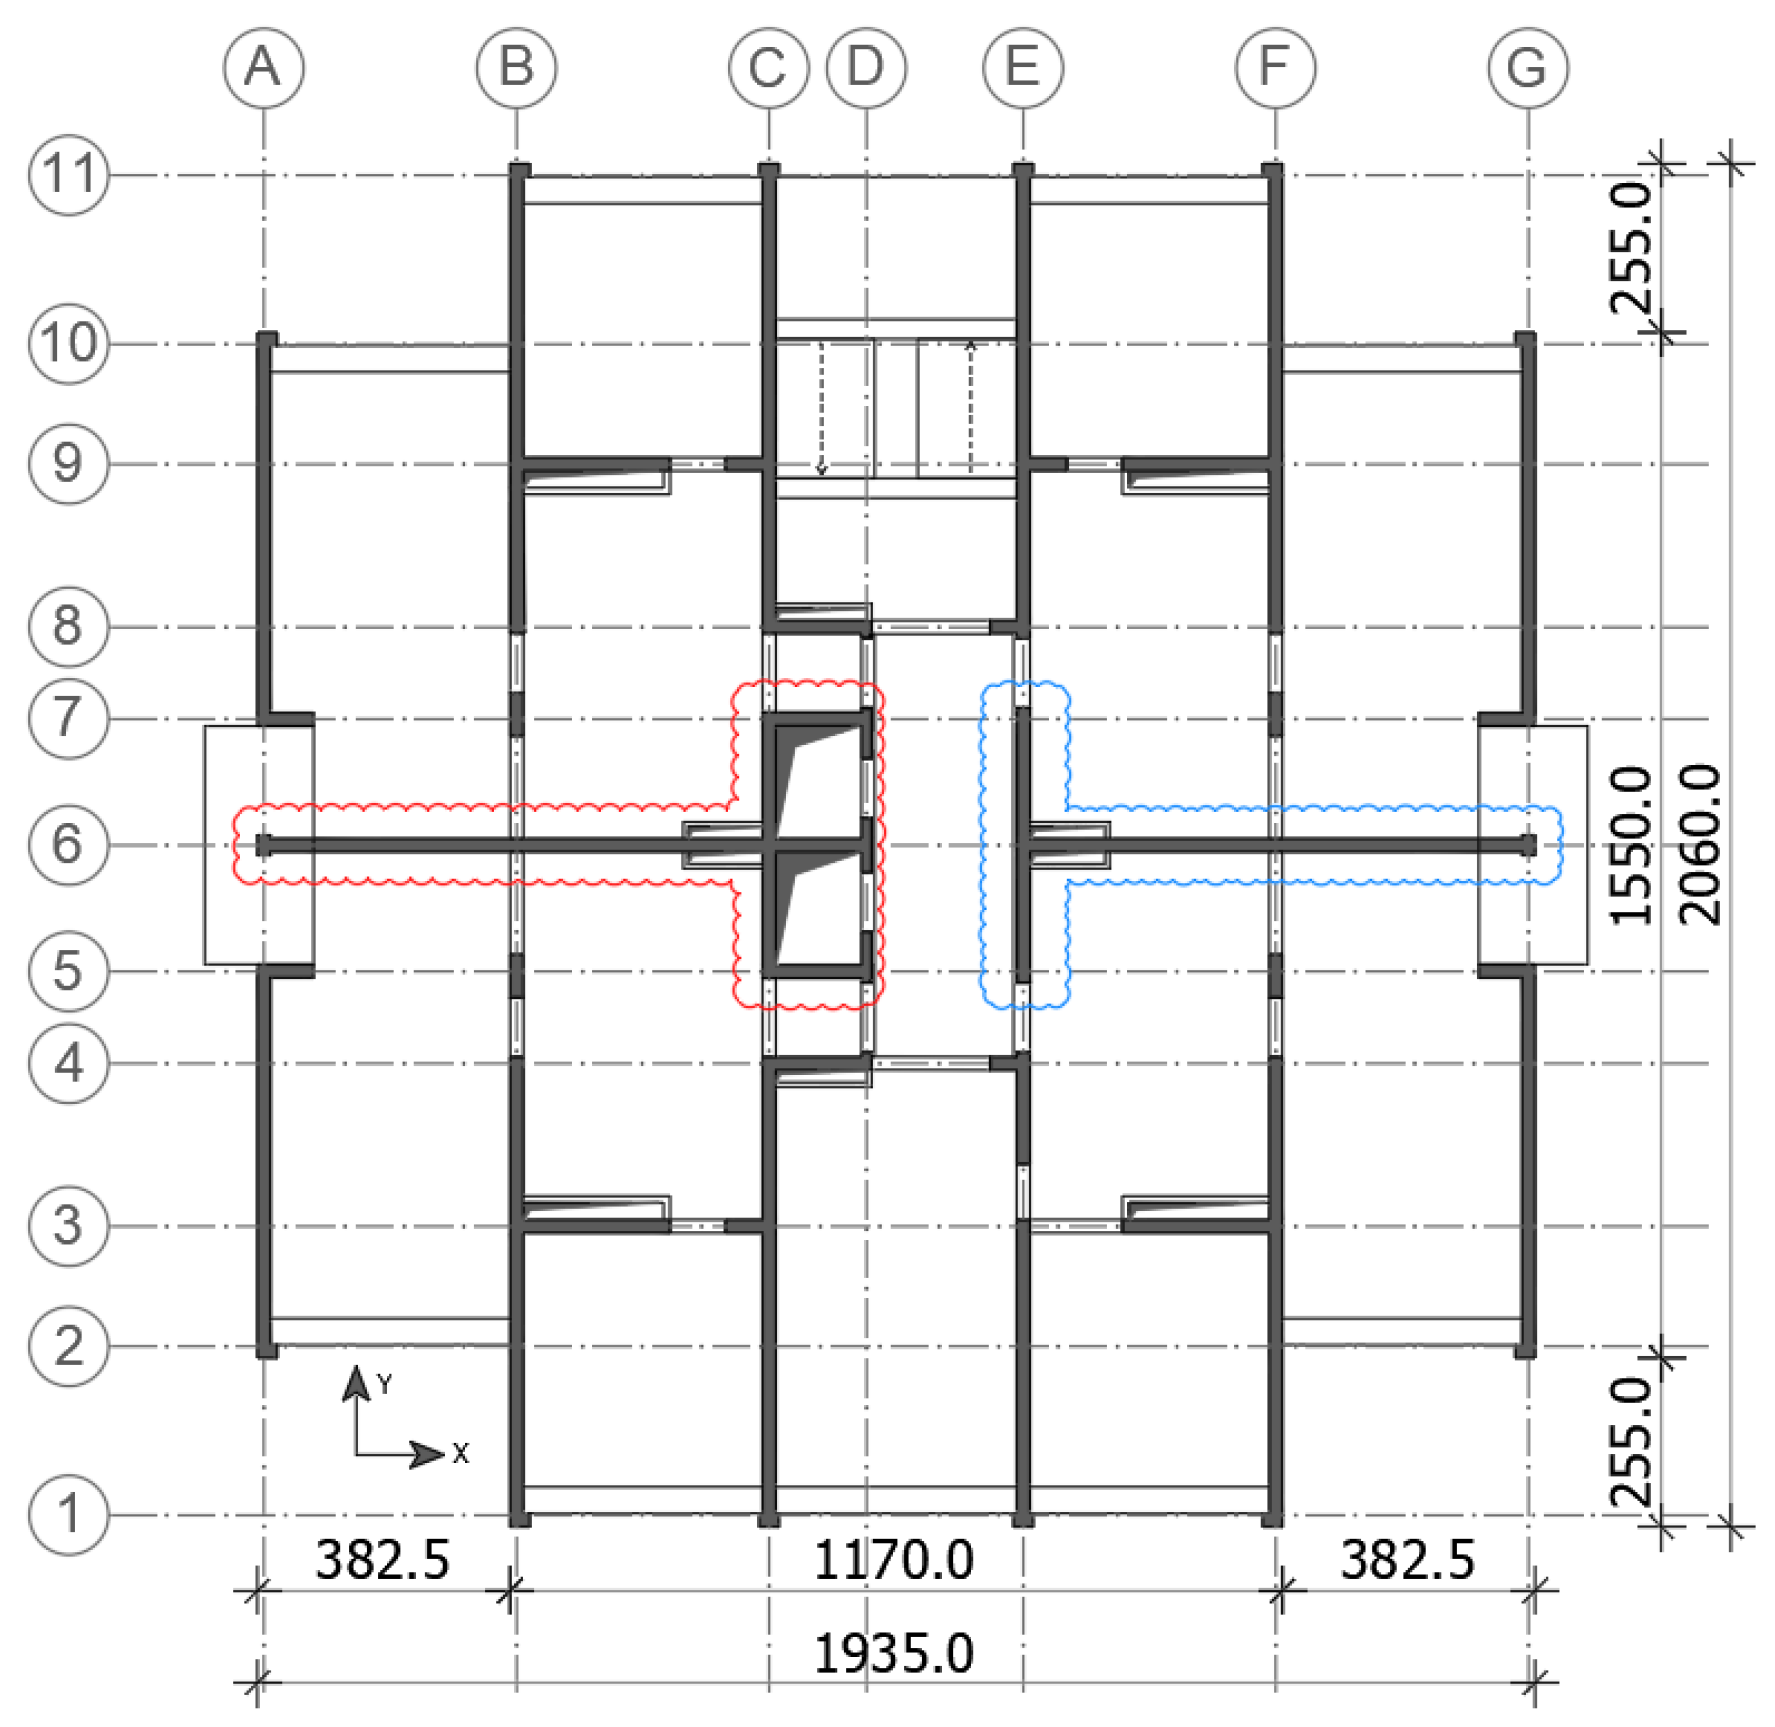
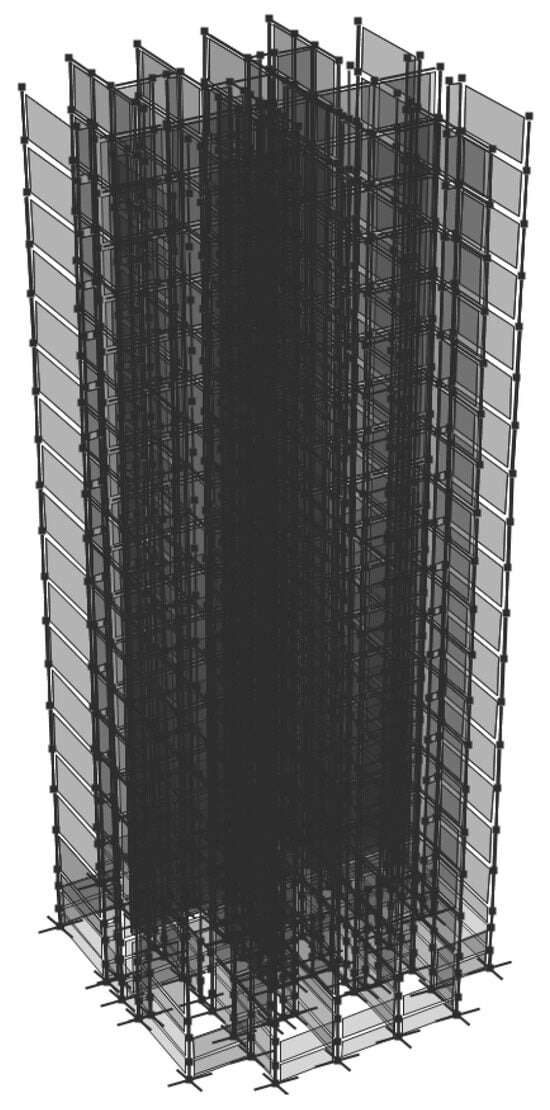
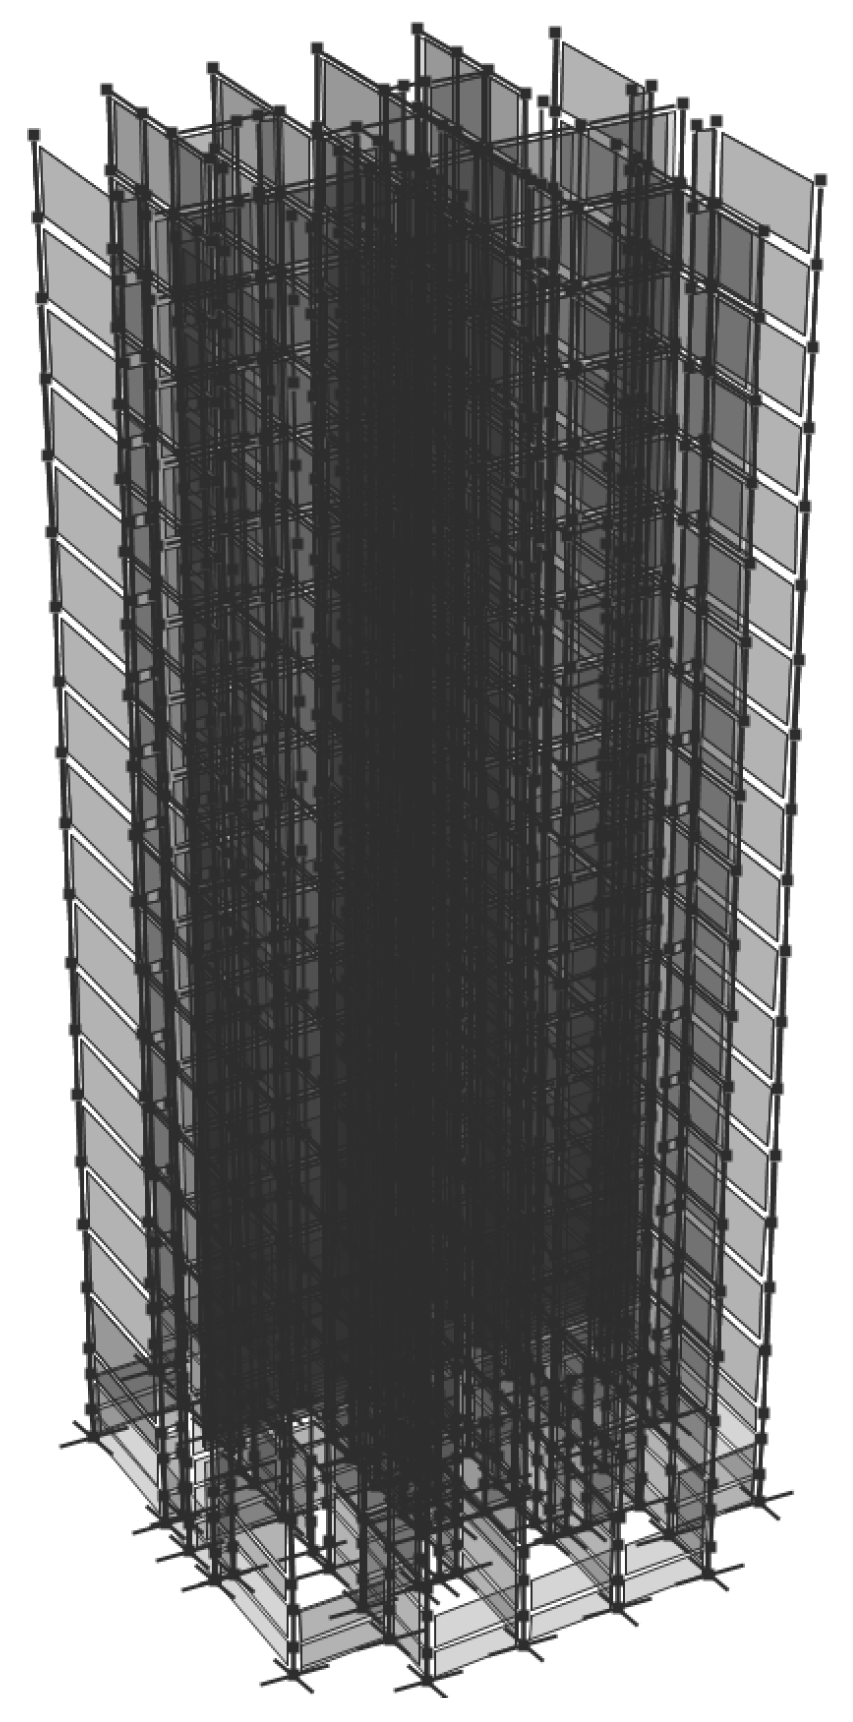
The horizontal stability and stiffness of the structure are ensured by reinforced concrete shear walls. The walls are distributed approximately uniformly throughout the floor plan, with one dominant wall located along axis 6, and a larger number of shorter walls in the perpendicular direction. The walls extend continuously from the foundation slab to the floor slab of the 17th story. Wall thicknesses in the basement vary between 35 cm and 20 cm, while all walls above the ground floor level have a uniform thickness of 20 cm. From the ground floor upwards, the wall area ratios are 2.3% in the X direction and 5.2% in the Y direction. Figure 11 shows the plan of a characteristic floor; for ease of reference in the subsequent discussion, the left and right wall segments along axis 6 are highlighted in red and blue, respectively. These designations are used throughout the remainder of this paper. A 3D view of the numerical model is shown in Figure 12.
Figure 11.
Plan view of characteristic floor.
Figure 12.
3D numerical model.
According to the main design, all structural elements were reinforced using steel designated as “Čelik 37” or Č.0361, which corresponds to the present-day structural steel grade S235JR according to HRN EN 10025-2 [19].
The used concrete grades designated as “MB” (hrv: marka betona, eng: concrete grade) MB 220 and MB 160 were used for the vertical elements. Concrete grade MB 160 approximately corresponds to strength class C12/15, while concrete grade MB 220 approximately corresponds to strength class C20/25.
6. Analysis Results
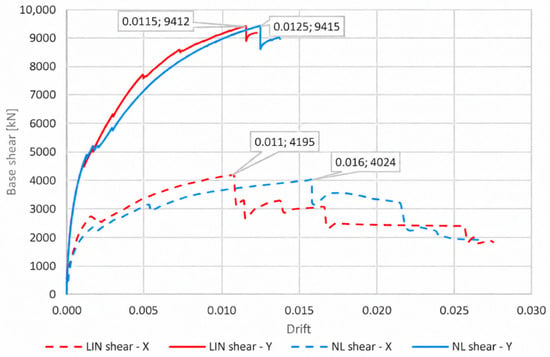
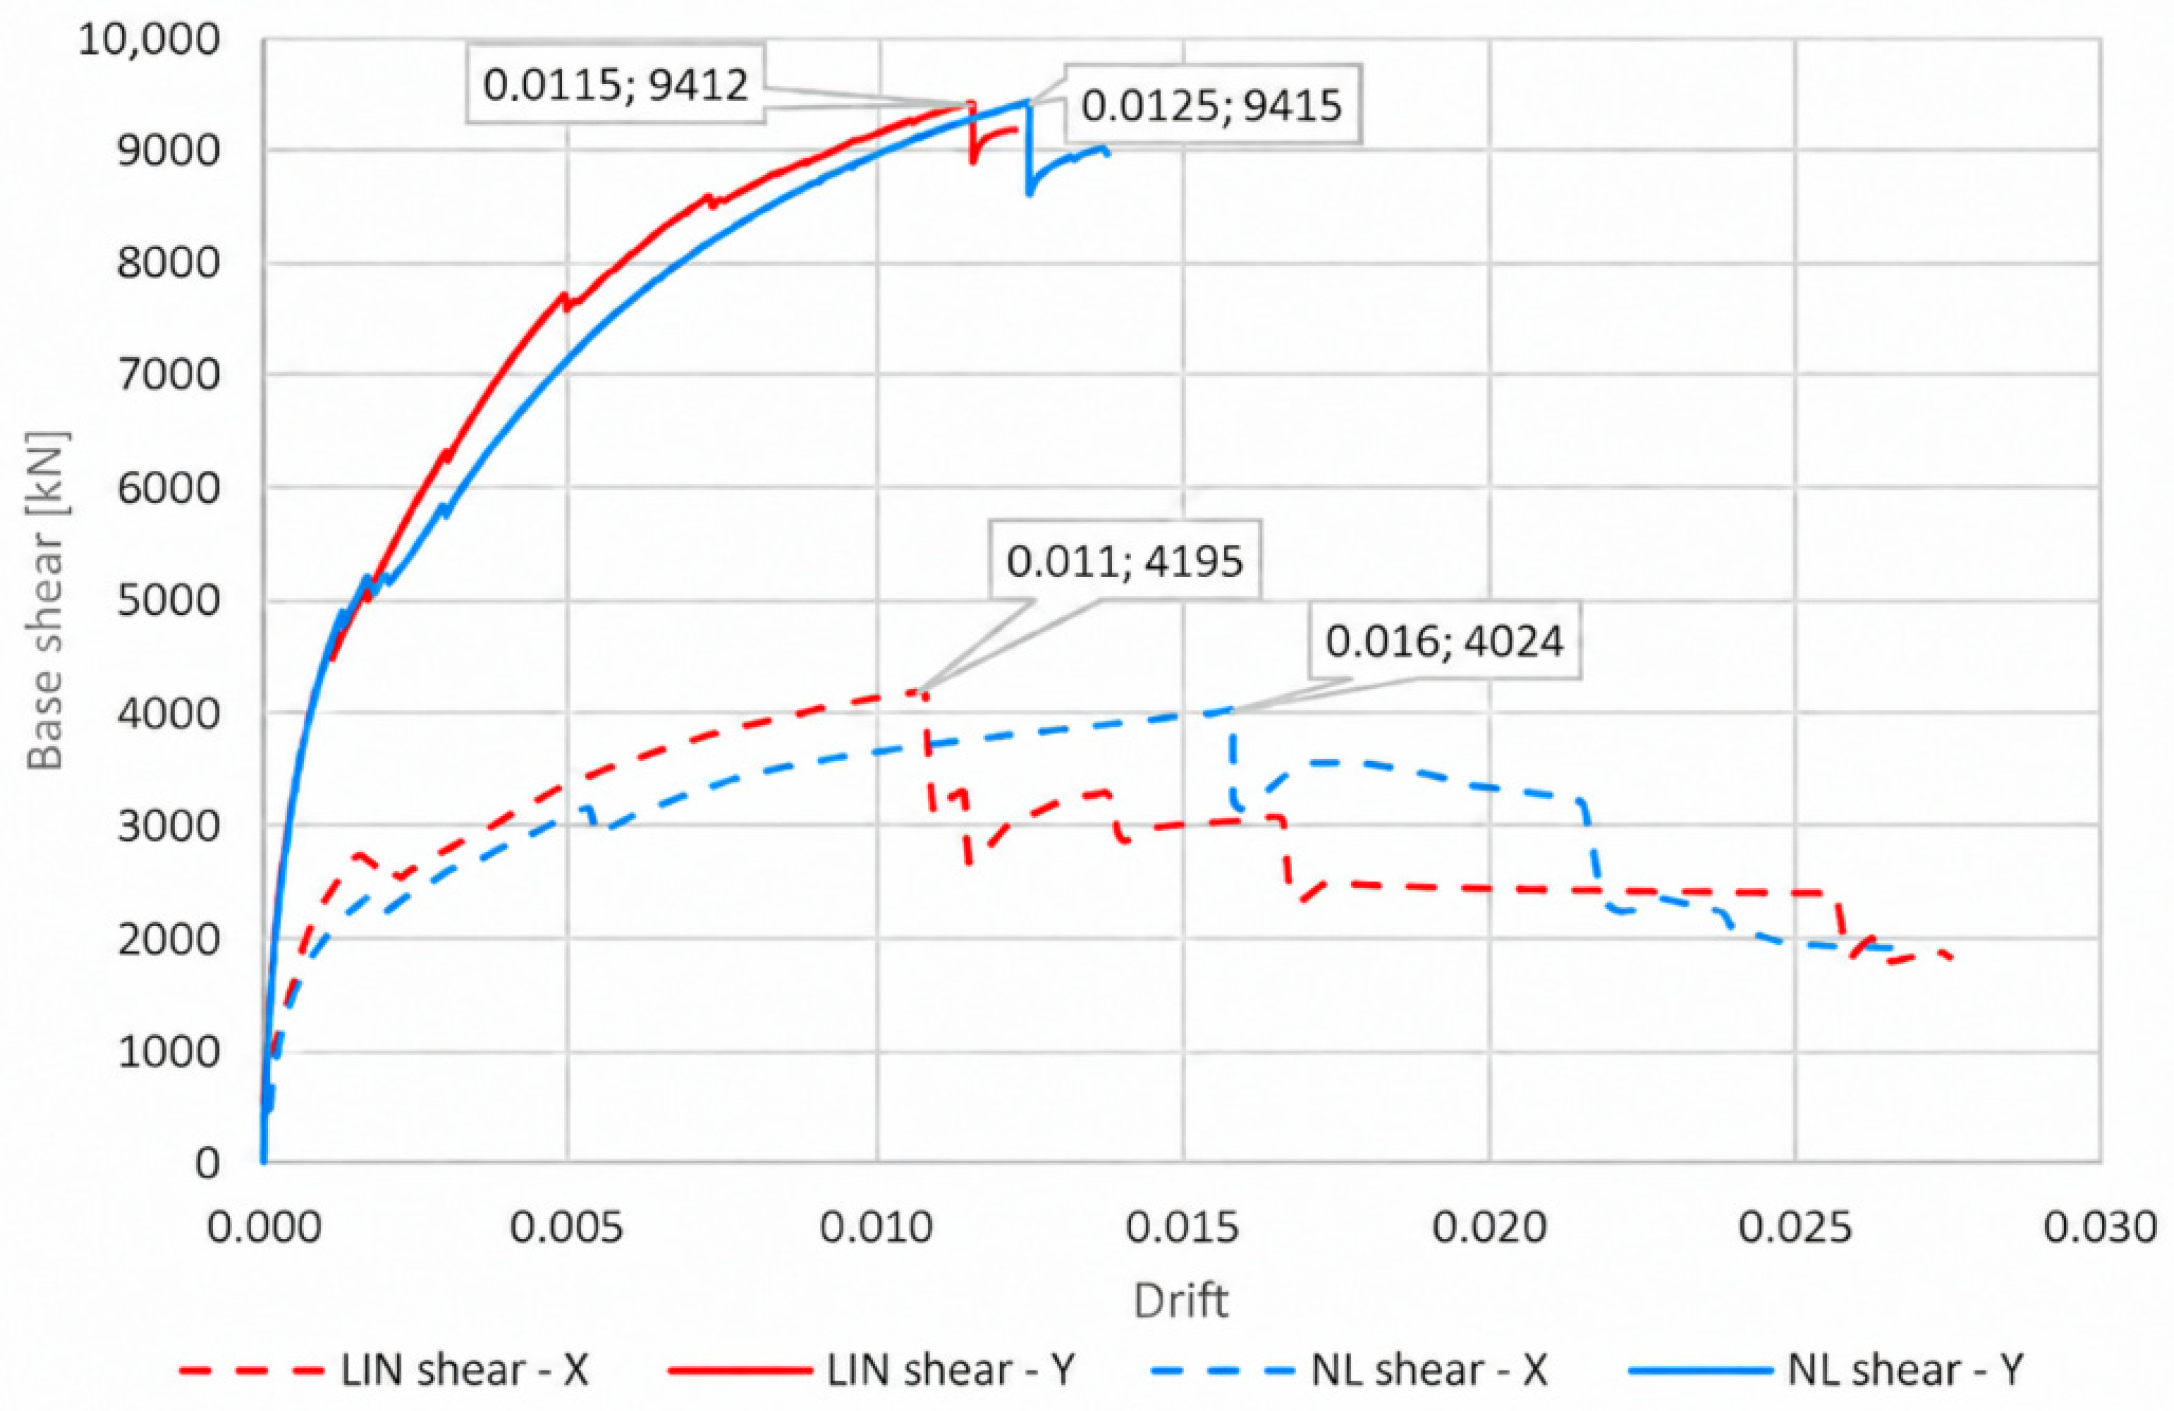
A nonlinear static (pushover) analysis was performed in both the X and Y directions using lateral load patterns based on the corresponding first-mode shapes. For brevity, only the results for the positive X and Y loading directions are presented, as the structure is nearly symmetrical and similar responses were expected in the corresponding negative loading directions. A graphical comparison of the pushover analysis results is presented in Figure 13.
Figure 13.
Pushover curves.
Discussion of Results
The structure exhibits a significantly lower base-shear capacity in the X direction because of the smaller effective wall area available to resist lateral loading. The primary latera -force-resisting elements in this direction are the walls located along axis 6, which, together with the perpendicular wall segments, form two walls with composite (non-rectangular) cross-sections, as shown in Figure 11. Under loading in the positive X direction, the left wall does not have a flange containing a significant amount of tensile reinforcement; instead, tension develops at the free end of the wall web. In contrast, the right wall behaves as a T-shaped section, with the flange subjected to tension, and is therefore capable of developing considerably greater flexural resistance.
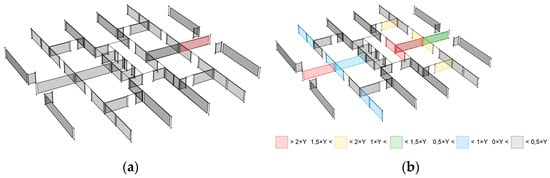
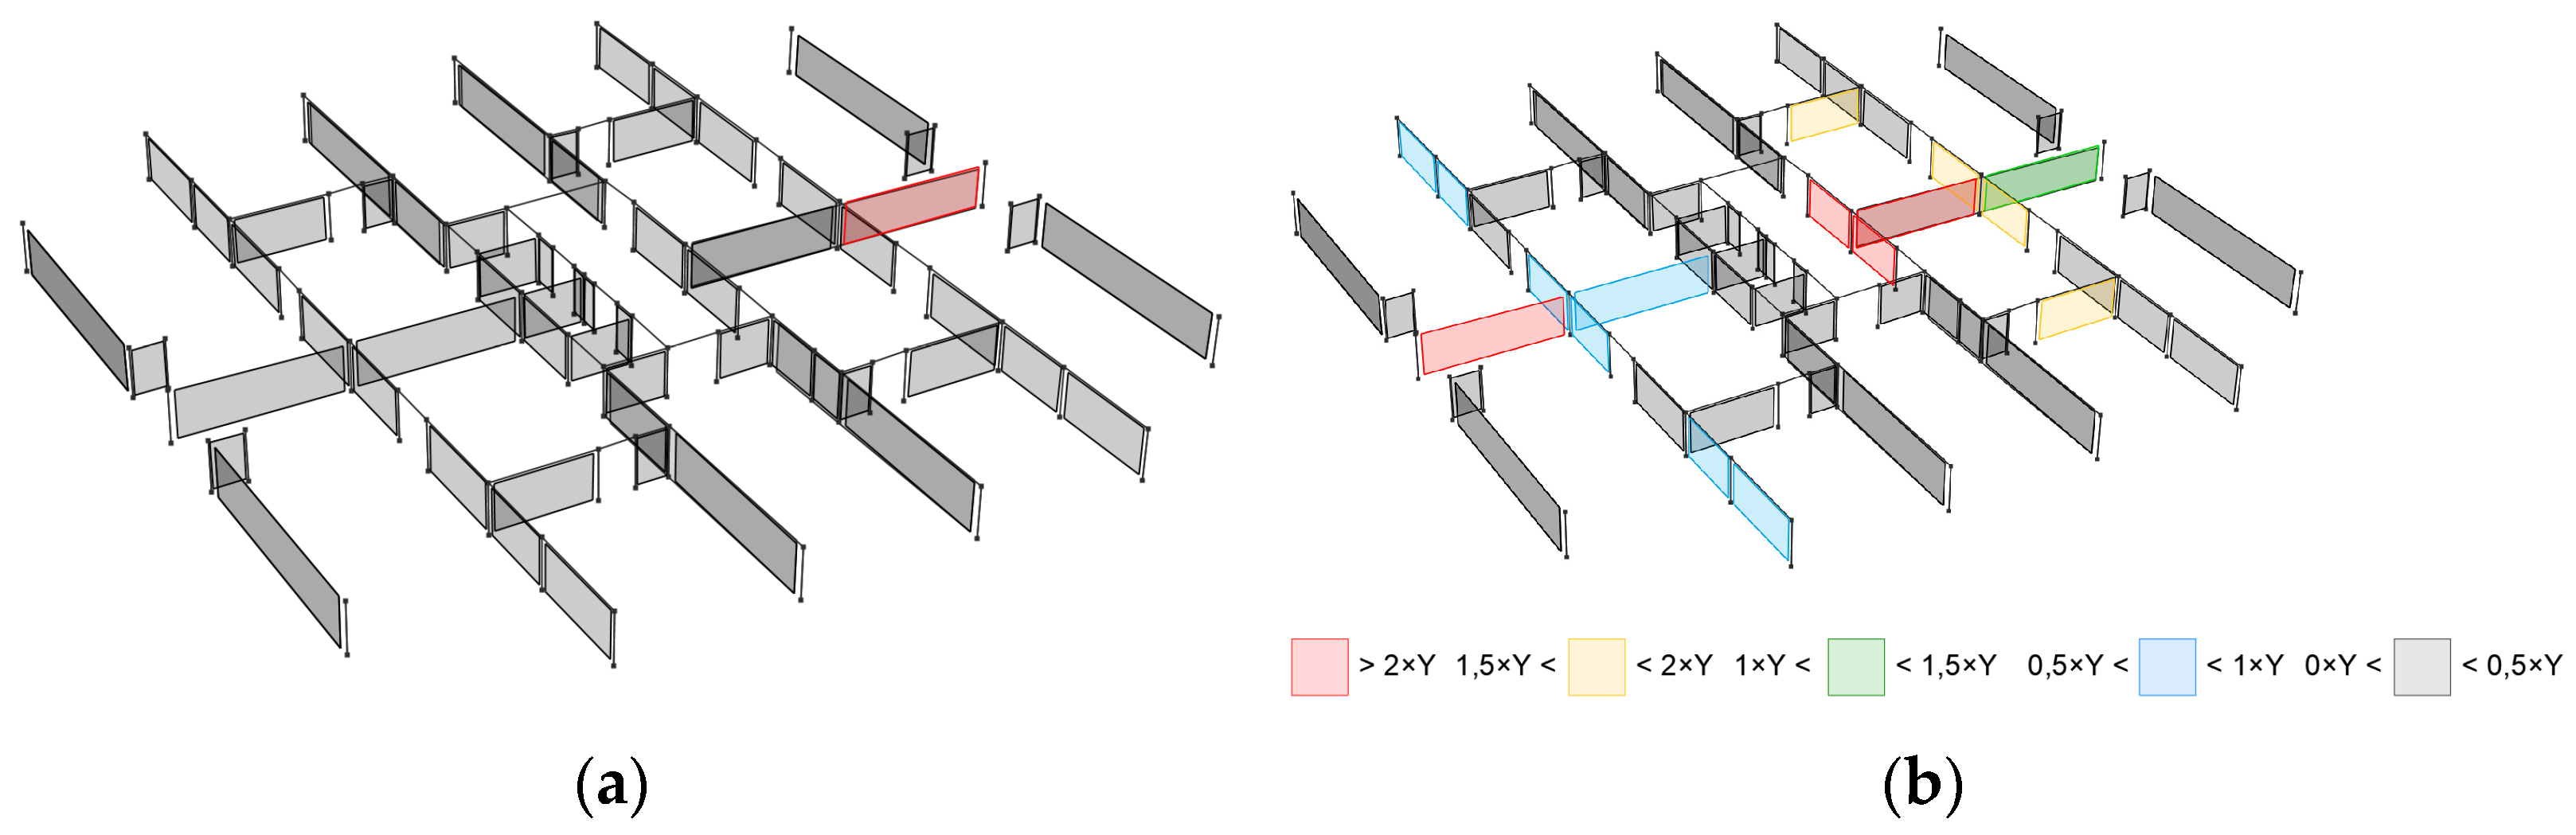
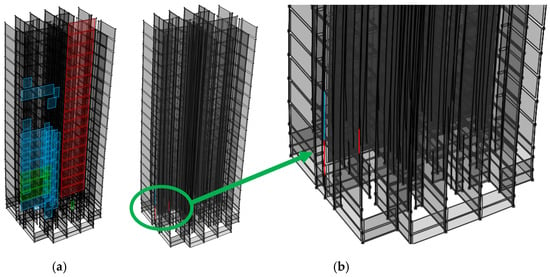
In the following discussion, the drift ratio is defined as the horizontal roof displacement divided by the total height of the structure and is expressed as a percentage. In the X direction, nonlinear shear modelling has a significant influence on the structural response, most clearly reflected in the rightward shift of the capacity curve towards larger drift ratios. The introduction of the nonlinear shear material changes both the governing degradation mechanism and its location within the structure. In the model with linear elastic shear behaviour, the shear response does not limit the resistance of the right wall segment along axis 6. Owing to the large amount of longitudinal reinforcement in the tension flange, the wall is capable of developing high flexural resistance. Our previous research [20] showed that this loading orientation is unfavourable in terms of ductility because the compression zone is concentrated within the relatively narrow web. The high flexural resistance results in large compressive strain demands at the free edge of the web, ultimately causing concrete crushing at the intersection of axes 6 and G and a sudden loss of lateral resistance at a drift ratio of approximately 1.1%. The critical wall element is highlighted in red in Figure 14a, while Figure 14b shows the elements in which the longitudinal reinforcement has yielded in tension. The colour scale represents the ratio of the tensile strain developed in the longitudinal reinforcement of each wall element to the strain corresponding to point Y of the material backbone curve.
Figure 14.
(a) Critical wall element; (b) distribution of tensile strain demand in the longitudinal reinforcement, with the colour scale shown at the bottom of the figure.
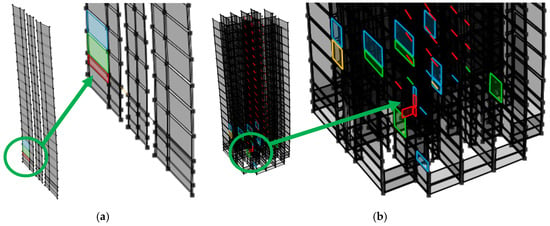
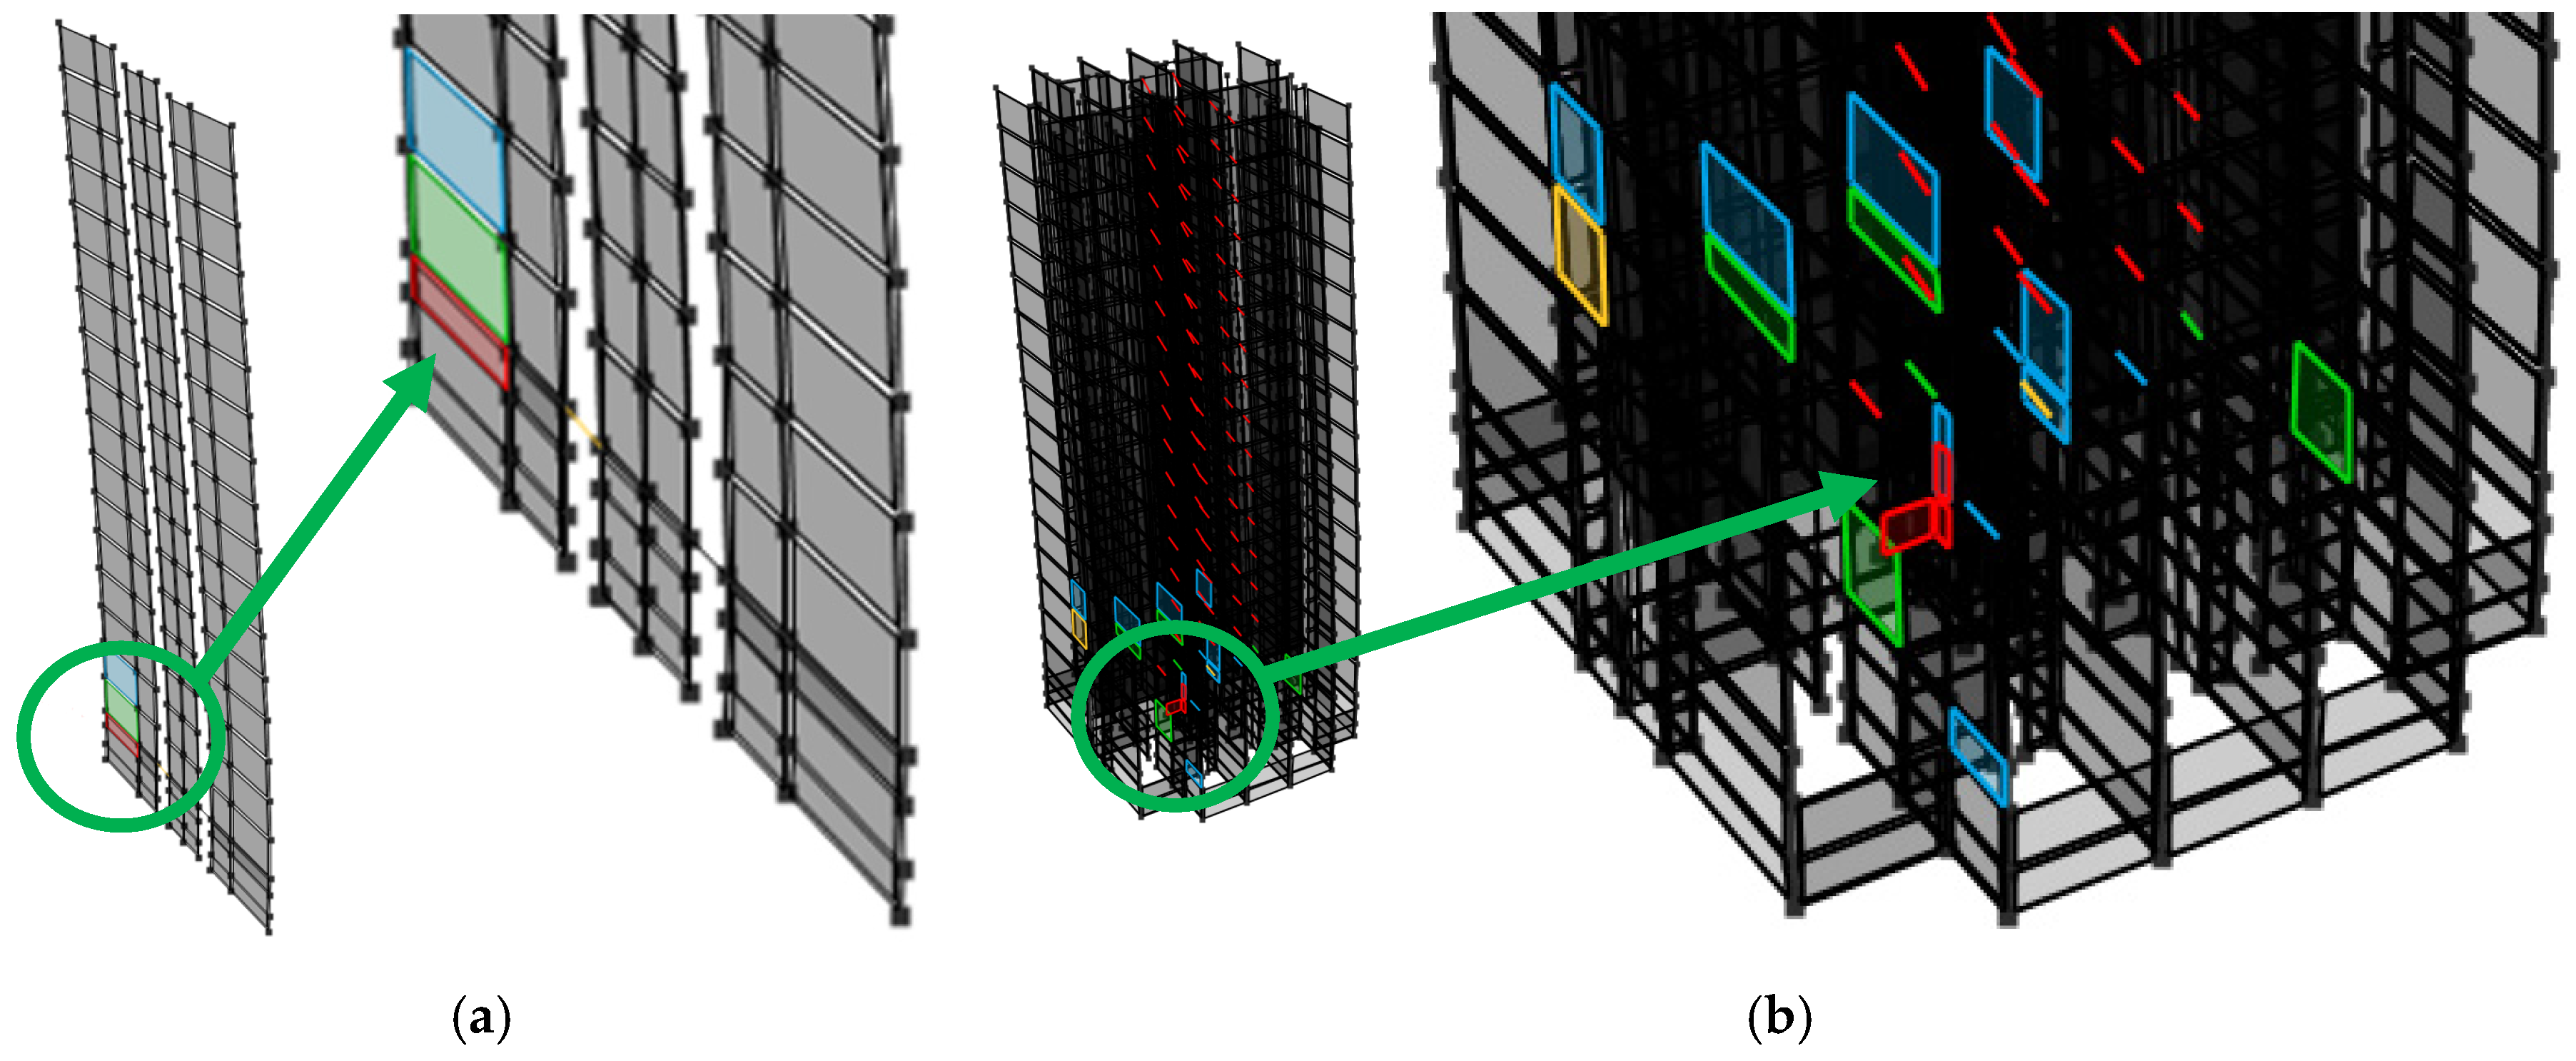
In the model with nonlinear shear behaviour, a pronounced reduction in lateral resistance is observed at a drift ratio of approximately 1.6%. The resistance of the right wall segment along axis 6 is limited by the shear capacity of its web. Prior to the global strength reduction, this wall undergoes shear yielding, as illustrated in Figure 15a, which shows the distribution of shear strain at a drift ratio of 1.13%. The critical wall is highlighted in red, and its shear capacity is fully mobilised at this drift level. The development of nonlinear shear deformations limits the additional force transferred by the wall and reduces the compressive strain demand at the free edge of the web. Consequently, concrete crushing at this location is not reached within the considered response range. With further loading, the longitudinal reinforcement at the free edge of the left wall web enters the strength-degradation range, ultimately causing a reduction in the global lateral resistance observed at a drift ratio of 1.6%. Figure 15b shows the critical element highlighted in red, in which the longitudinal reinforcement in tension undergoes strength degradation.
Figure 15.
(a) Distribution of shear strain at drift ratio of 1.13%; (b) degradation of tensile strength of longitudinal reinforcement at drift ratio of 1.6%.
It is important to note that the right wall exhibits a significantly higher shear demand-to-capacity ratio than the left wall. In the left wall, the shear demand is limited by the relatively small amount of longitudinal reinforcement in the tension zone. This limits the flexural resistance that can be developed and, consequently, the corresponding shear force transferred by the wall.
In the Y direction, both models exhibit similar overall behaviour, indicating that the adopted shear formulation has only a limited influence on the global structural response. Nevertheless, differences are observed in the predicted onset and location of strength degradation. In the model with linear elastic shear behaviour, the reduction in lateral resistance occurs at a drift ratio of approximately 1.15% and is caused by concrete crushing in the wall located along axis C, as shown Figure 16a. In contrast, in the model with nonlinear shear behaviour, the loss of resistance occurs at a slightly larger drift ratio of approximately 1.24% and is attributed to concrete crushing in the elevator-core walls located along axes 7 and D, as shown in Figure 16b.
Figure 16.
Concrete crushing in Y direction: (a) model with linear elastic shear behaviour; (b) model with nonlinear shear behaviour.
7. Conclusions
A dual-layer shell modelling approach was proposed and applied to investigate the influence of nonlinear shear behaviour on the pushover response of an existing reinforced concrete wall building. The proposed approach enables the flexural and shear responses to be represented independently, while deformation compatibility is maintained through rigid connections between the corresponding nodes of the two layers.
For the investigated case study, the influence of nonlinear shear modelling differed considerably between the two loading directions. In the Y direction, both models produced similar global capacity curves, although differences were observed in the predicted onset and location of concrete crushing. In the X direction, nonlinear shear modelling changed the distribution of internal forces and deformations, the governing degradation mechanism, and the location of critical damage. The pronounced reduction in lateral resistance was predicted to occur at a drift ratio of approximately 1.1% in the linear elastic shear model and at approximately 1.6% in the nonlinear shear model.
The results indicate that similar initial stiffness and peak base-shear capacity do not necessarily imply similar local behaviour or deformation capacity. Neglecting nonlinear shear behaviour may therefore lead to different predictions of the governing failure mechanism, damage distribution, and drift ratio associated with the loss of lateral resistance. As the findings are based on a single case study building, further analyses of additional structural configurations are required before broader conclusions can be drawn.
Author Contributions
Conceptualization, H.Č. and M.U.; methodology, H.Č. and M.U.; software, H.Č.; validation, H.Č. and M.U.; formal analysis, H.Č. and M.U.; investigation, H.Č. and M.U.; resources, M.U.; data curation, H.Č. and M.U.; writing—original draft preparation, H.Č.; writing—review and editing, M.U.; visualization, H.Č.; supervision, M.U. All authors have read and agreed to the published version of the manuscript.
Funding
This research was funded by Croatian Science Foundation, grant number IP-2026-1403 (TRIM project—Target retrofitting in seismic risk mitigation).
Institutional Review Board Statement
Not applicable.
Informed Consent Statement
Not applicable.
Data Availability Statement
The data presented in this study are available upon request from the corresponding author. The data are not publicly available due to privacy restrictions.
Conflicts of Interest
Author Hrvoje Čagalj was employed by the Ekonerg Ltd. The remaining author declares that the research was conducted in the absence of any commercial or financial relationships that could be construed as a potential conflict of interest.
References
- Šavor Novak, M.; Uroš, M.; Demšić, M.; Jevtić Rundek, R.; Pilipović, A.; Atalić, J. Detailed Structural Typology of Existing Substandard Masonry and Reinforced Concrete Buildings in the City of Zagreb, Croatia. Buildings 2024, 14, 3644. [Google Scholar] [CrossRef] [Scilit]
- Šavor Novak, M.; Atalić, J.; Uroš, M.; Prevolnik, S.; Nastev, M. Seismic Risk Reduction in Croatia: Mitigating the Challenges and Grasping the Opportunities. In Proceedings of the Scientific Symposium Future Trends in Civil Engineering, Zagreb, Croatia, 17 October 2019; pp. 71–109. [Google Scholar] [CrossRef] [Scilit]
- Socialist Federal Republic of Yugoslavia (SFRY) Official. Ordinance on Temporary Technical Regulations for Construction in Seismic Areas (in Croatian: Pravilnik o privremenim tehničkim propisima za građenje u seizmičkim područjima); Journal No. 39/64 (in Croatian: Službeni list SFRJ 39/64); Socialist Federal Republic of Yugoslavia: Belgrade, Yugoslavia, 1964. [Google Scholar]
- Socialist Federal Republic of Yugoslavia (SFRY) Official. Ordinance on Technical Standards for the Construction of Buildings in Seismic Areas (in Croatian: Pravilnik o tehničkim normativima za izgradnju objekata visokogradnje u seizmičkim područjima); Journal Nos. 31/81, 49/82, 29/83, 21/88, 52/90 (in Croatian: Službeni list SFRJ 31/81, 49/82, 29/83, 21/88, 52/90); Socialist Federal Republic of Yugoslavia: Belgrade, Yugoslavia, 1981. [Google Scholar]
- EN 1998-1:2004; Eurocode 8: Design of Structures for Earthquake Resistance—Part 1: General Rules, Seismic Actions and Rules for Buildings. European Committee for Standardization (CEN): Brussels, Belgium, 2004.
- Uroš, M.; Prevolnik, S.; Šavor Novak, M.; Atalić, J. Seismic Performance Assessment of an Existing RC Wall Building with Irregular Geometry: A Case-Study of a Hospital in Croatia. Appl. Sci. 2020, 10, 5578. [Google Scholar] [CrossRef] [Scilit]
- Computers and Structures, Inc. PERFORM-3D: Components and Elements; Computers and Structures, Inc.: Berkeley, CA, USA, 2024. [Google Scholar]
- NIST GCR 17-917-45; Recommended Modeling Parameters and Acceptance Criteria for Nonlinear Analysis in Support of Seismic Evaluation, Retrofit, and Design. National Institute of Standards and Technology (NIST): Gaithersburg, MD, USA, 2017. [CrossRef] [Scilit]
- Lowes, L.N.; Lehman, D.E.; Baker, C. Recommendations for Modeling the Nonlinear Response of Slender Reinforced Concrete Walls Using PERFORM-3D. In Proceedings of the 2016 SEAOC Convention, Maui, HI, USA, 12–15 October 2016; pp. 1–18. [Google Scholar]
- Ugalde, D.; Parra, P.F.; López-García, D. Assessment of the Seismic Capacity of Tall Wall Buildings Using Nonlinear Finite Element Modeling. Bull. Earthq. Eng. 2019, 17, 6565–6589. [Google Scholar] [CrossRef] [Scilit]
- HRN EN 1998-3:2025; Eurocode 8—Design of Structures for Earthquake Resistance—Part 3: Assessment and Retrofitting of Buildings and Bridges. Croatian Standards Institute (HZN): Zagreb, Croatia, 2025.
- Powell, G.H. Modeling of Coupling Beams in Shear Walls. CSI Knowledge Base, Computers and Structures, Inc.. 2013. Available online: https://web.wiki.csiamerica.com/wiki/spaces/perform/pages/1474944/Modeling+of+coupling+beams+in+shear+walls (accessed on 27 July 2026).
- Computers and Structures, Inc. Section Designer Manual; Computers and Structures, Inc.: Berkeley, CA, USA, 2000. [Google Scholar]
- Uroš, M.; Atalić, J.; Šavor Novak, M.; Demšić, M. Earthquake Vulnerability of the Three Most Common Types of Reinforced Concrete Structures in Croatia. In Proceedings of the 7th fib Congress, Structural Concrete 2050: Towards Carbon Neutrality, AI Design, and Robotic Construction, Lisbon, Portugal, 15–19 June 2026; pp. 1964–1974. [Google Scholar]
- ASCE/SEI 41-23; Seismic Evaluation and Retrofit of Existing Buildings. American Society of Civil Engineers (ASCE): Reston, VA, USA, 2023. [CrossRef] [Scilit]
- EN 1992-1-1:2023; Eurocode 2—Design of Concrete Structures—Part 1-1: General Rules and Rules for Buildings, Bridges and Civil Engineering Structures. CEN: Brussels, Belgium, 2023.
- HRN EN 1998-1-1:2024; Eurocode 8—Design of Structures for Earthquake Resistance—Part 1-1: General Rules and Seismic Action. Croatian Standards Institute (HZN): Zagreb, Croatia, 2024.
- Powell, G.H. Modeling for Structural Analysis: Behavior and Basics; Computers and Structures, Inc.: Berkeley, CA, USA, 2010; ISBN 978-0-923907-88-4. [Google Scholar]
- HRN EN 10025-2:2019; Hot Rolled Products of Structural Steels—Part 2: Technical Delivery Conditions for Non-Alloy Structural Steels. Croatian Standards Institute (HZN): Zagreb, Croatia, 2019.
- Čagalj, H.; Kišiček, T.; Uroš, M. Ductility of Reinforced Concrete Walls with Composite Cross-Sections. Građevinar 2025, 77, 671–685. [Google Scholar] [CrossRef] [Scilit]
Disclaimer/Publisher’s Note: The statements, opinions and data contained in all publications are solely those of the individual author(s) and contributor(s) and not of MDPI and/or the editor(s). MDPI and/or the editor(s) disclaim responsibility for any injury to people or property resulting from any ideas, methods, instructions or products referred to in the content. |
© 2026 by the authors. Licensee MDPI, Basel, Switzerland. This article is an open access article distributed under the terms and conditions of the Creative Commons Attribution (CC BY) license.