


Abstract
Analyzing nationwide electricity consumption is challenged by data volume and regional heterogeneity. This study proposes a deterministic non-Euclidean representation framework using symmetric relative deviation. By transforming raw consumption into bounded relative deviations and discretizing them into usage states, the framework achieves aggregation-robust behavioral analysis. Validated on approximately 330 million smart meter records from Taiwan, the representation preserves structural coherence under large-scale aggregation. Evaluations using classification and regression trees and C5.0 demonstrate stable classification behavior, while regression-based reconstruction in the archived complete-case domain yields a stable fit (R2 = 0.92). An additional sensitivity check identifies approximately 0.47% extreme upper-tail observations that disproportionately influence squared-error statistics; thus, this R2 is interpreted as a domain-specific explanatory measure rather than full-distribution predictive performance. The results support the framework’s scalability for nationwide energy analytics.
1. Introduction
To achieve national sustainable energy objectives, including the renewable energy targets outlined in Taiwan’s Sustainable Energy Policy Framework, the government has actively promoted the deployment of Smart Meter Infrastructure through successive policy initiatives [1,2,3,4]. These efforts have significantly accelerated the large-scale installation of Advanced Metering Infrastructure (AMI), enabling the continuous collection of high-resolution electricity consumption data across diverse regions and customer types. As a result, smart meter data has emerged as a critical foundation for modern power system analytics, supporting applications such as peak load management, demand-side management, and nationwide operational planning [3,5]. However, the unprecedented scale, regional heterogeneity, and magnitude imbalance inherent in nationwide smart meter datasets introduce fundamental analytical challenges that extend beyond data availability alone. While the increasing availability of smart meter data has motivated extensive research on nationwide load forecasting, achieving scalable, robust, and structurally stable modeling remains difficult in practice. Conventional clustering and forecasting approaches based on Euclidean distance metrics, including K-means and its variants, are widely adopted due to their computational simplicity [6,7]. Nevertheless, recent comparative studies on smart meter time series have demonstrated that the choice of distance representation plays a decisive role in clustering robustness and downstream analytical reliability, particularly under large-scale and heterogeneous data conditions [8]. Under nationwide aggregation, Euclidean distance–based approaches frequently exhibit unstable clustering behavior and degraded predictive reliability when applied across geographically diverse regions and temporal patterns [9,10]. These observations suggest that clustering and forecasting models validated under localized or restricted settings may not generalize reliably to nationwide applications. However, when analyzing extremely large smart meter datasets such as nationwide AMI deployments, computational scalability becomes a critical concern, as many clustering approaches require extensive pairwise distance computations or neighborhood searches that are difficult to apply directly to nationwide datasets containing hundreds of millions of records.
To address these limitations, alternative load modeling and clustering strategies have been proposed to emphasize behavioral heterogeneity rather than absolute consumption magnitude. Bottom-up and segmentation-based load analysis studies have highlighted the importance of capturing heterogeneous usage patterns when aggregating electricity demand at scale [10]. Subsequent investigations further indicate that appropriate distance or dissimilarity representations are essential for achieving structurally coherent clustering outcomes and stable analytical behavior in smart meter data analysis [7,8]. In parallel, categorical factor conditioning has been widely employed in energy and economic systems to represent latent behavioral structures and to enhance model robustness under high-dimensional and heterogeneous data environments [9,11].
Building upon these insights, an integrated analytics framework is developed in this study for electricity consumption behavior identification based on a non-Euclidean distance metric, namely symmetric relative deviation (SRD), which characterizes relative consumption behavior while mitigating sensitivity to absolute magnitude differences [12,13]. The SRD-based formulation demonstrated improved structural stability in identifying localized consumption patterns. However, structural coherence observed under localized conditions does not necessarily imply robustness or analytical reliability when extended to nationwide aggregation, where scale and heterogeneity effects become substantially more pronounced.
The mathematical formulation of the usage function employed in this study originates from the authors’ prior doctoral research [14]. The present study substantially extends this formulation by integrating the usage function into a nationwide analytical framework and evaluating its behavior through newly conducted large-scale regression and factor-conditioning experiments. In contrast to earlier studies that primarily focused on clustering validation, the present study shifts the analytical emphasis toward examining representation consistency, scalability, and explanatory capability under nationwide aggregation. The regression modeling, categorical variable encoding, and comprehensive evaluation conducted on approximately 330 million smart meter records constitute new empirical contributions beyond the original doctoral study.
Accordingly, this study extends the previously proposed localized SRD-based framework into a nationwide energy analytics pipeline. An officially authorized dataset comprising approximately 330 million high-resolution electricity consumption records collected from the Taiwan Power Company is employed for systematic evaluation. The proposed framework adopts a two-stage analytical architecture. First, electricity consumption behaviors are transformed into aggregation-robust usage states using the SRD-based non-Euclidean representation, alleviating the limitations of magnitude-sensitive Euclidean clustering. Second, categorical factor encoding is applied as an enhancement mechanism to examine its effect on explanatory stability under nationwide aggregation [11]. Extensive experimental evaluations reveal a substantial structural and performance gap between conventional Euclidean-based approaches and the proposed framework. While Euclidean clustering–based baselines exhibit unstable convergence behavior and inconsistent explanatory outcomes at large scale [8,9], the proposed non-Euclidean usage state representation demonstrates stable classification behavior and consistent explanatory capability when evaluated using CART and C5.0 decision tree models. These results indicate that the primary advantage of the proposed framework lies not in isolated improvements in forecasting accuracy but in its ability to preserve coherent behavioral structure.
The developed framework for nationwide energy analytics reformulates and extends a usage function–based representation to support electricity consumption analysis using large-scale smart meter data. Building on this foundation, large-scale regression experiments and categorical factor encoding were conducted using 330 million smart meter records, demonstrating improved stability under extreme aggregation. Evaluation results show that the framework preserves structural coherence and robustness more effectively than conventional Euclidean baselines at nationwide scale. Through the scalability and structural stability of the non-Euclidean representation under nationwide aggregation, the framework maintains consistent analytical behavior when extended from localized settings to conditions involving very large and heterogeneous datasets. The emphasis is placed on representation consistency, computational scalability, and practical explanatory feasibility. A detailed theoretical analysis of categorical conditioning and variance decomposition lies beyond the scope of this conference paper and will be addressed in a future journal version.
2. Materials and Methods
2.1. Usage Function Definition
Given the extremely large scale of the smart meter dataset analyzed in this study, the proposed framework emphasizes computational scalability and practical feasibility under nationwide energy analytics scenarios. To construct a scale-invariant clustering mechanism for large-scale electricity consumption data, the proposed method computes the average electricity consumption within a predefined spatial and temporal window. This average value is treated as a local reference point to normalize consumption behaviors across heterogeneous regions. Prior studies on smart meter data analysis have shown that relative or non-Euclidean representations are more effective than absolute Euclidean distances when dealing with heterogeneous load magnitudes and high-dimensional time series [8,15]. The resulting usage function is employed to induce a finite behavioral state space for structural analysis, rather than serving as an exogenous predictive feature for direct load forecasting. Let P(t) denote the electricity consumption at time t, and let represent the average electricity consumption over the sampled region and period. The usage function α(t) is defined as Equation (1):
The usage function captures the relative deviation of electricity consumption from the local mean, enabling scale-invariant representation. This formulation expresses electricity consumption in relative terms and mitigates sensitivity to absolute magnitude differences across regions with distinct load scales.
2.2. Usage-Based Clustering Formulation
Based on the usage function, electricity consumption values are characterized by their relative deviation from the local mean, yielding a scale-invariant representation across heterogeneous load profiles. For a given usage ratio, the corresponding consumption behavior is mapped to a usage state according to predefined structural conditions, as described below. This formulation defines a deterministic mapping from relative consumption deviation to a finite usage state space, rather than a continuous predictive variable for direct regression. For positive usage conditions (αi ≥ 0) consumption exceeds the local mean and is defined by Equation (2):
For negative usage conditions (αi < 0) consumption falls below the local mean and is defined by Equation (3):
These two conditions are used to model electricity consumption behaviors above and below the local mean, enabling consistent representation across heterogeneous load profiles.
2.3. Usage Function-Based Clustering Algorithm
Representative regions and peak time periods are selected to establish baseline consumption characteristics for usage state construction. A predefined set of usage ratios is divided into positive and negative groups and aggregated into hierarchical usage state levels. This design is consistent with prior findings that appropriate partitioning strategies and distance representations are essential for achieving structurally stable outcomes under heterogeneous smart meter data conditions [8,15]. The documented state-construction procedure is summarized in Algorithm 1; the empirical regression diagnostics use the archived LEVEL implementation available in the analytical dataset.
| Algorithm 1. Usage State Construction Procedure |
| Input: Electricity consumption data P(t) Output: Usage state–labeled electricity consumption profiles |
|
2.4. Computational Complexity
The resulting usage states serve as behavioral abstractions for structural analysis and scalability evaluation, rather than as input features for direct predictive regression. The proposed algorithm requires a single pass through the dataset to compute the local mean and usage function values, resulting in a time complexity of O(N), where N is the number of electricity consumption records. Threshold determination incurs constant-time overhead, and usage state assignment involves a bounded number of comparisons. The overall computational complexity remains linear, making the proposed method well suited for nationwide electricity big data analytics and large-scale energy analysis applications [9].
3. Results
The present study focuses on evaluating the scalability and structural stability of the proposed usage state representation framework under increasing spatial and temporal aggregation [13]. Specifically, the analysis is extended from multiple representative regions and time periods to intermediate and nationwide aggregation levels.
3.1. Stage-1: Clustering Validation and Scalability
Localized clustering experiments are included solely as a consistency check and are not intended to reproduce or re-validate localized clustering performance previously reported [13]. Rather than serving as a primary contribution, this stage aims to verify that the proposed usage function–based representation framework maintains structurally coherent behavior under controlled regional and temporal settings before large-scale aggregation. Representative regions and time periods are selected to evaluate clustering behavior under limited spatial and temporal scopes. Under these localized conditions, the usage function–based framework consistently produces stable and interpretable usage state assignments, whereas conventional K-means clustering exhibits structural inconsistency and sensitivity to initialization. The observed consistency confirms that the proposed framework preserves its structural properties when applied to subsets of the data. The corresponding consistency verification results are summarized in Table 1.
Table 1.
Localized clustering consistency verification.
Under localized regional and temporal settings, the proposed usage function–based clustering exhibits consistent classification behavior across classification and regression trees (CART) and C5.0 models, whereas K-means shows instability. As shown in Table 2, the proposed usage function–based clustering framework consistently preserves structural stability across multiple regions and time periods under increasing spatial and temporal aggregation. In contrast, conventional K-means clustering exhibits fluctuating and unstable behavior as aggregation scope expands. These results indicate that the proposed representation maintains coherent clustering structure beyond localized settings, providing a reliable foundation for subsequent nationwide aggregation analysis and large-scale evaluation.
Table 2.
Multi-region clustering stability verification.
Across all examined scenarios, the usage function–based clustering framework consistently preserves coherent cluster structures and classification outcomes. These results confirm that the proposed representation remains structurally stable under varying regional characteristics and temporal conditions. Importantly, this stage does not aim to demonstrate superior localized performance over K-means, as such behavior has been established in prior studies. Instead, the results serve to verify methodological soundness and to establish a reliable basis for subsequent analyses under increased spatial and temporal aggregation.
3.2. Stage-2: Nationwide Aggregation Evaluation Using Regression-Based Reconstruction
Building upon the representation consistency verified in Stage-1, this stage evaluates nationwide aggregation behavior using regression-based reconstruction as an explanatory diagnostic rather than as a forecasting objective. The analysis is conducted under progressively aggregated settings, ranging from regional and temporal diagnostics to city-level aggregation and full nationwide evaluation. The regression diagnostics evaluate observations with available archived LEVEL assignments.
First, regression-based explanatory fit is examined without categorical factor conditioning to assess the intrinsic explanatory capability of the usage function–based representation. Across individual administrative regions under full temporal aggregation, the resulting R2 values remain within a stable range of approximately 0.68 to 0.89. Hourly diagnostics conducted across all regions further indicate that R2 values fluctuate mildly between approximately 0.70 and 0.76 over the 24 h cycle, with no systematic degradation observed at specific time periods. These results demonstrate that the proposed representation preserves stable explanatory behavior across both spatial and temporal dimensions without requiring dimensionality reduction. Next, the effect of categorical factor conditioning is evaluated as an enhancement mechanism under highly heterogeneous urban environments, using all-period datasets for New Taipei City and Taipei City. Without categorical conditioning, the usage function–based representation already achieves stable explanatory performance, with an R2 of 0.7139 for New Taipei City. After incorporating categorical structural factors, R2 increases substantially to 0.922, accompanied by a reduction in RMSE to 53.46294 Wh. A similar enhancement is observed for Taipei City, where the categorically conditioned model achieves an R2 of 0.9161 with a root mean square error (RMSE) of 59.011 Wh.
These results indicate that categorical factor conditioning can significantly enhance explanatory precision under highly heterogeneous urban conditions, without being a prerequisite for the stability or scalability of the proposed representation framework. Table 3 summarizes the effect of categorical factor conditioning on city-level evaluation results under full temporal aggregation.
Table 3.
City-level regression-based reconstruction performance.
For conventional K-means clustering, regression-based reconstruction outcomes vary across runs, with R2 values ranging from 0.43 to 0.81 and RMSE values of approximately 250–386 Wh, reflecting sensitivity to initialization. In contrast, the usage function–based clustering framework yields R2 values of 0.9216–0.9218 and RMSE values around 53.46 Wh with minimal run-to-run variation. The nationwide 90/10 evaluation is summarized in Table 4. An additional same-seed sensitivity diagnostic showed that approximately 99.53% of observations formed the dominant non-upper-tail complete-case domain, whereas approximately 0.47% formed an extreme upper tail that contributed 91.48% of total squared error. Thus, R2 ≈ 0.92 is retained as a domain-specific explanatory fit for the complete-case majority and is not generalized to full-distribution tail performance.
Table 4.
Nationwide regression-based reconstruction performance.
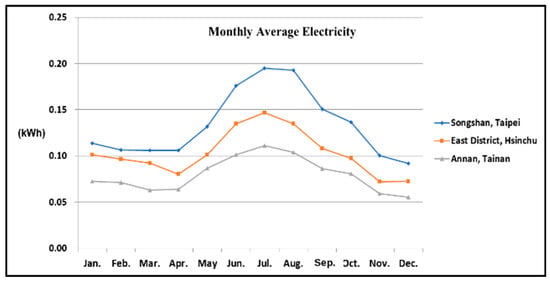
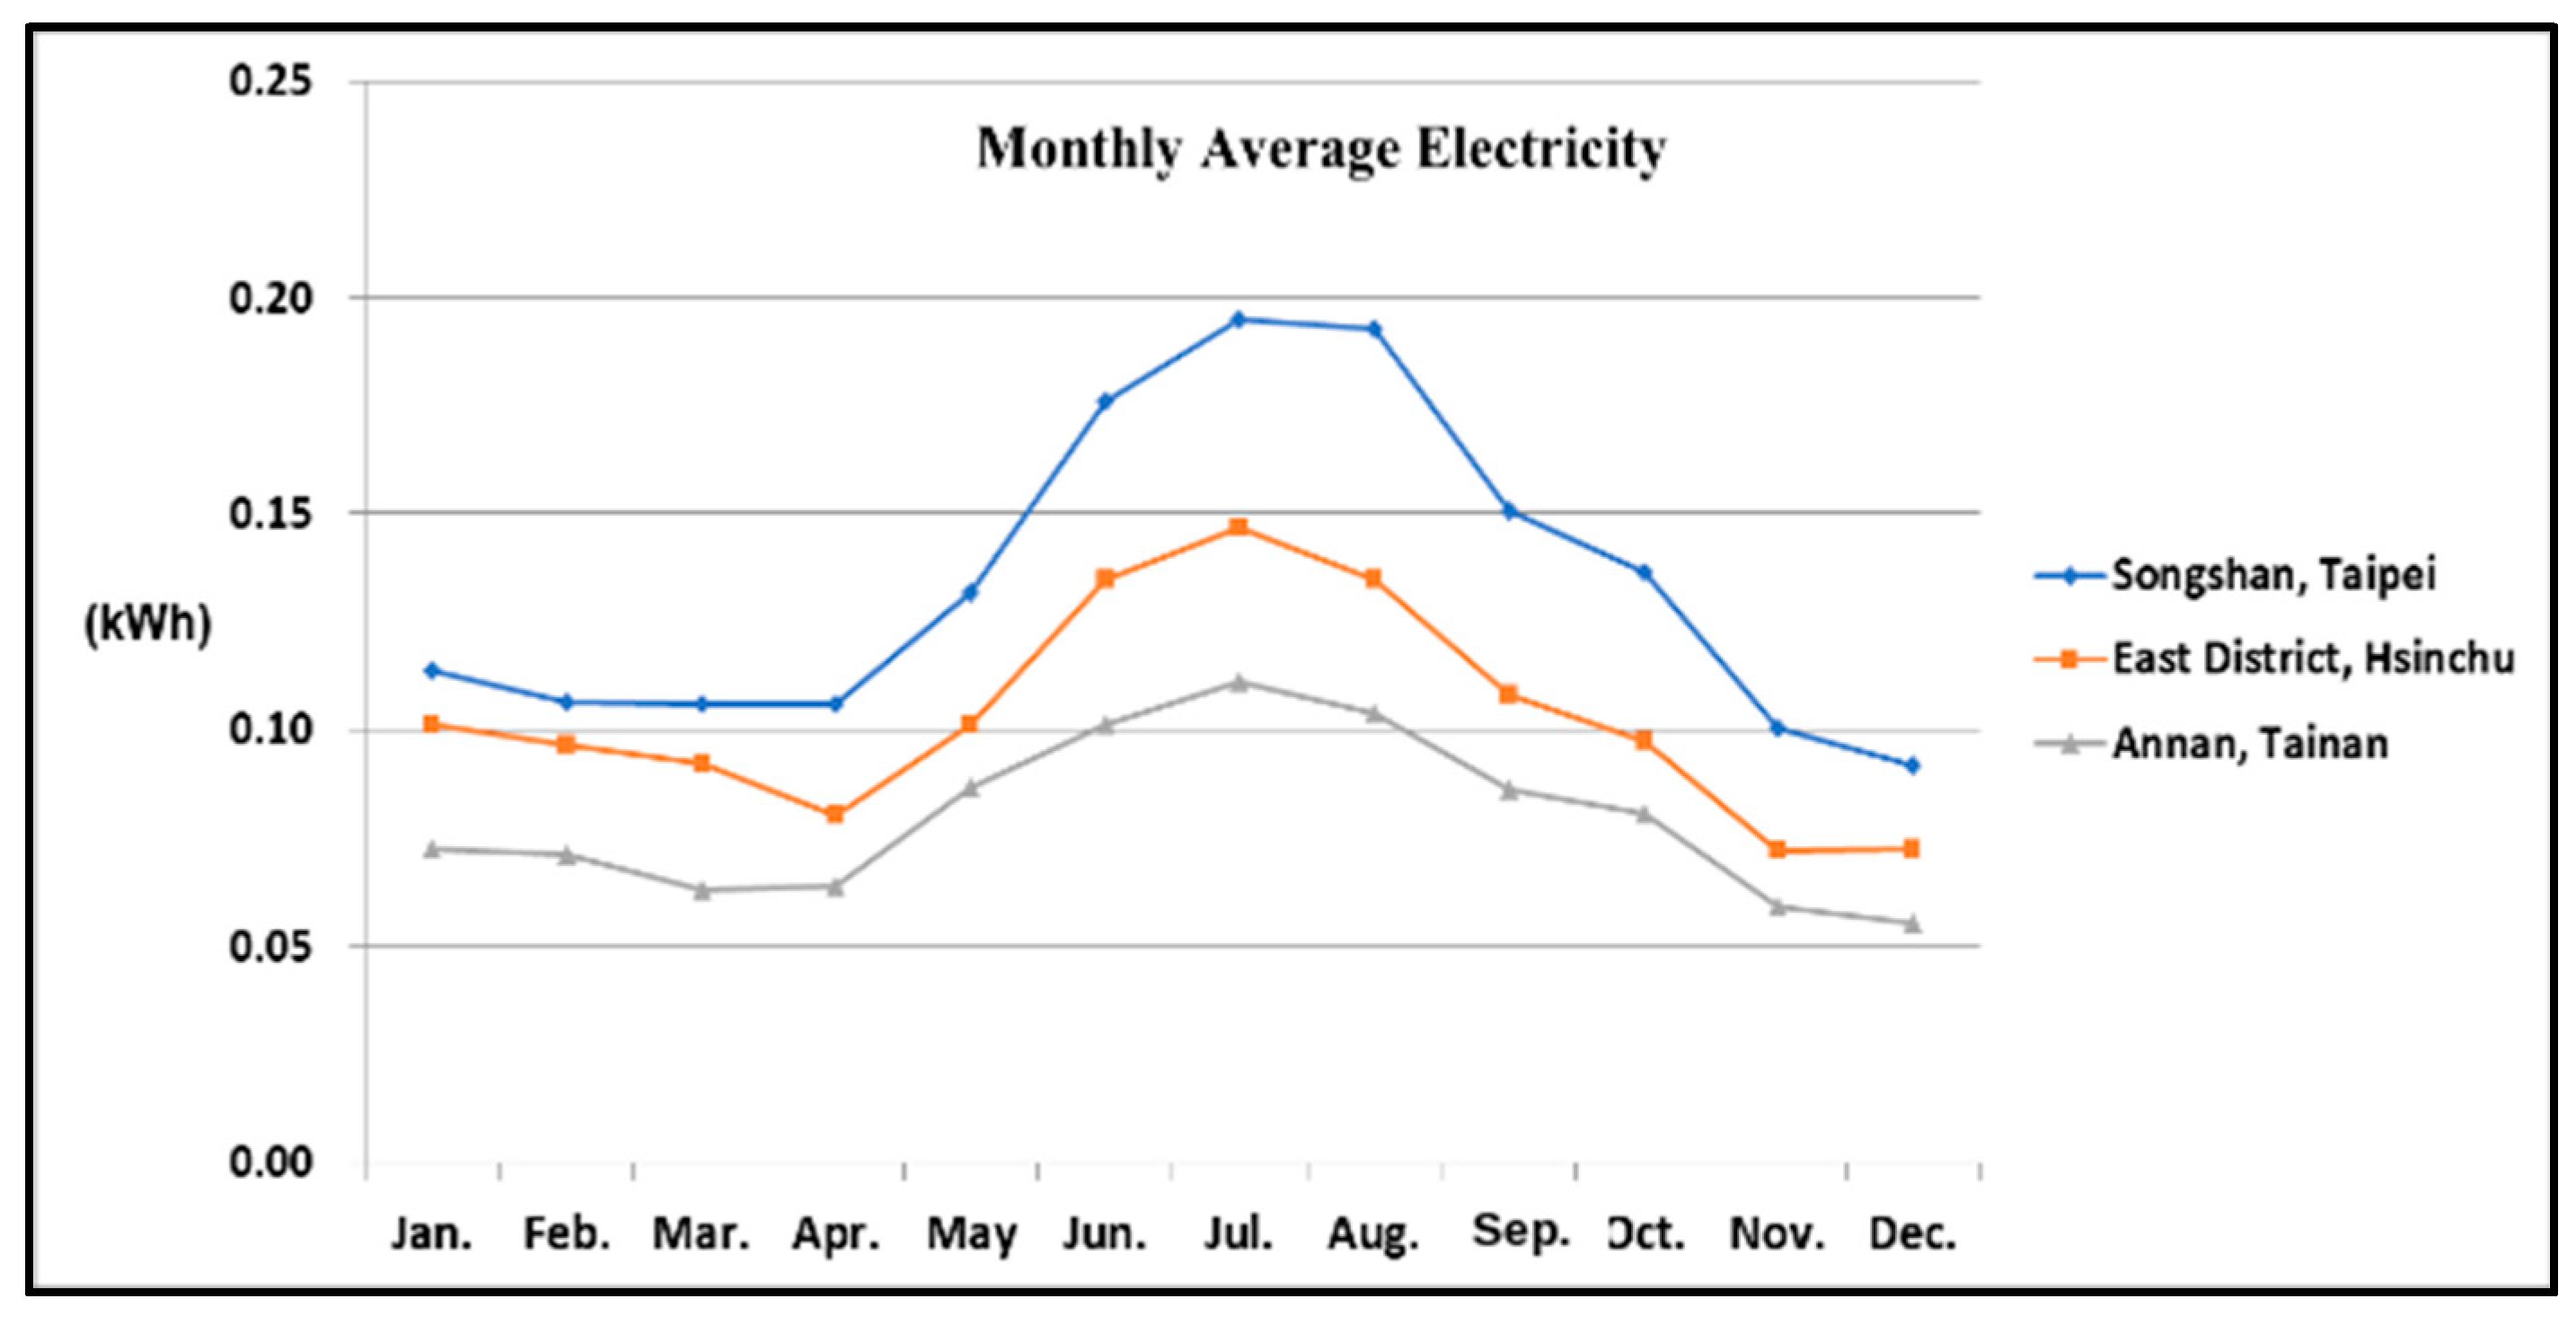
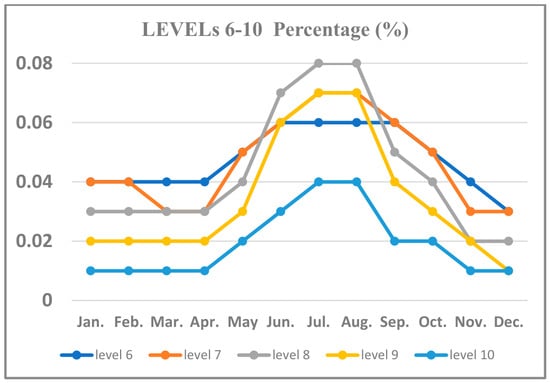
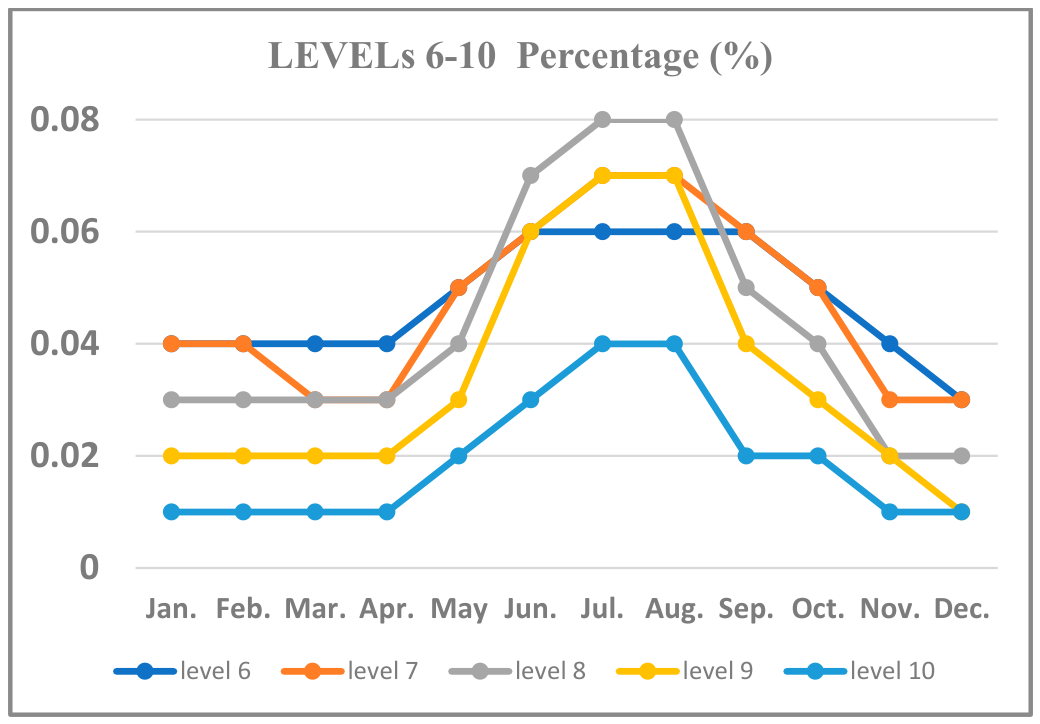
One-way analysis of variance (ANOVA) is conducted across three analytical dimensions, including seasonal (monthly), contextual (e.g., spatial or temporal), and large-sample aggregated conditions. In particular, the monthly analysis yields a highly significant result (F = 187.64, p < 0.001), indicating that seasonal variation is a dominant factor influencing electricity consumption behavior, where lower usage levels decrease while higher usage levels increase during peak demand periods. In comparison, the second analytical dimension (F = 28.75, p < 0.001) also shows significant differences, although with relatively higher within-group variance. Furthermore, the large-sample ANOVA (N = 240) produces an exceptionally high F-statistic (F = 491.76, p < 0.001), indicating extremely stable and strong structural differences across usage levels. Figure 1 presents the monthly trend of average electricity consumption, while Figure 2 shows the proportional distribution of higher usage levels (Levels 6–10). The synchronized upward trend observed in both figures indicates that the increase in total electricity consumption is primarily driven by a compositional shift toward higher usage levels, rather than uniform scaling across all users. This confirms that the proposed non-Euclidean usage state representation framework is capable of capturing not only magnitude variations but also structural transitions in consumption behavior, which cannot be effectively represented under conventional Euclidean-based approaches.
Figure 1.
Monthly average electricity consumption across representative regions.
Figure 2.
Proportional distribution of higher usage levels (Levels 6–10) across 12 months.
4. Discussion
The consistency verification conducted in Stage-1 confirms that the proposed representation preserves coherent structural behavior under localized regional and temporal settings. These experiments demonstrate that the induced usage states remain structurally stable before large-scale aggregation. The evaluation results in Stage-2 indicate that the usage function–based representation provides explanatory capability across both spatial and temporal dimensions. The observed stability of R2 values across administrative regions and hourly partitions suggests that the proposed representation captures essential consumption regularities. Categorical factor conditioning, when introduced at the city level, further improves performance under highly heterogeneous urban environments. The substantial improvements observed in metropolitan datasets suggest that categorical structural representations are particularly effective in dense consumption scenarios. Importantly, these results also demonstrate that such conditioning is not a prerequisite for the stability or scalability of the proposed framework.
At the nationwide aggregation level, the contrast between the proposed framework and conventional K-means clustering becomes particularly pronounced. While Euclidean-based clustering exhibits significant variability across repeated experiments, the usage function–based representation consistently maintains stable explanatory behavior with minimal variation. This robustness indicates that the proposed representation is inherently less sensitive to aggregation-induced distortions. By providing a consistent usage-based representation across multiple scales, the proposed framework offers a robust analytical foundation for nationwide energy consumption analysis. Regression-based evaluation is used here as an explanatory diagnostic rather than as direct predictive validation. The high complete-case R2 applies to the dominant non-upper-tail domain; extreme-load fidelity must be assessed from raw telemetry. In addition, while the SRD-based representation demonstrates strong empirical stability, its theoretical properties have not yet been fully formalized. Further studies are required to formalize the mathematical properties of the proposed representation using non-Euclidean topology and functional analysis, as well as extending its applicability to broader large-scale energy-analysis settings. The statistically significant differences observed across monthly dimensions confirm that seasonal effects induce systematic redistribution of users from lower to higher usage levels.
5. Conclusions
This study develops a usage function–based clustering framework for large-scale electricity consumption analysis and systematically examines its structural consistency, scalability, and robustness under increasing spatial and temporal aggregation. Through a two-stage evaluation process, the proposed framework is shown to preserve coherent usage-based representations under localized regional and temporal settings and to maintain stable explanatory behavior when extended to nationwide aggregation. Experimental results demonstrate that the proposed usage-based representation provides sufficient intrinsic explanatory capability without requiring dimensionality reduction or extensive factor conditioning.
Whereas categorical factor conditioning can serve as an effective enhancement under highly heterogeneous urban environments, the stability and scalability of the proposed framework do not depend on such extensions. In contrast to conventional Euclidean distance–based clustering methods, the proposed framework exhibits markedly reduced sensitivity to initialization and aggregation effects, resulting in robust and reproducible analytical behavior at nationwide scale. The developed framework enables a stable, interpretable, and scalable usage-based system. Across multiple spatial and temporal scales, the framework provides a reproducible analytical foundation for nationwide electricity-consumption structure. The reported R2 values characterize the dominant complete-case domain rather than full-distribution predictive accuracy; raw telemetry remains necessary for extreme upper-tail events. Future work will examine categorical conditioning and variance decomposition through formal theoretical analysis to provide a rigorous explanation for the observed aggregation robustness and explanatory behavior under nationwide conditions.
Funding
This research received no external funding.
Institutional Review Board Statement
Not applicable.
Informed Consent Statement
Not applicable.
Data Availability Statement
Data sharing is not applicable to this article due to privacy and contractual restrictions with the Taiwan Power Company.
Acknowledgments
The author thanks Taiwan Power Company (Taipower) for providing the original smart-meter data during its competition.
Conflicts of Interest
The author declares no conflicts of interest.
References
- Executive Yuan; Taiwan. Sustainable Energy Policy Framework. Available online: https://www.ey.gov.tw/Page/9277F759E41CCD91/6f0faa1c-9406-48d0-97aa-78ccea4f3f02 (accessed on 21 October 2026). (In Chinese)
- Ministry of Economic Affairs (MOEA), Taiwan. Energy Transition Promotion Scheme. Available online: https://www.moea.gov.tw/mns/English/Policy/Policy.aspx?menu_id=32904&policy_id=32 (accessed on 21 October 2026).
- Taiwan Power Company. 2024 Sustainability Report. Available online: https://www.taipower.com.tw/mag/Sustainability_en/2024Sustainability.pdf (accessed on 21 October 2026).
- Energy Administration; Ministry of Economic Affairs; Taiwan. Smart Grid Master Plan (Revised February 2020). Available online: https://www.moeaea.gov.tw/ECW/main/content/wHandEditorFile.ashx?file_id=5767 (accessed on 21 October 2026).
- Taiwan Power Company. Smart Grid Data Analytics and AMI Deployment. Available online: https://service.taipower.com.tw/smartgrid/DataAnalytics/Index (accessed on 21 October 2026).
- Arthur, D.; Vassilvitskii, S. k-means++: The advantages of careful seeding. In Proceedings of the 18th Annual ACM-SIAM Symposium on Discrete Algorithms (SODA), New Orleans, LA, USA, 7–9 January 2007; pp. 1027–1035. [Google Scholar]
- Chicco, J. Overview and performance assessment of the clustering methods for electrical load pattern grouping. Energy 2012, 42, 68–80. [Google Scholar] [CrossRef] [Scilit]
- Yerbury, L.W.; Campello, R.J.G.B.; Livingston, G.C., Jr.; O’Neil, L. Comparing clustering approaches for smart meter time series: Investigating the influence of dataset properties on performance. arXiv 2024, arXiv:2412.02026. [Google Scholar]
- Hong, T.; Fan, S. Probabilistic electric load forecasting: A tutorial review. Int. J. Forecast. 2016, 32, 914–938. [Google Scholar] [CrossRef] [Scilit]
- Kwac, J.; Flora, J.; Rajagopal, R. Household energy consumption segmentation using hourly data. IEEE Trans. Smart Grid 2014, 5, 420–430. [Google Scholar] [CrossRef] [Scilit]
- Bai, J.; Ng, S. Determining the number of factors in approximate factor models. Econometrica 2002, 70, 191–221. [Google Scholar] [CrossRef] [Scilit]
- Peng, B.-Y.; Luo, S.-Y.; Lee, Z.-J.; Chou, S.-T. A cluster model applied to power consumption. In Proceedings of the 2019 IEEE 2nd International Conference on Knowledge Innovation and Invention (ICKII), Seoul, Republic of Korea, 12–15 July 2019; pp. 458–461. [Google Scholar] [CrossRef] [Scilit]
- Peng, B.-Y.; Chou, S.-T.; Lee, C.-Y.; Chu, K.-C.; Natsuki, S.; Lee, Z.-J. An integrated analytics model applied to power consumption. In Proceedings of the 2018 10th International Conference on Advanced Computational Intelligence (ICACI), Xiamen, China, 29–31 March 2018; pp. 370–373. [Google Scholar] [CrossRef] [Scilit]
- Peng, B.-Y. A Mathematical Model in Big Data Analysis. Ph.D. Dissertation, Huafan University, New Taipei City, Taiwan, 2022. [Google Scholar]
- Alonso, A.M.; Nogales, F.J.; Ruiz, C. Hierarchical clustering for smart meter electricity loads based on quantile autocovariances. arXiv 2019, arXiv:1911.03336. [Google Scholar]

Disclaimer/Publisher’s Note: The statements, opinions and data contained in all publications are solely those of the individual author(s) and contributor(s) and not of MDPI and/or the editor(s). MDPI and/or the editor(s) disclaim responsibility for any injury to people or property resulting from any ideas, methods, instructions or products referred to in the content. |
© 2026 by the author. Licensee MDPI, Basel, Switzerland. This article is an open access article distributed under the terms and conditions of the Creative Commons Attribution (CC BY) license.