


Abstract
This paper presents an edge-ready Operational Resilience Index (ORI) for motor-driven agroindustrial systems that integrates condition monitoring, backup-power behavior, and energy performance into one decision variable. Three independent field datasets were harmonized: 53 labeled machine-fault cases, 10 automatic transfer switch (ATS) events at 60%, 80%, and 100% load, and a before-and-after motor-control optimization campaign. Six indicators—unplanned downtime, daily energy use, power factor, ATS transfer time, voltage deviation, and frequency deviation—were retained because they represent direct operational consequences, are available as comparable scalar measurements, and can be computed locally. After normalization, the indicators were combined using transparent engineering weights. Fault detection reached 94.34% (50/53); downtime decreased from 80 to 58 h, energy use from 18.5 to 15.7 kWh/day, and power factor improved from 0.78 to 0.92. ORI increased from 35.10, 32.41, and 29.03 to 46.88, 44.18, and 40.81 at 60%, 80%, and 100% load, respectively. Across 20,000 uncertainty runs, the integrated configuration remained superior. Weight, normalization-constant, and indicator-exclusion sensitivity tests also preserved a positive ORI gain. This pilot study demonstrates the feasibility of cross-domain edge aggregation but requires prospective validation with synchronized data before general deployment.
1. Introduction
Motor-driven systems are central to agroindustrial processes such as pumping, refrigeration, conveying, mixing, aeration, and ventilation. In this study, operational resilience is defined as the capacity of a motor-driven production system to sustain or rapidly recover its required function after equipment faults, supply interruptions, or efficiency degradation while maintaining acceptable electrical and energy performance. This systems-level concept extends beyond reliability alone by including disturbance response, recovery, and operating quality [1].
Condition-based maintenance links sensing, diagnosis, and intervention through data acquisition, feature extraction, health assessment, and maintenance decisions [1,2]. Motor-current analysis, vibration, wavelets, and machine-learning methods support the detection of rotor, bearing, imbalance, and nonstationary faults [3,4,5,6,7]. Digital-twin approaches can integrate heterogeneous industrial data [8,9,10], whereas power quality, reliability, standby-power performance, motor efficiency, and energy management are commonly assessed with domain-specific metrics and standards [11,12,13,14,15,16,17,18,19]. Data-driven energy prediction provides a complementary analytics layer [20].
These approaches are valuable but are usually evaluated separately. Small and medium-sized agroindustrial facilities therefore lack a transparent indicator that can combine maintenance consequences, backup-power transients, and energy performance without requiring a high-parameter cloud model. A compact edge implementation is attractive because it preserves local operation, auditability, and low computational cost.
The objective is to evaluate a pilot ORI that combines six variables: unplanned downtime, daily energy use, power factor, ATS transfer time, voltage deviation, and frequency deviation. The variables were screened using operational relevance, availability in the three campaigns, non-redundancy, and edge computability; the detailed selection rationale is given in Section 2.3. The study contributes (i) harmonization of three independent measurement campaigns, (ii) a dimensionless and transparent risk model, (iii) comparison of baseline and integrated operation at three load levels, and (iv) uncertainty and sensitivity analyses for weights, normalization constants, and indicator selection.
2. Materials and Methods
2.1. Study Design and Data Sources
This study integrates three independent engineering campaigns rather than a synchronized experiment. As summarized in Table 1, the machine-condition dataset contained 53 labeled fault cases (20 mechanical unbalance, 18 bearing wear, and 15 electrical faults), of which 50 were detected; unplanned downtime decreased from 80 to 58 h after the monitoring/maintenance program. The backup-continuity dataset comprised 10 controlled outages with a 150 kVA generator and ATS tested at 60%, 80%, and 100% load, recording transfer/interruption time, voltage, and frequency. The motor-control campaign compared operation before and after a hard-wired sequencing optimization, with energy use decreasing from 18.5 to 15.7 kWh/day, power factor increasing from 0.78 to 0.92, and operating time decreasing from 12.0 to 10.1 h/day.
Table 1.
Field datasets and variables used in the integrated analysis.
2.2. Diagnostic, Intervention, and Edge Architecture
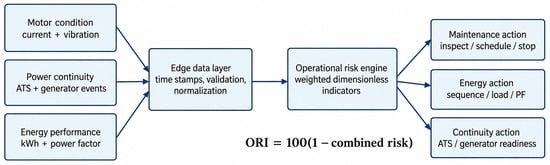
For diagnosis, current and vibration channels were checked for missing values and range consistency, converted to common units, and used to obtain the spectral indicators available in the original campaign. The campaign label was the reference class, and a case was counted as correctly detected when the diagnostic output matched the labeled fault category. Alerts were then used to trigger category-specific inspection and maintenance; because the harmonized dataset contains aggregate outcomes rather than component-level work orders, the intervention effect is represented by the documented change in unplanned downtime, not by reconstructed repair actions. For continuity testing, the event logger and power-quality analyzer recorded ATS transfer time, total interruption, voltage deviation, and frequency deviation during controlled outages. For the motor-control intervention, the revised sequencing reduced unnecessary run time, and daily energy, power factor, and operating time were compared before and after implementation. Figure 1 shows the edge-ready architecture that receives these channels and performs time alignment, validation, unit conversion, risk calculation, and action routing. The final ORI engine intentionally uses six transparent normalized indicators rather than a high-parameter classifier; diagnostic submodules can therefore be updated without changing the supervisory index.
Figure 1.
Edge-ready architecture for integrating machine condition, power continuity, and energy performance into operational actions.
2.3. Variable Selection, Normalization, and Operational Resilience Index
Candidate measurements are listed in Table 1, whereas the six indicators used by the ORI are summarized in Table 2. Selection followed four pilot-study criteria: (1) a direct operational consequence, (2) availability as a comparable scalar measurement in the aggregate datasets, (3) limited redundancy with another retained indicator, and (4) suitability for edge computation. Vibration and spectral features remain in the diagnostic layer but were excluded from the ORI because the available campaigns do not provide matched baseline/integrated scalar values for them. Operating time was not included separately because its effect is already captured by daily energy use and would double-count the control intervention; total interruption time was omitted because it is closely coupled to ATS transfer time. Thus, variable selection was engineering- and literature-guided rather than statistically learned, which is a limitation to be tested prospectively.
Table 2.
ORI indicators, normalization constants, and baseline weights.
The retained variables have different units, so each was mapped to a dimensionless risk. The reference constants in Table 2 are scaling values, not universal compliance limits: 80 h equals the observed baseline downtime; 20 kWh/day is a rounded value above the observed 18.5 kWh/day; and 10 s, 15%, and 3 Hz are rounded upper values above the observed maxima of 6.20 s, 9.87%, and 1.50 Hz, respectively. Power factor is already dimensionless. Equations (1)–(3) define the six partial risks:
rd = Td/80
rE = E/20; rPF = 1 − PF
rt = ttr/10; rV = |ΔV|/15; rf = |Δf|/3
In Equations (1)–(3), T_d is unplanned downtime (h), E is daily energy use (kWh/day), PF is power factor, t_tr is ATS transfer time (s), ΔV is voltage deviation (%), and Δf is frequency deviation (Hz). Equations (4) and (5) define combined operational risk and the ORI:
Rop = Σ wj rj
ORI = 100(1 − Rop)
The baseline weights in Table 2 were assigned a priori using an engineering consequence hierarchy: downtime received the largest weight (0.25) because it directly represents lost production; energy use received 0.20 because it represents a persistent operating burden; power-factor deficit, transfer time, and voltage deviation each received 0.15; and frequency deviation received 0.10 because its observed excursions were smaller and did not cause loss of supply in the test campaign. The weights sum to one and are transparent engineering priors, not fitted coefficients. Higher ORI values indicate lower combined operational risk; the index is intended for comparison within the defined scaling framework, not as a universal compliance rating.
2.4. Statistical and Sensitivity Analysis
The fault-detection proportion is reported with a two-sided Wilson 95% confidence interval. For continuity data, mean and sample standard deviation were calculated at 60%, 80%, and 100% load. The baseline state used 80 h downtime, 18.5 kWh/day, and PF = 0.78; the integrated state used 58 h, 15.7 kWh/day, and PF = 0.92. The same load-specific ATS measurements were applied to both states so that the ORI difference isolates the documented maintenance and motor-control improvements.
Uncertainty was screened with 20,000 runs per load: ATS observations were bootstrapped, downtime was sampled with SD = 2 h, energy with 2% variation, and power factor with SD = 0.01. This is an engineering uncertainty screen, not a metrological calibration. Three structural sensitivity tests were also performed: each weight was varied by ±25% and all weights renormalized; each normalization constant (80 h, 20 kWh/day, 10 s, 15%, and 3 Hz) was varied by ±25% one at a time; and each ORI indicator was removed one at a time with the remaining weights renormalized. These tests assess whether the comparative conclusion depends on the selected weights, scaling constants, or indicator set.
3. Results
3.1. Diagnostic and Operational Performance
The condition-monitoring dataset yielded 94.34% overall detection accuracy (50/53; Wilson 95% CI: 84.63–98.06%). Class-specific accuracies were 95.0% for mechanical unbalance, 94.4% for bearing wear, and 93.3% for electrical faults. Given the small sample, these values are descriptive rather than evidence of broad classifier generalization. More importantly for the operational analysis, unplanned downtime decreased from 80 to 58 h after the monitoring/maintenance program.
The motor-control program reduced daily energy use by 15.2% and operating time by 15.8%; power factor increased from 0.78 to 0.92. These changes reduced the energy-related contribution to the combined operational risk.
3.2. Load-Dependent Backup-Power Behavior
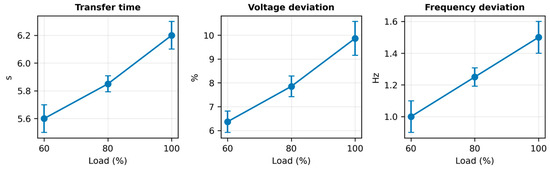
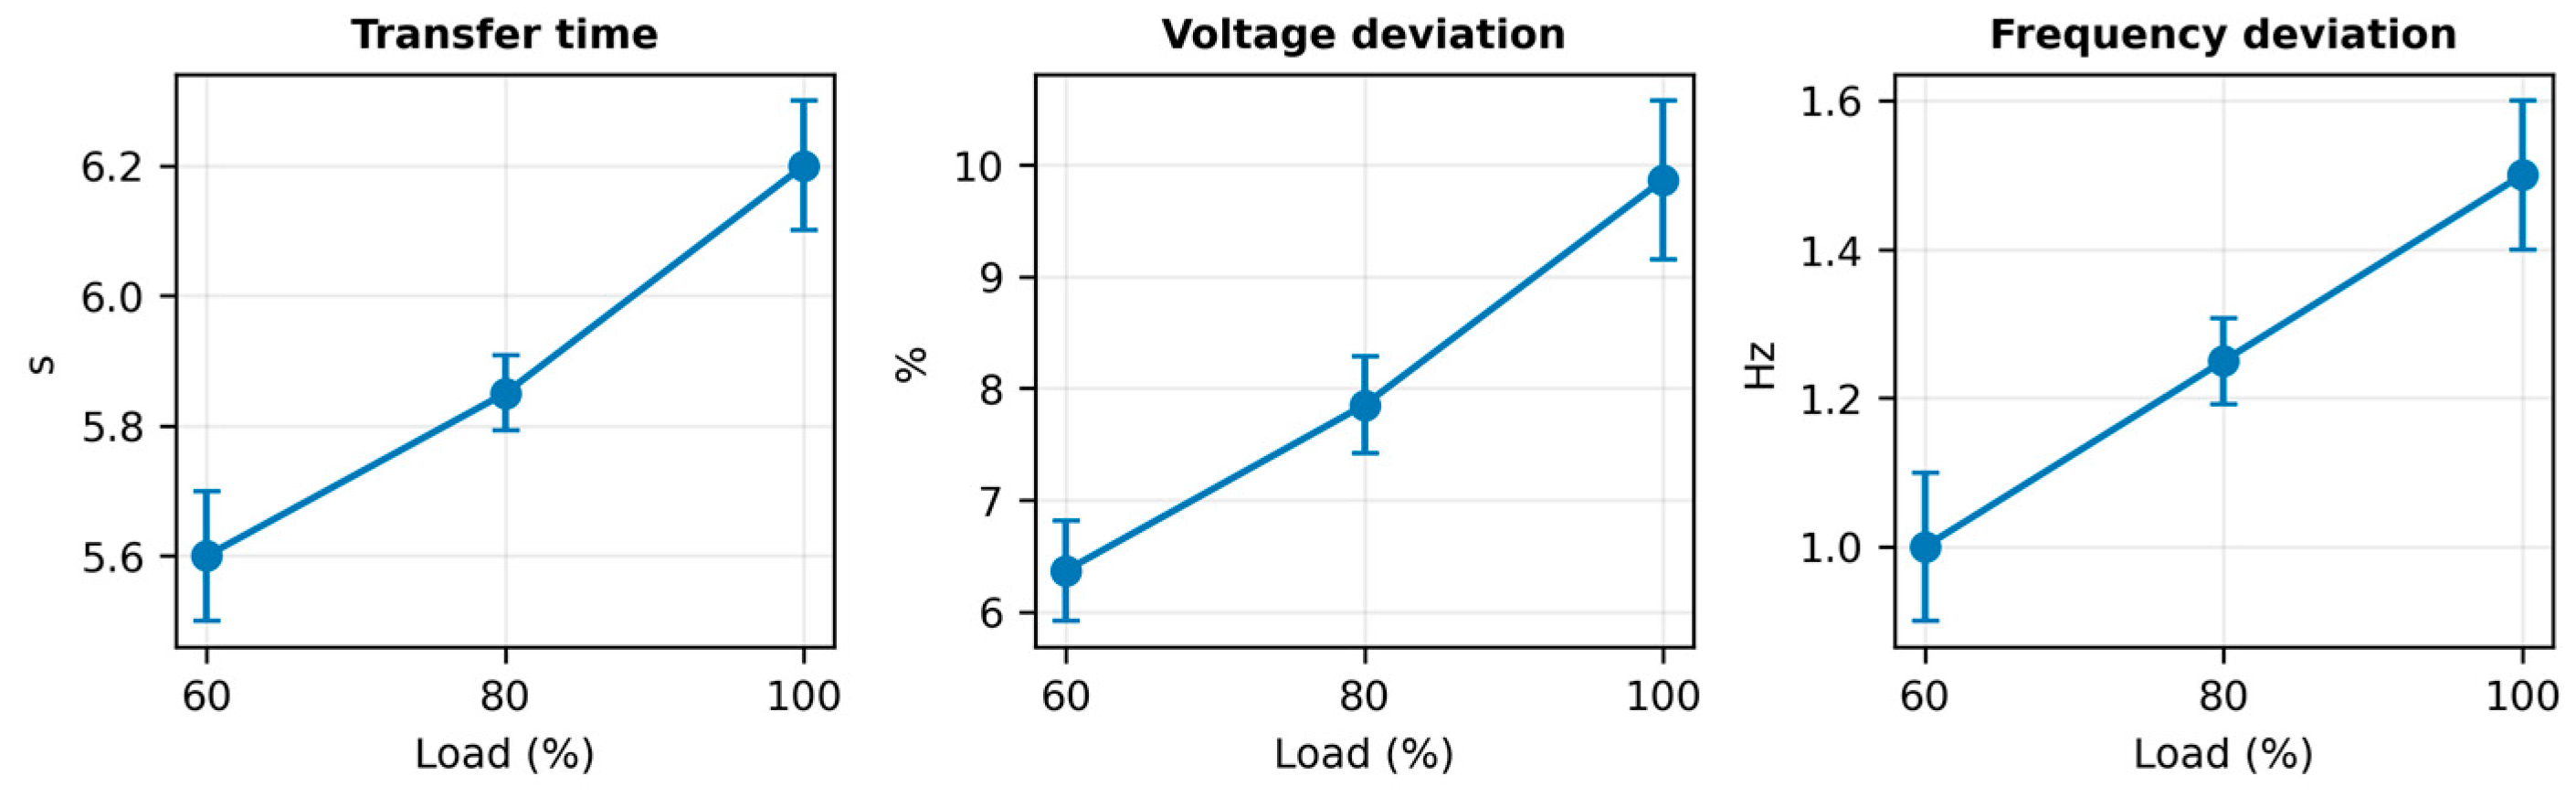
In all 10 controlled interruption tests, the generator and ATS restored supply. Transfer time increased from 5.60 ± 0.10 s at 60% load to 6.20 ± 0.10 s at 100% load; mean voltage deviation increased from 6.37% to 9.87%, and frequency deviation from 1.00 to 1.50 Hz. Campaign availability was 98.83%. These results show that continuity is not binary: supply was restored in every event, but transient stress increased with load. Table 3 reports the numerical results, and Figure 2 shows the load-dependent trends.
Table 3.
Load-specific continuity and power-quality results.
Figure 2.
Mean load-dependent ATS transfer time, voltage deviation, and frequency deviation. Error bars show sample standard deviation.
3.3. Operational Resilience Index
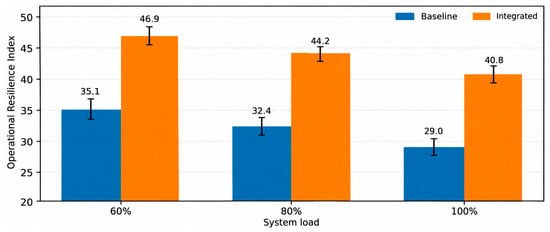
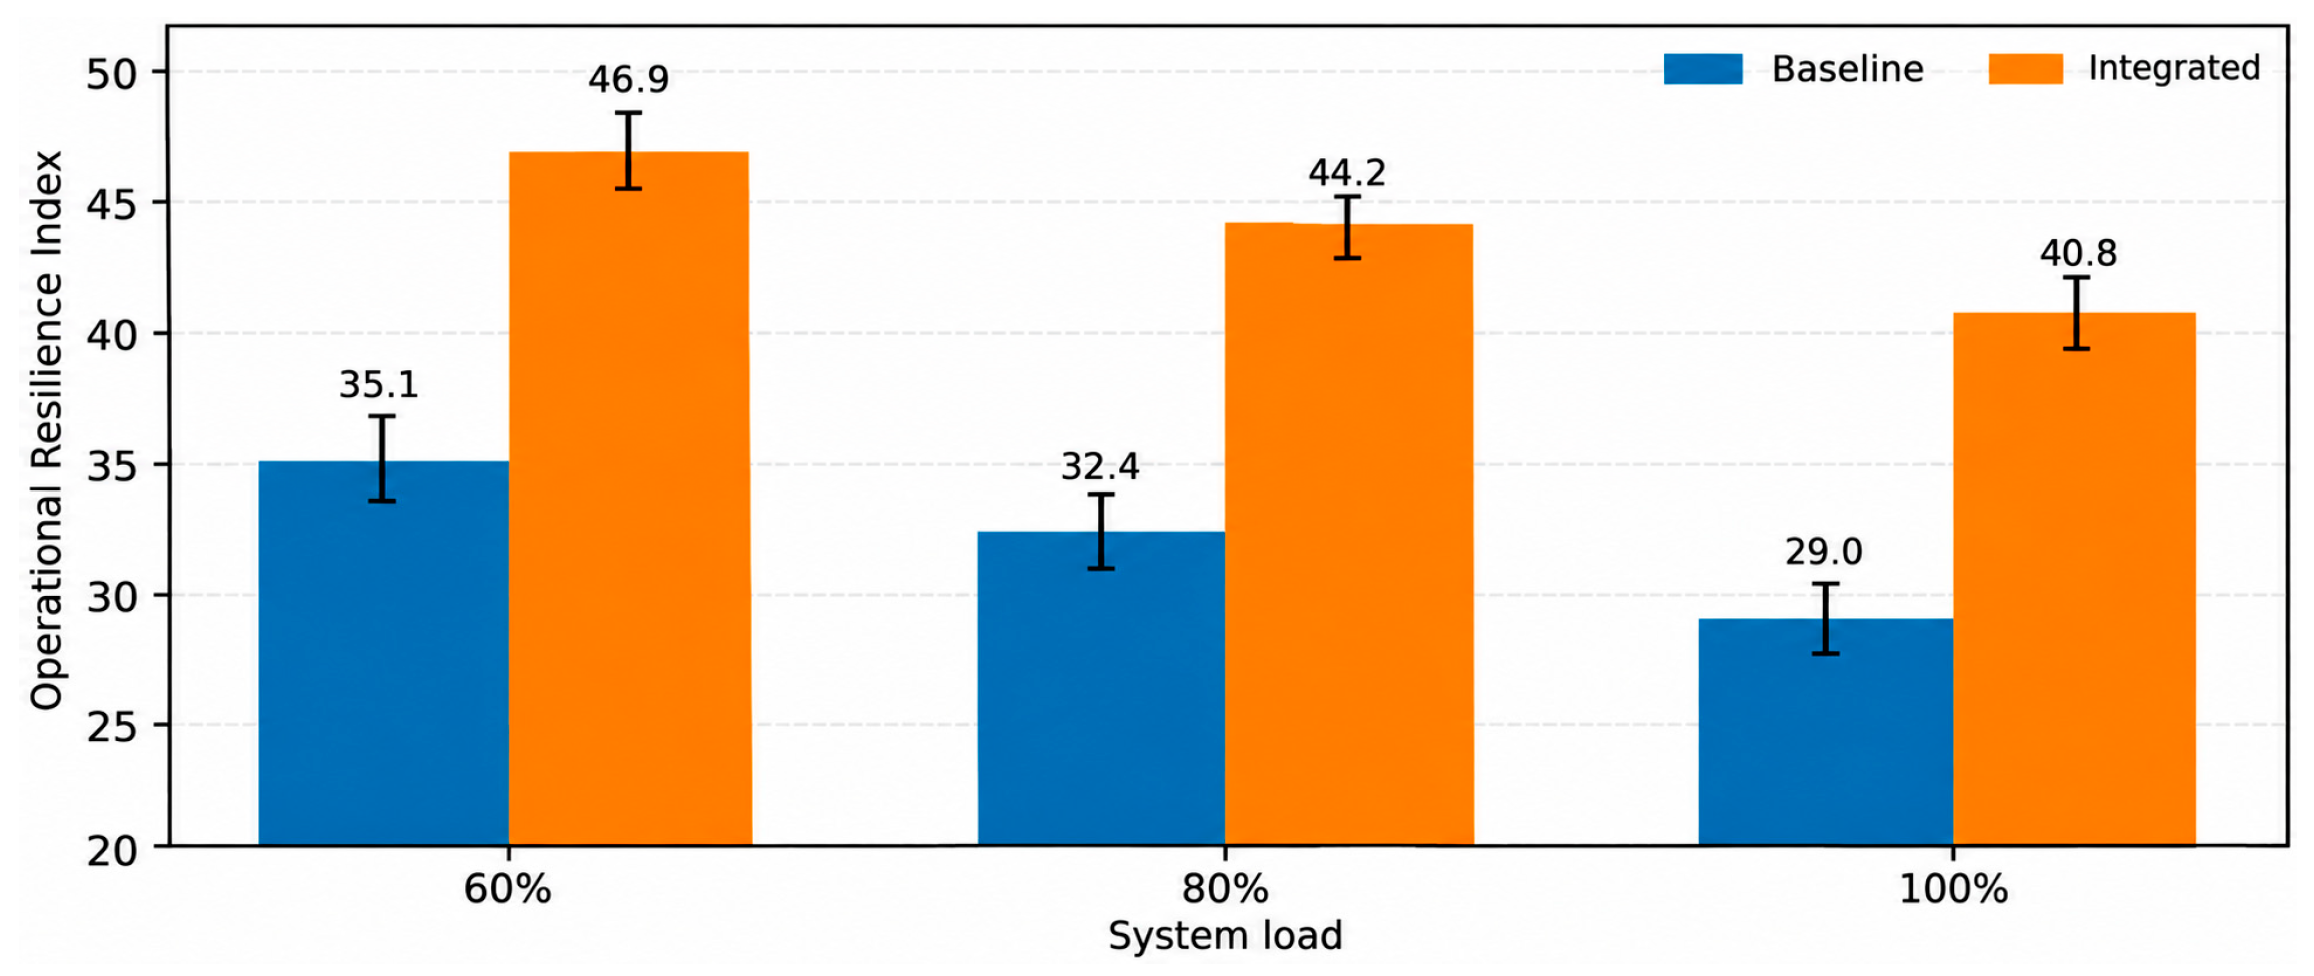
Using Equations (1)–(5), the ORI decreased as load increased because transfer time and voltage/frequency deviations became larger. As reported in Table 4, ORI increased from 35.10, 32.41, and 29.03 in the baseline state to 46.88, 44.18, and 40.81 in the integrated state at 60%, 80%, and 100% load, respectively, for a nominal gain of 11.78 points at each load. Figure 3 shows the baseline and integrated values with the uncertainty intervals. The corresponding combined-risk reductions were 18.1%, 17.4%, and 16.6%. Full-load transfer performance remained the main limitation.
Table 4.
Operational Resilience Index by load and operating state.
Figure 3.
Operational Resilience Index for baseline and integrated states. Error bars represent the 95% uncertainty-screen interval.
3.4. Contribution and Sensitivity Analysis
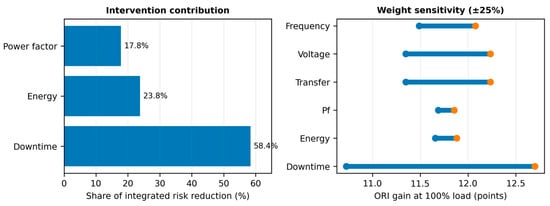
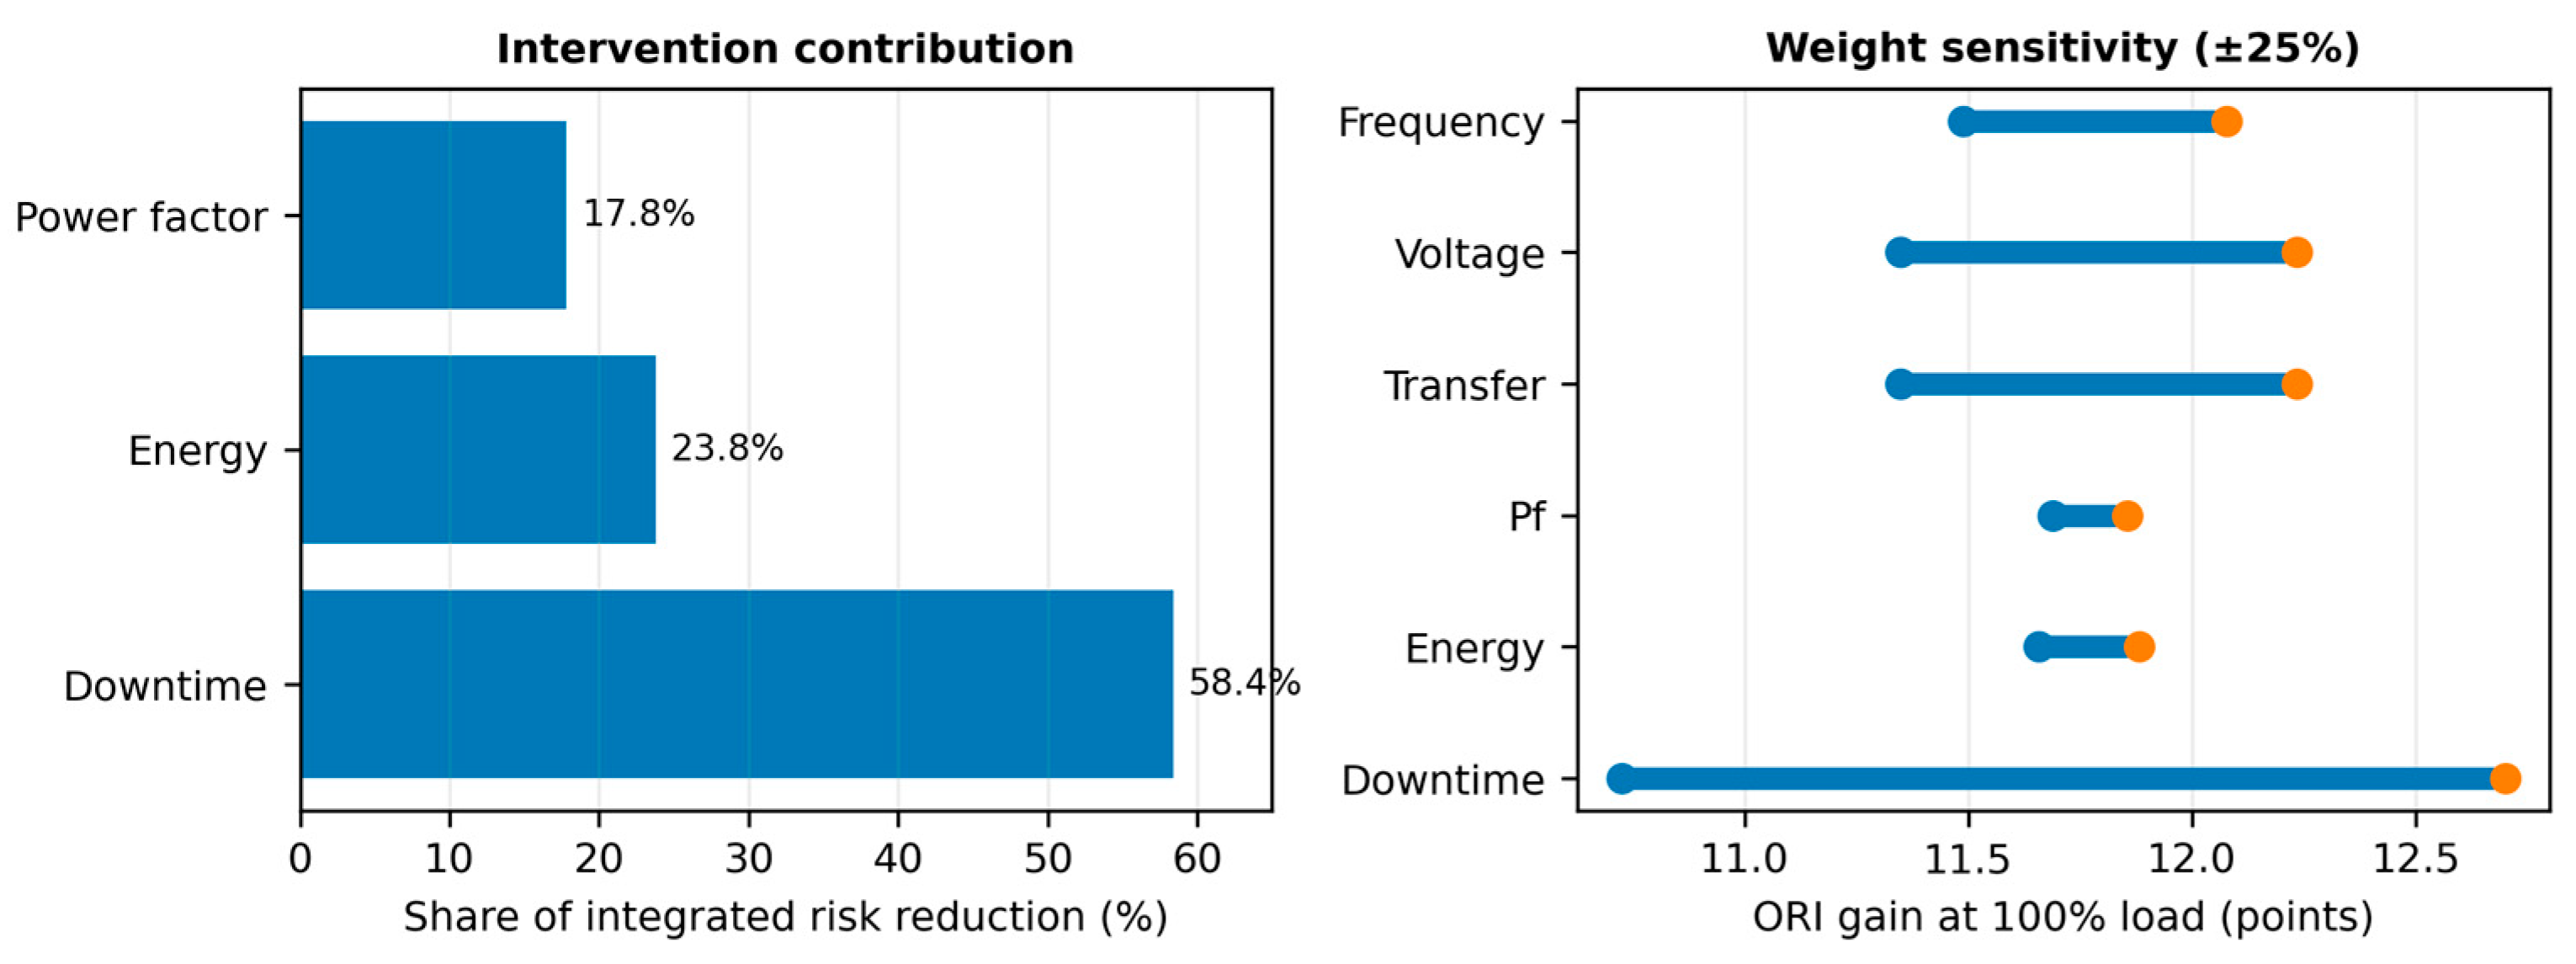
The intervention decomposition in Figure 4 shows that the downtime reduction accounted for 58.4% of the combined-risk decrease, the energy reduction for 23.8%, and the power-factor improvement for 17.8%. This confirms that the ORI is not an energy-efficiency metric alone: recovery of productive time made the largest contribution, while energy and electrical performance provided additional benefits.
Figure 4.
Contribution of documented interventions to risk reduction and sensitivity of the ORI gain to ±25% changes in individual weights.
At 100% load, ±25% single-weight perturbations produced ORI gains from 10.73 to 12.70 points, so the sign of the improvement did not depend on one exact weight vector; the weight sensitivity is shown in Figure 4. Varying one normalization constant by ±25% changed the 100%-load baseline ORI from 20.70 to 34.03 and the integrated ORI from 34.76 to 44.43, with gains remaining positive (10.40–14.07 points). In the leave-one-indicator-out test, the 100%-load gain ranged from 6.53 to 13.85 points after renormalization, and the integrated state remained higher at every load. The 20,000-run uncertainty screen yielded mean gains of 11.77–11.78 points, with lower 95% bounds above 9.7 points. These results support the robustness of the comparative conclusion, while confirming that absolute ORI values depend on the scaling constants and selected variables.
4. Discussion
The ORI should be interpreted as a cross-domain decision aid rather than a replacement for established indicators. Traditional reliability/availability measures characterize continuity of service [13]; diagnostic accuracy and condition-monitoring features characterize fault identification [1,2,3,4,5,6,7]; power-quality and standby-power metrics describe electrical disturbances and transfer behavior [11,12,14,15]; and motor-efficiency/energy-management indicators quantify energy performance [16,17,18,19]. The ORI differs by mapping selected outcomes from these domains onto a common dimensionless scale and combining them into one edge-computable score. Its advantage is comparability across operational domains; its cost is loss of physical detail and dependence on the chosen indicator set, normalization constants, and weights.
The observed results are internally consistent: the diagnostic layer detected 50 of 53 labeled faults, the ATS restored supply in all 10 events but degraded at higher load, and the motor-control intervention reduced energy use and improved the power factor. However, the three datasets were collected in different campaigns rather than simultaneously, so real-time interactions among variables cannot be inferred. The fault sample (n = 53) and especially the ATS sample (n = 10) are small, and the harmonized dataset contains aggregate rather than component-level intervention records. These limitations explain the wide diagnostic confidence interval and restrict external validity.
Accordingly, the present analysis is a pilot study. The sensitivity tests show that the baseline-versus-integrated comparison is not driven by one exact modeling choice, but they do not calibrate the ORI for other facilities. Prospective validation should acquire synchronized condition, ATS, power-quality, and energy data from the same assets; evaluate variable selection statistically as well as by engineering judgment; calibrate normalization constants and weights against operational consequences; and test the index across multiple sites before safety-critical or general industrial use.
5. Conclusions
This pilot study developed an edge-ready ORI that combines unplanned downtime, daily energy use, power factor, ATS transfer time, voltage deviation, and frequency deviation in a transparent dimensionless model. Across the available campaigns, fault detection was 94.34% (50/53), downtime decreased by 27.5%, energy use by 15.2%, power factor increased from 0.78 to 0.92, and ORI increased by 11.78 points at each tested load from 60% to 100%. Weight, normalization-constant, indicator-exclusion, and uncertainty analyses preserved a positive baseline-to-integrated difference, although absolute ORI values remained sensitive to modeling choices and full-load transfer performance. Because the datasets were independent and the samples were limited, the results do not validate direct transfer to other sectors. Pumping, food-processing, aquaculture, and refrigeration systems are candidate validation domains only. Prospective synchronized multicenter measurements are required to calibrate the variables, normalization constants, and weights and to confirm real-time interactions before broader deployment.
Author Contributions
Conceptualization, A.F., K.T. and W.N.; methodology, A.F. and T.Z.; software, A.F.; validation, L.M. and W.N.; formal analysis, A.F., L.M. and W.N.; investigation, A.F., J.C. and T.Z.; resources, J.C. and L.M.; data curation, A.F., L.M. and K.T.; writing—original draft preparation, A.F., T.Z. and W.N.; writing—review and editing, A.F., L.M. and J.C.; visualization, A.F.; supervision, A.F., K.T. and L.M.; project administration, A.F., T.Z. and K.T. All authors have read and agreed to the published version of the manuscript.
Funding
This research received no external funding.
Institutional Review Board Statement
Not applicable. The study used anonymized aggregate engineering measurements and did not involve human participants.
Informed Consent Statement
Not applicable.
Data Availability Statement
The aggregate data and calculation procedure used in this study are available from the corresponding author upon reasonable request.
Acknowledgments
The authors acknowledge the support of the Universidad Técnica de Ambato, Instituto Superior Universitario Japón, Universidad de Guayaquil and the technical personnel who supported the original measurement campaigns.
Conflicts of Interest
The authors declare no conflicts of interest.
References
- Lei, Y.; Li, N.; Guo, L.; Li, N.; Yan, T.; Lin, J. Machinery health prognostics: A systematic review from data acquisition to RUL prediction. Mech. Syst. Signal Process. 2018, 104, 799–834. [Google Scholar] [CrossRef] [Scilit]
- Jardine, A.K.S.; Lin, D.; Banjevic, D. A review on machinery diagnostics and prognostics implementing condition-based maintenance. Mech. Syst. Signal Process. 2006, 20, 1483–1510. [Google Scholar] [CrossRef] [Scilit]
- Nandi, S.; Toliyat, H.A.; Li, X. Condition monitoring and fault diagnosis of electrical motors—A review. IEEE Trans. Energy Convers. 2005, 20, 719–729. [Google Scholar] [CrossRef] [Scilit]
- Thomson, W.T.; Fenger, M. Current signature analysis to detect induction motor faults. IEEE Ind. Appl. Mag. 2001, 7, 26–34. [Google Scholar] [CrossRef] [Scilit]
- Yan, R.; Gao, R.X.; Chen, X. Wavelets for fault diagnosis of rotary machines: A review with applications. Signal Process. 2014, 96, 1–15. [Google Scholar] [CrossRef] [Scilit]
- Zhao, R.; Yan, R.; Chen, Z.; Mao, K.; Wang, P.; Gao, R.X. Deep learning and its applications to machine health monitoring. Mech. Syst. Signal Process. 2019, 115, 213–237. [Google Scholar] [CrossRef] [Scilit]
- Carvalho, T.P.; Soares, F.A.A.M.N.; Vita, R.; Francisco, R.d.P.; Basto, J.P.; Alcalá, S.G.S. A systematic literature review of machine learning methods applied to predictive maintenance. Comput. Ind. Eng. 2019, 137, 106024. [Google Scholar] [CrossRef] [Scilit]
- Kritzinger, W.; Karner, M.; Traar, G.; Henjes, J.; Sihn, W. Digital twin in manufacturing: A categorical literature review and classification. IFAC-PapersOnLine 2018, 51, 1016–1022. [Google Scholar] [CrossRef] [Scilit]
- Tao, F.; Cheng, J.; Qi, Q.; Zhang, M.; Zhang, H.; Sui, F. Digital twin-driven product design, manufacturing and service with big data. Int. J. Adv. Manuf. Technol. 2018, 94, 3563–3576. [Google Scholar] [CrossRef] [Scilit]
- Fuller, A.; Fan, Z.; Day, C.; Barlow, C. Digital twin: Enabling technologies, challenges and open research. IEEE Access 2020, 8, 108952–108971. [Google Scholar] [CrossRef] [Scilit]
- Bollen, M.H.J. Understanding Power Quality Problems: Voltage Sags and Interruptions; IEEE Press: New York, NY, USA, 2000. [Google Scholar] [CrossRef] [Scilit]
- Dugan, R.C.; McGranaghan, M.F.; Santoso, S.; Beaty, H.W. Electrical Power Systems Quality, 3rd ed.; McGraw-Hill: New York, NY, USA, 2012. [Google Scholar]
- Billinton, R.; Allan, R.N. Reliability Evaluation of Power Systems, 2nd ed.; Plenum Press: New York, NY, USA, 1996. [Google Scholar] [CrossRef] [Scilit]
- IEEE 446-1995; IEEE Recommended Practice for Emergency and Standby Power Systems for Industrial and Commercial Applications. IEEE: New York, NY, USA, 1996. [Google Scholar] [CrossRef] [Scilit]
- IEC 61000-4-30:2025; Electromagnetic Compatibility (EMC)—Part 4-30: Testing and Measurement Techniques—Power Quality Measurement Methods. IEC: Geneva, Switzerland, 2025.
- Saidur, R. A review on electrical motors energy use and energy savings. Renew. Sustain. Energy Rev. 2010, 14, 877–898. [Google Scholar] [CrossRef] [Scilit]
- IEC 60034-30-1:2025; Rotating Electrical Machines—Part 30-1: Efficiency Classes of Line Operated AC Motors (IE Code). IEC: Geneva, Switzerland, 2025.
- IEC 60034-2-1:2024; Rotating Electrical Machines—Part 2-1: Standard Methods for Determining Losses and Efficiency from Tests (Excluding Machines for Traction Vehicles). IEC: Geneva, Switzerland, 2024.
- ISO 50001:2018/Amd 1:2024; Energy Management Systems—Requirements with Guidance for Use—Amendment 1: Climate Action Changes. ISO: Geneva, Switzerland, 2024.
- Acosta, J.; Collaguazo, A.; Castillo, J.N.; Robalino, E.F.; Freire, L.O.; Flores, L.A. Wind energy prediction based on machine learning methods. In Green Digital Innovation and Business: Proceedings of INDIB’26; Motahhir, S., Bossoufi, B., Siano, P., Eds.; Lecture Notes in Networks and Systems; Springer: Cham, Switzerland, 2026; Volume 1878, pp. 138–145. [Google Scholar] [CrossRef] [Scilit]

Disclaimer/Publisher’s Note: The statements, opinions and data contained in all publications are solely those of the individual author(s) and contributor(s) and not of MDPI and/or the editor(s). MDPI and/or the editor(s) disclaim responsibility for any injury to people or property resulting from any ideas, methods, instructions or products referred to in the content. |
© 2026 by the authors. Licensee MDPI, Basel, Switzerland. This article is an open access article distributed under the terms and conditions of the Creative Commons Attribution (CC BY) license.