


Abstract
In-vehicle infotainment systems (IVISs) have recently become crucial in modern vehicles for delivering essential driving information and cabin controls to the driver. However, traditional IVIS designs, which rely on physical screens and buttons, raise concerns about driver distraction, ergonomic issues, and sustainable manufacturing. This paper introduces the design and assessment of a mixed reality (MR) spatial interface with core functions, such as hazard lights and cabin temperature control. This pilot study compared the conventional user interface (CUI) with the spatial user interface (SUI), which replaces traditional screens and physical controls with virtually anchored controls, in terms of visual responses, driving performance, and perceptions. The results show that while conversational interfaces offer superior initial learnability, screen-based spatial interfaces provide greater task certainty and execution confidence. By removing the need for embedded hardware elements such as displays, SUI offers a more sustainable approach to vehicle design, reducing material complexity while ensuring full driver accessibility, especially in next-generation vehicle cockpits for professional and defence applications.
1. Introduction
Since the early development of vehicles, car manufacturers have continuously enhanced vehicles’ cockpit designs and services to assist drivers [1]. What was before primarily focused on delivering information to drivers, such as navigation, speed, or fuel level, has evolved to include more advanced entertainment and connectivity features, including phone applications, radio media, internet-based services, etc. [2]. In-vehicle infotainment systems (IVISs) dominate the current industry discourses, representing the combination of “information” and “entertainment” [3,4].
IVISs are equipped with human–machine interfaces (HMIs) to manage the functionalities provided to drivers. These systems are typically menu-based and accessed via a single screen-based interface [4]. Generally, drivers react to these interfaces in two ways: physically (e.g., pushing buttons, touching the screen, etc.) and verbally (voice commands) [1,3].
IVIS use is prevalent among young adults, and because they are the highest users of IVISs, they are also more prone to distraction-related injuries [5]. Sending and receiving information from and to IVIS necessitates a specific cognitive workload and time when the driver’s eyes are off the road, leading to distraction [6]. The longer the eyes-off-road duration is, the riskier the secondary task becomes [7,8]. Therefore, the interface design of IVISs and the task structure play an important role in driver safety and the success of the interactions [9].
Among IVIS interfaces, head-up displays (HUDs) are commonly used. According to the evolution of HUDs, HUDs are classified into three generations: combiner HUDs (C-HUD), windshield HUDs (W-HUD), and AR-HUDs. AR-HUD technology consists of projecting information directly onto the windshield, within the driver’s natural line of sight, ensuring shorter eyes-off-road duration and fewer crash risks [2,10]. Recent studies exploited AR-HUD capabilities in several applications. For instance, some researchers investigated the impact of 2D and 3D arrow navigation interfaces (ANIs) within AR-HUD systems on drivers’ spatial learning abilities [11]. Others evaluated a developed prototype AR-HUD interface and a typical head-down display (HDD) interface system [12]. In addition to VR simulators, on-road simulators were also present in the literature. Goedicke et al. validated the XR-OOM mixed reality system for basic driver cockpit and low-speed driving tasks, comparing the use of the system without and with a headset under driving conditions [13]. Yeo et al. introduced a mixed reality in-vehicle simulator, MAXIM, with a wizard driver, and suggested the use of the approach for rapid prototyping and evaluation of various automotive user interfaces [14].
Despite the promise of mixed reality for producing diverse and reliable findings, existing work has not systematically linked specific user interface features (e.g., spatialization) to gaze metrics, cognitive workload, or driving performance, particularly among young adults who are heavy IVIS users and face an elevated risk of distraction. Comprehensive safety and performance evaluations that test feature-level effects and age-targeted design warrant further consideration.
Driving operations are divided into three distinct functional categories [15]. The primary task encompasses vehicle maneuverability, hazard detection, and hierarchical control layers like navigation, guidance, and stabilization. Secondary and tertiary tasks then manage safety-critical functions, such as windshield wipers and indicators, alongside non-driving-related tasks (NDRTs) like comfort, information, and entertainment systems.
This study addresses this gap by systematically comparing a CUI and an SUI, the latter being an AR-HUD projected in space. Specifically, the objectives of this research are to develop a prototype of a spatial user interface to be projected by AR-HUD and to examine the impact of the interfaces on driving, gaze, physiological behaviour, and usability perceptions among young drivers.
To assess the user experience, two widely recognized subjective questionnaires were administered post-task: the NASA Task Load Index (NASA-TLX) and the System Usability Scale (SUS). The NASA-TLX measures multidimensional cognitive workload and distraction across six distinct subscales to generate an overall workload score [16]. Usability was evaluated using the SUS, a concise ten-item instrument that uses a five-point Likert scale with alternating positive and negative statements to provide a global assessment of system usability [17].
The following research questions were formulated on this topic:
- How do drivers perceive the ergonomic benefits and cognitive load associated with interacting with virtually anchored controls in an SUI environment versus traditional physical controls in a CUI environment?
- How does the implementation of a mixed reality spatial user interface (SUI) affect driver distraction metrics compared to a CUI under the same driving conditions and non-driving-related tasks?
2. Methodology
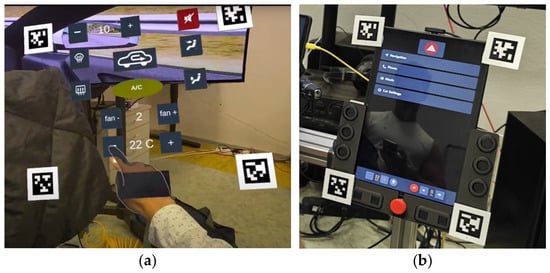
This study employed a controlled simulation environment to evaluate the effectiveness and user experience of two distinct in-vehicle infotainment system (IVIS) interfaces, designated SUI and CUI (Figure 1). CUI is based on a touchscreen dashboard interface concept previously used in studies [18,19]. The methodology involved a multi-stage process designed to assess driver performance, usability, and physiological responses under both interface conditions. ID tags positioned on the corners of interfaces for automated post-processing purposes were used.
Figure 1.
Visual representation of SUI (a) and CUI (b) while the study was conducted.
The experiment involved 14 participants representing a young adult demographic, with a mean age of 25.5 years (SD = 2.82; min = 21; max = 29). Participants first provided informed consent and were fitted with eye-tracking hardware necessary for data acquisition. Secondly, they received a standardized training session of the driving simulator to learn the basic vehicle control (steering, acceleration, braking, lane maintenance) before the experimental phases began. The core of the experiment involved two driving sessions performed sequentially, each utilizing one of the interface systems.
During the assessment, participants were familiarized with both the SUI and CUI before navigating identical virtual motorway scenarios for each interface. Throughout both drives, participants completed assigned tasks and post-scenario questionnaires (e.g., NASA-TLEX, SUS).
The following NDRTs were to be performed in a specific, non-repeating sequence: increase the temperature by two degrees; turn on the AC and set the fan to level 2; engage the lane-keeping aid; mute the audio; push the hazard lights button. The latter two functions were realistically imitated; the other only mimicked the switching.
To monitor the drivers’ visual behaviour, we used the Pupil Neon wearable eye-tracking device (Pupil Labs GmbH, Berlin, Germany). The device provides reliable and robust performance under different lighting conditions and head positions [20]. In addition, it delivers 1.8° and 1.3° median accuracy without calibration and with a simple offset correction, respectively. To process the data, a mobile companion application was first used to capture the data during the tests, after which the data were automatically uploaded to a cloud service in a second stage.
2.1. Measures
Eye movements were recorded with t 30 Hz. Fixations and saccades were detected using a [velocity-threshold (I-VT)] algorithm ([threshold, e.g., 30°/s]; minimum fixation duration [e.g., 100 ms]). Blinks were detected as [periods of pupil loss lasting 50–500 ms]. All metrics were computed per trial and averaged for each participant and condition.
- Task duration (s): time from [task onset] to [task completion]. Longer durations indicate lower efficiency.
- Fixation rate (Hz): number of fixations divided by trial duration. Higher values indicate more frequent gaze shifts and greater visual search.
- Mean fixation duration (ms): average duration of fixations within a trial. Longer fixations may reflect deeper processing or greater difficulty extracting information, so no directional hypothesis was set.
- Average saccade amplitude (px): mean on-screen distance between consecutive fixations. Larger values indicate wider scanning across interface regions.
- Blink rate (blinks/min): number of blinks per minute. Blink rate typically decreases under high visual demand and increases with fatigue or low demand.
- Average blink duration (ms): mean duration of detected blinks. Longer blinks may indicate lower visual demand or reduced alertness.
- PERCLOS (%): percentage of time the eyes were at least [80]% closed. Higher values indicate drowsiness.
A visually less demanding interface was expected to show a lower fixation rate, smaller saccade amplitude and higher blink rate, without an increase in PERCLOS.
Workload was measured with the raw NASA-TLX (six subscales, 0–100; higher scores indicate higher workload). The performance subscale ranged from high (0) to weak (100) performance, where higher scores indicate poorer perceived performance. Global workload was calculated as the mean of the six subscales. Usability was measured with the System Usability Scale (SUS; ten items, 1–5), converted to a 0–100 score using the standard scoring procedure.
Vehicle and physiological measures used are average speed (km/h), steering intensity, longitudinal G variability, speed roughness, critical events per minute, mean heart rate (bpm), and heart rate variability (metric, e.g., ln RMSSD).
2.2. Statistical Analysis
All comparisons were within-subject (N = 14). Shapiro–Wilk tests indicated non-normal paired differences for several variables, so all SUI–CUI comparisons were performed with two-tailed Wilcoxon signed-rank tests. Effect sizes are reported as r = Z/√N. Benjamini–Hochberg correction was applied within each outcome family: NASA-TLX subscales, eye-tracking measures, and vehicle and heart rate measures.
For eye-tracking, tests were performed on participant-level means. Participant medians were not used because trial-level medians collapsed to zero for participants with detected blinks or saccades in fewer than half of their trials, which produced non-physiological values. SUS and NASA-TLX item- and subscale-level results are reported as descriptive trends. Given the sample size, all analyses are considered exploratory.
3. Results
Driving exposure was assessed through self-reported driving frequency and cumulative lifetime mileage. Of the participants, 35.7% (n = 5) reported driving daily, 14.3% (n = 2) several times per week, 28.6% (n = 4) weekly, and 21.4% (n = 3) less frequently. Cumulative lifetime mileage was right-skewed (median = 25,000 km; M = 34,142 km, SD = 36,881 km): 28.6% of participants had driven more than 50,000 km and 14.3% less than 1000 km.
3.1. Questionnaires
Perceived workload was assessed with the raw NASA-TLX (Table 1). Global workload was similar for both interfaces (SUI: M = 43.33, SD = 25.61; CUI: M = 41.96, SD = 20.06), and a Wilcoxon signed-rank test showed no significant difference (p = 0.221, r = 0.33).
Table 1.
NASA-TLX results.
No subscale differed significantly after correction (all p (BH) ≥ 0.235), so the following trends are descriptive only. The largest difference appeared in the performance dimension: participants rated their performance somewhat better with the SUI (M = 59.29, SD = 30.69) than with the CUI (M = 71.43, SD = 27.70; p = 0.081, r = 0.47). The SUI showed slightly higher temporal demand (33.57 vs. 25.71; p = 0.095, r = 0.45), mental demand (54.29 vs. 50.36) and physical demand (31.43 vs. 25.71). Effort and frustration were nearly identical between interfaces. The large standard deviations indicate considerable individual variation in perceived workload. Overall, the SUI did not impose a measurably higher workload than the CUI, even though it was a new interaction concept for the participants.
In addition to the NASA-TLX, perceived usability was assessed with the SUS (Table 2). Both interfaces scored slightly below the commonly used benchmark of 68, placing them in the “marginal” acceptability range [21]. SUS scores did not differ significantly between the SUI (M = 60.89, SD = 22.35) and the CUI (M = 62.68, SD = 23.24; p = 0.801, r = 0.07).
Table 2.
SUS results.
No SUS item differed significantly between the interfaces (all p ≥ 0.071), so the following trends are descriptive only. In terms of learnability, the CUI received more favourable ratings: participants expected most people to learn it more quickly (Q7: M = 3.43, SD = 1.45 vs. M = 2.71, SD = 1.20) and reported needing to learn fewer things before using it (Q10: M = 2.07, SD = 1.21 vs. M = 2.64, SD = 1.65). The SUI received slightly more favourable ratings for functional integration (Q5: 3.64 vs. 3.29), complexity (Q2: 2.07 vs. 2.36) and consistency (Q6: 1.79 vs. 2.07). These patterns suggest that the SUI, as a new interaction concept, requires initial familiarization, whereas the CUI benefits from users’ prior experience with conventional layouts.
3.2. Vehicle Data and Heart Rate
Average speed was higher with the CUI (M = 86.78, SD = 10.87) than with the SUI (M = 73.78, SD = 22.65). This difference was significant before correction (p = 0.031) but not after Benjamini–Hochberg correction (p (BH) = 0.216) (Table 3). The larger speed variability in the SUI condition suggests that some drivers reduced their speed considerably while using the new interface.
Table 3.
Vehicle data and heart rate (HR) results.
The other vehicle control measures (steering intensity, longitudinal G variability and critical events) showed no significant differences, indicating comparable driving stability with both interfaces. Mean heart rate and heart rate variability did not differ significantly either (p (BH) ≥ 0.421), so no evidence was found that either interface induced a different level of physiological arousal.
3.3. Interface Usage Comparison (Eye-Tracking Measures)
Eye-tracking metrics were compared between the SUI and the CUI using two-tailed Wilcoxon signed-rank tests on participant means (Table 4).
Table 4.
Eye-tracking results.
Task duration did not differ significantly between interfaces (SUI: Mdn = 5.65 s, CUI: Mdn = 5.77 s; p = 0.715, r = 0.11), nor did mean fixation duration (495.44 vs. 505.07 ms; p = 1.000, r = 0.01). The interface type therefore did not measurably affect the time needed to process individual interface elements.
Differences appeared in gaze dynamics. Fixation rate was lower with the SUI than with the CUI (1.89 vs. 2.33 Hz; p = 0.030, r = 0.58), and average saccade amplitude was smaller (421.50 vs. 500.23 px; p = 0.020, r = 0.61). Together, these results suggest that the SUI required fewer and shorter gaze shifts, consistent with a more focused search strategy. The CUI layout, in contrast, appears to have prompted wider scanning across separate interface regions.
Blink rate did not differ significantly (23.90 vs. 16.91 blinks/min; p = 0.119, r = 0.43). Average blink duration was longer with the SUI (174.99 vs. 157.99 ms; p = 0.017, r = 0.63). However, this difference was partly driven by four participants with few or no detected blinks in the CUI condition, which likely reflects eye-tracking data loss, so it should be interpreted with caution. PERCLOS did not differ between conditions (7.84% vs. 5.85%; p = 0.091, r = 0.46), suggesting comparable alertness levels.
The effect sizes for fixation rate, saccade amplitude and blink duration were large, but none of these differences remained significant after Benjamini–Hochberg correction (p (BH) = 0.069). In the median-based analysis (Table 5), the direction of these effects was preserved but did not reach significance. These findings should therefore be treated as exploratory.
Table 5.
Eye-tracking results based on participant medians.
4. Discussion
This study compared an SUI and a CUI in a driving simulator using eye-tracking, vehicle, physiological and subjective measures. At the global level, the two interfaces performed similarly. Global workload (Table 1), overall usability (Table 2), vehicle control measures and heart rate (Table 3) showed no significant differences, nor did mean fixation duration, blink rate and PERCLOS (Table 4). Given the small sample, these results do not demonstrate equivalence, but they provide no evidence that the SUI, despite being a new concept, increased overall workload, reduced alertness or impaired vehicle control. The only vehicle measure that differed before correction was average speed, which was lower and more variable with the SUI. This may indicate that some drivers compensated for the unfamiliar interface by slowing down, a common adaptive strategy under secondary-task demand.
Differences between the interfaces appeared mainly in gaze dynamics. With the SUI, drivers made fewer fixations and shorter saccades than with the CUI (Table 4). Eye-tracking has previously been used to compare interaction concepts, revealing differences in visual attention between interface types [22]. These effects were large but did not remain significant after correction for multiple comparisons. The pattern suggests that the spatial arrangement allowed drivers to find information with fewer and smaller gaze shifts. The conventional layout, in contrast, appears to have required wider scanning across separate interface regions. Blink duration was also longer with the SUI. However, this difference was partly driven by probable data loss in the CUI condition, and it was not accompanied by a difference in PERCLOS, so it is not interpreted as a sign of reduced alertness.
The subjective results showed a similar, though weaker, pattern. Participants tended to rate their own performance as better with the SUI (NASA-TLX performance: 59.29 vs. 71.43, where lower is better; Table 1). This fits the more focused gaze behaviour: an interface that requires less visual search may give drivers a stronger sense of successful task execution. At the same time, the SUI tended to show slightly higher temporal and mental demand. None of these subscale differences was statistically significant, so they should be considered trends.
Learnability was the clearest advantage of the CUI. Participants expected others to learn the CUI more quickly (SUS Q7) and reported needing to learn fewer things before using it (Q10). This is expected: the SUI was a new concept for all participants, whereas conventional layouts benefit from years of prior experience. Because gaze behaviour is known to change with user proficiency [23], the gaze patterns observed here may also change as drivers become familiar with the SUI. Most eye-tracking usability studies rely on single sessions and therefore cannot capture such learning effects; longitudinal studies should therefore examine whether the learnability gap closes with practice [24].
The SUI, in turn, received slightly more favourable ratings for functional integration (Q5), complexity (Q2) and consistency (Q6). This suggests that once its logic is understood, the spatial arrangement may be perceived as coherent. A short training session may be enough to operate the SUI, but building an interaction habit likely requires longer exposure. Longitudinal studies should examine whether the learnability gap closes with practice.
These findings should be interpreted in light of the study’s limitations, most importantly the small sample (N = 14) and the exploratory nature of the analyses. Small, homogeneous samples are a common limitation of eye-tracking usability studies [24]. Future studies should include larger and more diverse samples, particularly drivers older than 29, longer familiarization periods and on-road validation. The integration of haptic feedback into spatial interfaces should also be examined.
5. Conclusions
This study evaluated drivers’ interactions with two in-vehicle information system (IVIS) interfaces, a spatial user interface (SUI) and a conventional user interface (CUI), in a driving simulator using eye-tracking, vehicle, physiological and subjective measures. At the global level, the two interfaces performed similarly: no significant differences were found in overall workload, usability, vehicle control or heart rate.
Differences emerged mainly in gaze behaviour and in subjective trends. With the SUI, drivers made fewer fixations and shorter saccades, suggesting a more focused visual search, and they tended to rate their own performance more favourably. The CUI, in turn, was perceived as easier to learn, reflecting users’ familiarity with conventional layouts. Some drivers also drove more slowly with the SUI, possibly compensating for its novelty. Because these effects did not remain significant after correction for multiple comparisons, they should be confirmed in larger studies.
Overall, the results indicate that a spatial interface can be introduced without a measurable increase in workload or loss of vehicle control, and that it may support more efficient visual search once drivers become familiar with it. Improving initial learnability, for example through better onboarding or longer training, appears to be the key challenge for future spatial interface designs. Spatial interfaces may also be worth investigating for trained professional drivers, and if the SUI can be delivered via wearable devices, it could help simplify built-in vehicle controls in the future.
Author Contributions
Conceptualization, V.N., G.S. and M.G.; methodology, V.N.; software, G.S. and M.G.; validation, V.N., G.S. and M.G.; formal analysis, V.N.; investigation, V.N.; resources, V.N.; data curation, V.N.; writing—original draft preparation, V.N.; writing—review and editing, V.N.; visualization, V.N.; supervision, V.N.; project administration, V.N.; funding acquisition, V.N. All authors have read and agreed to the published version of the manuscript.
Funding
This research received no external funding.
Institutional Review Board Statement
The study was conducted in accordance with the Declaration of Helsinki, and approved by the Institutional Ethics Committee of Széchenyi István University (SZE/ETT-87/2026, 4 June 2026).
Informed Consent Statement
Informed consent was obtained from all subjects involved in the study.
Data Availability Statement
Data available on request due to restrictions (ethical reasons).
Acknowledgments
Project no. TKP2021-NVA-23 has been implemented with the support provided by the Ministry of Technology and Industry of Hungary from the National Research, Development and Innovation Fund, financed under the TKP2021-NVA funding scheme.
Conflicts of Interest
The authors declare no conflicts of interest.
References
- Zhong, Q.; Zhi, J.; Xu, Y.; Gao, P.; Feng, S. Assessing Driver Distraction from In-Vehicle Information System: An on-Road Study Exploring the Effects of Input Modalities and Secondary Task Types. Sci. Rep. 2024, 14, 20289. [Google Scholar] [CrossRef] [Scilit] [PubMed]
- Krstačić, R.; Žužić, A.; Orehovački, T. Safety Aspects of In-Vehicle Infotainment Systems: A Systematic Literature Review from 2012 to 2023. Electronics 2024, 13, 2563. [Google Scholar] [CrossRef] [Scilit]
- Kim, D.S. Exploring Mixed Reality Human-Machine Interfaces for Enhanced Driving Experience and Safety. Master’s Thesis, Seoul National University, Seoul, Republic of Korea, 2026. [Google Scholar]
- Harvey, C.; Stanton, N.A.; Pickering, C.A.; McDonald, M.; Zheng, P. In-Vehicle Information Systems to Meet the Needs of Drivers. Int. J. Hum. Comput. Interact. 2011, 27, 505–522. [Google Scholar] [CrossRef] [Scilit]
- Ziakopoulos, A.; Theofilatos, A.; Papadimitriou, E.; Yannis, G. A Meta-Analysis of the Impacts of Operating in-Vehicle Information Systems on Road Safety. IATSS Res. 2019, 43, 185–194. [Google Scholar] [CrossRef] [Scilit]
- Cerasi, I.R.; Moe, D.; Hansen, A.-H.; Johansen, M. In-Vehicle Infotainment System and Driver Distraction. In Proceedings of the 35th European Safety and Reliability Conference (ESREL 2025); Research Publishing: Singapore, 2025; pp. 3235–3242. [Google Scholar]
- Klauer, S.G.; Dingus, T.A.; Neale, V.L.; Sudweeks, J.D.; Ramsey, D.J. The Impact of Driver Inattention on Near-Crash/Crash Risk: An Analysis Using the 100-Car Naturalistic Driving Study Data; Virginia Tech Transportation Institute: Blacksburg, VA, USA, 2006. [Google Scholar]
- Han, S.; Glaser, Y.; Klauer, C.; Anderson, G.; Guo, F. Crash Risk Associated with Eyes-off-Road Duration by Road Control Type and Intersection Type. J. Saf. Res. 2025, 93, 266–273. [Google Scholar] [CrossRef] [Scilit] [PubMed]
- Harvey, C.; Stanton, N.A.; Pickering, C.A.; McDonald, M.; Zheng, P. A Usability Evaluation Toolkit for In-Vehicle Information Systems (IVISs). Appl. Ergon. 2011, 42, 563–574. [Google Scholar] [CrossRef] [Scilit] [PubMed]
- Zhou, C.; Qiao, W.; Hua, J.; Chen, L. Automotive Augmented Reality Head-Up Displays. Micromachines 2024, 15, 442. [Google Scholar] [CrossRef] [Scilit] [PubMed]
- Xu, X.; Yang, J.; Zhao, S.; Li, Y.; Ren, L.; Li, M.; Yan, B. Enhancing spatial learning during driving: The role of 3D navigation interface visualization in AR-HUD. Geo-Spat. Inf. Sci. 2026, 29, 2570–2586. [Google Scholar] [CrossRef] [Scilit]
- Charissis, V.; Falah, J.; Lagoo, R.; Alfalah, S.F.M.; Khan, S.; Wang, S.; Altarteer, S.; Larbi, K.B.; Drikakis, D. Employing Emerging Technologies to Develop and Evaluate In-Vehicle Intelligent Systems for Driver Support: Infotainment AR Hud Case Study. Appl. Sci. 2021, 11, 1397. [Google Scholar] [CrossRef] [Scilit]
- Goedicke, D.; Bremers, A.W.D.; Lee, S.; Bu, F.; Yasuda, H.; Ju, W. XR-OOM: MiXed Reality Driving Simulation with Real Cars for Research and Design. In Proceedings of the Conference on Human Factors in Computing Systems—Proceedings; Association for Computing Machinery: New York, NY, USA, 2022. [Google Scholar]
- Yeo, D.; Kim, G.; Kim, S. Toward Immersive Self-Driving Simulations: Reports from a User Study across Six Platforms. In Proceedings of the CHI’20: Proceedings of the 2020 CHI Conference on Human Factors in Computing Systems, Honolulu, HI, USA, 25–30 April 2020; pp. 1–12. [Google Scholar] [CrossRef] [Scilit]
- Pfleging, B.; Schmidt, A. (Non-) Driving-Related Activities in the Car: Defining Driver Activities for Manual and Automated Driving. In Proceedings of the CHI’15 Workshop on Experiencing Autonomous Vehicles, Seoul, Republic of Korea, 18–23 April 2015. [Google Scholar]
- von Janczewski, N.; Kraus, J.; Engeln, A.; Baumann, M. A Subjective One-Item Measure Based on NASA-TLX to Assess Cognitive Workload in Driver-Vehicle Interaction. Transp. Res. Part F Traffic Psychol. Behav. 2022, 86, 210–225. [Google Scholar] [CrossRef] [Scilit]
- Brooke, J. SUS: A ‘Quick and Dirty’ Usability Scale. In Usability Evaluation in Industry; Jordan, P.W., Thomas, B., Weerdmeester, B.A., McClelland, I.L., Eds.; Taylor & Francis: London, UK, 1996; pp. 189–194. [Google Scholar]
- Nagy, V.; Kovács, G.; Földesi, P.; Sándor, Á.P. Car Simulator Study for the Development of a Bring-Your-Own-Device (BYOD) Dashboard Concept. Chem. Eng. Trans. 2023, 107, 415–420. [Google Scholar] [CrossRef]
- Nagy, V.; Kovács, G.; Babić, D.; Desnica, E. Multi-Modal Evaluation of Adaptive Interface Design and Railway Grade Crossing Infrastructure, in Simulated Driving Environments. Acta Polytech. Hung. 2026, 23, 287–306. [Google Scholar] [CrossRef] [Scilit]
- Dierkes, K.; Baumann, C. Neon Accuracy Test Report-An Evaluation of Lab and In-The-Wild Performance Neon Accuracy Test Report An Evaluation of Lab and In-The-Wild Performance; Neon Accuracy Test Report; Pupil Labs: Berlin, Germany, 2023. [Google Scholar] [CrossRef]
- Bangor, A.; Kortum, P.T.; Miller, J.T. An Empirical Evaluation of the System Usability Scale. Int. J. Hum.–Comput. Interact. 2008, 24, 574–594. [Google Scholar] [CrossRef] [Scilit]
- Lucignano, L.; Cuendet, S.; Schwendimann, B.; Boroujeni, M.S.; Dillenbourg, P. My Hands or My Mouse: Comparing a Tangible and Graphical User Interface Using Eye-Tracking Data. In Proceedings of the FabLearn Conference 2014, Stanford, CA, USA, 25–26 October 2014. [Google Scholar]
- Ahsan, Z.; Obaidellah, U. Spatial Temporal Eye-Tracking Indicators of Novice Programmers’ Skill. IEEE Access 2026, 14, 22304–22317. [Google Scholar] [CrossRef] [Scilit]
- Vanicek, T.; Vojtechovska, M.; Popelka, S. A Scoping Review of Eye-Tracking Studies on the Usability Evaluation of Interactive Geovisualisations. Int. J. Hum. Comput. Interact. 2026, 42, 14776–14801. [Google Scholar] [CrossRef] [Scilit]

Disclaimer/Publisher’s Note: The statements, opinions and data contained in all publications are solely those of the individual author(s) and contributor(s) and not of MDPI and/or the editor(s). MDPI and/or the editor(s) disclaim responsibility for any injury to people or property resulting from any ideas, methods, instructions or products referred to in the content. |
© 2026 by the authors. Licensee MDPI, Basel, Switzerland. This article is an open access article distributed under the terms and conditions of the Creative Commons Attribution (CC BY) license.