


Abstract
Learning Management Systems (LMSs) increasingly need mechanisms that capture how learners respond during interaction, yet few platforms provide facial emotion recognition (FER) as a native, integrated capability. This paper presents the design of a real-time FER software module built directly into Moodle, together with its experimental validation. The module is a browser-based, client-side component that continuously estimates facial-expression confidence scores (happy, neutral, sad, angry, fearful, surprised, disgusted) while a learner interacts with a course, and links each reading to the participant, the interaction context, and a timestamp. To validate the module under realistic and varied conditions, 25 undergraduate students used it while interacting with four Moodle scenarios (E1, E3, E7, E9) built with contrasting user experience (UX) and gamification configurations, which here serve only as diverse interaction contexts for testing the module rather than as a design comparison in their own right. Two hypotheses were tested: that the module produces stable, non-degenerate dominant facial-expression readings, rather than noise, during interaction (H1), and that these readings differ significantly across interaction contexts (H2). The module produced a clearly interpretable dominant facial-expression reading in every context (record-level dominance between 51.28% and 73.55%, above the level expected under a simplified uniform-chance baseline), supporting H1. A Friedman test on a study-defined affective-valence indicator showed significant differences across the four contexts (, , Kendall’s ), with five of six Bonferroni-adjusted Wilcoxon pairwise comparisons significant under the reported valence indicator (six of six under a robustness-check alternative), supporting H2, although the fixed scenario order means learning or familiarization effects cannot be excluded as a contributing factor. These results indicate that the module functions as intended and is sensitive to differences between interaction contexts; because the underlying pre-trained models were not independently benchmarked against the study population, this validates the module’s operation as a measurement instrument, not the accuracy of its facial-expression classifications against ground truth.
1. Introduction
Learning Management Systems (LMSs) such as Moodle mediate most of a learner’s interaction with course content, activities, and assessments, yet they typically capture very little about how a learner is responding while that interaction happens. Feedback is usually collected afterward, through questionnaires, grades, or completion logs, none of which reveal moment-to-moment affective variation during the session itself. Affective computing offers a way to close part of that gap: facial emotion recognition (FER) can continuously estimate facial-expression confidence scores from webcam video, without interrupting the learner’s task. FER outputs should nonetheless be treated as probabilistic indicators of facial-expression patterns, not as direct measurements of internal psychological states.
Most existing applications of FER in education rely on external tools layered on top of an LMS, or are demonstrated only in laboratory conditions detached from a real course. Comparatively little work reports a FER capability built directly into the LMS itself, running inside the course page the learner is already using, and validated under genuinely varied interaction conditions rather than a single fixed task. This is the gap this paper addresses.
This paper makes two contributions. The first, and central, contribution is a real-time FER software module developed and integrated directly into Moodle, described in Section 4. The second is an experimental validation of that module: 25 participants interacted with four Moodle scenarios (E1, E3, E7, E9), deliberately built with contrasting UX and gamification characteristics so that the module would be exercised under meaningfully different interaction conditions, while the module continuously captured facial-expression confidence scores. Two hypotheses guided this validation, introduced in Section 5.1: that the module produces stable, non-degenerate facial-expression readings during interaction, rather than noise (H1), and that these readings differ significantly across interaction contexts (H2). Validating the accuracy of those readings against independently labeled ground truth is outside the scope of this validation and is identified explicitly as future work (Section 6.3), not a claim made here.
2. Related Work
2.1. Facial Emotion Recognition in Educational and HCI Contexts
Affective computing extends HCI evaluation by incorporating computational analysis of affect-related signals during interaction. In digital learning environments, facial emotion recognition offers a non-contact mechanism for estimating facial-expression categories from webcam or video input. Deep-learning-based FER pipelines have been applied to real-time emotion and engagement monitoring in educational contexts [1,2,3], and multimodal studies have combined facial information with other interaction signals to improve reliability [4,5].
FER has also been incorporated into emotion-aware and adaptive learning systems to enrich the information available about learner interaction [6,7]. However, computational facial-expression categories should not be treated as equivalent to internal emotional states: predictions can vary with pose, illumination, webcam quality, individual characteristics, model limitations, and context. Privacy, explainability, and careful interpretation remain open concerns for educational FER [8]. Most of these systems, however, are reported as standalone tools or research prototypes rather than as components integrated directly into the LMS a course already runs on. Two lines of work are worth separating from the present contribution. First, Moodle plugins already do webcam-based facial capture, but for identity verification, not affect: they photograph a learner for post-hoc review or match the feed to a profile photo during a quiz [9,10]; neither classifies expression. Second, systems that do target affect are typically evaluated offline, fusing text, audio, and video rather than running live in-course [11], or are standalone prototypes outside a deployed LMS [12,13]. Benchmarked FER pipelines report 95–98% accuracy on curated datasets such as FER2013, CK+, and KDEF [14], the kind of validated performance the models used here lack for this population (Section 6.3). This module differs in kind: it targets affect, not identity, and runs natively, in real time, inside the Moodle page itself, rather than offline, separately, or as a prototype.
2.2. UX and Interaction Context in Learning Management Systems
Because this module needed to be validated under conditions realistic enough to stress-test its behavior, the study drew on prior work describing how LMS interfaces vary in usability and interaction quality. UX characteristics of Moodle and similar platforms have been associated with learner engagement, satisfaction, and acceptance [15,16], and heuristic evaluation, the User Experience Questionnaire, and learner-centered approaches have identified navigation clarity, instructional organization, and visual structure as relevant design factors [17,18,19]. Gamification elements such as points, badges, and progress indicators are commonly layered onto LMS content to influence motivation and participation [20,21,22,23]. In this paper, contrasting UX and gamification configurations are used purely as a source of varied, realistic interaction conditions under which to test the FER module; a companion line of work uses the same module to study whether detected affective patterns track these design configurations, which is not the focus here.
2.3. Research Gap and Positioning
Across this literature, FER is generally evaluated as an external instrument applied to a learning environment, or is embedded in an LMS only for identity verification rather than affect, rather than as a facial-affect capability built into the LMS itself and validated end-to-end, from webcam capture to structured, queryable records (Section 2.1). The present work addresses this gap directly: it reports the design of such a Moodle-integrated FER module (Section 4) and validates, through two hypotheses, that the module produces stable, non-degenerate facial-expression readings (H1) and is sensitive to differences between interaction conditions (H2); it does not, and does not claim to, validate the accuracy of those readings against independently labeled ground truth, which is left to future work (Section 6.3).
3. Research Architecture
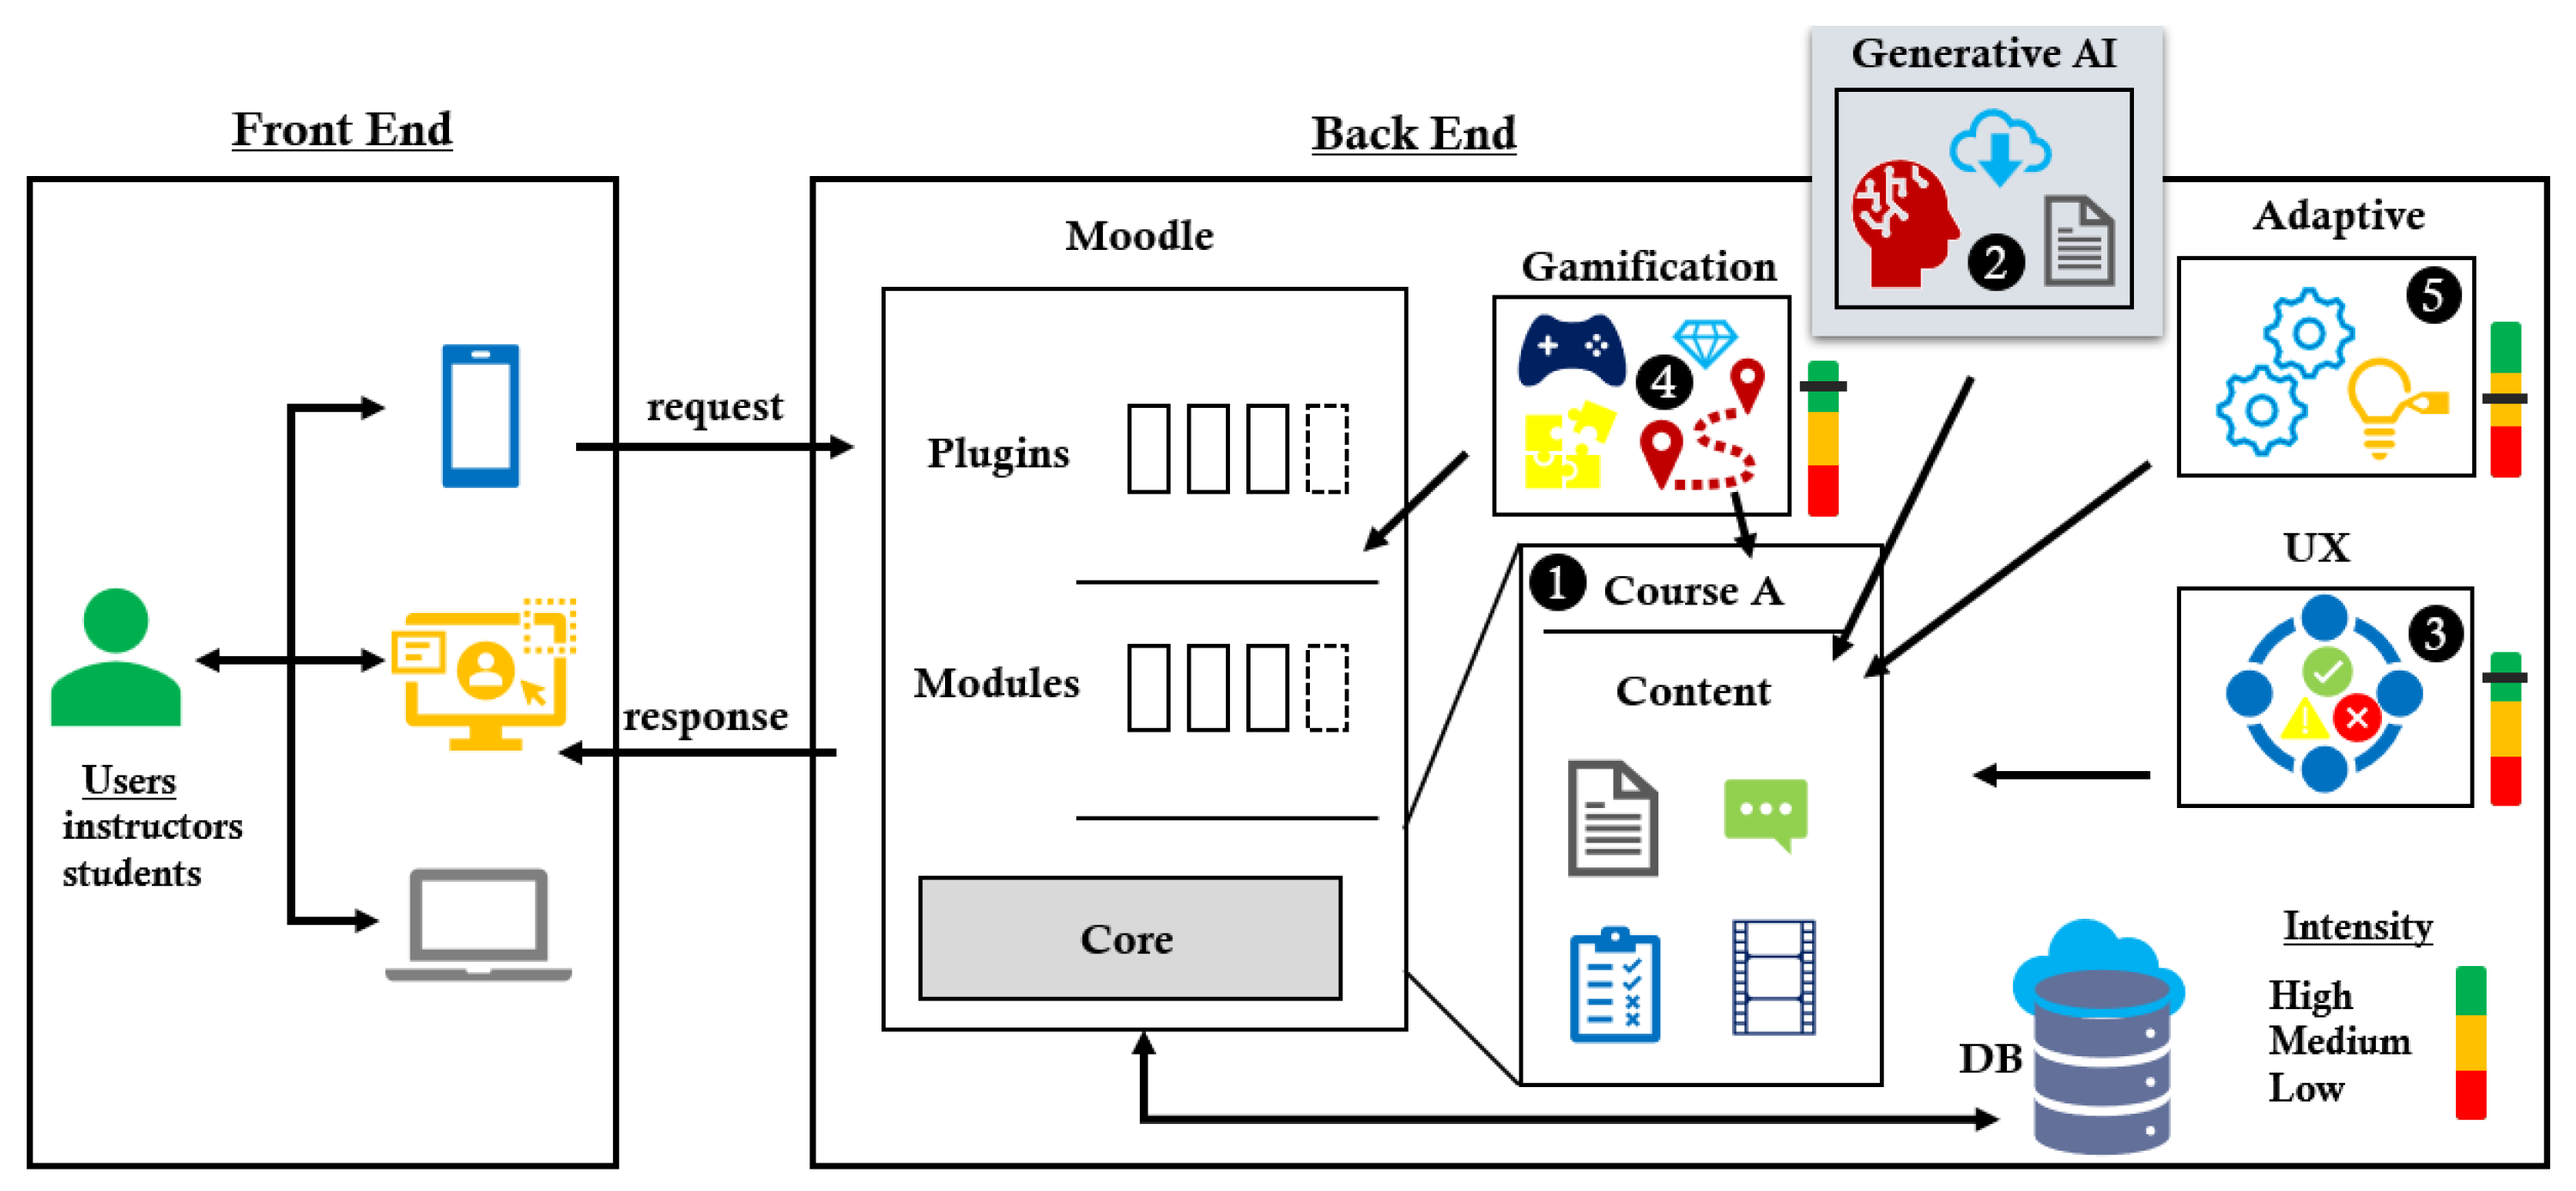
This work is situated within a broader Moodle-based learning architecture, shown in Figure 1, that integrates learning content, generative AI, UX, gamification, and future adaptive mechanisms. The complete architecture is not evaluated in this paper; it is shown only to situate the module within the broader system it was built for.
Figure 1.
Global schema of the Moodle-based learning architecture [24].
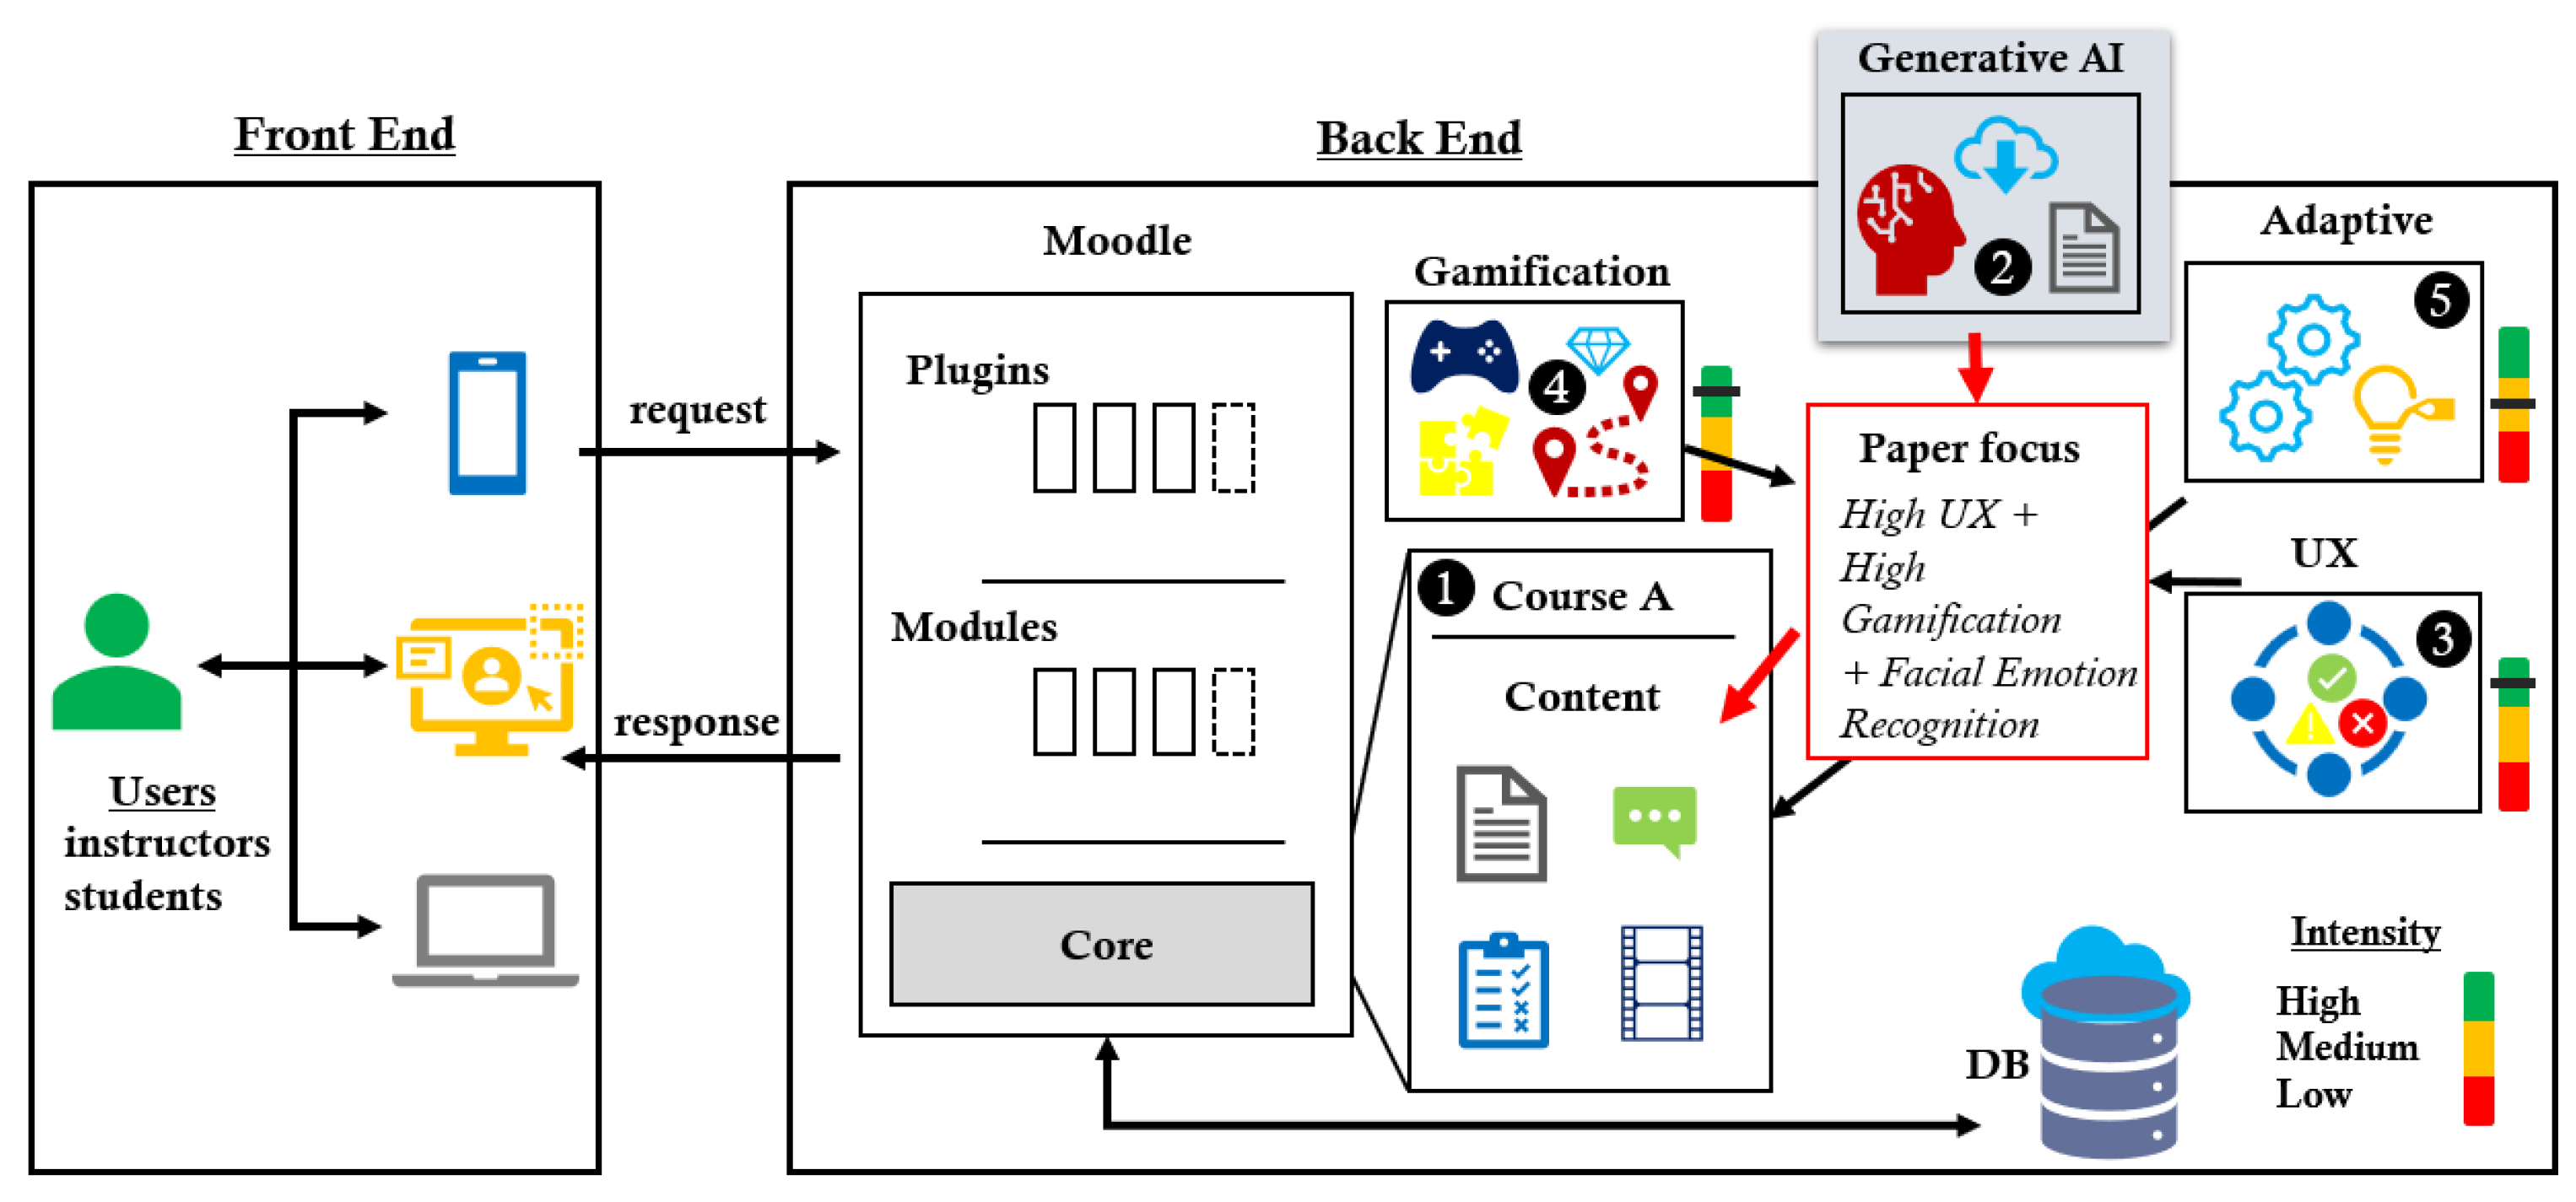
Within that global architecture, Figure 2 locates the specific pathway this research program targets: UX, gamification, and facial-emotion-recognition signals feeding a prompt set intended to guide generative-AI content creation. The FER module presented in this paper (Section 4) is the facial-emotion-recognition component.
Figure 2.
Research focus of the present study within the validated architecture. Arrows indicate the direction of information flow toward the prompt set that guides generative-AI content creation. The red box and red arrows highlight the specific combination of signals (“High UX + High Gamification + Facial Emotion Recognition”) that constitutes this study’s research focus within the broader architecture.
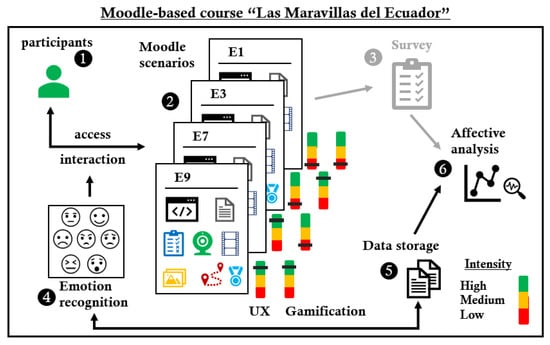
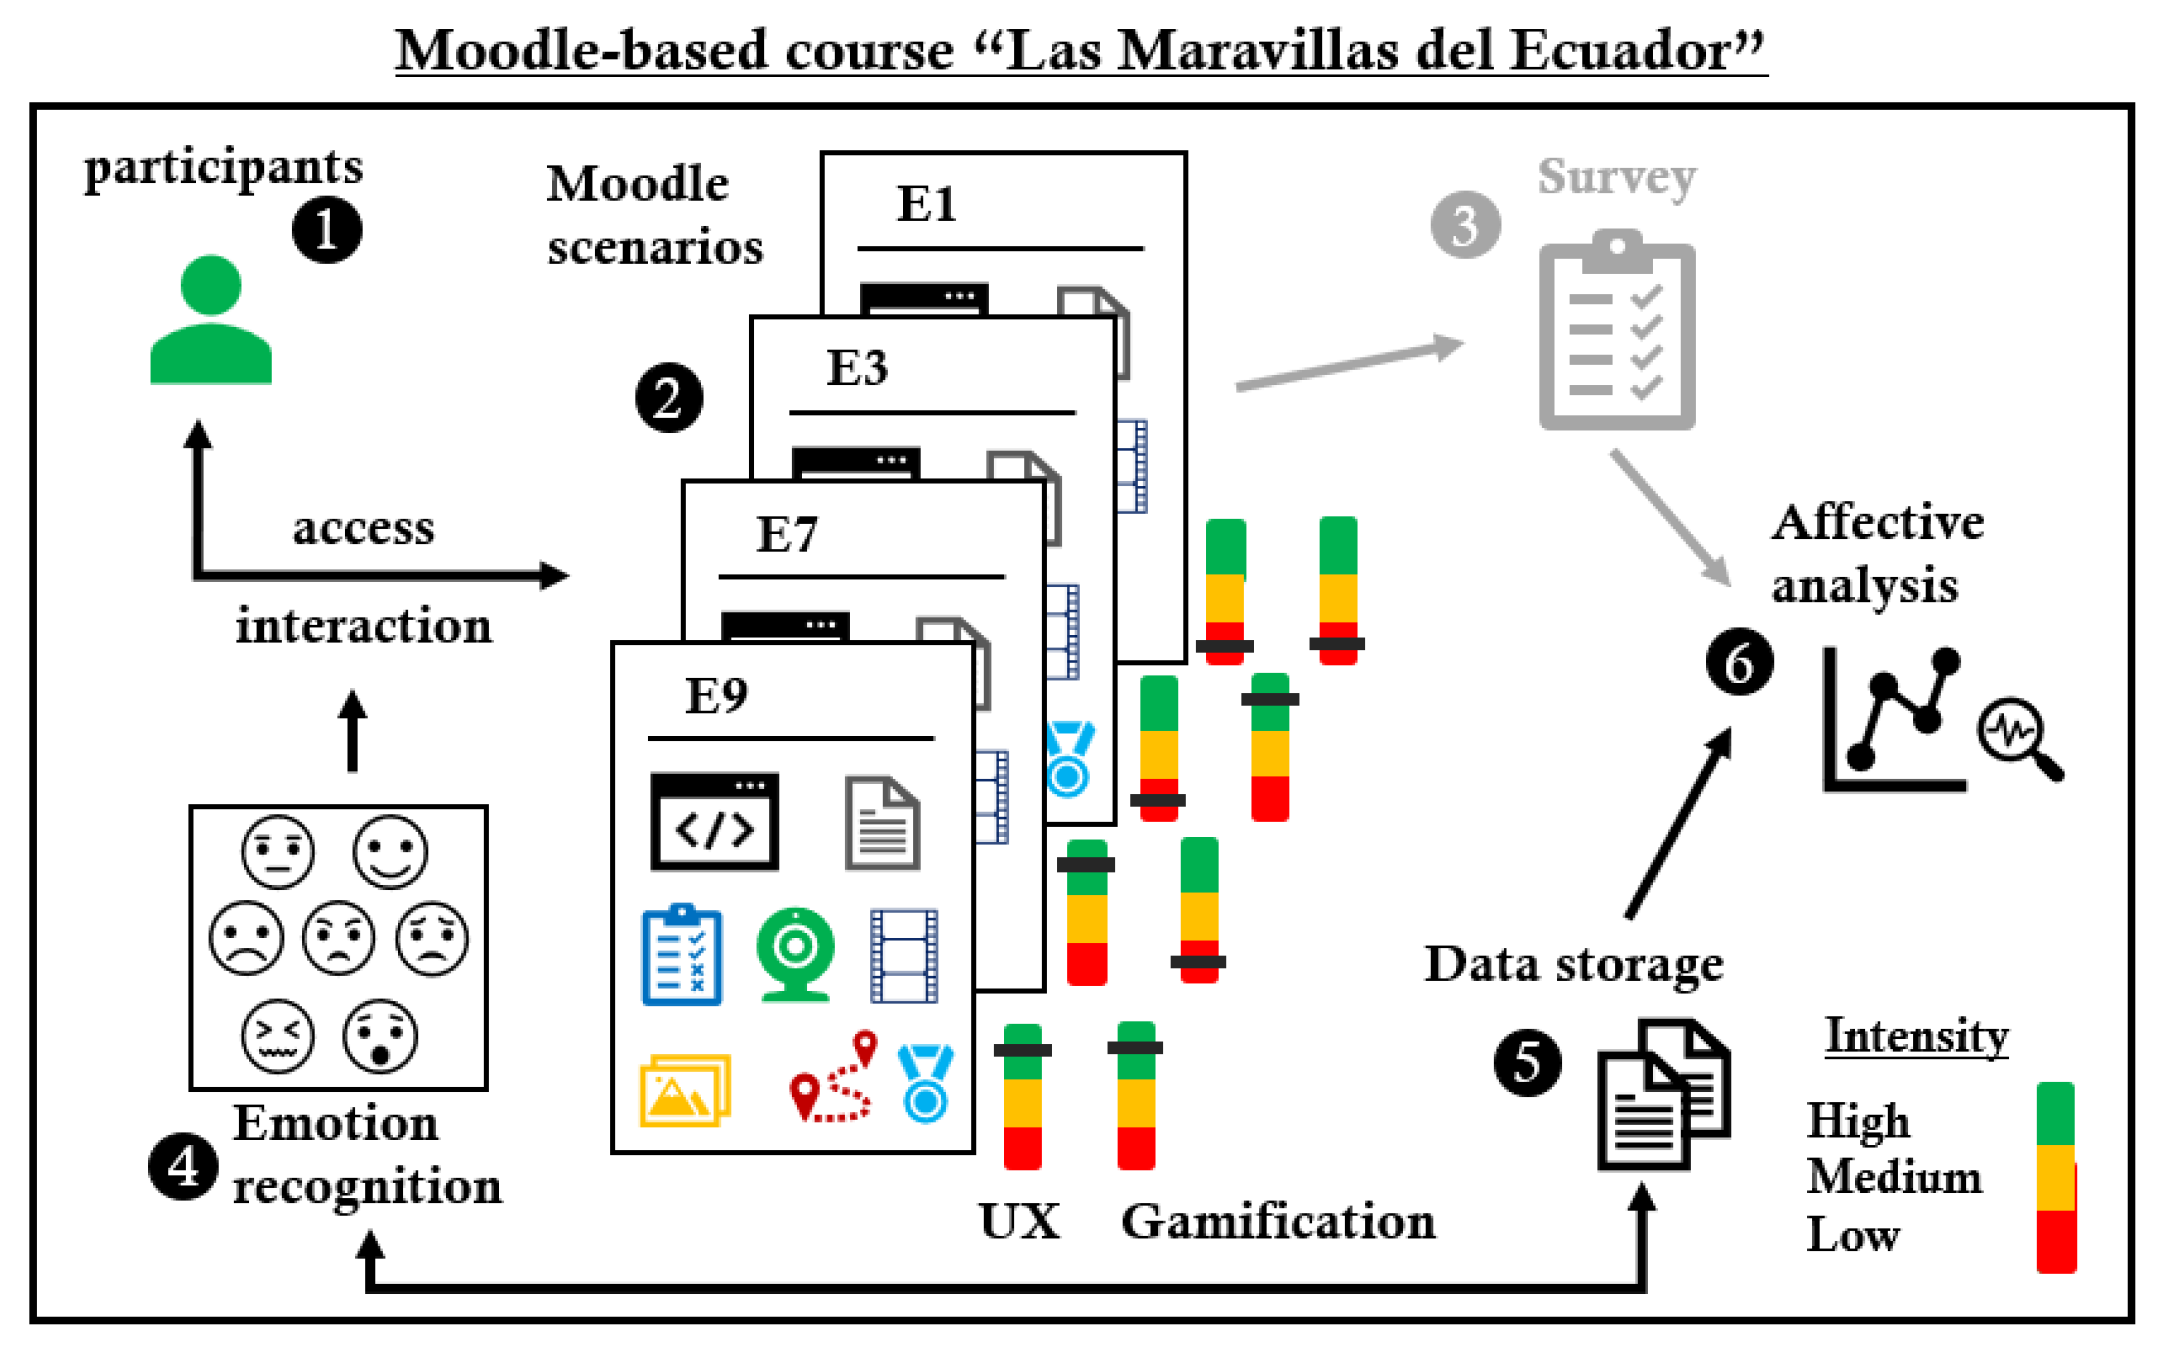
The empirical scope of this paper is restricted to the FER module itself and its validation. Figure 3 shows how this scope was operationalized: participants interacted with four Moodle scenarios while the module continuously generated facial-expression confidence scores, each linked to participant, scenario, and interaction time. Black connections mark the FER-derived data analyzed in this paper; gray connections mark complementary data collected in the same protocol but analyzed elsewhere.
Figure 3.
Experimental architecture and data flow. Black connections represent FER-based data analyzed in this study; gray connections represent complementary data analyzed separately.
4. The Moodle-Integrated FER Software Module
The module is the central contribution of this paper, so it is described here on its own terms, independently of the validation experiment that follows in Section 5. It was developed by the authors following the Scrum framework.
4.1. Integration and Interface Design
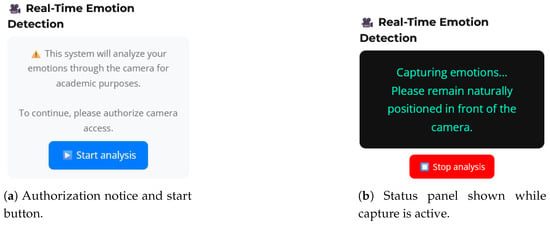
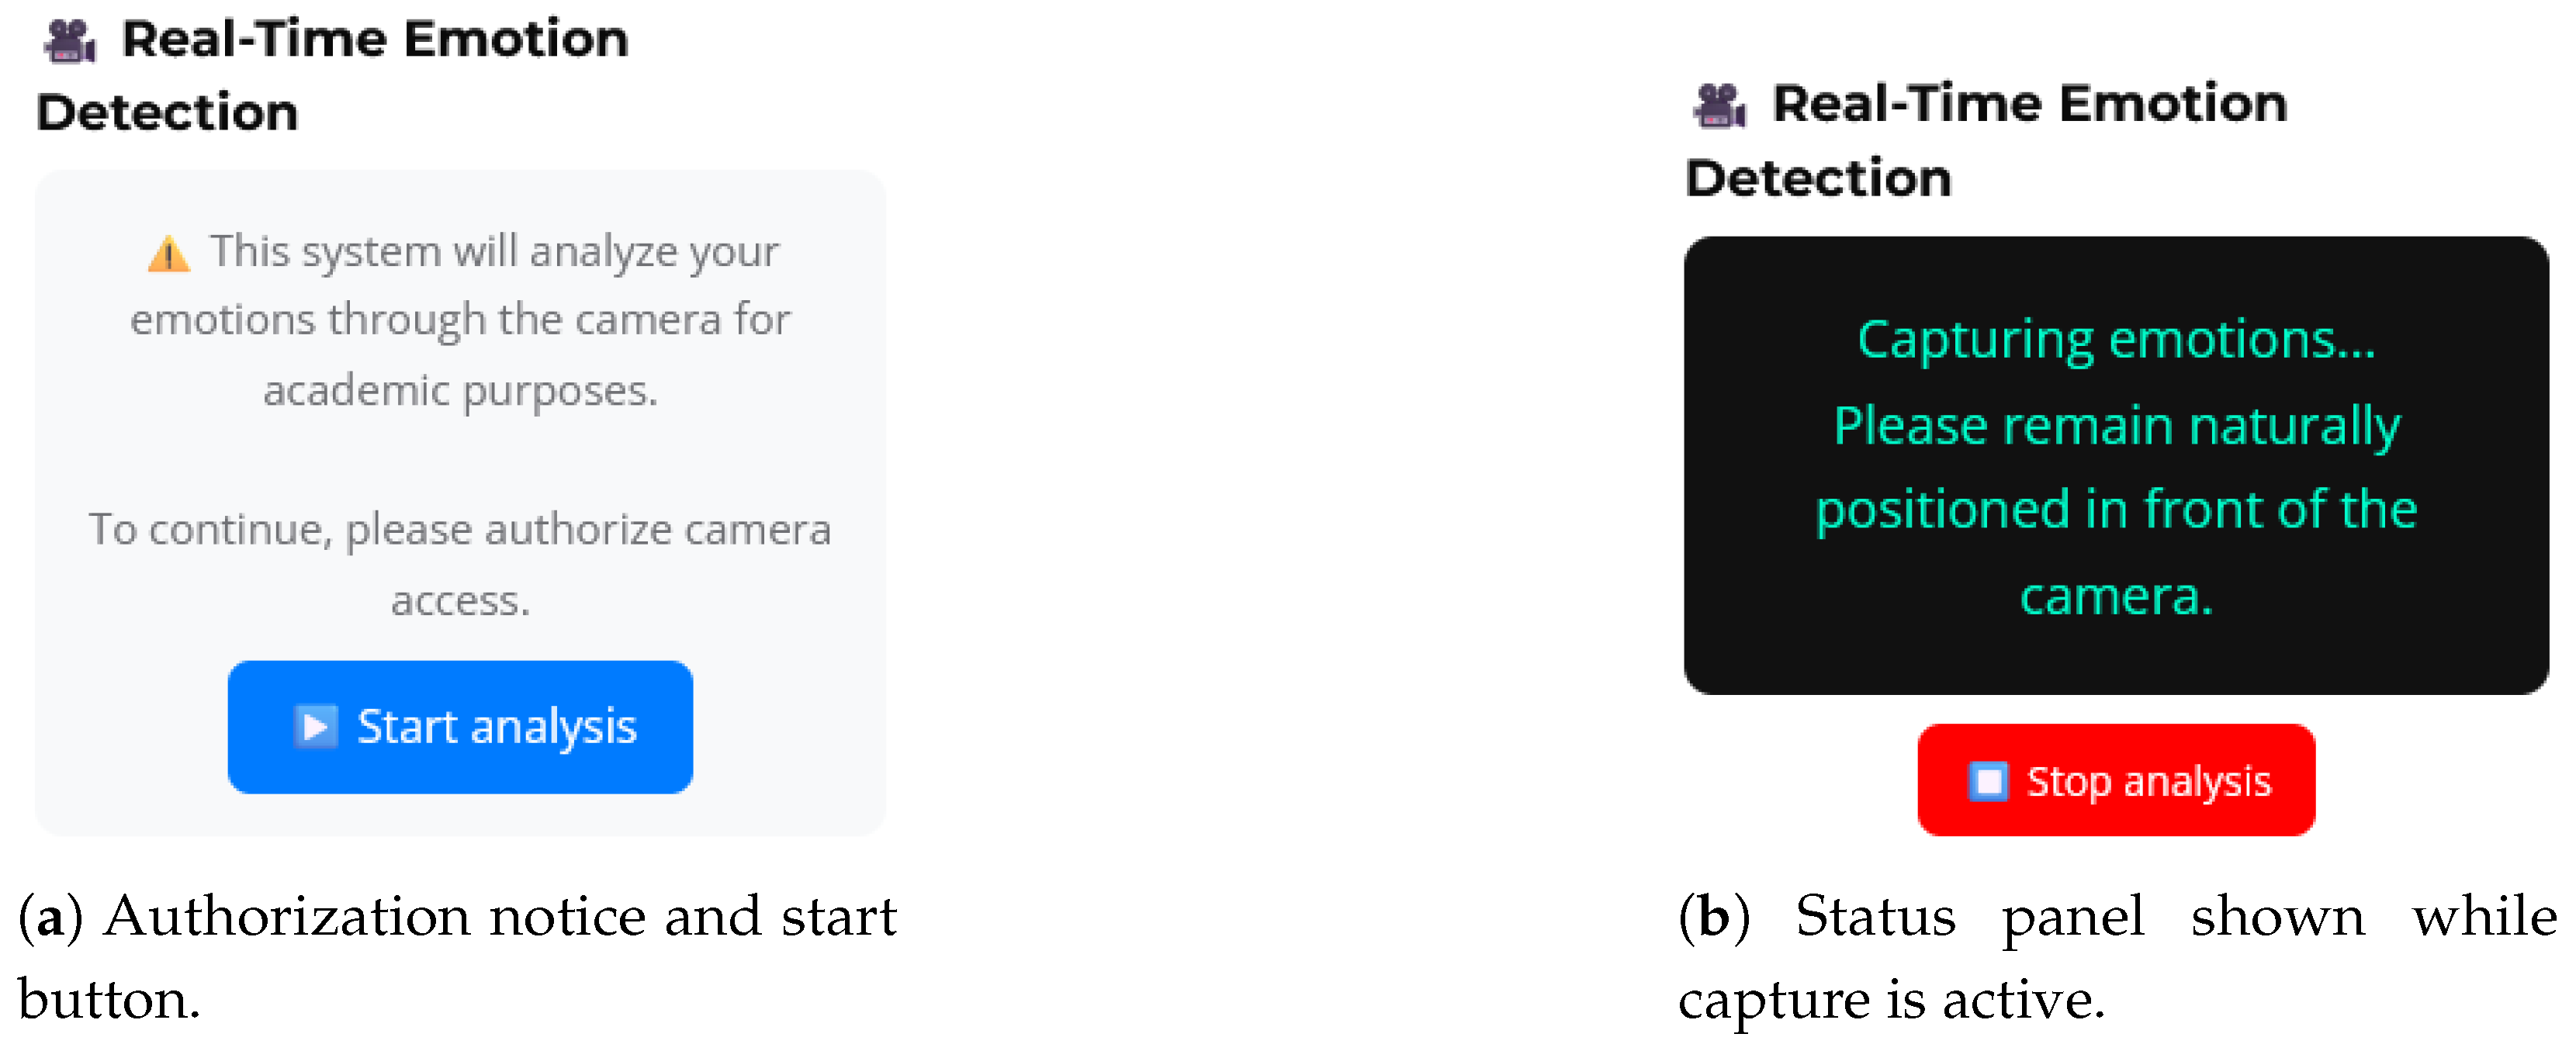
The module is added to a Moodle course as a Custom HTML block: a single HTML fragment, placed directly on the course page, containing the interface markup and two script tags that load face-api.js and the module’s own capture logic from the course server. No Moodle plugin installation or core modification is required. The block exposes two states to the learner, shown in Figure 4. Before capture starts, a notice explains, in Spanish, that the system will analyze the learner’s emotions via the camera for academic purposes and asks them to authorize camera use, with a single “Iniciar análisis” (start analysis) button. Once authorized and started, the notice is replaced by a status panel reading “Capturando emociones… Por favor mantente frente a la cámara de forma natural” (capturing emotions, please stay facing the camera naturally), together with a “Detener análisis” (stop analysis) button that ends the session on demand.
Figure 4.
The two states of the Moodle-embedded FER block: (a) before capture, requesting explicit webcam authorization; (b) during capture, showing only a status message and a stop control. Interface text is shown in Spanish, the language of the actual deployment; English translations are given in the main text (Section 4).
By deliberate design, the learner’s own webcam feed is never displayed: the underlying <video> element is kept in the page at zero opacity, and the code that would draw a live bounding box or landmark overlay onto it is present but disabled. During interaction the learner therefore sees only the short status message in Figure 4b, not a mirror of their own face or a live readout of detected emotions, which keeps the capture unobtrusive and avoids turning the course page into a self-monitoring display.
4.2. Detection Pipeline
Once started, the module loads four pre-trained face-api.js models, TinyFaceDetector, FaceLandmark68Net, FaceExpressionNet, and FaceRecognitionNet, and begins sampling the (hidden) webcam feed on a fixed 100 ms interval. Each detection cycle localizes the face, resolves 68 facial-landmark points, and produces confidence scores in for seven facial-expression categories: happy, neutral, sad, angry, fearful, surprised, and disgusted. The fourth model, FaceRecognitionNet, is loaded at startup but not exercised by the detection loop reported in this paper (no face descriptor is computed); it is retained in the codebase for future learner re-identification features, and is noted here for completeness rather than as part of the present pipeline. Loading an unused model is an acknowledged inefficiency, adding avoidable overhead with no benefit to the reported loop; removing it, or gating its loading behind the feature that would use it, is left as a cleanup item for future work.
4.3. Data Capture and Storage
When a 100 ms cycle finds no face in the frame, the detection loop iterates over zero results and the cycle silently contributes no record, rather than writing an empty or null entry; the per-scenario record counts reported in this paper therefore reflect cycles with at least one detected face, not every cycle of the underlying 100 ms sampling grid. Missed cycles per scenario were computed directly as expected cycles minus actual records (a single successful cycle produces exactly one record, so this subtraction is exact, not an approximation): E1, 53,370 − 53,297 = 73 (0.14%); E3, 44,145 − 44,006 = 139 (0.31%); E7, 39,579 − 39,530 = 49 (0.12%); E9, 34,912 − 34,792 = 120 (0.34%); overall, 172,006 − 381 = 171,625 (0.22%), which exactly reconciles the total expected cycles with the 171,625 records analyzed throughout this paper, with no additional records unaccounted for. Because the FER module’s capture is learner-controlled via the start/stop buttons described in Section 4 rather than active for the full scenario duration, the 171,625 records analyzed here correspond to active-capture spans averaging 2.87 min per session (median 2.01 min, range 0.08–27.23 min), not to continuous capture across the full ∼45 min of scenario interaction reported in Section 5; the 45 min figure describes overall interaction time with the Moodle scenario content, of which FER capture covered only a learner-controlled subset. Each detection cycle that does find a face is sent immediately as a JSON record, the seven confidence scores and a timestamp, to a course-server PHP endpoint over HTTP, tagged with the learner’s username and course name (both read directly from the Moodle page) and a generated session filename. The endpoint appends each record as one JSON line to a per-session text file on the server (no database is used); the learner’s Moodle-derived username is written into this raw file at capture; access is restricted to the research team via server credentials, and records are pseudonymized before analysis. All scenario-level and participant-level aggregates reported in this paper are computed directly from these raw per-detection logs, following the procedure in Section 5.1.
4.4. Snapshot Evidence for High-Confidence Detections
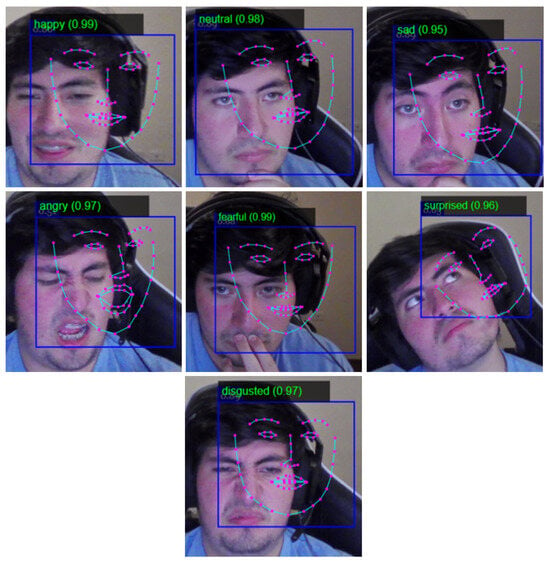
As a secondary, qualitative evidence channel, the module captures a still image the first time each of the seven expression categories exceeds a 0.90 confidence score in a given session, so at most seven snapshots are produced per participant per scenario. Unlike the live interface, these snapshots are rendered with the face-detection box, the 68 landmark points, and a text label with the predicted category and confidence overlaid on the frame, which is what makes them useful for manual, visual inspection after the fact. Figure 5 shows one participant’s snapshots across all seven categories, captured this way during piloting of the module. Each snapshot is stored under a filename keyed only by participant, course, and category, without a session or timestamp component; a later session that again crosses the 0.90 threshold for the same category overwrites the earlier image, so only the most recent qualifying snapshot per participant-course-category combination is retained on disk.
Figure 5.
Snapshot evidence captured by the module when each facial-expression category first exceeded the 0.90 confidence threshold in a session, shown here for one participant across all seven categories. Each snapshot overlays the detected face box, 68 landmark points, and the predicted category with its confidence score. Overlay colors follow the module’s own annotation scheme (face box, landmark points, and predicted category label).
4.5. Researcher-Facing Analytics Dashboards
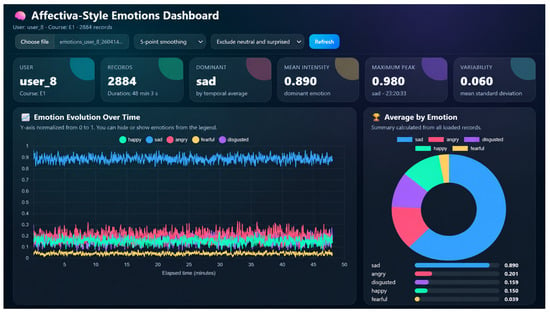
Because raw per-detection JSON records are not directly interpretable, the module is paired with a companion web dashboard, built for the research team rather than for learners, that loads a session’s records and visualizes them. Figure 6 shows its main view: summary cards for the session (records processed, dominant category, mean intensity, peak value and when it occurred, and a variability statistic), a smoothed temporal trace of all five signed categories, a mean-confidence donut chart, and, further down the same page, a chart of how often each category was the momentary dominant one and a scrollable table of the underlying per-record values. Two configurable options, adjustable smoothing and the option to exclude neutral and surprised, correspond directly to the analysis choices described in Section 5.1.
Figure 6.
Researcher-facing analytics dashboard for an example session: summary cards, temporal confidence trace, and mean-confidence breakdown.
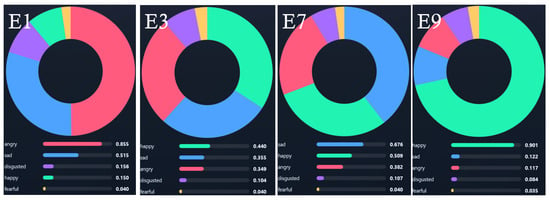
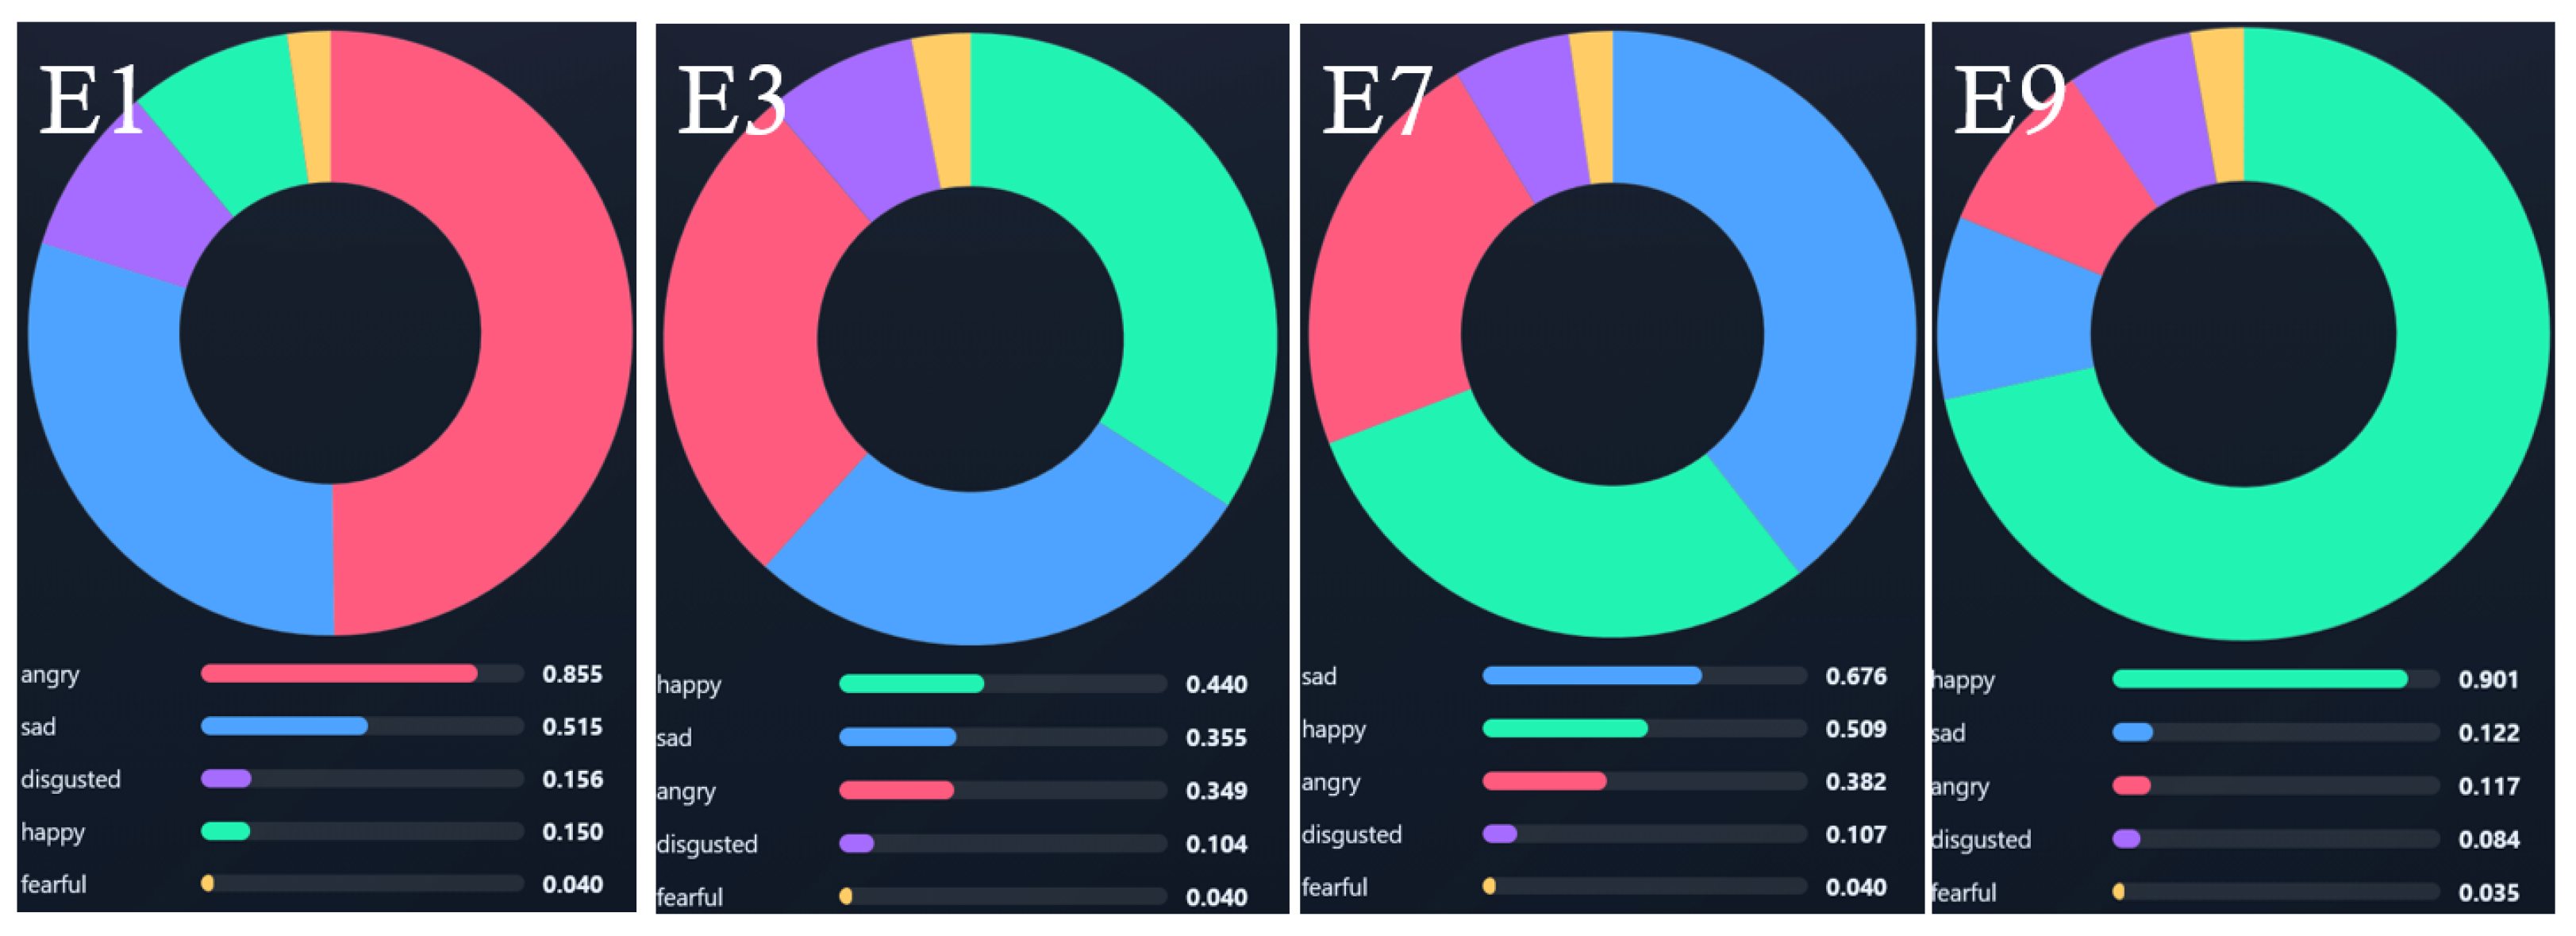
A second, simpler dashboard view (Figure 7) aggregates one donut chart per scenario directly, which is the view used to sanity-check scenario-level patterns during data collection. In both dashboards, the specific figures shown are illustrative of the tool’s interface and of individual example sessions; the statistically analyzed results for the study as a whole are reported in Section 6.
Figure 7.
Per-scenario summary view of the simpler dashboard, showing one example session’s mean confidence per category for each of E1, E3, E7, and E9.
4.6. Technical Summary
Table 1 summarizes the module’s components. The pre-trained face-api.js models were used as provided, without retraining or independent benchmarking on the study population, so no additional accuracy, precision, recall, or F1-score figures are reported here; throughout this paper, model outputs are treated as probabilistic facial-expression confidence scores, not as direct measurements of participants’ internal emotional states.
Table 1.
Technical characteristics of the Moodle-integrated facial emotion recognition module.
5. Experimental Study
This section describes how the module described in Section 4 was exercised and validated.
5.1. Goal and Hypotheses
The goal was to validate the FER module under varied, realistic interaction conditions rather than a single fixed task. Four Moodle scenarios (E1, E3, E7, E9), built with contrasting UX and gamification characteristics, provided that variety. Both hypotheses concern the module’s functional operation, not classification accuracy against independently labeled ground truth, which this study does not evaluate (Section 6.3):
Hypothesis 1.
The Moodle-integrated FER module produces stable, non-degenerate dominant facial-expression readings, rather than noise or flat output, during learner interaction across the four scenarios (E1, E3, E7, and E9).
Hypothesis 2.
There are statistically significant differences among the facial-expression readings produced by the module across scenarios E1, E3, E7, and E9.
5.2. Interaction Contexts
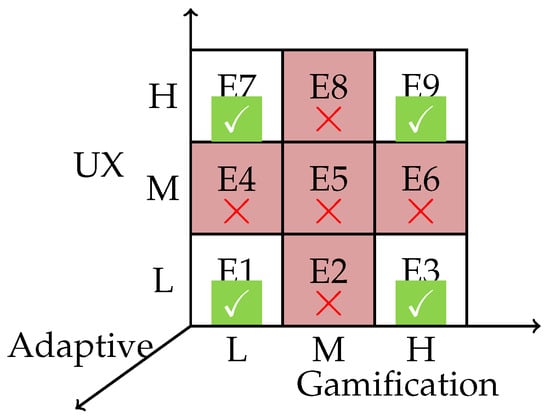
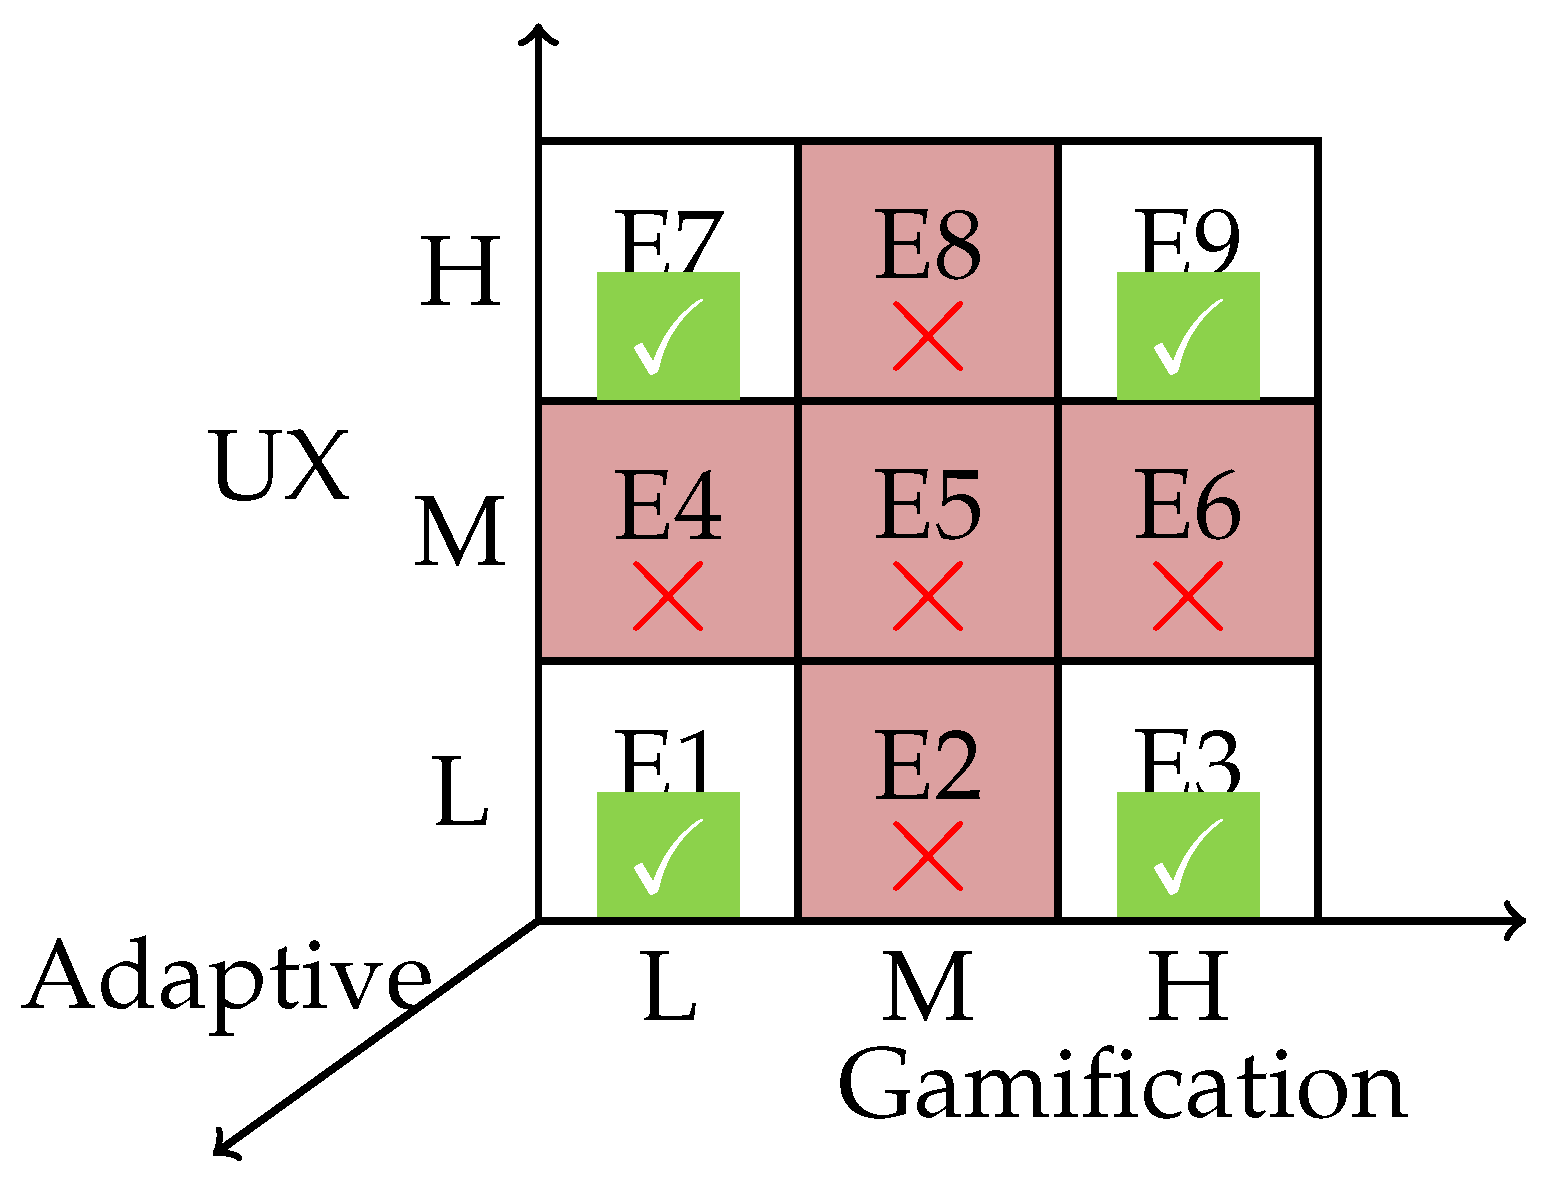
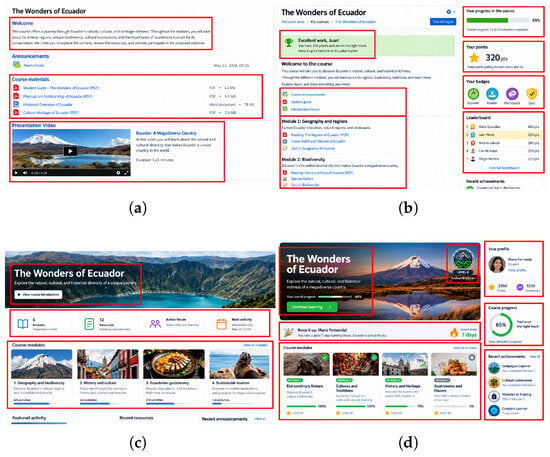
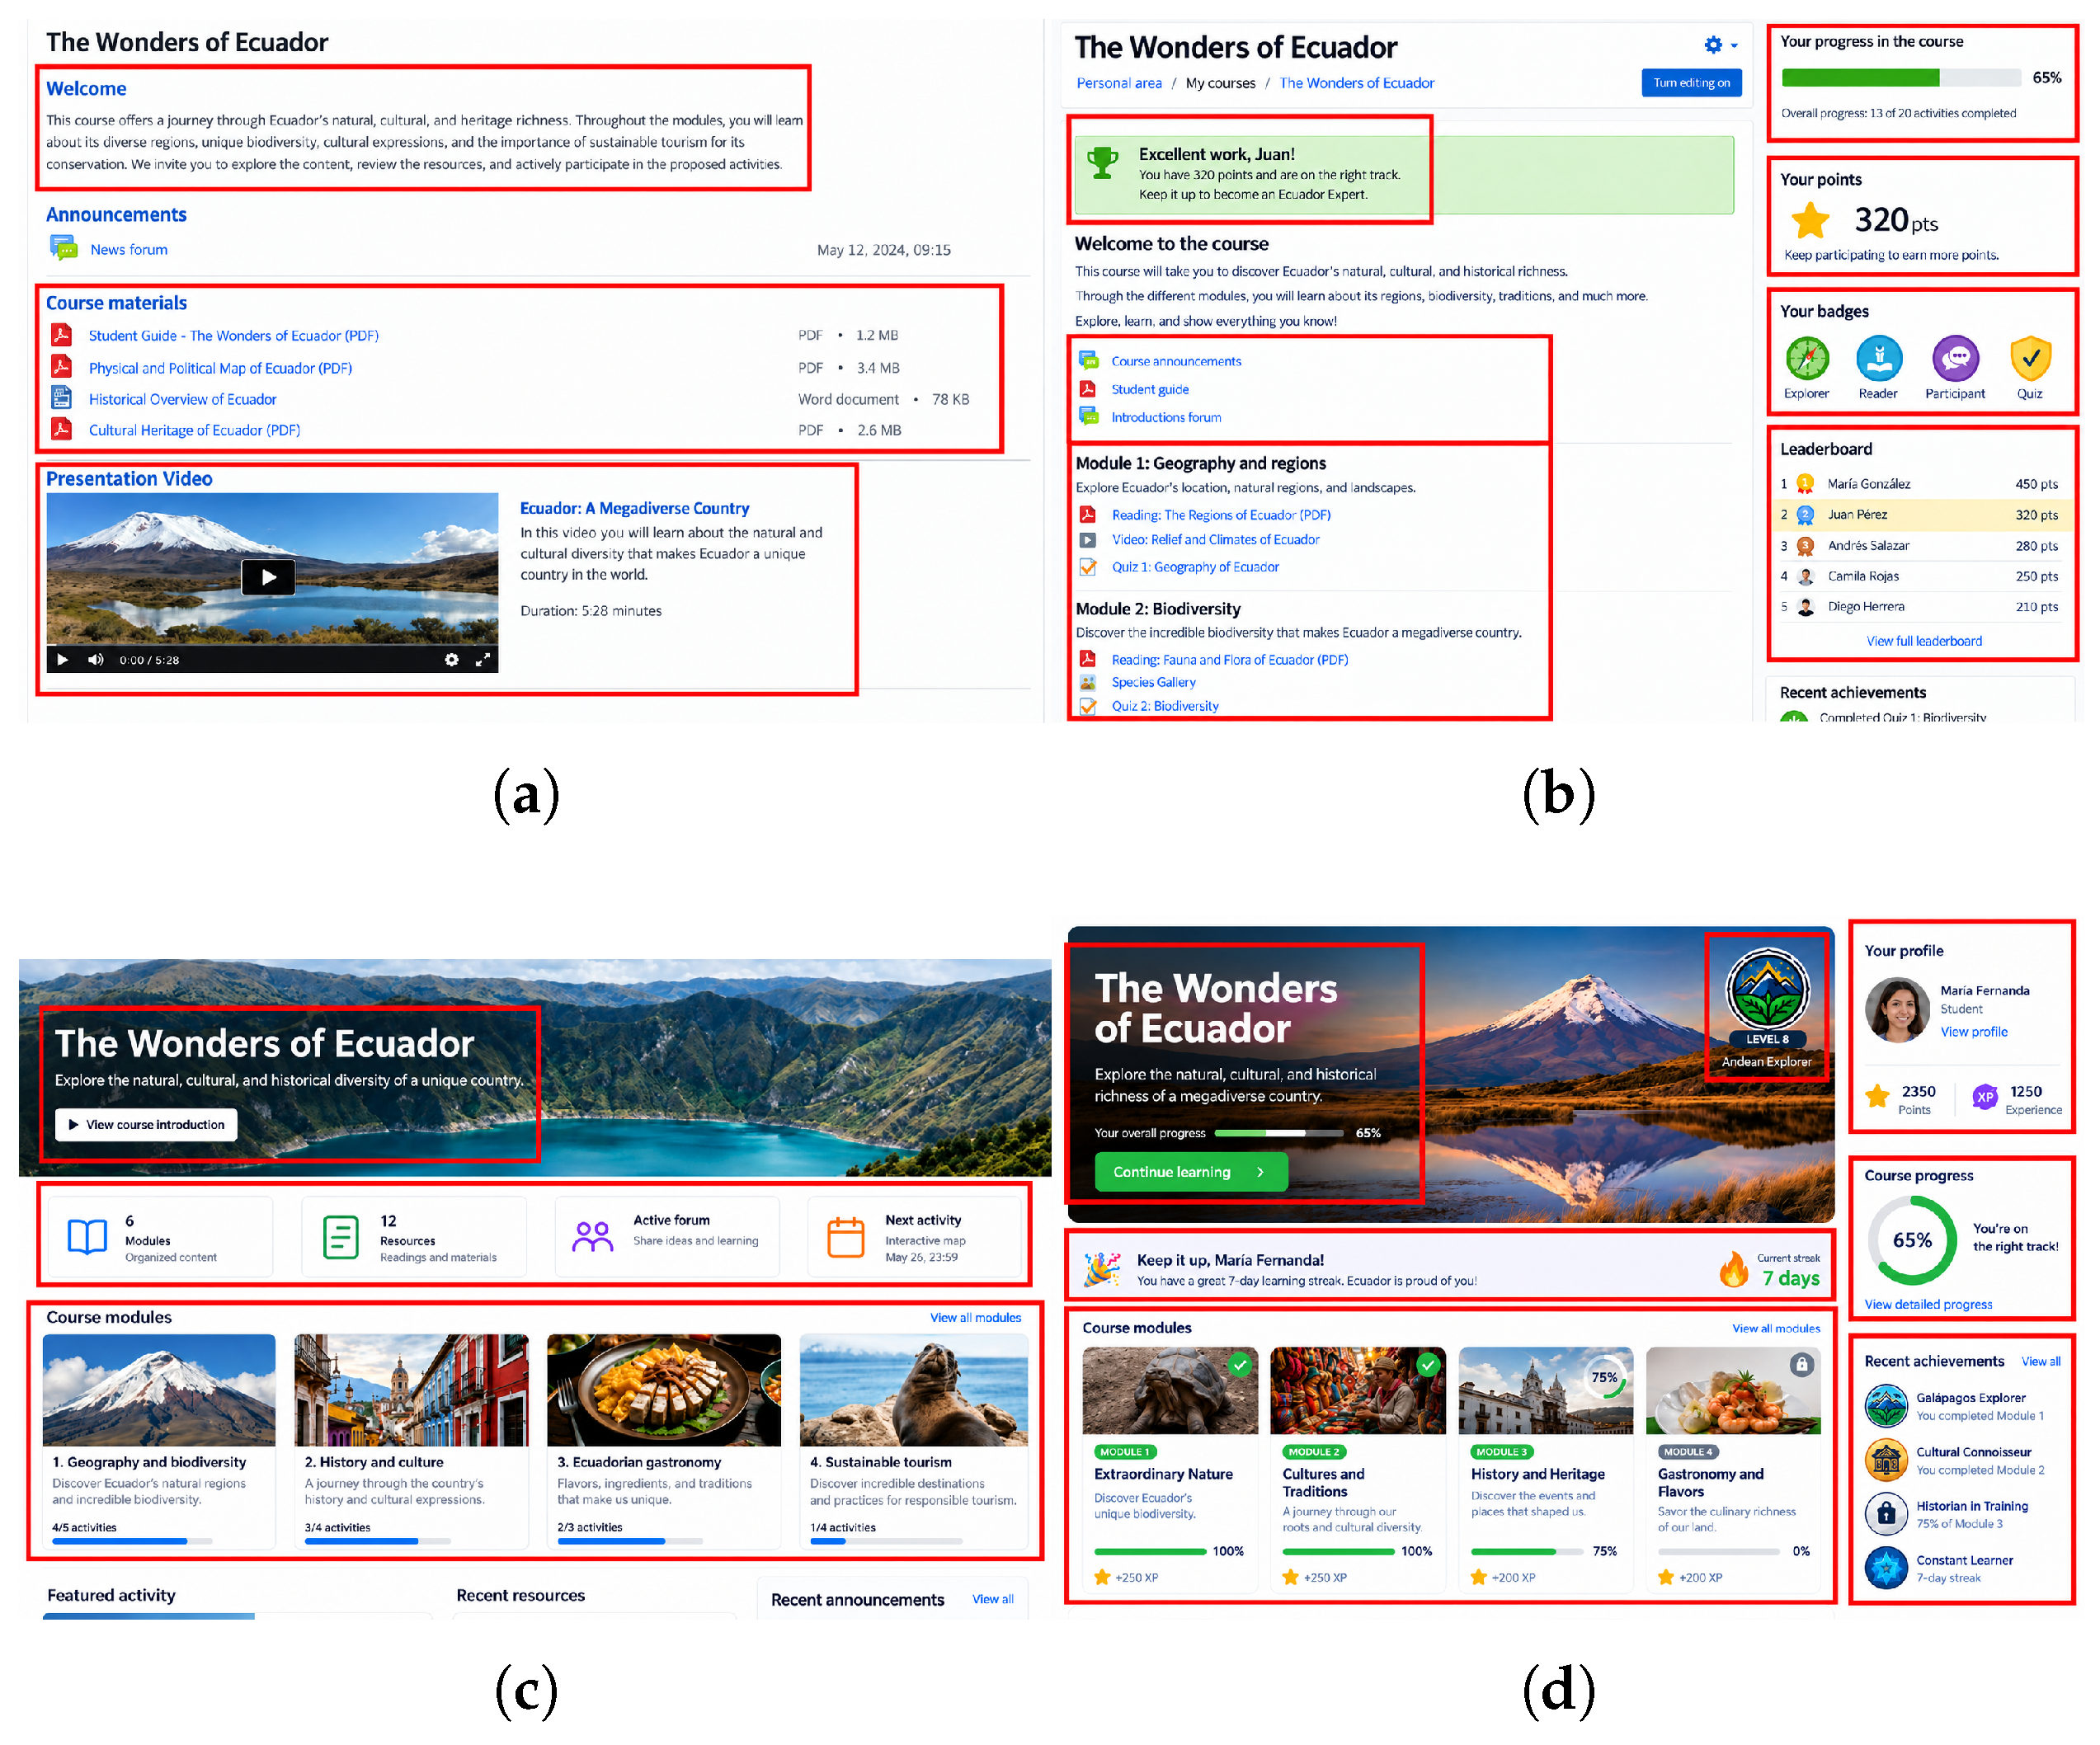
A conceptual UX × gamification matrix (low, medium, high) defined the design space from which four corner configurations were selected to maximize contrast: E1 (low UX, low gamification), E3 (low UX, high gamification), E7 (high UX, low gamification), and E9 (high UX, high gamification), summarized in Figure 8. Intermediate configurations were not implemented, to limit session length and participant fatigue while still giving the module clearly distinct conditions to operate under. Figure 8 also shows a third, “Adaptive” axis inherited from the broader architecture this module is part of (Section 3); that axis was held constant and not implemented in the present study, which manipulates only the two axes, UX and gamification, described above, and is shown for architectural context rather than as a third experimental factor.
Figure 8.
Selection of the four contrasting interaction contexts used to validate the module. Checkmarks (✓) mark the four selected corner scenarios (E1, E3, E7, E9); crosses (×) mark the intermediate configurations not implemented in this study.
The four scenarios shared the same course topic, learning objectives, and core instructional content, varying only UX and gamification characteristics, summarized in Table 2. ChatGPT was used only as a design-support tool during early prototyping; final configurations were manually implemented and reviewed in Moodle. Figure 9 shows the four resulting interfaces.
Table 2.
Instructional, UX, gamification, and assessment elements implemented in each interaction context. Checkmarks (✓) indicate the element is present in that scenario; crosses (×) indicate it is absent.
Figure 9.
Moodle scenario interfaces: (a) E1, low UX and low gamification; (b) E3, low UX and high gamification; (c) E7, high UX and low gamification; and (d) E9, high UX and high gamification. Red boxes highlight the instructional, UX, and gamification elements implemented in each scenario. Interface text is shown in Spanish, the language of the actual deployment.
5.3. Participants and Procedure
Twenty-five undergraduate Software Engineering/Programming students (mean age ≈ 21) completed all four scenarios and produced valid FER records, following the THEDRE research process [25]. Each participant authorized webcam access, then interacted with E1, E3, E7, and E9 in that fixed order through the “Las Maravillas del Ecuador” course on the EducaLab.EC Moodle platform, approximately 45 min per scenario, independently and without instructor intervention, while the module logged facial-expression confidence scores during the learner-controlled active-capture intervals described in Section 4, rather than continuously throughout the scenario. Because the sequence always moved from low to high UX/gamification, it is treated as a limitation rather than a controlled factor (Section 6.3). A broader post-interaction questionnaire was collected as part of the same protocol but is outside the scope of this paper.
5.4. From Raw Detections to a Comparable Signal
Every detection carries all seven facial-expression categories, but neutral was excluded from the comparative analysis because it is typically the most frequent output of the underlying pre-trained model and its prevalence would dominate any aggregate, and surprise was excluded as well (its valence is context-dependent), leaving . Because the dominant category for each record is defined as the maximum confidence score within E, every record contributes to the analysis regardless of what its highest-scoring category among all seven would have been; no records are excluded on this basis, and the denominators for the record-level percentages in Table 3 are the full per-scenario record counts (E1: 53,297; E3: 44,006; E7: 39,530; E9: 34,792; total 171,625). Separately, neutral or surprised was the overall (seven-category) dominant output for a large majority of records in E3 and E7 (99.70% and 97.94%, respectively) but a minority in E1 and E9 (42.32% and 38.59%); for those records, the five-category dominant reported here reflects a comparatively weaker, runner-up signal rather than the strongest signal the model produced overall, a distinction readers should bear in mind when interpreting Table 3, though it does not affect which records are included. For record i, the dominant category is . Averaging each category over participant u and scenario s gives a participant-level profile, , whose dominant category is the highest-scoring . To compare scenarios with a single number, a study-defined affective-valence indicator was computed as
used purely as an operational comparison measure, not as a standardized psychological scale. The four negative categories are weighted equally without empirical or theoretical justification; since sad dominated the two low-UX scenarios (Table 3), this composite may be driven disproportionately by that one category. A more conservative alternative, , was computed as a robustness check. A Friedman test on also found significant differences across scenarios (, , Kendall’s ), and all six Bonferroni-corrected Wilcoxon pairwise comparisons were significant under , including E1 vs. E3 (), which was not significant under V. The overall conclusion that the module is sensitive to differences across scenarios is therefore robust to this alternative definition; the E1 vs. E3 non-significance reported under V does not replicate under and is accordingly not treated as a genuine sensitivity limit of the module (Section 6.2). Because the same 25 participants produced a value for every scenario, valence was compared with a Friedman test (Kendall’s W as effect size), followed, given a significant omnibus result, by six Bonferroni-corrected Wilcoxon signed-rank pairwise comparisons ().
Table 3.
Facial-expression dominance and affective valence by interaction context.
6. Results
6.1. H1: The Module Produces Stable, Non-Degenerate Readings
Across 25 participants × 4 scenarios × 7 categories, the module produced a clearly interpretable dominant facial-expression category in every scenario, both by mean confidence and by record-level frequency (Table 3). Record-level dominance ranged from 51.28% to 73.55%, above the ∼20% (or ∼14% among all seven) a uniform-chance baseline implies; because pre-trained models are not guaranteed to treat categories as equally likely, some may be favored by the model’s own base rate regardless of true expression, so this is offered as a coarse sanity check, not a rigorous test. What the readings do rule out is degenerate output: the module consistently resolved a clear dominant expression rather than returning flat, uniform, or random-looking scores, which is the basic functional claim behind H1. This shows the module operates and yields differentiated output, not that its emotion labels are correct, since the pre-trained models were not benchmarked against this study’s population (Section 6.3).
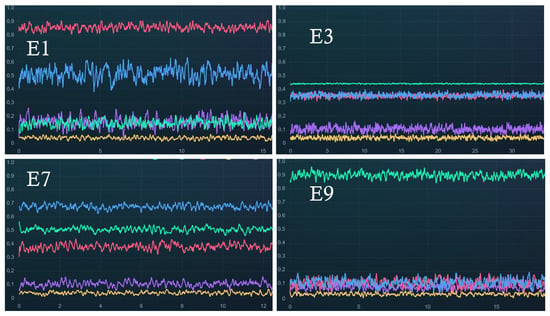
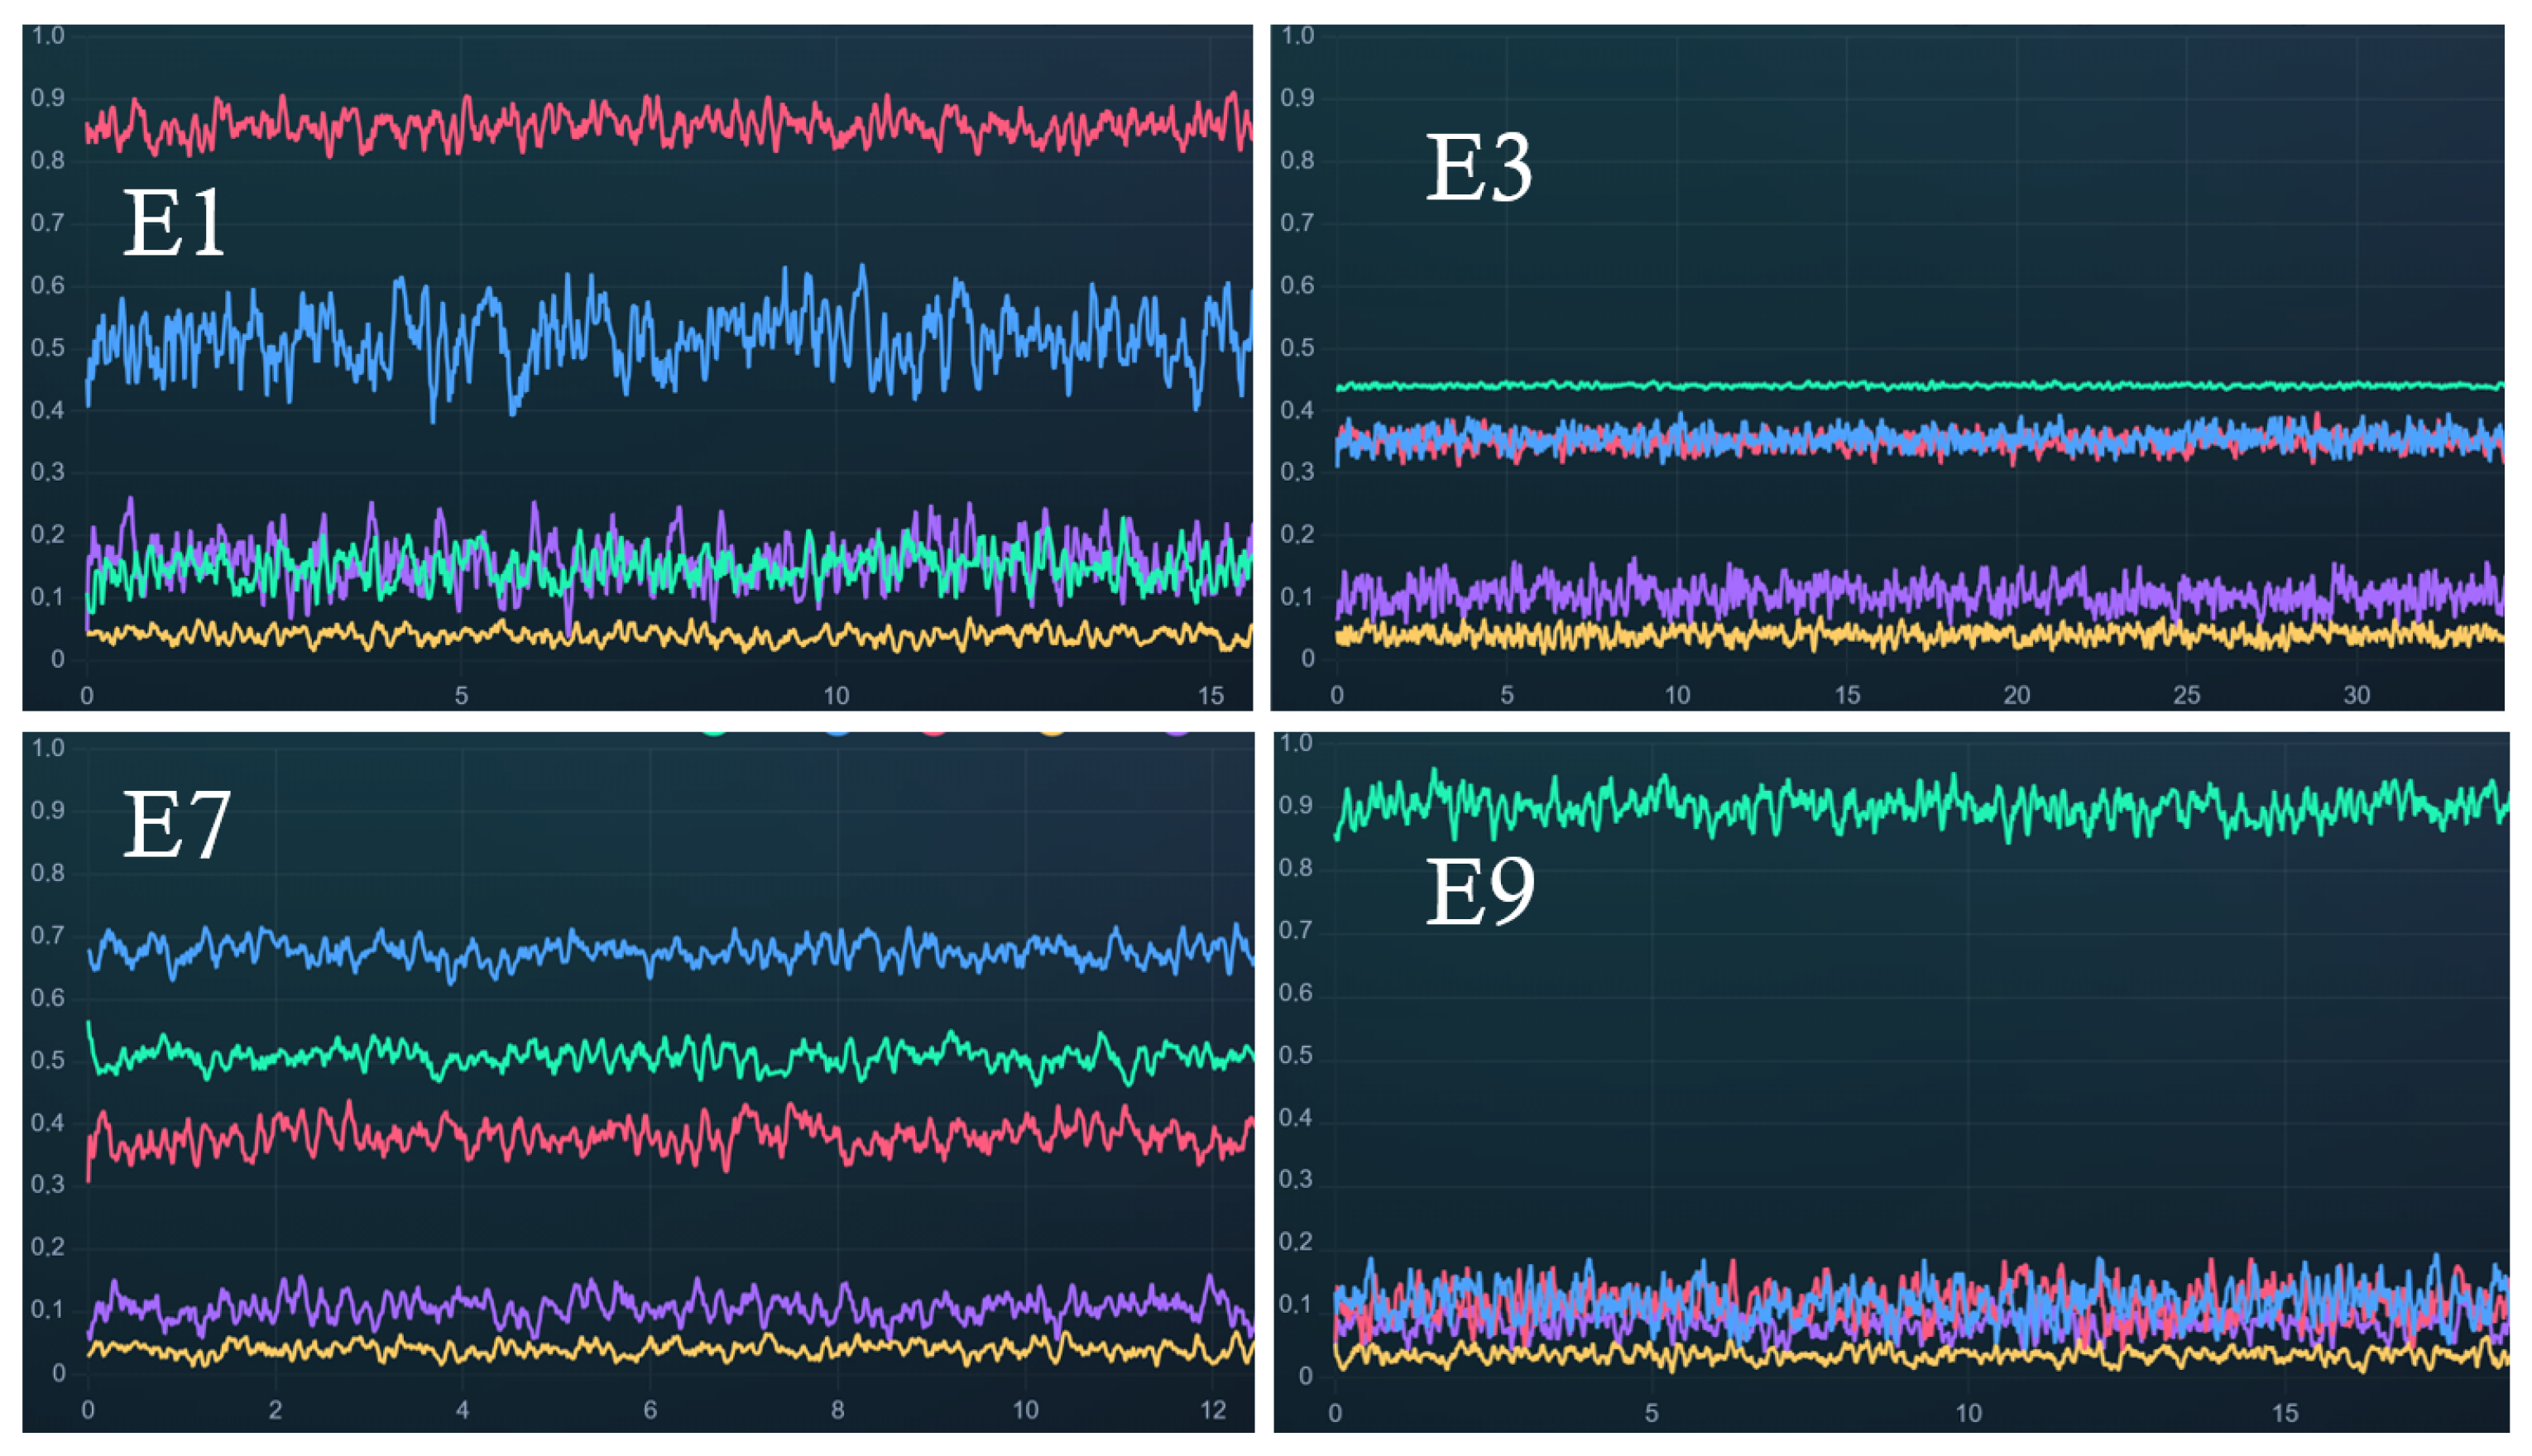
Figure 10 shows the same records through the module’s own temporal dashboard view, one panel per scenario, used here for descriptive inspection of the module’s raw output rather than for inferential comparison; the per-scenario mean-confidence view was already introduced as Figure 7 in Section 4.
Figure 10.
Temporal evolution of facial-expression confidence scores during interaction, as visualized by the module’s dashboard, one panel per scenario. The horizontal axis shows time from the start of the session in minutes, and the vertical axis the confidence score in the range 0 to 1. Facial expressions are happy (green), sad (blue), angry (red), disgusted (violet), and fearful (yellow).
6.2. H2: Detected Emotions Differ Across Interaction Contexts
A Friedman test on the affective-valence indicator found significant differences across the four scenarios, , , Kendall’s . Post-hoc Wilcoxon comparisons (Bonferroni-corrected) are in Table 4.
Table 4.
Post-hoc Wilcoxon signed-rank comparisons of affective valence.
Five of six pairwise comparisons reached significance; only E1 vs. E3 did not (). The largest effects were between E1 and E9 () and E3 and E9 (); the smallest was E1 vs. E3 (). Because the module registered statistically distinguishable readings for nearly every pair of interaction contexts, it is sensitive enough to tell most of these conditions apart, supporting H2. This comes with a caveat: because every participant completed the scenarios in the same fixed order (E1→E3→E7→E9, Section 6.3), the differences are also consistent with a progression effect (fatigue, familiarization, growing webcam comfort) rather than, or in addition to, the conditions themselves; H2 should be read as the module being sensitive to something varying systematically across the session, not that condition content specifically drove it. The one exception (E1 vs. E3) did not replicate under the robustness check reported in Section 5 (, all six comparisons significant); it therefore appears to reflect the specific construction of the original valence indicator, which dilutes the happy-versus-sad contrast across four negative categories, rather than a genuine sensitivity limit of the module.
6.3. Threats to Validity and Future Work
The fixed E1→E3→E7→E9 order means learning or familiarization effects cannot be ruled out as a partial explanation for the observed differences; randomized or counterbalanced ordering would strengthen future validation. The four interaction contexts were built as bundled configurations (several UX or gamification characteristics changing together), which is appropriate for stress-testing the module under realistically varied conditions but means this paper cannot attribute sensitivity to any single design element. The sample (25 students, one course, one institution, unreported age/gender/skin-tone distribution) limits generalization, and the pre-trained models, not independently benchmarked on this population, may be affected by pose, lighting, webcam quality, or demographic mismatch with their training data; readings are accordingly probabilistic, and H1 is interpreted narrowly as evidence of functioning and differentiated output rather than label accuracy, since no independently labeled ground truth was collected to compute accuracy, precision, recall, or rater agreement (cf. benchmarked pipelines reporting such figures [14]). The 100-ms sampling interval also produces temporally dependent records, which is why inference was carried out on participant-scenario aggregates rather than individual records. A storage-layer limitation is also worth noting: because snapshot images are named only by participant, course, and category, a repeated session for the same participant and course would overwrite an earlier snapshot for a given category; the flat-file, append-only logs used for per-detection and per-session records do not have this limitation.
Future work includes a formal usability evaluation of the module’s authorization flow and unobtrusiveness, benchmarking against independently labeled facial-expression data, and testing across additional courses, institutions, and webcam conditions. In ongoing related work, the module validated here is being used to study whether the affective patterns it detects track the UX and gamification levels intentionally designed into a course, a design-evaluation question distinct from the module-validation question addressed in this paper.
7. Conclusions
This paper presented the design of a real-time, browser-based facial emotion recognition (FER) module integrated directly into Moodle, and validated its operation, not the accuracy of its classifications, experimentally with 25 undergraduate students across four Moodle scenarios built with contrasting UX and gamification characteristics. The module produced a clearly interpretable, non-degenerate dominant facial-expression reading in every scenario, supporting H1: it functions and yields differentiated output rather than noise. A Friedman test found significant differences in the detected affective valence across scenarios (, , Kendall’s ), with five of six Bonferroni-adjusted Wilcoxon comparisons significant under the reported indicator and six of six under a robustness-check alternative (Section 5), supporting H2: the module is sensitive to something that varies systematically across the session, though the fixed scenario order means this cannot be fully separated from a general progression effect (Section 6.3).
Together, H1 and H2 constitute functional validation of the module as a measurement instrument: it works, and it is not blind to differences between the situations it is exposed to. Neither hypothesis establishes that the module’s classifications are accurate against independently labeled ground truth; that validation is outside scope and left as future work (Section 6.3). Functional validation remains a necessary prerequisite for using the module as a research instrument, offered here as a self-contained contribution: a working, Moodle-embedded FER capability that other studies, including our own, can build on to ask design-oriented questions about how detected affect relates to the interfaces learners are given.
Author Contributions
Conceptualization, H.O.-C.; methodology, H.O.-C.; software, H.O.-C. and J.G.-L.; validation, H.O.-C., O.G.B.-Q. and J.G.-L.; formal analysis, H.O.-C.; investigation, H.O.-C.; resources, H.O.-C.; data curation, H.O.-C.; writing—original draft preparation, H.O.-C.; writing—review and editing, H.O.-C., O.G.B.-Q. and J.G.-L.; visualization, H.O.-C.; supervision, O.G.B.-Q. and J.G.-L. All authors have read and agreed to the published version of the manuscript.
Funding
This work was funded by Universidad Politécnica Salesiana under the project “Plataforma de aprendizaje adaptativo basado en inteligencia artificial generativa, gamificación y experiencia de usuario para la personalización del aprendizaje en entornos virtuales.”
Institutional Review Board Statement
The study involved human participants interacting with Moodle-based learning scenarios and a facial emotion recognition instrument. Formal ethical approval from a Comité de Ética de Investigación en Seres Humanos (CEISH) was not required under Ecuadorian regulations (Ministerial Agreement No. 4889, Official Gazette Supplement 279, 1 July 2014), which restricts mandatory CEISH review to clinical or experimental interventions in human subjects, the collection or processing of biological samples, access to confidential or sensitive medical records, or research involving vulnerable populations. This study involved none of these: it evaluated the technical performance and human-computer interaction characteristics of a software module using non-clinical, non-biometric facial-expression confidence scores, with a non-vulnerable adult population (25 undergraduate students, mean age approximately 21), minimal risk, and full voluntary informed consent. Raw, identifiable per-session files are retained on the course server for six months following data collection and are then deleted; only pseudonymized records are retained for analysis and archival purposes.
Informed Consent Statement
Informed consent was obtained from all participants. Participants were informed about the webcam-based FER procedure and the use of pseudonymized interaction data for academic research. Separately, explicit written consent for publication of identifiable facial images was obtained from the individual shown in Figure 5, covering the specific images reproduced in this manuscript.
Data Availability Statement
Participant-level FER and interaction data are not publicly available due to privacy and ethical restrictions. Aggregated data may be made available from the corresponding author upon reasonable request.
Acknowledgments
The authors thank FabLab EPN for supporting the development and integration of the FER module within Moodle (version 4.3.12), EducaLab.EC, for supporting deployment of the experimental course, and the students who participated in the study. ChatGPT (GPT-5.5, high reasoning effort; OpenAI) was used during scenario prototyping and for language editing and text refinement. All outputs were reviewed and validated by the authors, who take full responsibility for the manuscript.
Conflicts of Interest
The authors declare no conflicts of interest.
Abbreviations
The following abbreviations are used in this manuscript:
| UX | User Experience |
| LMS | Learning Management System |
| FER | Facial Emotion Recognition |
| H5P | HTML5 Package |
| JSON | JavaScript Object Notation |
| EPN | Escuela Politécnica Nacional |
References
- Suen, H.Y.; Hung, K.E. Enhancing learner affective engagement: The impact of instructor emotional expressions and vocal charisma in asynchronous video-based online learning. Educ. Inf. Technol. 2025, 30, 4033–4060. [Google Scholar] [CrossRef] [Scilit]
- Wang, Q.; Wen, Y.; Quek, C.L. Engaging learners in synchronous online learning. Educ. Inf. Technol. 2023, 28, 4429–4452. [Google Scholar] [CrossRef] [Scilit] [PubMed]
- Pabba, C.; Kumar, P. An intelligent system for monitoring students’ engagement in large classroom teaching through facial expression recognition. Expert Syst. 2022, 39, e12839. [Google Scholar] [CrossRef] [Scilit]
- Bahri, N.E.; Itahriouan, Z.; Jamil, M.O. Emotion-Aware Education Through Affective Computing and Learning Analytics: Insights from a Moroccan University Case Study. Digital 2025, 5, 45. [Google Scholar] [CrossRef] [Scilit]
- Qi, Y.; Zhuang, L.; Chen, H.; Han, X.; Liang, A. Evaluation of Students’ Learning Engagement in Online Classes Based on Multimodal Vision Perspective. Electronics 2023, 13, 149. [Google Scholar] [CrossRef] [Scilit]
- Belluano, P.L.L. Clustering-Based Adaptive UX in E-Learning Systems: Aligning Microservices with the 4C Framework. J. Appl. Data Sci. 2025, 6, 2436–2448. [Google Scholar] [CrossRef] [Scilit]
- Perez-Aranda, J.; Medina-Claros, S.; Urrestarazu-Capellán, R. Effects of a collaborative and gamified online learning methodology on class and test emotions. Educ. Inf. Technol. 2024, 29, 1823–1855. [Google Scholar] [CrossRef] [Scilit] [PubMed]
- Nassr, R.M.; Aldossary, A.A.; Nasir, H.M. Students’s Intention to Use Emotion-Aware Virtual Learning Environment: Does a Lecturer’s Interaction Make a Difference? Malays. J. Learn. Instr. 2021, 18, 183–218. [Google Scholar] [CrossRef] [Scilit]
- Moodle.org. Proctoring for Moodle (Plugin Directory). 2025. Available online: https://moodle.org/plugins/quizaccess_proctoring (accessed on 10 August 2026).
- Moodle.org. Face Recognition Quiz Access Rule (Plugin Directory). 2025. Available online: https://moodle.org/plugins/quizaccess_videocapture (accessed on 10 August 2026).
- Vani, R.; Jayashree, P. Multimodal emotion recognition system for e-learning platform. Educ. Inf. Technol. 2025, 30, 13507–13538. [Google Scholar] [CrossRef] [Scilit]
- Kouahla, M.; Boughida, A.; Chebata, I.; Mehenaoui, Z.; Lafifi, Y. Emorec: A new approach for detecting and improving the emotional state of learners in an e-learning environment. Interact. Learn. Environ. 2023, 31, 6223–6241. [Google Scholar] [CrossRef] [Scilit]
- Pise, A.; Vadapalli, H.; Sanders, I. Facial emotion recognition using temporal relational network: An application to E-learning. Multimed. Tools Appl. 2022, 81, 26633–26653. [Google Scholar] [CrossRef] [Scilit]
- Aly, M.; Alotaibi, N. A comprehensive deep learning framework for real time emotion detection in online learning using hybrid models. Sci. Rep. 2025, 15, 42012. [Google Scholar] [CrossRef] [Scilit] [PubMed]
- Marinescu, I.A.; Dobre, C.; Băjenaru, L.; Petre, I. Towards a Longitudinal Understanding of Mobile User Experience: The Moodle App Case. Stud. Inform. Control 2026, 35, 109–120. [Google Scholar] [CrossRef] [Scilit]
- Azevedo, R.; Lucena, K.; Castro, A.; Gadelha, B. Understanding the Influence of Collaborative Tasks on User Experience in Moodle. J. Braz. Comput. Soc. 2026, 32, 817–838. [Google Scholar] [CrossRef] [Scilit]
- Siahaan, R.D.; Kusumawardani, S.S.; Hidayah, I. Heuristics Evaluation of Moodle E-Learning Using Specialized Educational Usability Indicators. In Proceedings of the 2025 9th International Conference on Information Technology, Information Systems and Electrical Engineering (ICITISEE); IEEE: New York, NY, USA, 2025; Volume 12, pp. 317–322. [Google Scholar] [CrossRef] [Scilit]
- Saleh, A.M.; Abuaddous, H.Y.; Alansari, I.S.; Enaizan, O. The Evaluation of User Experience on Learning Management Systems Using UEQ. Int. J. Emerg. Technol. Learn. 2022, 17, 145–162. [Google Scholar] [CrossRef] [Scilit]
- Segovia-García, N. Propuesta de mejora en el diseño de interfaz y experiencia de usuario (UX) en Moodle: Valoración del alumnado. Edutec Rev. Electron. Tecnol. Educ. 2022, 82, 199–216. [Google Scholar] [CrossRef] [Scilit]
- Babu, S.S.; Moorthy, A.D. Application of artificial intelligence in adaptation of gamification in education: A literature review. Comput. Appl. Eng. Educ. 2024, 32, e22683. [Google Scholar] [CrossRef] [Scilit]
- Zourmpakis, A.I.; Kalogiannakis, M.; Papadakis, S. Adaptive Gamification in Science Education: An Analysis of the Impact of Implementation and Adapted Game Elements on Students’ Motivation. Computers 2023, 12, 143. [Google Scholar] [CrossRef] [Scilit]
- Bachiri, Y.A.; Mouncif, H.; Bouikhalene, B. Artificial Intelligence Empowers Gamification: Optimizing Student Engagement and Learning Outcomes in E-learning and MOOCs. Int. J. Eng. Pedagog. 2023, 13, 4–19. [Google Scholar] [CrossRef] [Scilit]
- Ghai, A.; Tandon, U. Integrating gamification and instructional design to enhance usability of online learning. Educ. Inf. Technol. 2023, 28, 2187–2206. [Google Scholar] [CrossRef] [Scilit] [PubMed]
- Ordoñez-Calero, H.; Bravo-Quezada, O.G.; Galindo-Losada, J. Toward an Integrated Architecture for Personalized Learning: Combining Generative AI, Gamification, and UX. In Proceedings of the Information and Communication Technologies—13th Ecuadorian Conference, TICEC 2025, Proceedings; Berrezueta, S., Gualotuña, T., Fonseca C., E.R., Rodriguez Morales, G., Maldonado-Mahauad, J., Eds.; Springer: Cham, Germany, 2026; pp. 379–393. [Google Scholar] [CrossRef] [Scilit]
- Mandran, N.; Dupuy-Chessa, S. Supporting experimental methods in information system research. In Proceedings of the 2018 12th International Conference on Research Challenges in Information Science (RCIS); IEEE: New York, NY, USA, 2018; Volume 5, pp. 1–12. [Google Scholar] [CrossRef] [Scilit]

Disclaimer/Publisher’s Note: The statements, opinions and data contained in all publications are solely those of the individual author(s) and contributor(s) and not of MDPI and/or the editor(s). MDPI and/or the editor(s) disclaim responsibility for any injury to people or property resulting from any ideas, methods, instructions or products referred to in the content. |
© 2026 by the authors. Licensee MDPI, Basel, Switzerland. This article is an open access article distributed under the terms and conditions of the Creative Commons Attribution (CC BY) license.