


Abstract
In the context of accelerating global warming and the European Union’s objective of achieving climate neutrality by 2050, offshore wind energy serves as a vital strategy in the transition to a low-carbon energy system. One of the main objectives of this paper is to analyze the expected dynamics of wind power in the Black Sea. Further, an evaluation of the technical feasibility and performance of offshore wind turbines under future climate projections up to 2050 is performed. For this study, wind data were obtained from the CORDEX regional climate database, under the RCP 4.5 scenario, for a 25-year period (2026–2050) at nine locations in the Black Sea, situated at water depths ranging from 40 m to 120 m. The assessment examined six different commercial offshore wind turbines, with rated capacities between 2.3 MW and 6.3 MW evaluated at a common hub height of 100 m, based on the characterized wind potential identified at the selected sites. The proposed methodology integrates regional climate projections with turbine performance to provide a forward-looking assessment of offshore wind potential in the Romanian Black Sea area. The results focus on the comparative performance of the selected wind turbines in the nine examined locations, highlighting the differences in the energy field and efficiency depending on the wind conditions and the water depths.
1. Introduction
With population growth and industrial development, the demand for energy has also increased. In the context of fossil fuel depletion and the need to meet the continuously rising demand for energy, renewable energy sources have gained a vital role in the transition towards net-zero carbon emissions.
Exceeding the pre-industrial average by approximately 1.55 °C, the period 2015–2024 recorded the highest values and was considered the warmest decade [1]. Hence, investments in clean energy technologies are not only important to slow down global warming but are imperative to achieve the maximum potential of exploiting renewable resources. Among the available renewable energy resources, wind, solar, and wave energy have attracted particular attention due to their significant potential for clean power generation [2,3].
However, wind power is emerging as one of the most promising and competitive renewable energy sources, reaching a global installed capacity of over 1.299 GW last year, with 165 GW added, marking an increase of up to 40% from the previous year [4]. This increase can be easily identified in 138 countries worldwide, which are now powered by wind energy. Consequently, wind energy has been widely investigated in the scientific literature as a key source of renewable energy [5,6].
The World Bank’s offshore wind roadmap for Romania outlined realistic development pathways of roughly 3–7 GW by the mid-2030s, while an earlier World Bank technical-potential map estimated 22 GW fixed-bottom and 54 GW floating potential, for a total of 76 GW in Romanian waters [7].
Considering all these facts, this study aims to evaluate the future offshore wind potential in the Romanian sector of the Black Sea and to assess the performance of several offshore wind turbines (OWTs) under projected climate conditions. Nine offshore sites, distributed across different water-depth classes, are considered in order to examine the spatial and seasonal variability of the wind resource. In addition, six offshore wind turbine models are analyzed to estimate their Annual Energy Production and Capacity Factor, providing a comparative perspective on turbine suitability for future offshore wind development in the region.
2. Database—Target Area—Methodology
Bordered by six countries, the Black Sea basin has become a hub for European initiatives focused on increasing the potential of renewable energy resources. These initiatives have reflected a coordinated regional approach centered on the harmonization of legislative frameworks and national strategies, with a strong focus on environmental protection and supporting the achievement of global climate change mitigation objectives [8].
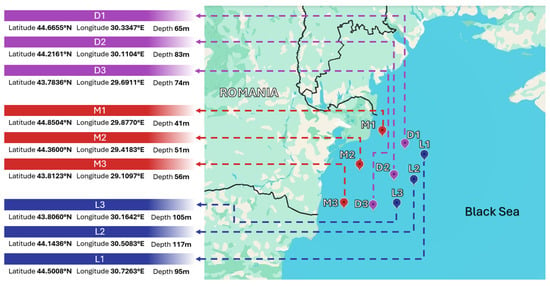
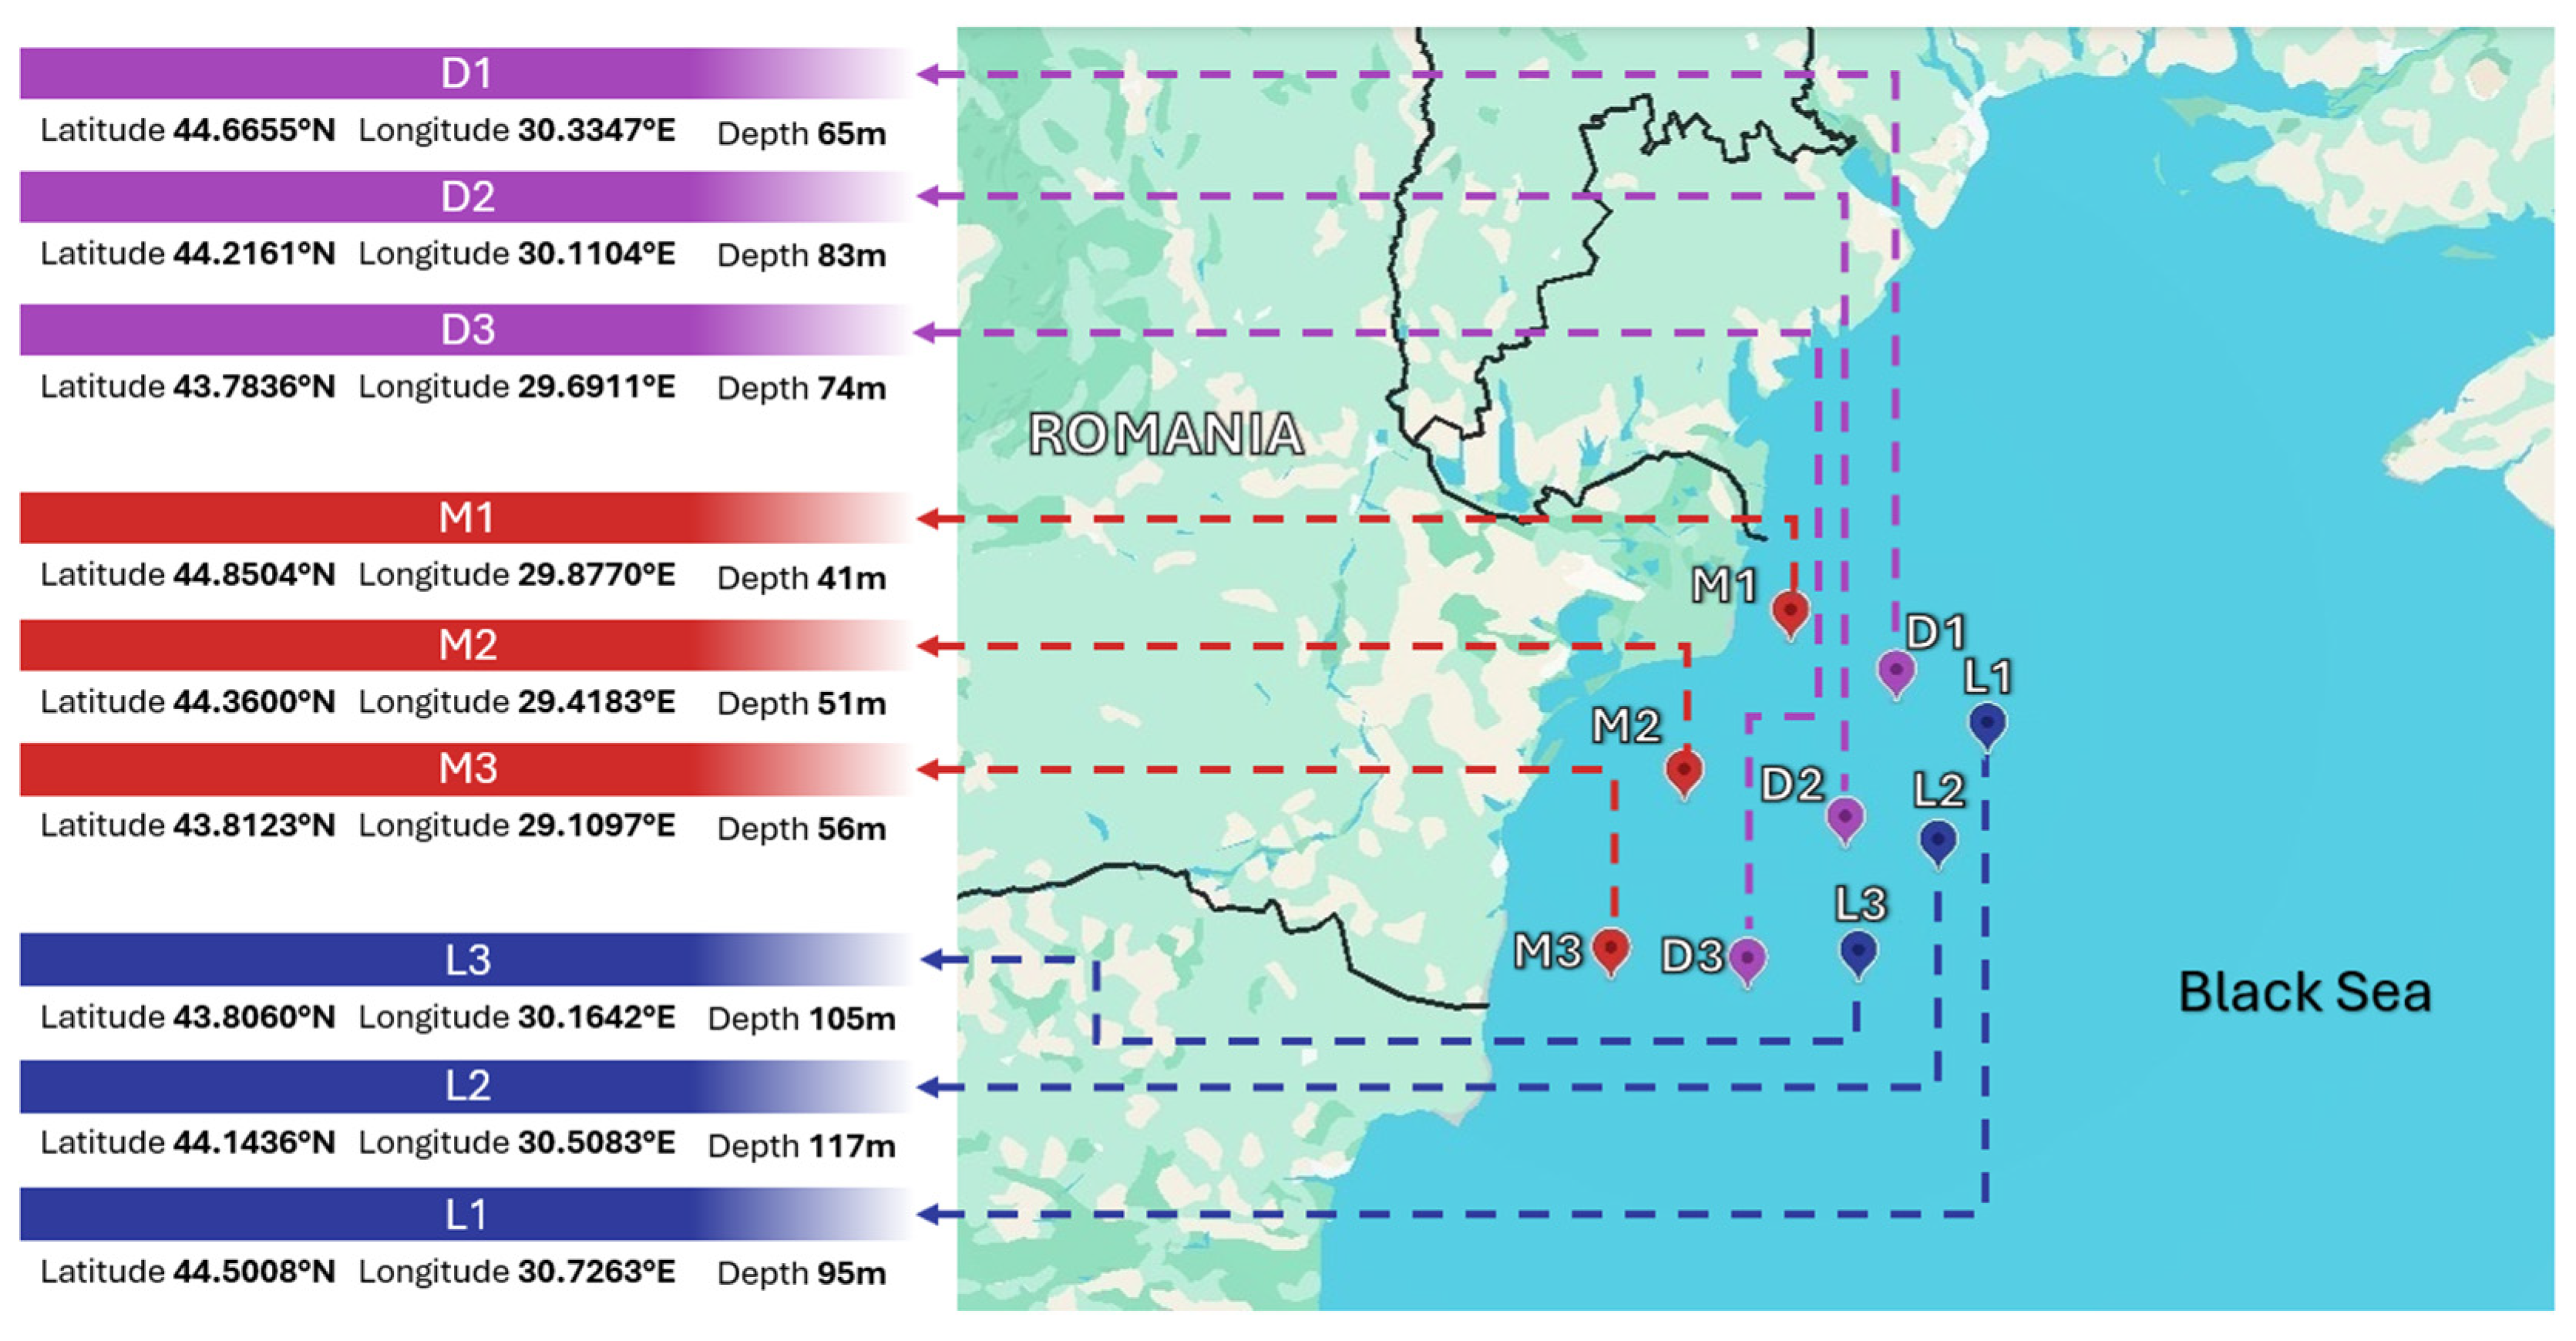
To explore the wind potential and the OWT performance in the region, nine offshore locations were selected. The target area is located in the western Black Sea basin, within the Romanian Exclusive Economic Zone (EEZ). The selected sites, labeled M1–M3, D1–D3, and L1–L3, are distributed in medium-to-deep water zones and grouped in three depth intervals: shallow water, medium (transitional) water, and deep water. The distribution and geographic information—latitude, longitude, and water depth—are represented in Figure 1.
Figure 1.
The distribution and geographic information for the selected sites in the Romanian EEZ Black Sea Area.
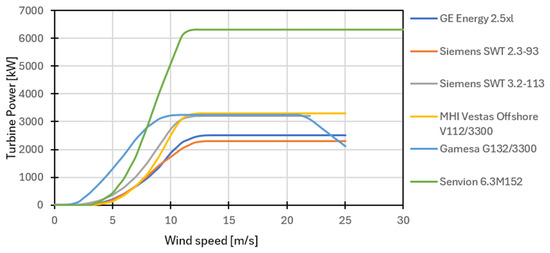
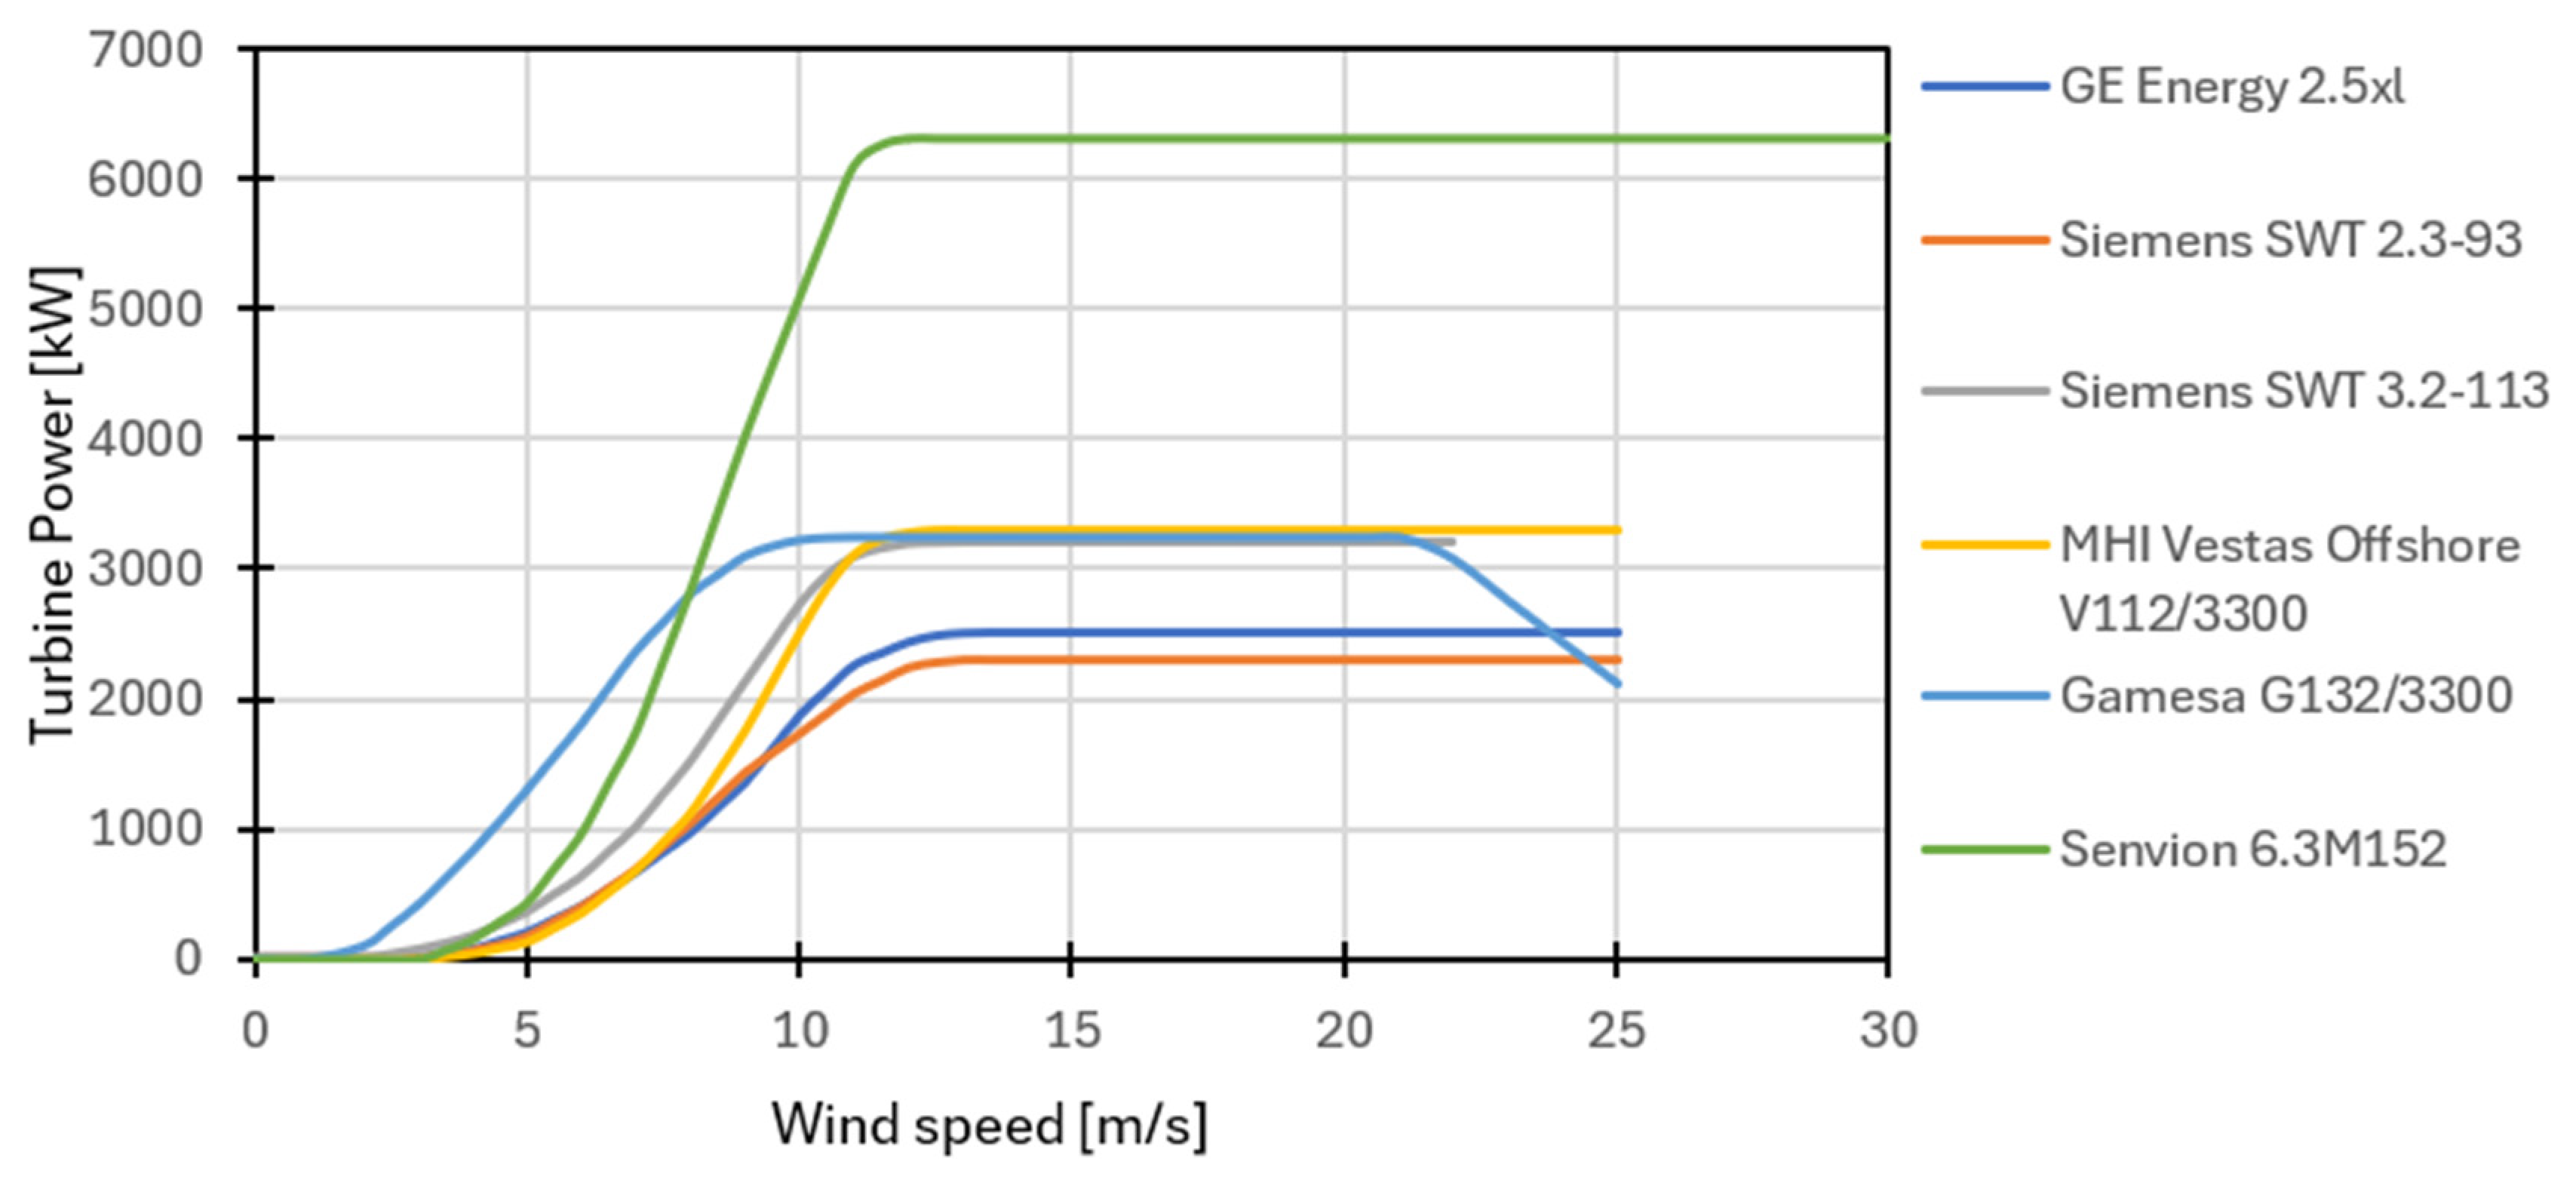
Therefore, six OWTs with different rated powers and technical characteristics were chosen, as presented in Table 1. The selected models cover a wide range of nominal capacities, from 2.3 MW to 6.3 MW, allowing a comparative analysis between medium-capacity and high-capacity OWTs. The list includes models from GE Energy (Atlanta, GA, USA), Siemens SWT (Brande, Denmark), MHI Vestas Offshore (Aarhus, Denmark), Gamesa (Zamudio, Spain) and Senvion (Hamburg, Germany). Based on OWT main technical characteristics, the corresponding turbine power curves were generated and illustrated in Figure 2, to provide a clearer comparison of their operational behavior under different wind speed conditions. Furthermore, a hub height of 100 m was chosen, allowing OWT performance to be evaluated under the same wind conditions and facilitating a consistent comparison of their power-curve characteristics.
Table 1.
Characteristics of the six OWTs selected.
Figure 2.
Power curves of the selected OWTs.
For this study, wind data were obtained from the CORDEX database under the RCP 4.5 scenario for 25 years. Since the wind speed values were provided at 10 m above sea level, an extrapolation was performed to the common hub height of the turbine, at 100 m above sea level, using the logarithmic wind profile law expressed as [9]:
where signifies the roughness length, which is set at 0.0002 m.
The choice of the 2026–2050 interval is not arbitrary. The year 2050 represents a key milestone in both European and international climate policy, as it corresponds to the European Union’s legally binding objective of achieving climate neutrality by 2050, established through the European Climate Law.
The Annual Energy Production (AEP) was estimated by applying the power curve of each turbine to the hub-height wind speed data and subsequently averaging the resulting power outputs. The resulting mean power output was multiplied by the total number of hours in a year and converted from kWh to MWh [10]:
where P is the mean OWT power output in kW.
Capacity Factor (CF) was used to evaluate the operational efficiency of each selected OWT. It was calculated using the following equation [11]:
where is the expected power to be generated by OWT and represents the rated power of a generator.
3. Results and Discussions
Wind speed and water depth are pivotal parameters in evaluating offshore wind potential and in the selection of appropriate OWTs. Feasibility studies for wind farm construction should rely on precise data on average annual wind speeds to accurately identify suitable locations for wind farm deployment.
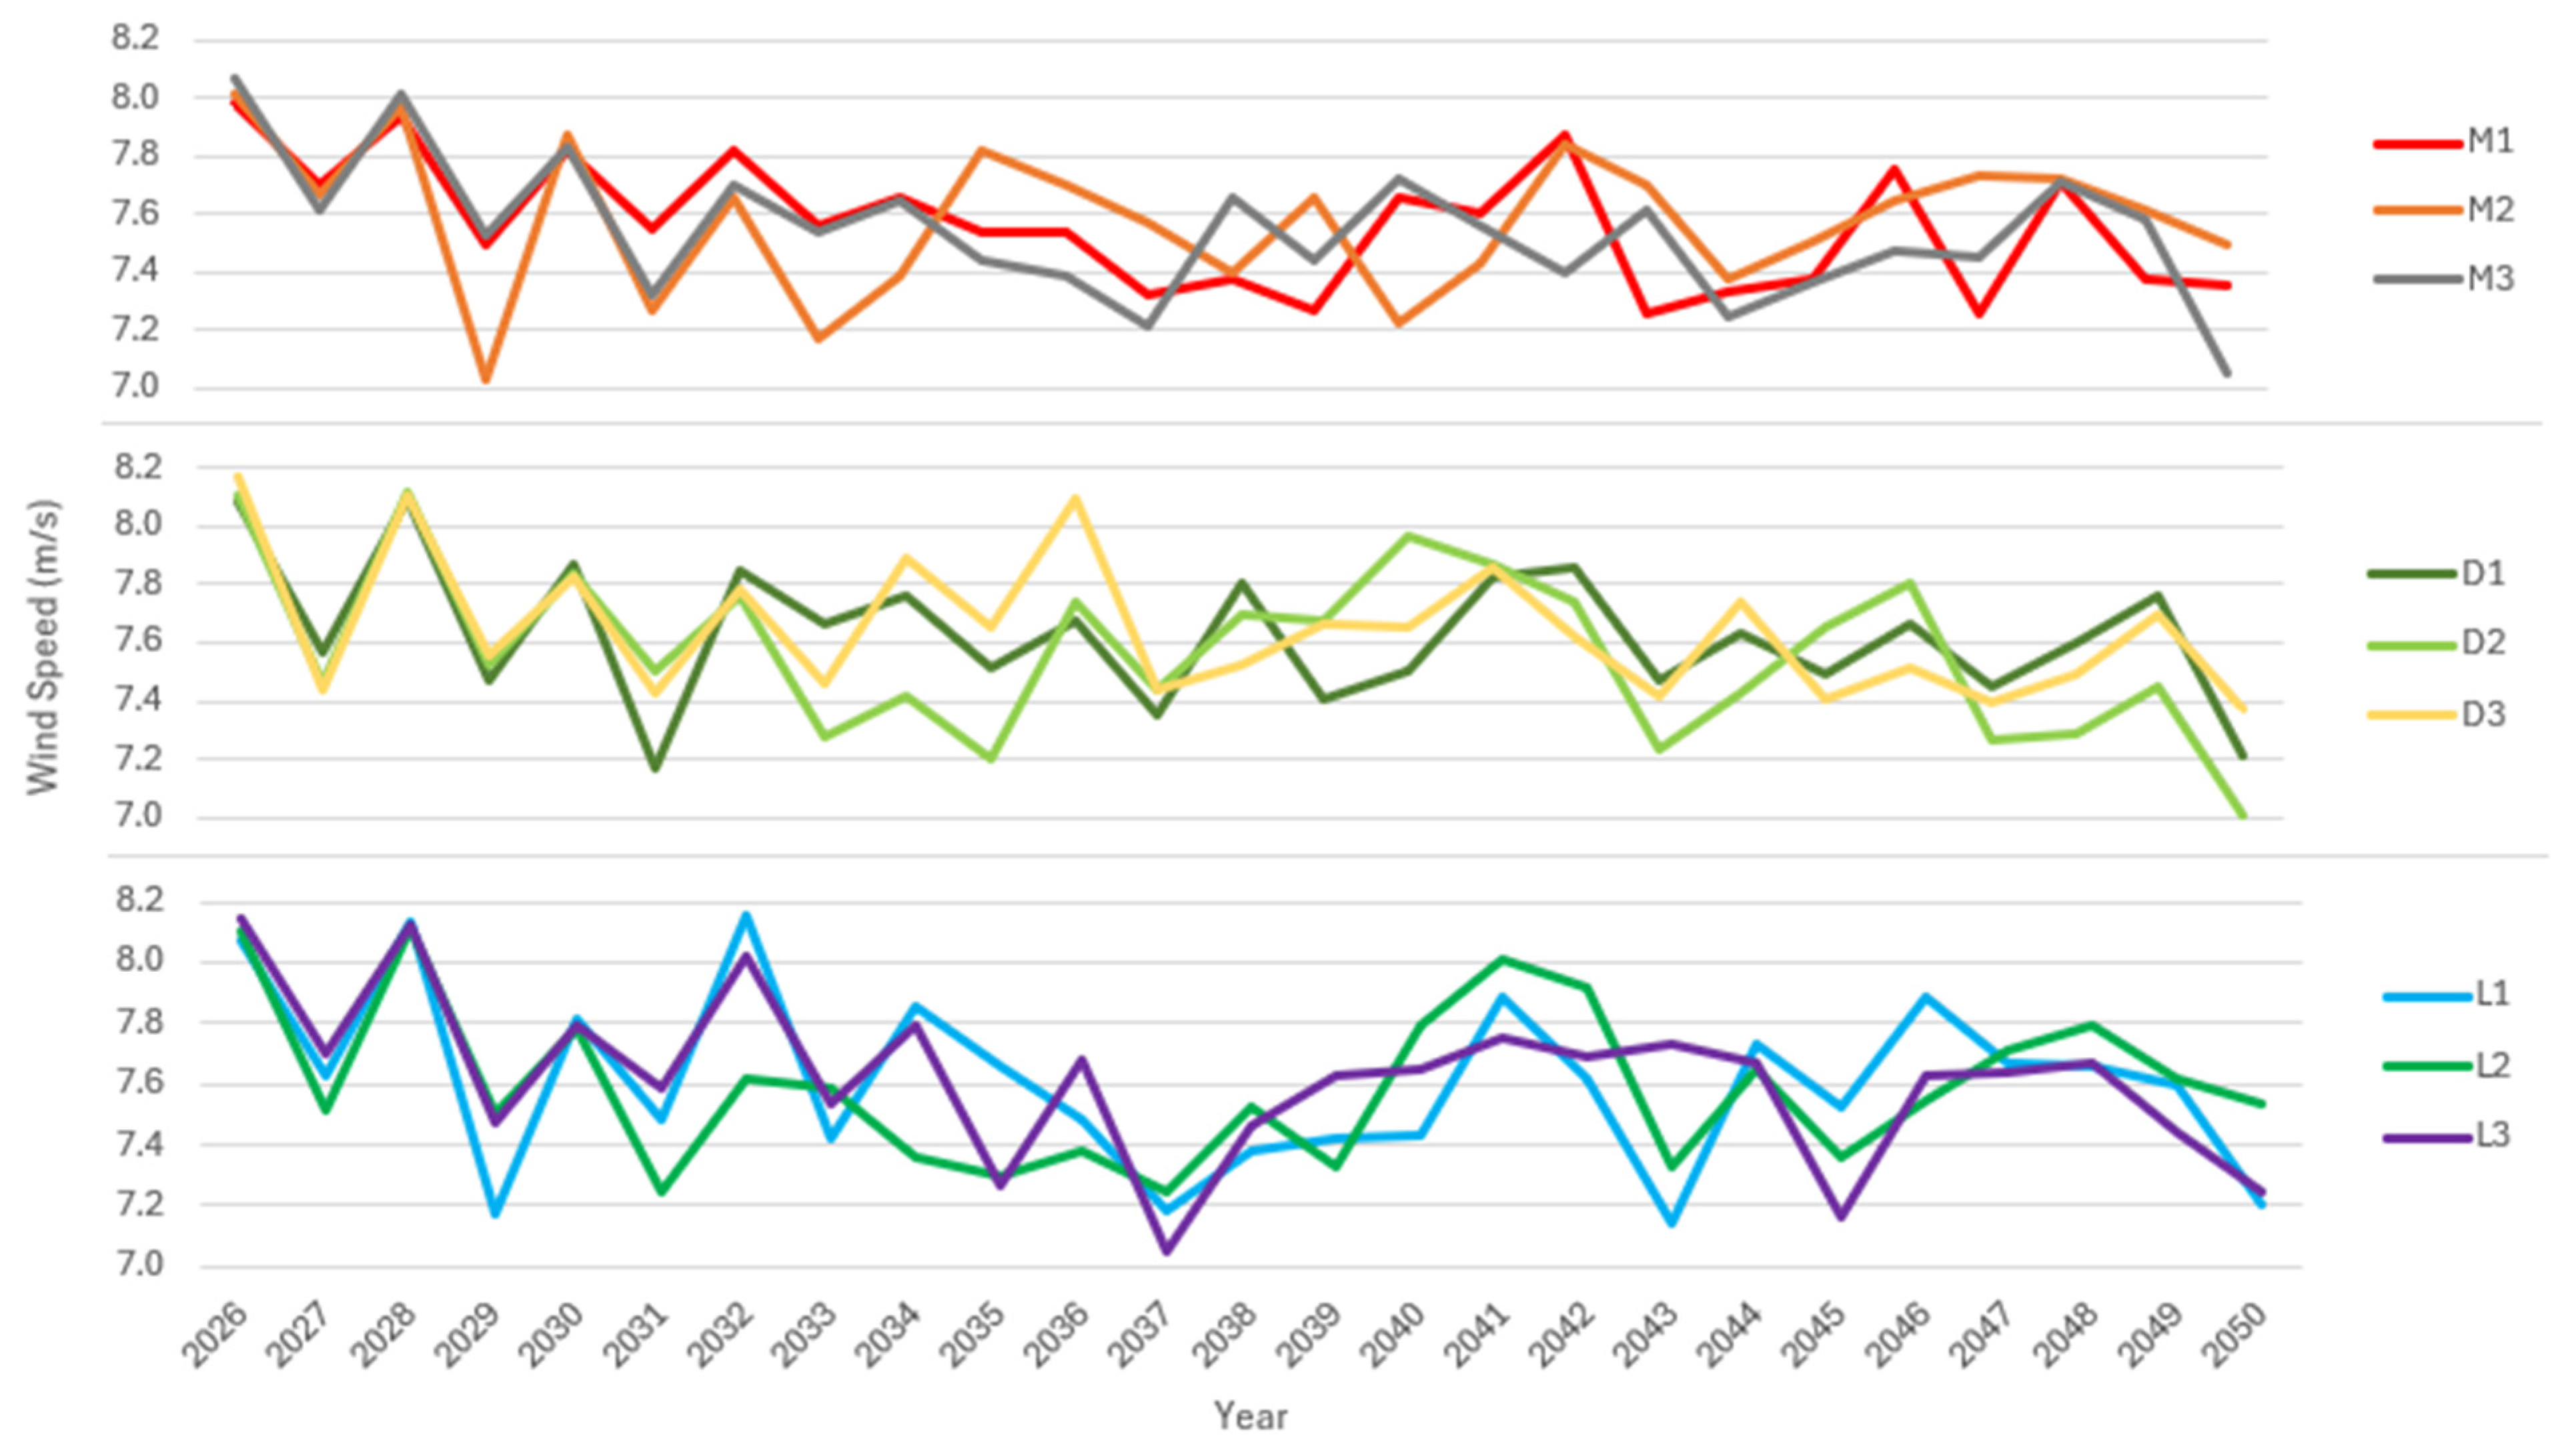
Figure 3 presents the evaluation of the annual mean wind speed at hub height for the nine selected offshore sites, M1–M3, D1–D3, L1–L3, situated in the Romanian Black Sea area corresponding to the 2026–2050 period under RCP 4.5. Almost all locations recorded the strongest annual mean wind speeds during the first part of the analyzed period, between 2026 and 2028, except for site L1, where the peak value was reached later, in 2032.
Figure 3.
Annual mean wind speed (m/s) at hub height for the selected sites in the 2026–2050 period.
The annual mean wind speed value is followed by a decrease, although the intensity of this decline varies among the selected sites. For some locations, the reduction is relatively gradual, whereas for others, such as M2 and L1, the decrease appears slightly more pronounced. Towards the end of the analyzed period, the lowest annual mean wind speed values are generally recorded, suggesting a possible weakening of the offshore wind re-source by 2050. This pattern is particularly relevant considering that RCP 4.5 is regarded as an intermediate and relatively moderate climate scenario.
The strongest individual annual mean in the entire dataset is 8.17 m/s at D3 in 2026, while the weakest is 7.01 m/s at D2 in 2050. All nine sites remain tightly clustered, with long-term mean wind speeds ranging only from 7.54 m/s to 7.65 m/s. The total difference between the strongest and weakest sites is just 0.11 m/s, corresponding to approximately 1.4% of the lowest site mean, which indicates a very limited spatial variability across the analyzed locations.
In terms of water depth, one of the three medium-depth sites, D3, is the strongest overall, and another one, D1, is second. The deepest group, L1–L3, also performs very well, but the advantage of deeper water is not systematic enough to say that “deeper automatically means windier” in this dataset. Likewise, the shallow-to-medium sites, M1–M3, are only slightly weaker on average, and even there the differences are small enough that a good turbine match could partially offset the site disadvantage.
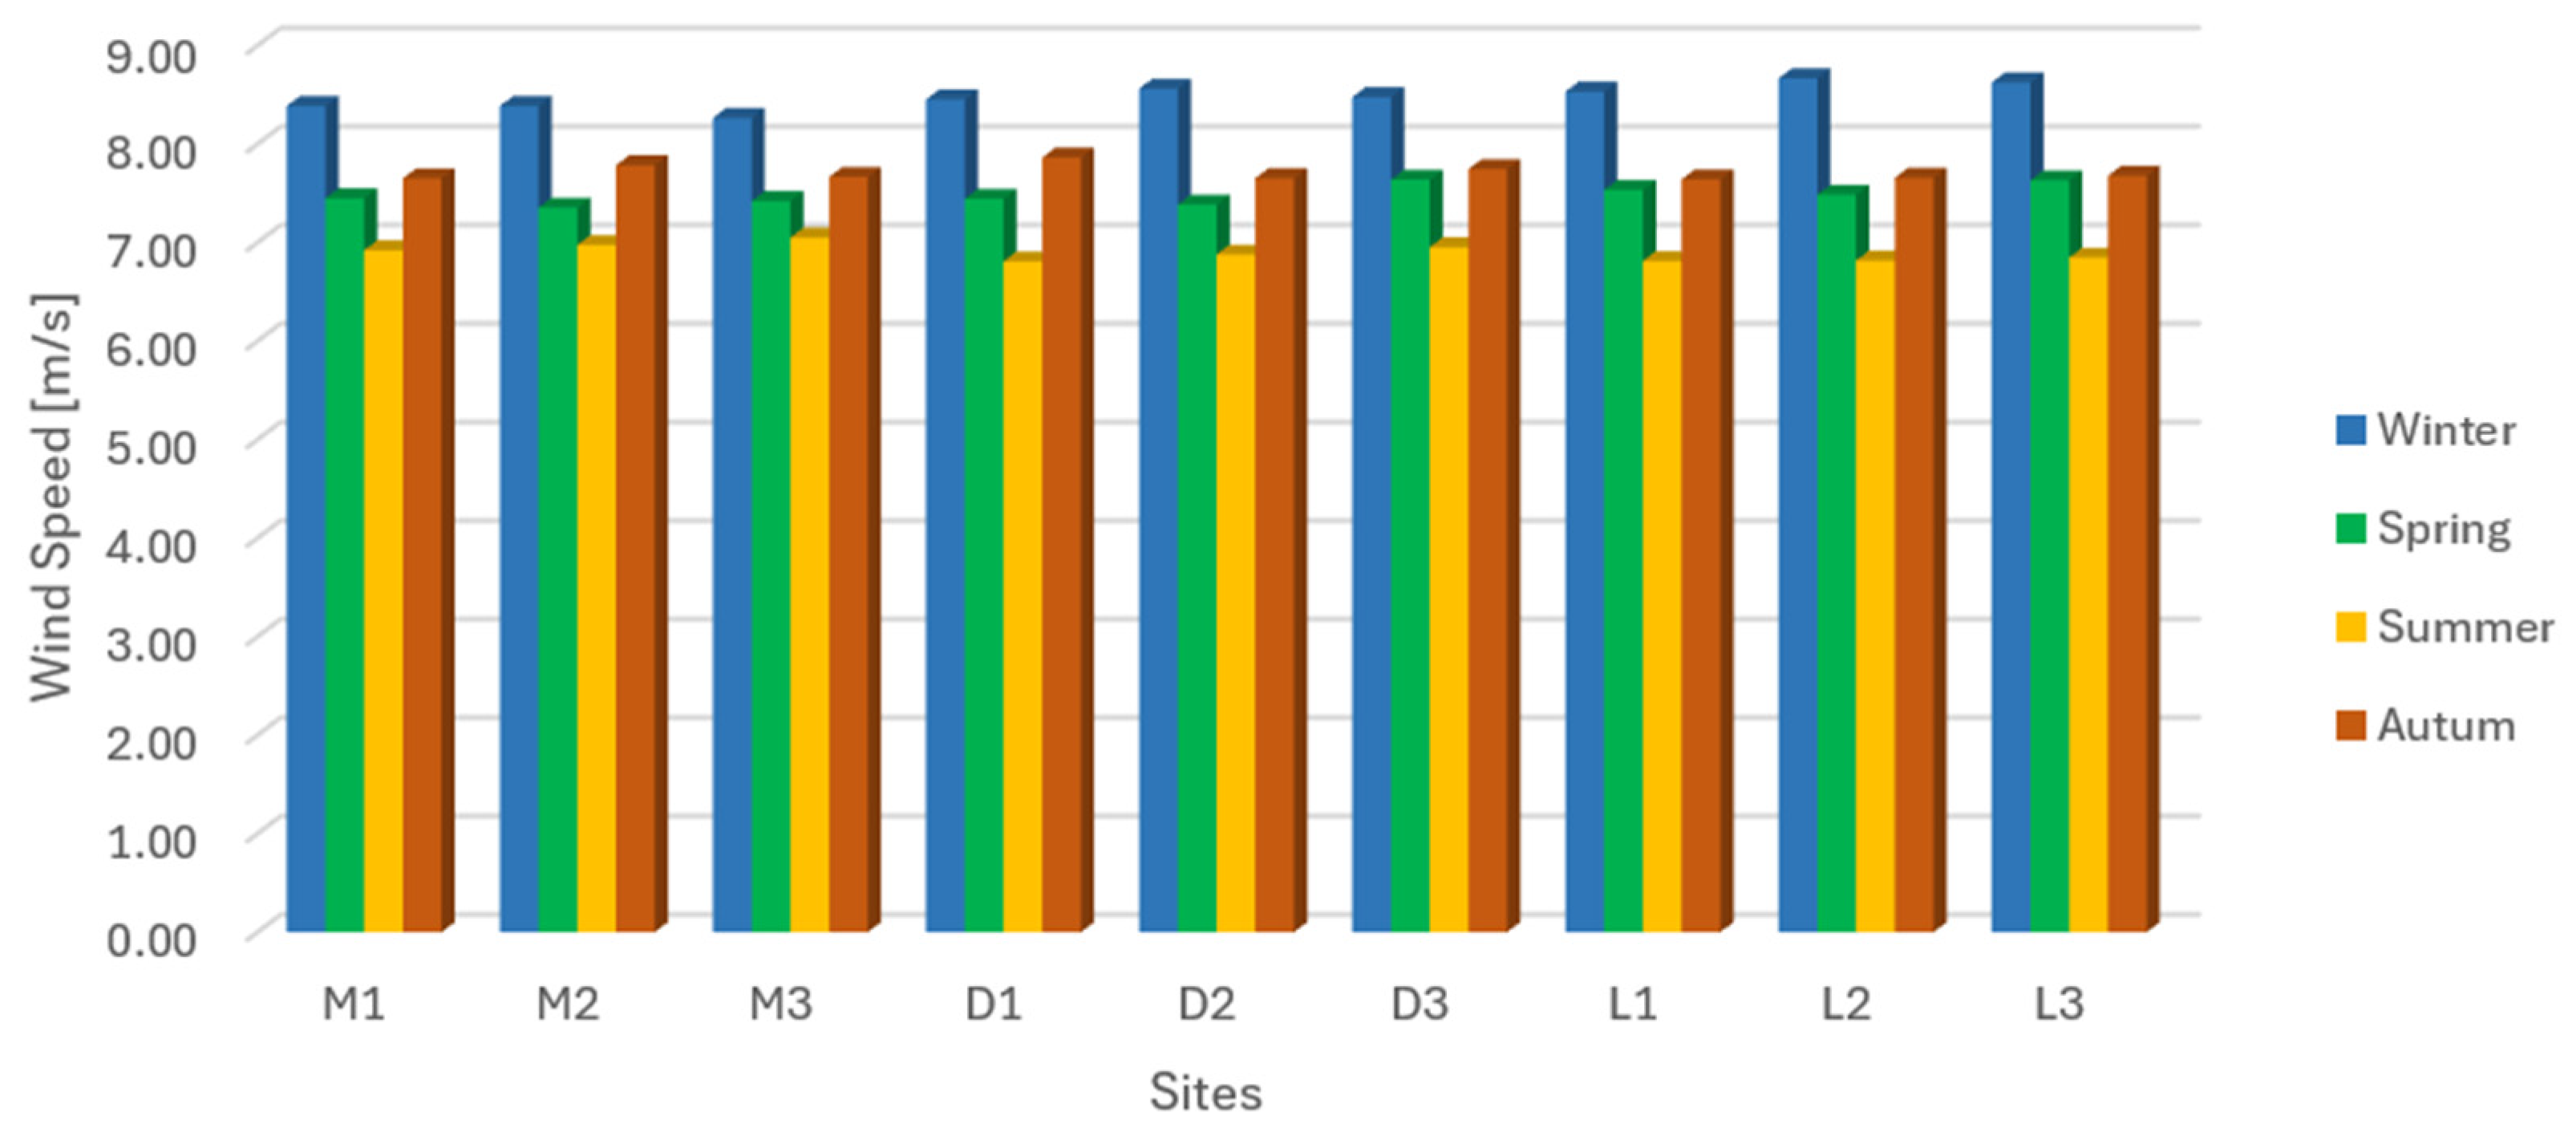
The seasonal distribution of wind speed, presented in Figure 4, is characteristic of the Black Sea: winds are significantly stronger in winter and weaker in summer. The seasonal analysis of the data shows that the mean wind speed during the cold season, from December to February, substantially exceeds the summer average, from June to August, across all selected locations. For example, during the cold season, sites D2 and L1–L3 record values above 8.5 m/s, while sites M1–M3, D1 and D3 show values between 8 and 8.5 m/s. By contrast, the warm months are associated with values below 7 m/s for most locations, except for M3, which reaches 7.05 m/s.
Figure 4.
Mean wind speed (m/s) by season for the selected sites in the 2026–2050 period.
The other two seasons show moderate transitional values: spring records wind speeds above 7.3 m/s, while autumn presents slightly higher values, exceeding 7.6 m/s. The present results are consistent with previous findings for this region which reported relatively strong and stable wind conditions in the western Black Sea and highlighted a pronounced seasonal contrast between winter and summer wind power conditions [12,13].
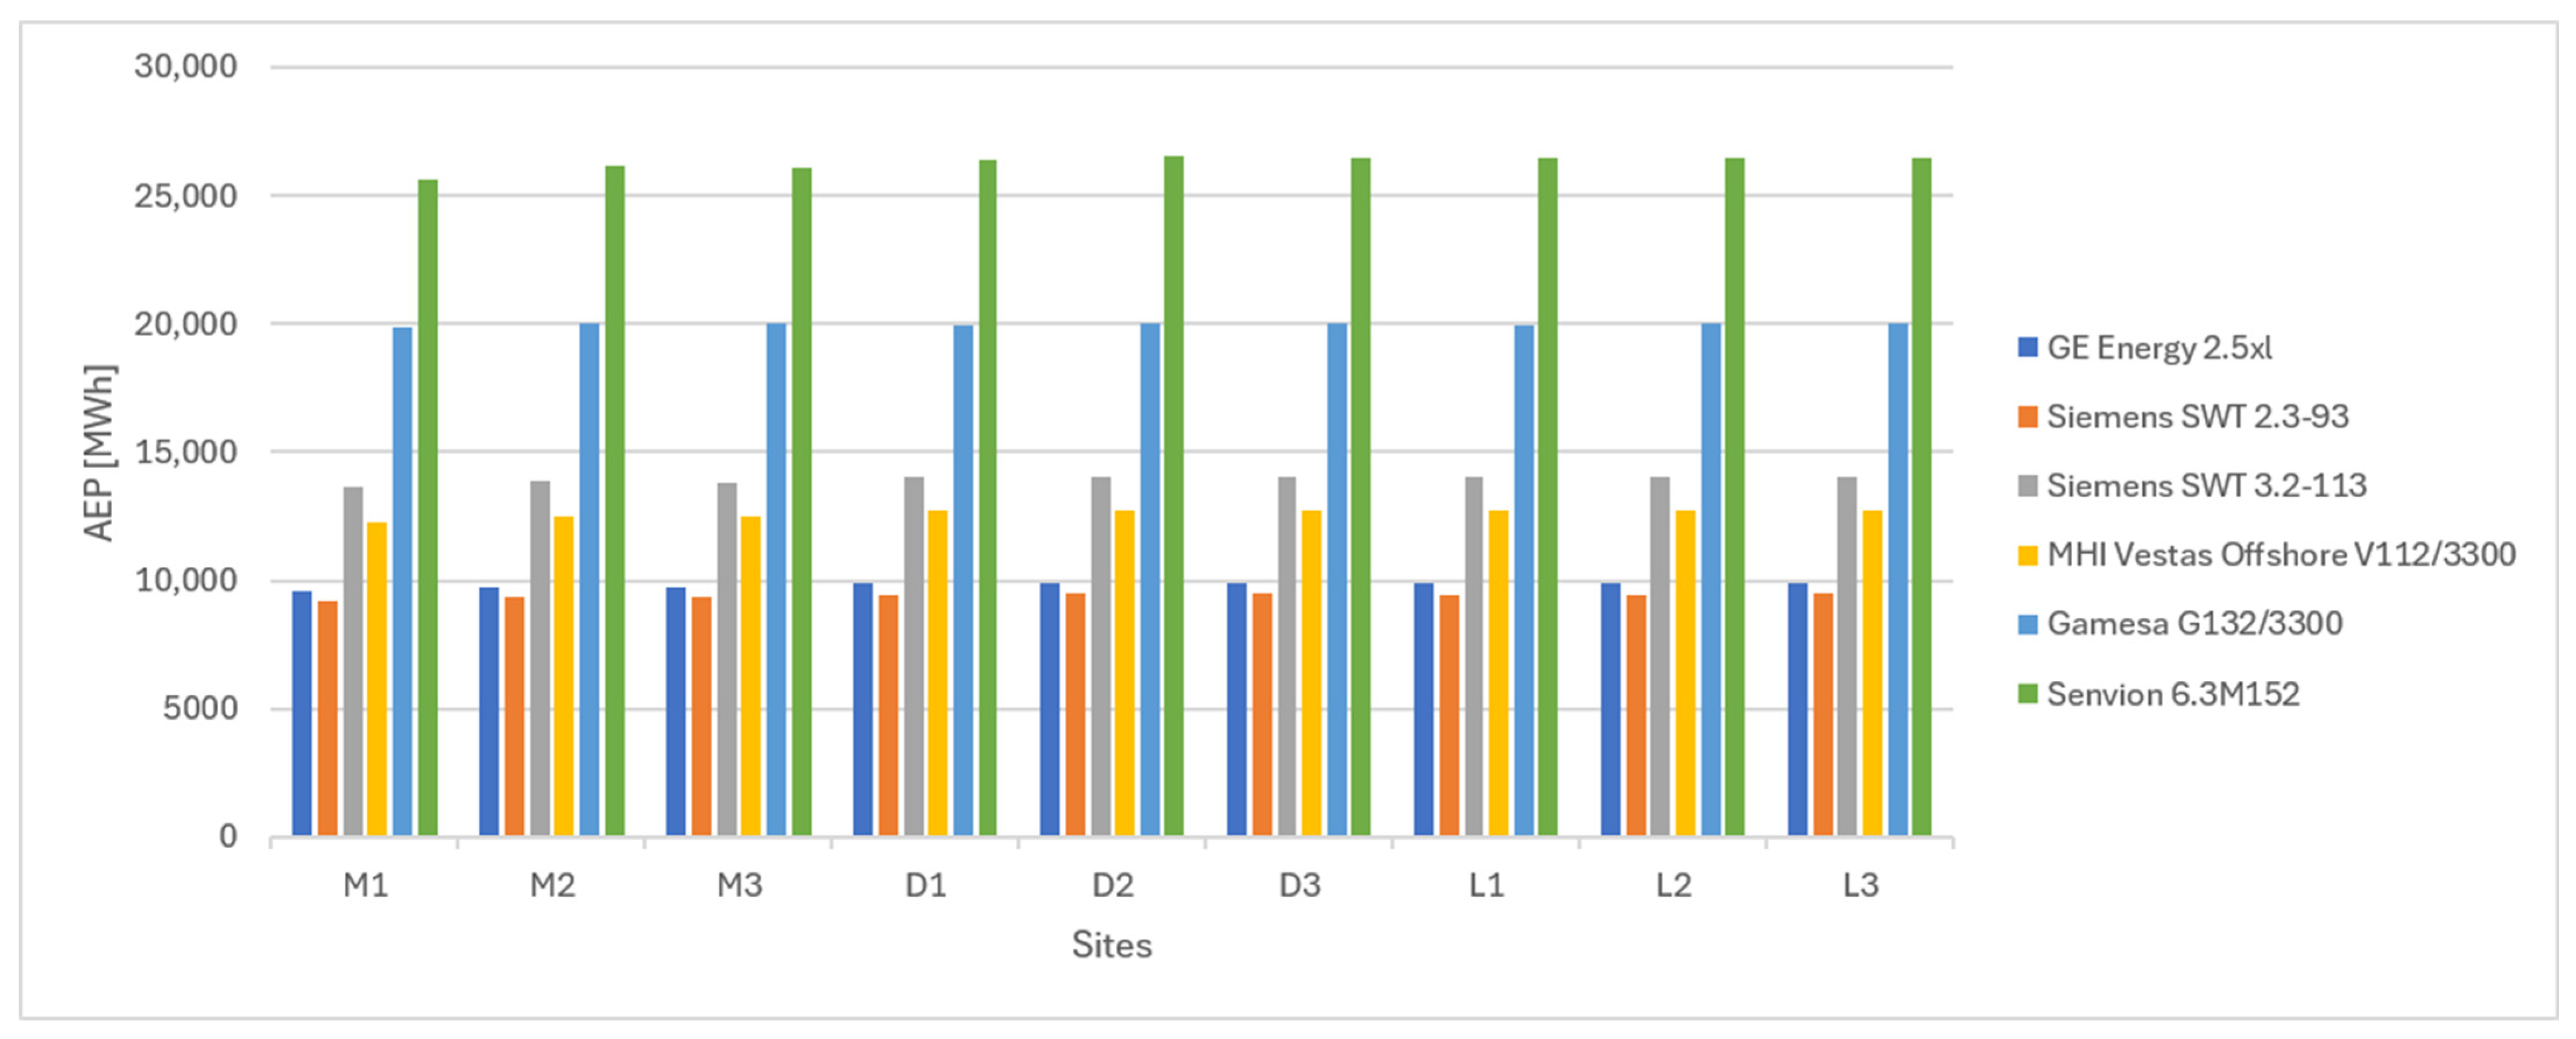
For the evaluation of OWT performance, six representative models (2.5–6.3 MW) were used to estimate AEP and CF. The annual energy production results, as shown in Figure 5, indicate that turbine selection has a stronger influence on energy output than the spatial differences between the analyzed sites. Among the six OWTs, Senvion 6.3M152 records the highest AEP values at all locations, reaching approximately 25.500–26.500 MWh/year. This performance is mainly related to its high rated power and favorable operational characteristics. Gamesa G132/3300 ranks second, with values close to 20.000 MWh/year, suggesting a very good adaptation to the moderate-to-high wind conditions projected for the Romanian Black Sea area. Intermediate values are obtained for Siemens SWT 3.2-113 and MHI Vestas Offshore V112/3300, while GE Energy 2.5xl and Siemens SWT 2.3-93 show the lowest annual production due to their lower rated capacities.
Figure 5.
Annual energy production [MWh] for six OWTs for the selected sites in the 2026–2050 period.
From a spatial perspective, the differences among the nine sites are relatively small. Slightly higher AEP values are observed in the D1–D3 and L1–L3 sites, indicating a marginally better energy potential in medium-depth and deep-water locations.
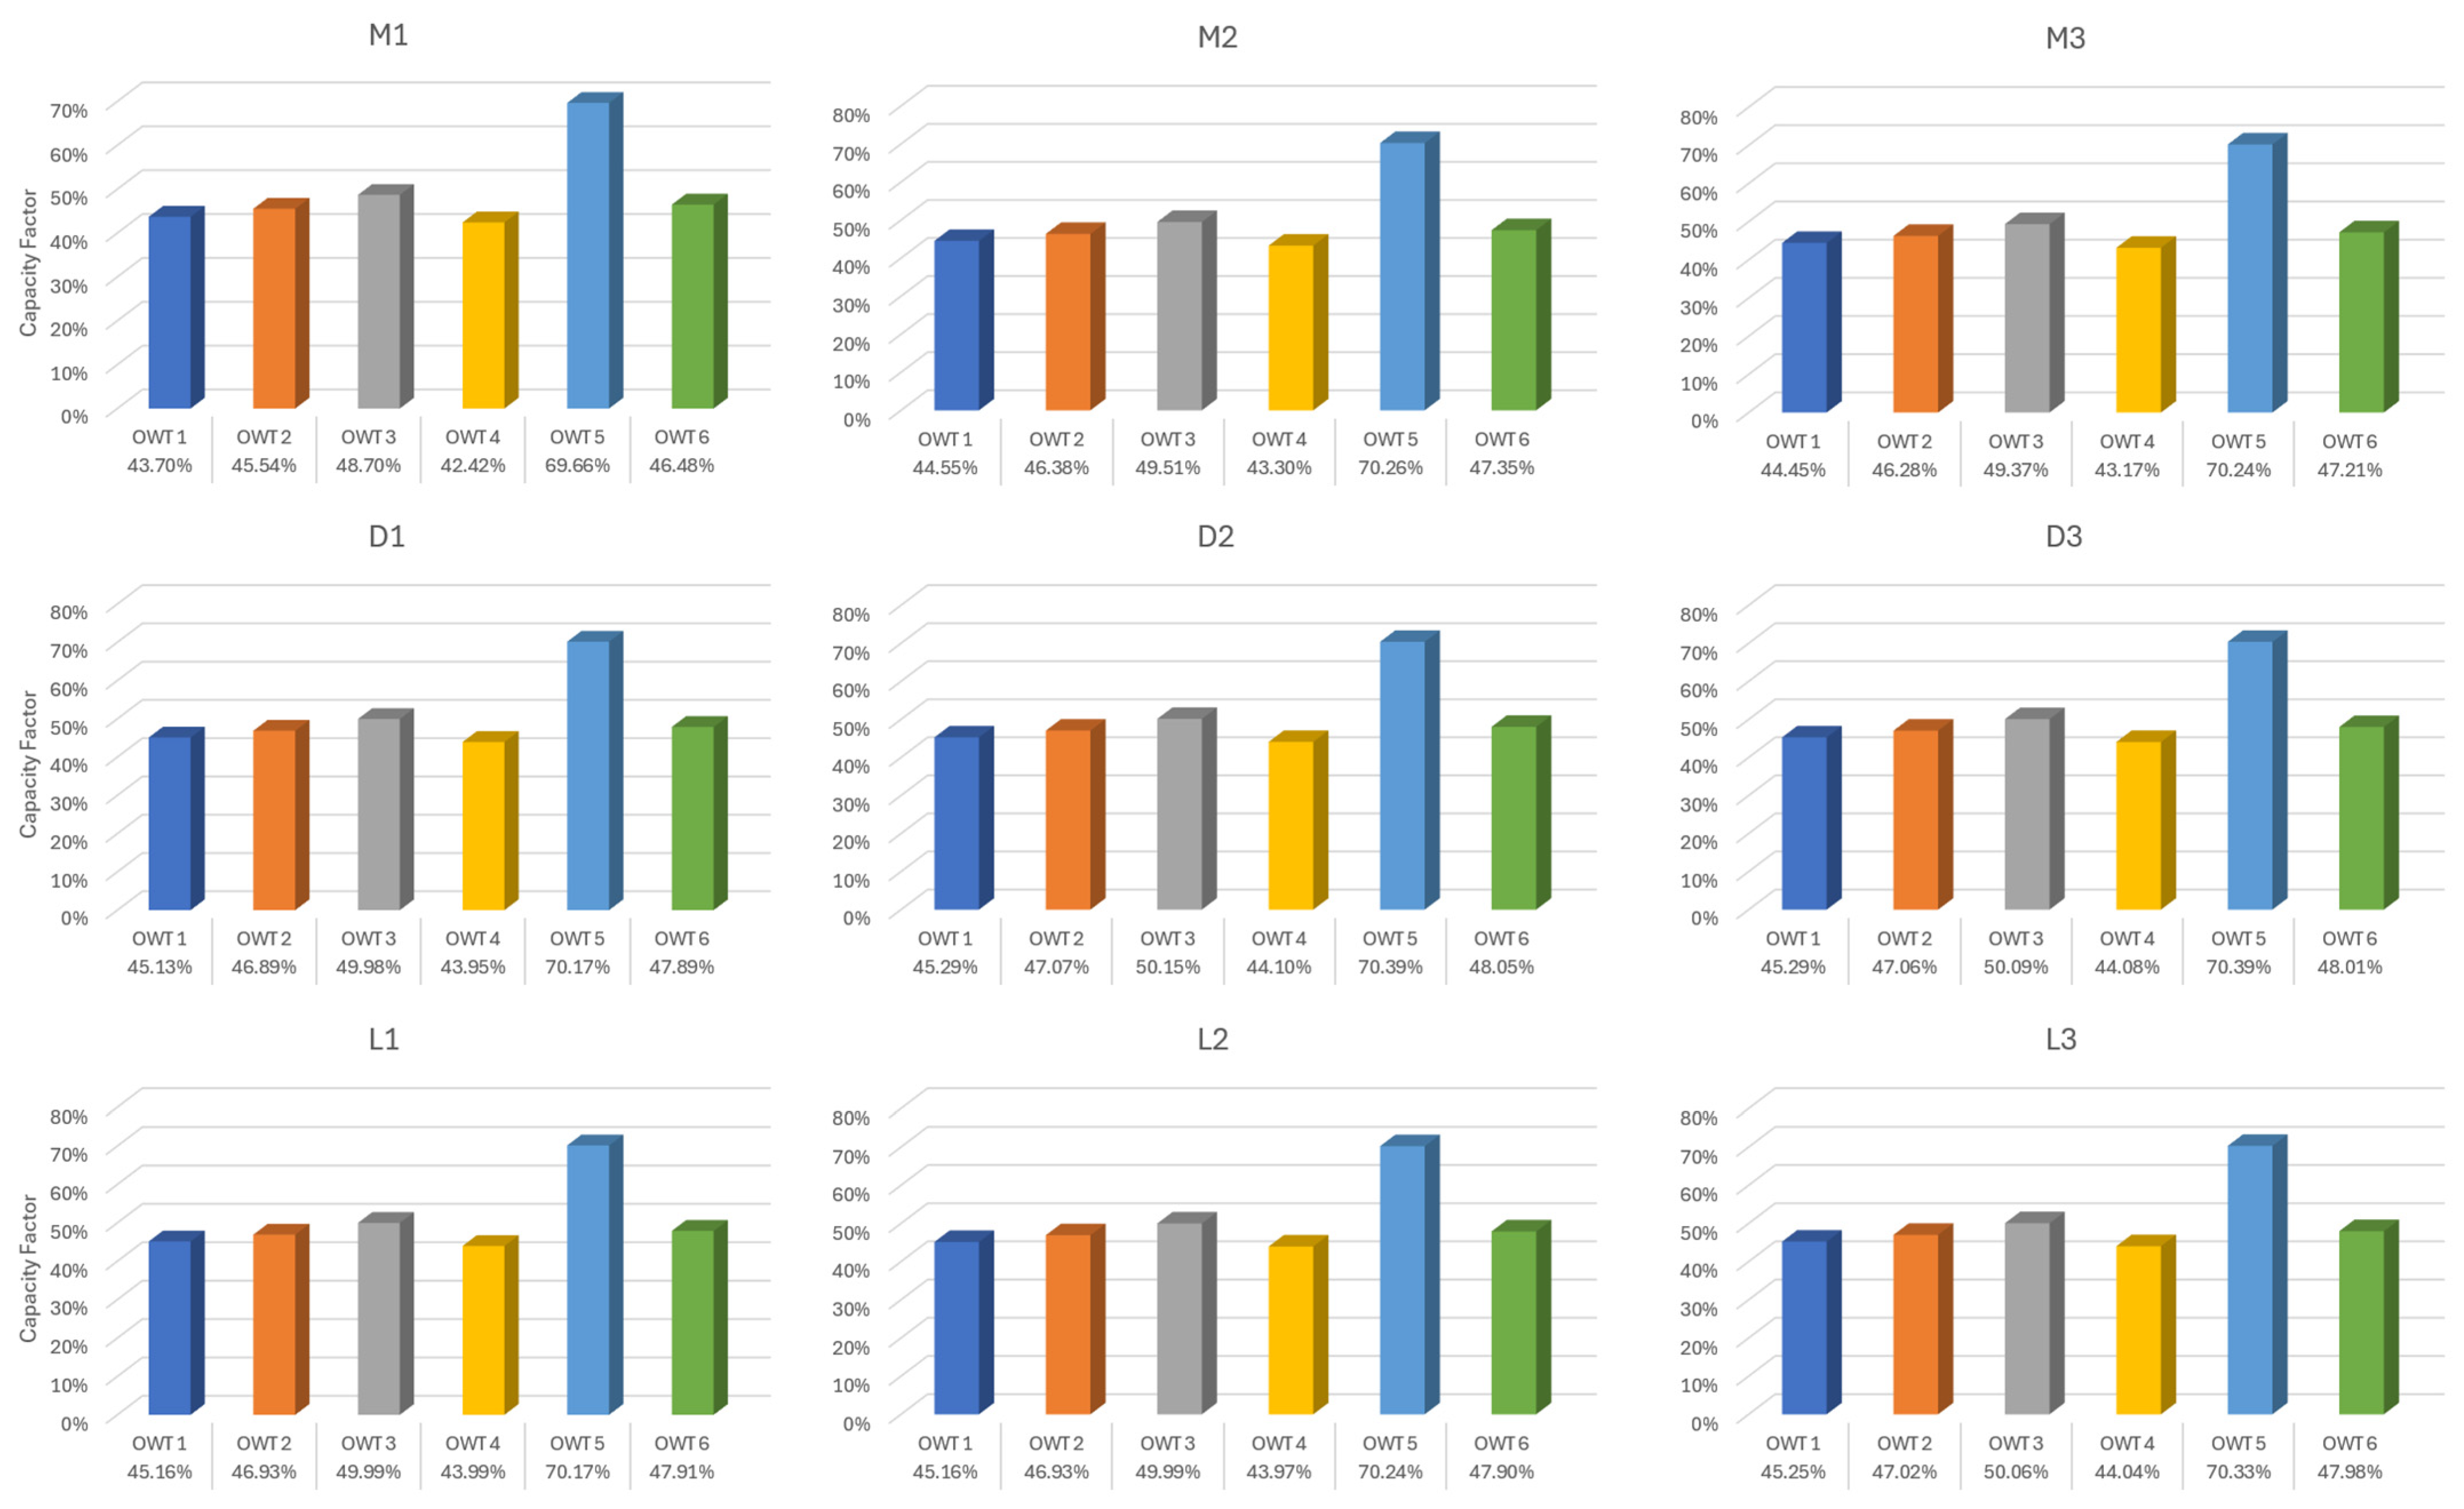
The results for CF, as shown in Figure 6, indicate a generally high level of turbine efficiency across all selected offshore sites during the 2026–2050 period. Among the six analyzed OWTs, Gamesa G132/3300 clearly records the highest values, ranging from 69.66% to 70.39%. This suggests an excellent match between the turbine power curve and the projected wind regime of the Romanian Black Sea area.
Figure 6.
Capacity Factor for six OWTs for the selected sites in the 2026–2050 period.
Siemens SWT 3.2-113 and Senvion 6.3M152 form a second performance group, with CF close to 50% for the first mentioned and around 47–48% for the second one. Although Senvion 6.3M152 has the highest rated power and therefore the largest absolute AEP, its CF remains lower than that of Gamesa G132/3300, highlighting that installed capacity alone does not determine relative turbine efficiency. Instead, the compatibility between the turbine operational characteristics and the local wind speed distribution plays a decisive role.
From a spatial perspective, the CF values show limited variability among the nine sites. The highest average performances are observed at D2, D3, and L3, while M1 generally records the lowest values. However, the differences between sites remain small, indicating that the offshore wind resource is relatively homogeneous across the selected locations.
4. Conclusions
The Romanian EEZ of the Black Sea presents a favorable offshore wind potential for the period 2026–2050. The offshore wind resource shows limited spatial variability across the analyzed locations. This indicates that the site location for an offshore wind project should not be limited exclusively to the variation in wind speed, but should also consider the water depth, the foundation costs, access to the network, and environmental constraints.
In this study, the selected depth ranges were chosen to represent areas suitable for the future deployment of floating offshore wind platforms, and the depth range from 40 to 120 m allows the wind resource and turbine performance to be examined in relation to both geographical position and bathymetric conditions.
The highest annual mean wind speeds are recorded in the first three years of the analyzed period, followed by fluctuations. However, the results obtained for the end of the period indicate a slight weakening of the wind resource in the region in the context of the climate scenario analyzed, RCP 4.5.
Regarding seasonality, the study demonstrates a pronounced seasonality with maximum values in the cold season and minimum values in the warm season. In winter, D2 and L1–L3 sites exceed 8.5 m/s, and in summer most locations are below the 7 m/s threshold. For offshore wind energy projects, seasonality has a direct impact on energy production and plays an important role in power system design and calibration of energy demand.
Although the L1–L3 sites show favorable results for offshore wind energy, the energy advantage of the locations further from the shore in deeper waters must also be corroborated by the characteristics of the turbines to be installed. Turbine selection can significantly influence energy production, even more than the water depth of the chosen sites. While the Senvion 6.3M152 turbine achieves the highest AEP for all locations, the Gamesa G132/3300 turbine records the highest CF across all sites.
Even though the spatial variation in the wind resource is limited, the difference between the power curves of the turbines is considerable. Therefore, the development and optimization of a future offshore wind project should be based on a good compatibility between the turbine performance and the local wind speed distribution.
Author Contributions
Conceptualization, A.S. and L.R.; writing—original draft preparation, A.S. and L.R.; writing—review and editing, A.S. and L.R.; visualization, A.S.; supervision, L.R. All authors have read and agreed to the published version of the manuscript.
Funding
This research received no external funding.
Data Availability Statement
The processed data generated during this study are available from the corresponding author upon reasonable request.
Conflicts of Interest
The authors declare no conflicts of interest.
References
- Lindsey, R.; Dahlman, L. Climate Change: Global Temperature. Available online: https://www.climate.gov/news-features/understanding-climate/climate-change-global-temperature (accessed on 20 February 2026).
- Von Jouanne, A.; Agamloh, E.; Yokochi, A. A Review of Offshore Renewable Energy for Advancing the Clean Energy Transition. Energies 2025, 18, 4798. [Google Scholar] [CrossRef] [Scilit]
- Silion, A.; Rusu, L. A Review Concerning the Offshore Wind and Wave Energy Potential in the Black Sea. J. Mar. Sci. Eng. 2025, 13, 1643. [Google Scholar] [CrossRef] [Scilit]
- Global Wind Energy Council. GWEC|Global Wind Report 2026; Global Wind Energy Council (GWEC): Lisbon, Portugal, 2026. [Google Scholar]
- Tumse, S.; Bilgili, M.; Yildirim, A.; Sahin, B. Comparative Analysis of Global Onshore and Offshore Wind Energy Characteristics and Potentials. Sustainability 2024, 16, 6614. [Google Scholar] [CrossRef] [Scilit]
- McKenna, R.; Lilliestam, J.; Heinrichs, H.U.; Weinand, J.; Schmidt, J.; Staffell, I.; Hahmann, A.N.; Burgherr, P.; Burdack, A.; Bucha, M.; et al. System Impacts of Wind Energy Developments: Key Research Challenges and Opportunities. Joule 2025, 9, 101799. [Google Scholar] [CrossRef] [Scilit]
- World Bank Group. Going Global: Expanding Offshore Wind to Emerging Markets: Technical Potential for Offshore Wind in Black Sea—Map; World Bank Group: Washington, DC, USA, 2020. [Google Scholar]
- Silion, A.; Chirosca, A.-M.; Rusu, L. European Projects and Strategies for Renewable Energy Development in the Black Sea Area; SGEM World Publishing: Vienna, Austria, 2025; pp. 51–60. [Google Scholar]
- Benazzouz, A.; Mabchour, H.; El Had, K.; Zourarah, B.; Mordane, S. Offshore Wind Energy Resource in the Kingdom of Morocco: Assessment of the Seasonal Potential Variability Based on Satellite Data. J. Mar. Sci. Eng. 2020, 9, 31. [Google Scholar] [CrossRef] [Scilit]
- Song, D.; Zheng, S.; Yang, S.; Yang, J.; Dong, M.; Su, M.; Hoon Joo, Y. Annual Energy Production Estimation for Variable-Speed Wind Turbine at High-Altitude Site. J. Mod. Power Syst. Clean Energy 2021, 9, 684–687. [Google Scholar] [CrossRef] [Scilit]
- Soulouknga, M.H.; Oyedepo, S.O.; Doka, S.Y.; Kofane, T.C. Evaluation of the Cost of Producing Wind-Generated Electricity in Chad. Int. J. Energy Environ. Eng. 2020, 11, 275–287. [Google Scholar] [CrossRef] [Scilit]
- Islek, F.; Yuksel, Y.; Sahin, C. Spatiotemporal Long-Term Trends of Extreme Wind Characteristics over the Black Sea. Dyn. Atmos. Oceans 2020, 90, 101132. [Google Scholar] [CrossRef] [Scilit]
- El Hadri, Y.; Berlinsky, N.; Slizhe, M. Assessment of the Offshore Wind Power Potential of the Black and Azov Sea. Geo-Eco-Marina 2022, 28, 159–166. [Google Scholar] [CrossRef]

Disclaimer/Publisher’s Note: The statements, opinions and data contained in all publications are solely those of the individual author(s) and contributor(s) and not of MDPI and/or the editor(s). MDPI and/or the editor(s) disclaim responsibility for any injury to people or property resulting from any ideas, methods, instructions or products referred to in the content. |
© 2026 by the authors. Licensee MDPI, Basel, Switzerland. This article is an open access article distributed under the terms and conditions of the Creative Commons Attribution (CC BY) license.