


Abstract
Circularity in the aluminium manufacturing and use industries has attracted increasing attention in recent years. This is partly due to the criticality of the raw material and the drive for a more sustainable, greener society through the EU Green Deal and subsequent legislation/frameworks. Several stakeholders regard post-consumer scrap (PCS) as a panacea for this transition to circularity. Obtaining an appropriate, recycling-friendly post-consumer scrap alloy for a product is challenging, thereby intensifying competition in the PCS alloy market. Furthermore, manufacturers in the aluminium industry must conduct accurate and transparent assessments of their products. Life Cycle Assessment is the primary method used today. While several modelling approaches exist within LCA, the EU recommends using either the product environmental footprint (PEF) (50:50) or the Circular Footprint Formula (CFF) approach. This paper highlights the limitations of these modelling approaches and compares them with the net-scrap approach for LCA of high-voltage aluminium cables. The strength of the net-scrap approach lies in its robustness, particularly in demand-heavy PCS markets. It promotes the use of recycled inputs and end-of-life recyclability and allows for the inclusion of metal quality parameters. These are key levers for achieving high circularity (i.e., over 70%) in open-loop recycling of aluminium alloys.
1. Introduction
Since 2013, aluminium has been designated a critical and strategic raw material within the Critical Raw Materials Act due to its essential role in the green transition and its high economic importance for various applications [1,2]. Today, only about 13 countries maintain significant active aluminium production, with Russia and Norway being the only European countries on this list [3]. Yet demand has continued to grow strongly due to its lightweight, high recyclability, and relatively low carbon footprint, even for virgin aluminium [4]. Current geopolitical tensions further underscore the criticality of aluminium as a raw material and, therefore, place an increased burden on manufacturing industries regarding resilience. Hence, in addition to environmental sustainability concerns, many industry players now look to post-consumer scrap as an alternative or buffer for supply chain disruptions. Among these is the subsea cable industry, which continues to grow due to the EU’s target for increased grid interconnections [5]. Subsea cables are predominantly aluminium (around 17% by mass) [6]. They have long lifespans and are difficult, complex products to recycle.
Drawing from this, the European Commission has enacted and operationalised several relevant pieces of legislation and frameworks, with an increased focus on resource efficiency (material and energy), recycling, and tracking materials across supply chains [7,8,9]. Overall, these frameworks and legislation aim to reduce the EU’s reliance on external (critical) raw material supply disruptions while improving environmental sustainability [2]. They emphasise transparency and completeness in reporting product environmental impacts to promote comparison and fair competition.
1.1. Environmental Declarations and Documentations
Environmental Product Declarations (EPDs) are among the primary mechanisms for ensuring transparency and comparability in modern industrial supply chains. They provide a third-party-verified presentation of a product’s environmental impacts across its life cycle. EPDs have become strategically important not only for compliance but also for market positioning by demonstrating a commitment to sustainability, supply chain transparency, and regulatory compliance. Under frameworks such as the Eco-Design for Sustainable Products Regulation, the EU is introducing the Digital Product Passport (DPP), a data-rich, dynamic product identity that accompanies a product through its value chain [10], creating a more granular foundation for assessing sustainability performance over time.
1.2. Life Cycle Assessment and Modelling Approaches
The Life Cycle Assessment (LCA) methodology, based on the ISO 14000 series (especially ISO 14040 and ISO 14044), is the gold standard for assessing a product’s environmental performance when preparing EPDs or DPPs. Despite being quite old and largely standardised, the LCA methodology remains under development as it continuously seeks to address issues of uniformity and transparency, especially given the rapid changes in supply chain dynamics, sustainability strategies, and data-related technological advancements.
Several studies show that EOL modelling choices can indeed skew the LCA results and emphasise the need for uniformity [6,11]. The cut-off approach is the recommended modelling method for EPDs due to its simplicity. Other approaches, such as net-scrap, Product Environmental Footprint (PEF) 50:50, BPX 50:50, and the recent PEF Circular Footprint Formula (CFF), are mostly relegated to academia despite their robustness and intended rigour [12]. There is a need to push these modelling approaches to the industry to test their resilience and further develop them as needed.
1.3. Factors Affecting Modelling Choices for Products Using or Producing PCS
There is a lack of consensus on what constitutes waste and when a material is considered waste in the metals industry [4]. However, the choice of modelling approach requires understanding the value chain dynamics (i.e., cost, supply and demand quantities) related to the PCS [13,14,15]. Some modelling approaches, such as the CFF, include a Factor A that attempts to incorporate market dynamics by penalising producers for using high recycled input of in-demand materials without enabling end-of-life (EOL) recyclability [12]. Other modelling approaches address this market consideration indirectly by allocating some burden to the product system regardless of its economic value, since scrap is assumed to remain valuable and to avoid dealing with the volatility of market-driven parameters.
Quality retention after use and waste disposal must also be considered, as some applications, such as the subsea cable industry, have very strict purity requirements that PCS can struggle to meet [16]. The product’s lifespan is another important factor to consider when making modelling choices. This is due to potential changes in technology and market dynamics, as well as uncertainty regarding the material’s EOL management. Even for short-lived products like beverage cans, having a high amount of recycled PCS input without EOL recycling results in a high carbon footprint [14].
1.4. Aim and Significance of the Study
This lack of uniformity causes misrepresentation, makes it difficult to compare results, even when the LCA is conducted according to the same standards and product category rules (PCRs), and hinders cross-value-chain dialogue and collaboration [4]. Several studies have compared different EOL modelling approaches to assess robustness and applicability for selected sectors [11,12,17]. However, these studies did not compare the 50:50 approaches with the CFF or net-scrap, despite the strong similarities between them and ongoing debates about the robustness of the CFF. The authors believe this is the first LCA study on subsea cables using the CFF methodology.
This study aims to examine the performance of the EU-recommended LCA methods (PEF 50:50 and PEF CFF) against the European Aluminium Association’s recommended net-scrap alternative. The authors have recently compared the net-scrap approach to the cut-off and substitution approaches [6]; therefore, the novelty of this study is the extension of this comparison to the CFF. Specifically, this study applies the CFF to a new domain (subsea cables), performing scenario analysis on EOL possibilities and highlighting the impact of the Factor A. To do this, the authors attempt to answer the following research questions:
- How does a product’s carbon footprint change when the post-consumer scrap input is varied, with the recycling percentage also varied?
- How is the carbon footprint impacted by the chosen recycling modelling approach?
2. Method
The LCA method is structured in accordance with the ISO 14040 requirements and is described in detail in Nwagwu et al. (2026) [6]. Four end-of-life modelling approaches are compared:
- The PEF 50:50 approach.
- BPX 50:50 approach.
- Circular Footprint Formula.
- Net-scrap approach.
2.1. Goal and Scope Definition
The goal of this study is to compare different EU-recommended EOL modelling approaches (i.e., PEF 50:50 and CFF) and the net-scrap approach. The authors include the BPX 50:50 due to its perceived robustness and completeness compared to the PEF variant. The study is intended as a methodological comparison of the aluminium content of a subsea cable and, in particular, the flow of post-consumer aluminium scrap over two product systems. A full LCA of the subsea cable is outside the scope of this study.
In line with Nwagwu et al. (2026), this study assigns a zero embodied footprint only to waste generated after the use phase [6]. This implies that manufacturing scrap and scrap from other phases are strictly outside the scope of this study. Only post-consumer scraps (PCS), leaving the product system after the end-of-use or end-of-life, can be given environmental credits for their recycling. Hence, recycled input in this study refers exclusively to PCS input, and are used interchangeably throughout the paper.
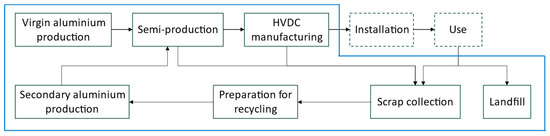
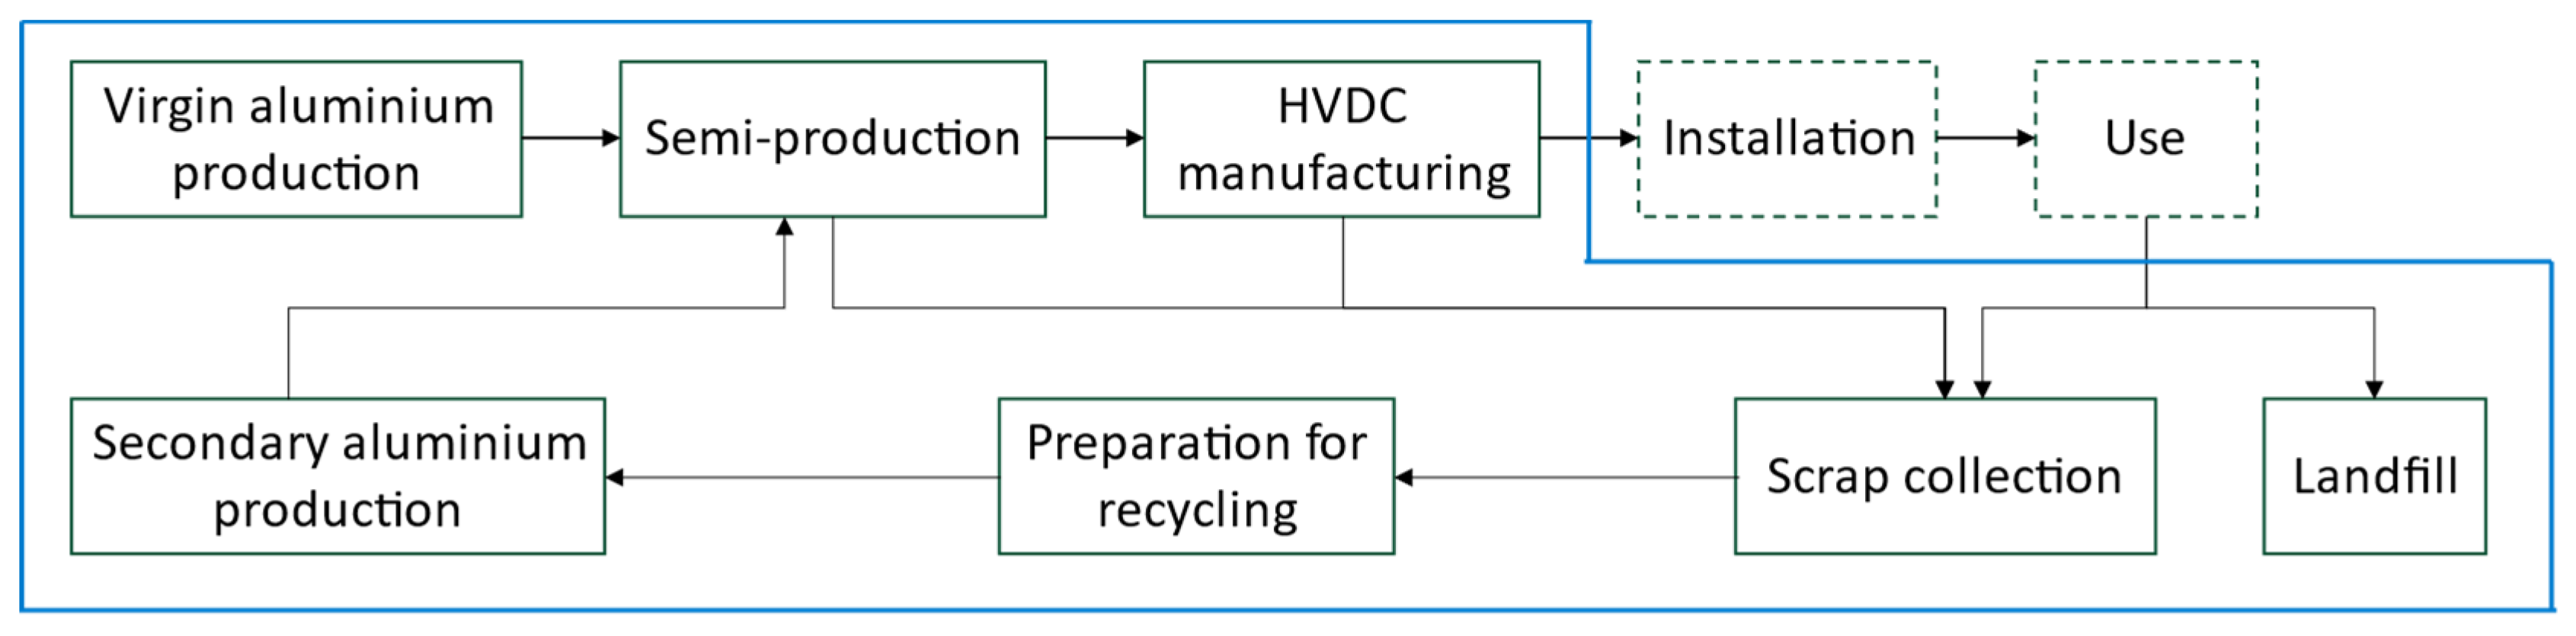
The functional unit is the mass of aluminium required for a 1 km long aluminium subsea cable produced in Norway for the European market. The product system is shown in Figure 1. The end-of-waste state in this study is defined immediately before preparation for recycling, in line with the PEP-PCR’s end-of-waste decision tree [18]. Installation and use of the subsea cables are excluded from the system because they are assumed to be the same across all scenarios. For the analysis, scrap collection is embedded in the “preparation for recycling” process.
Figure 1.
Product system and system boundary. Included in the system: virgin aluminium production, secondary aluminium production, subsea cable manufacturing, scrap collection, preparation for recycling (i.e., sorting and shredding), landfilling activities, and all associated transport activities. Excluded: installation and use.
The study tests the sensitivity of the carbon footprint to the choice of EOL modelling approach and to recycling inputs and outputs. The authors used the following recycled input shares: 0%, 30%, 60%, and 100%, and the following recycled output shares: 25%, 50%, 75%, and 100%. This yields a total of 16 scenarios for each modelling approach in addition to today’s assumed baseline of 0% recycled input and 70% EOL recycling [6].
2.2. Inventory Analysis
The inventory as presented in Table 1 is taken verbatim from Nwagwu et al. (2026) [6], with the addition of Factor A as defined by the European Commission [19]. The climate change impact is based on the Global Warming Potential over a 100-year horizon, as assessed using ReCiPe models. Ecoinvent datasets were used as background data, rather than EF-compliant ones as required for CFF, following similar approach by Huysman et al. (2026) [12]. This is due to the requirement to obtain the European Commission’s agreement to use said datasets. The authors note that this limitation may lead to differences and ultimately affect the interpretation of the results.
Table 1.
Life cycle inventory and respective data sources.
2.3. Impact Assessment
The development of recycling allocation methodologies in Life Cycle Assessment (LCA) has been shaped by more than two decades of methodological debates within the EU, ISO standardisation efforts, and sector-driven initiatives in the metals industries. The following overview presents each core method:
2.3.1. PEF 50:50, with Credit
The PEF 50:50 with credit method was developed as part of the European Commission’s Product Environmental Footprint (PEF) initiative, which began in 2013 and sought to harmonise environmental assessment practices across product categories as part of the Single Market for Green Products [22,23]. The 50:50 approach assigns equal weight to recycled input and end-of-life recycling, encouraging balanced circularity strategies across the value chain. The inclusion of an avoided-burden credit means that products that contribute recyclable scrap receive environmental benefits that reflect the displacement of primary material production. However, it presents a relatively simplistic view of complex scrap markets and fails to account for market scarcity. The equation used in this study is based on Allacker et al. (2017) [11].
2.3.2. BPX 50:50
The BPX 50:50 method (now cancelled) originated within French environmental labelling and product footprinting initiatives and served as one of the conceptual stepping stones that influenced subsequent EU-wide frameworks [24]. BPX 50:50 resembles the PEF variant in its equal attribution of impacts to both recycled input and end-of-life recycling. However, it also distributes the burdens of virgin production and disposal across the product systems. This means that no material, including PCS, should be treated as burden-free, but recycled inputs must bear the burdens of their initial virgin production. The general idea behind this approach is a systems-wide fair distribution of credits that acknowledges that PCS cannot exist without its fair share of environmental baggage from first production. While this simplicity makes BPX 50:50 easy to use and fair, it also risks oversimplifying credit distribution [25]. The equation used in this study is based on Allacker et al. (2017) [11].
2.3.3. PEF Circular Footprint Formula (CFF)
The Circular Footprint Formula (CFF) is the most advanced recycling allocation method within the EU’s Environmental Footprint (EF) framework, as detailed in the Joint Research Centre’s technical reports accompanying Recommendation 2021/2279 [26]. The CFF builds on the 50:50 approach and integrates multiple parameters, including recycled input, end-of-life recycling rate, quality factors comparing secondary to primary materials, and a market-dependent Factor A [27]. This Factor A ranges from 0.2 to 0.8, depending on material supply and demand [19]. By capturing market realities and quality differentials, the CFF provides a good representation of environmental outcomes in systems with limited high-grade scrap flows. Its parameterised structure ensures that both recycling inputs and outputs are accounted for without double-counting, making it a robust EU-endorsed method. However, the CFF is fairly new, and its robustness has only been tested on a few real-world cases. Several studies have highlighted the method’s limitations related to energy-based functional units, the use of a fixed factor that may not be applicable to specific industrial realities, and the unavailability of factors for some materials with less-known or established secondary markets [28]. Studies have also questioned its use for products with long lifespans without leading to greenwashing [29]. The equation used is taken from Ekvall et al. (2020) and the Battery Pass report [21,30]. The energy component is held constant at zero, like in Rickert and Ciroth (2020), due to limited information on the fractions of material used for energy recovery [31].
2.3.4. Net-Scrap
The net-scrap method predates the PEF initiatives and originates in long-standing metals-industry LCA practice, particularly in the aluminium and steel supply chains [32]. The European Aluminium Association (EAA)’s 2013 guidance emphasises that aluminium requires recycling allocation methods that reflect the true balance between scrap consumed and scrap supplied by a product system [33]. The net-scrap method assigns environmental burdens or credits based on whether a product is a net consumer or net generator of scrap. A product that uses more secondary material than it provides at the end of life is treated as drawing on scarce scrap resources and must therefore bear the environmental burdens associated with producing additional primary aluminium. However, because results depend on the net balance of flows, they can be sensitive to system boundaries and assumptions regarding downstream recycling processes. The study relies on the approach by Nwagwu et al. (2026) [6].
The equations for the respective approaches are given in Equations (1)–(4). The calculations were performed in Excel due to the analysis’s simplicity.
where
- = mass of aluminium;
- = environmental burdens of primary production;
- = post-consumer scrap input;
- = environmental burdens of transport from raw material extraction to production, including transport distance;
- = environmental burdens of secondary aluminium production or recycling;
- = environmental burdens of transport from recycling station to production, including transport distance;
- = environmental burdens of preparation for recycling;
- = EOL recyclable input;
- = environmental burdens of transport from production or use to preparation for recycling, including transport distance;
- = environmental burdens of transport from preparation for recycling to recycling, including transport distance;
- = environmental burdens of landfilling;
- = environmental burdens of transport to landfill;
- = = quality of the material at first life, before recycling (assumed as 1.00);
- = quality of the material after recycling (assumed as 0.95).
- Here, we assume = = .
3. Results and Discussion
The results of the baseline scenario (0% recycled input and 70% recyclable output) in Table 2 show that, based on today’s assumed reality for most aluminium products, the net-scrap approach has the lowest carbon footprint. The PEF CFF follows behind with 106 tCO2e, while both 50:50 approaches are significantly higher than the PEF CFF. There seems to be no significant difference in the contribution of transport and landfilling in all EOL approaches. Meanwhile, primary aluminium production remains the largest contributor to total emissions across all EOL approaches. The net-scrap shows the highest (negative) contribution of secondary aluminium production. This is because the mass of recycled aluminium input for net-scrap is (0–70%) × 15.27 tonnes, but 0 tonnes for others (i.e., 0% × 15.27 tonnes).
Table 2.
Percentage contribution of different life cycle stages to the total baseline emissions.
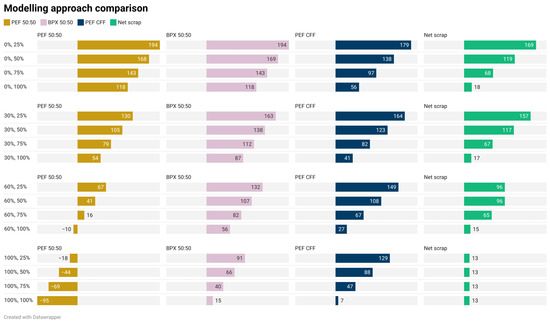
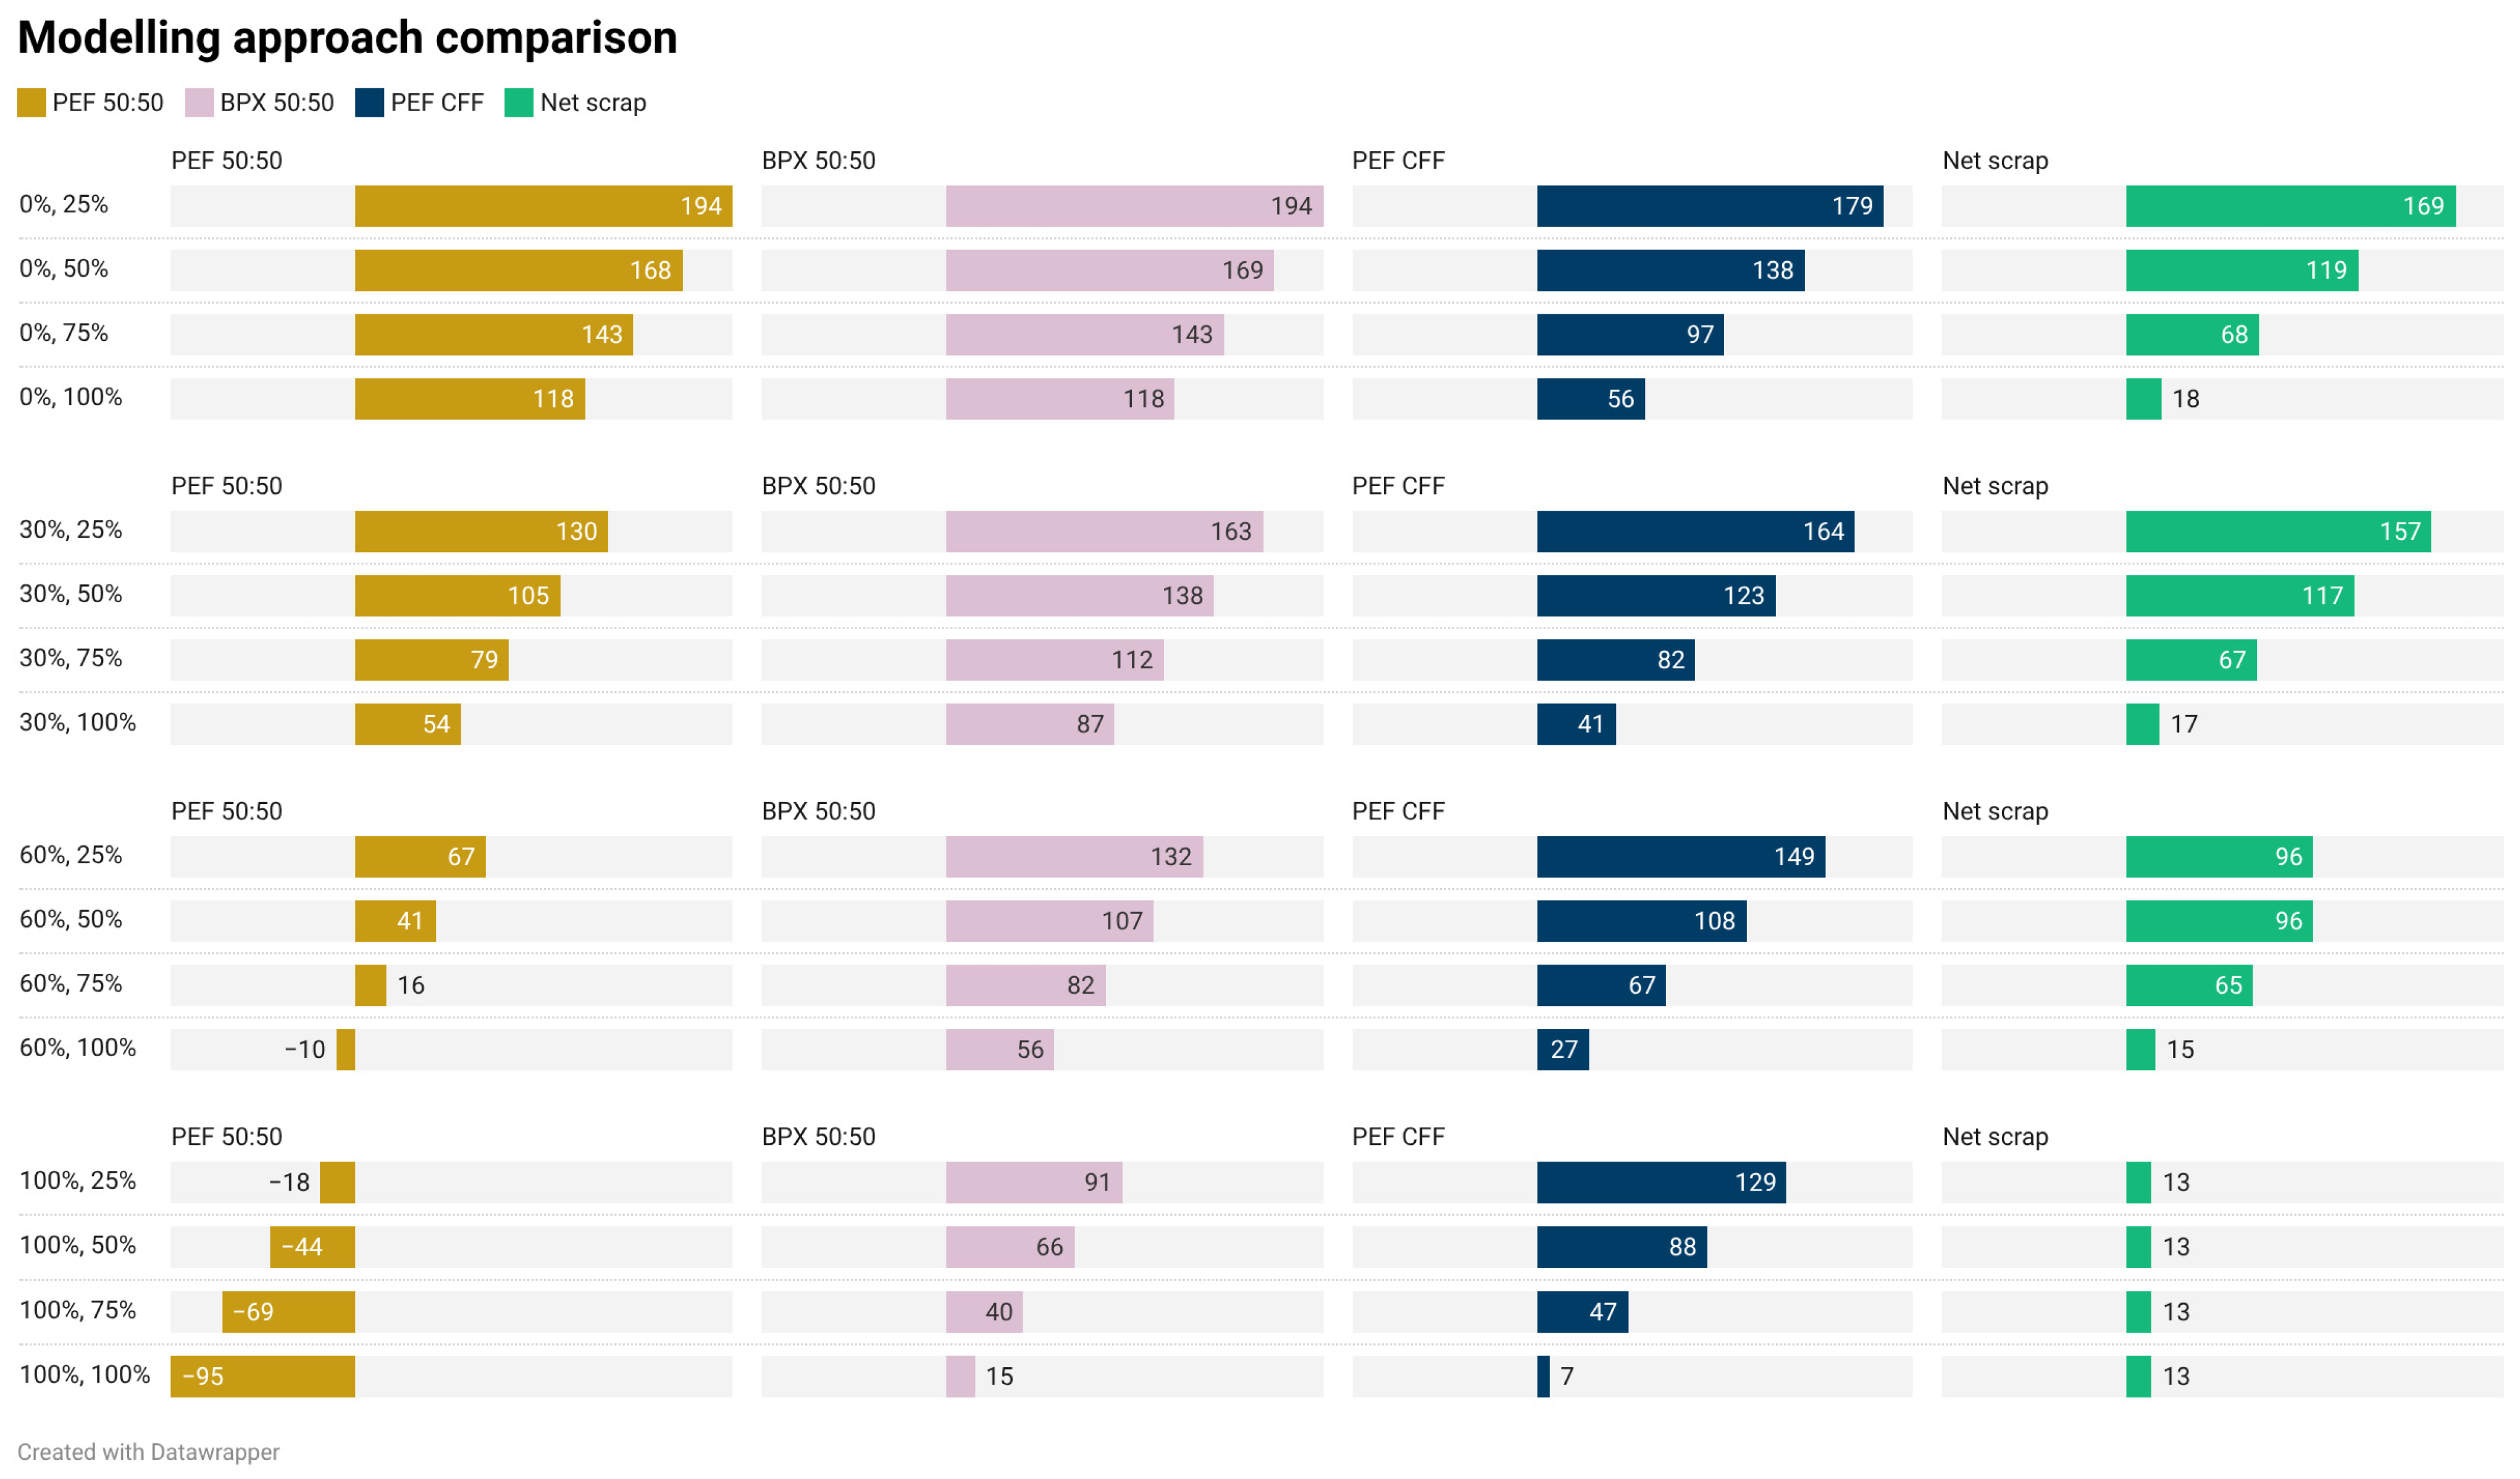
In Figure 2, all EOL approaches show decreasing carbon footprint values as the share of recyclable output (R2) increases, with recycled input (R1) held constant. Specifically, for R1 = 0%, PEF 50:50 and BPX 50:50 show a similar slight decrease (39%) as R2 goes from 25% to 100%, while PEF CFF shows a steep drop (69%), and net scrap shows a stronger drop (81%). For R1 = 30%, the patterns are similar, with lower overall emission values. When R1 = 60%, BPX 50:50, PEF CFF, and net-scrap all drop steadily while remaining positive. However, PEF 50:50 shows very low carbon footprint values compared to its 30% scenario and even reaches negative values at high R2. The negative carbon footprint trend in the PEF 50:50 approach persists even at R1 = 100%, while BPX 50:50 and PEF CFF progressively approach minimal values of 15 and 7, respectively. In the same scenario, the net-scrap approach appears to be constant (also at R1 = 60% + R2 = 0%, 30%). Hence, the net-scrap approach becomes insensitive when R1 > R2 because it accounts only for the net positive outflow of recycled materials [21].
Figure 2.
Life cycle impact assessment results for different recycled inputs, varying EOL recycling and LCA method.
Overall, Figure 2 indicates that the PEF 50:50 approach is the most sensitive model, dropping fastest and reaching negative values. It may also be the least realistic given current market dynamics in the metals industry, where companies should not receive credits for locking in valuable post-consumer scrap (i.e., high PCS input with low PCS output). While BPX 50:50 closely resembles the PEF alternative, the values stay positive even for high R1 + high R2 scenarios. This is because the BPX approach adopts a less aggressive assumption by penalising the scrap-receiving product system for cradle-to-gate emissions that occur during the first production. The rationale holds because burden-free post-consumer scrap ignores the fact that such “clean” raw material would not have come into existence with its embodied emissions. However, the authors find that for post-consumer scrap spanning multiple product systems, it may be difficult to avoid double-counting burdens and credits.
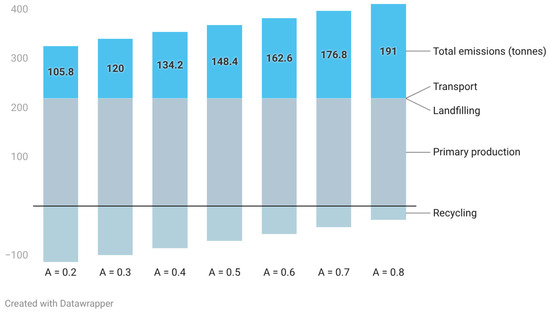
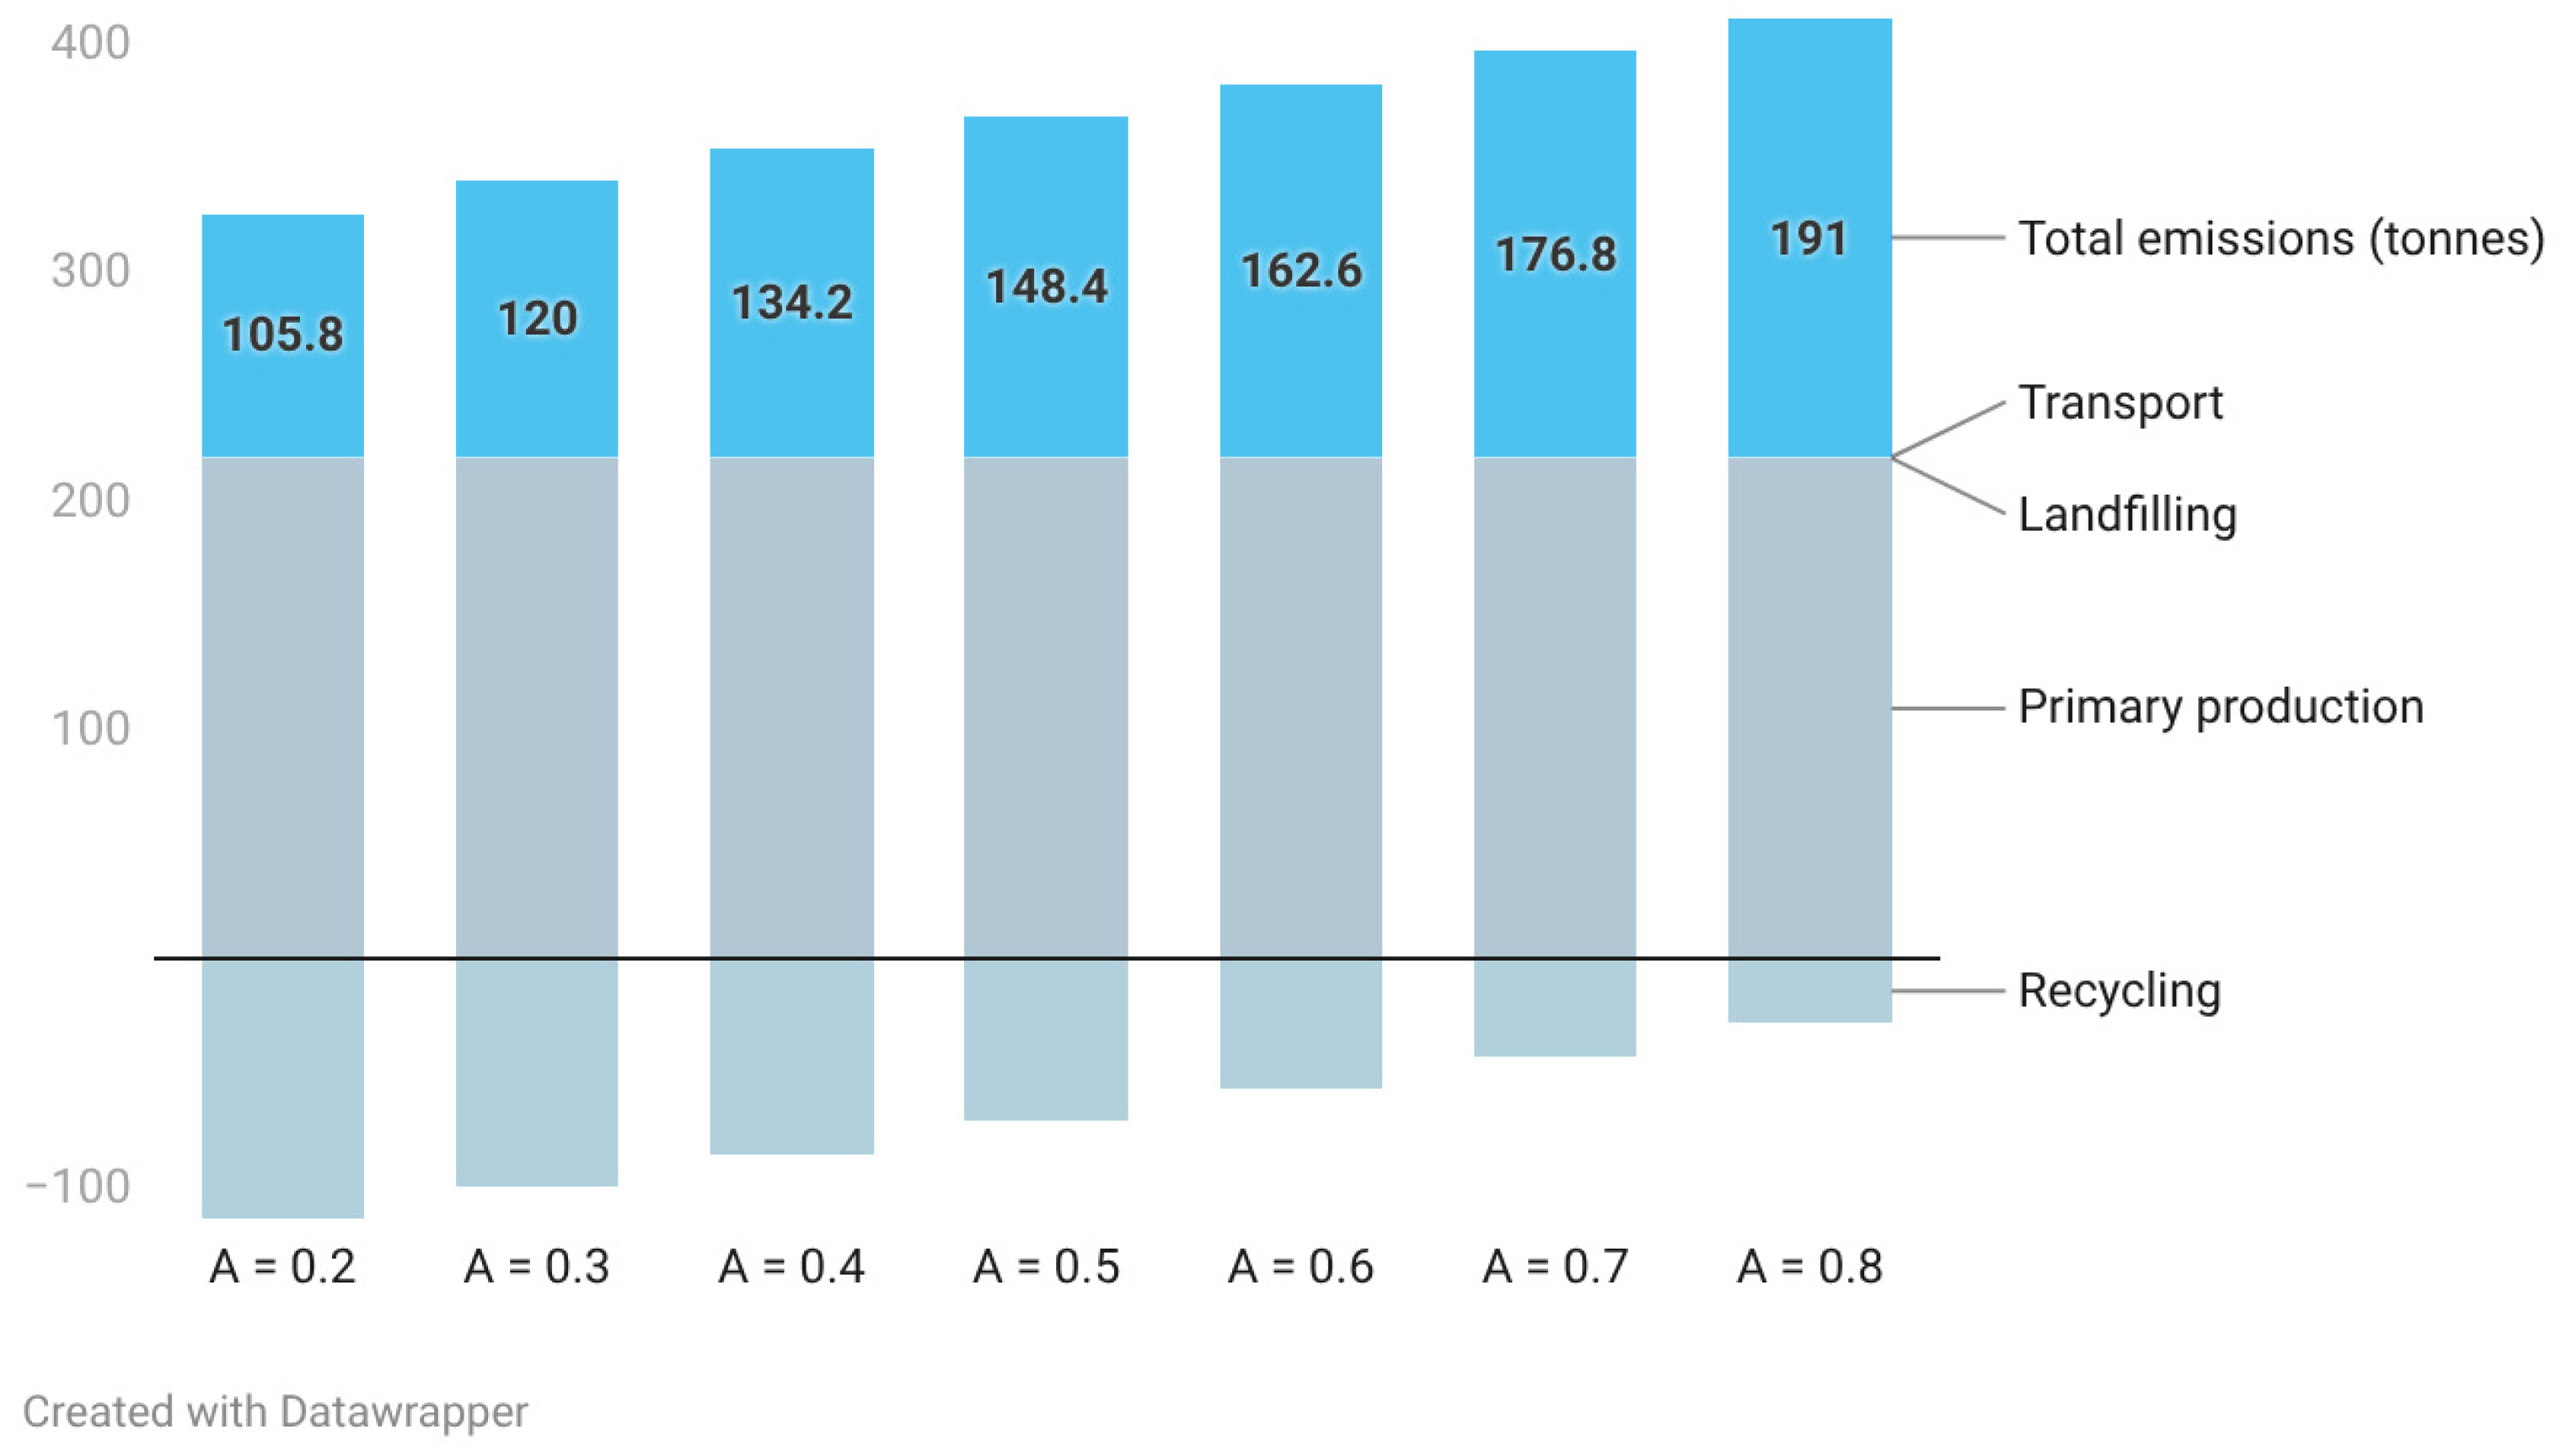
The PEF CFF approach appears to be more conservative than the two 50:50 approaches, as it produces lower values for scenarios where R2 ≥ R1 but never reaches negative values. This is because the CFF approach handles recycling credits/burdens more cautiously by accounting for the expected increase in material demand resulting from the product system’s use of PCS input. As seen in Equation (3), the CFF approach does this using a Factor A, such that A is low for materials with high PCS demand but low supply. The clear implication of this factor is shown in Figure 3, where a 50% increase in A leads to about 15% increase in the total environmental impacts. Our results match those of Huysman et al. (2016), who found that a 60% increase in Factor A led to a 19% increase in the carbon footprint [12]. This shows that, using this approach, market dynamics largely dictate the carbon footprint. It is also worth noting that when Factor A is 0.5, the CFF is essentially a 50:50 modelling approach as seen in Table 2.
Figure 3.
Impact of varying Factor A in the Circular Footprint Formula on the baseline carbon footprint (note: recycling includes scrap collection, preparation for recycling, and secondary aluminium production).
On the other hand, the net-scrap approach behaves slightly differently than the PEF CFF, as it drops faster than other approaches and then steadily flattens to a constant value as R2 ≥ R1. Unlike the CFF, this approach is based primarily on the net availability of recycled material and assumes that (1) all scrap is valuable, (2) the demand will always be high. Market-dependent metrics like Factor A of the CFF are volatile and give a false impression of industrial reality when, in fact, they are subjective, arbitrary, and difficult to explain to customers. Metal supply chains are complex, and geopolitical tensions cause supply and demand, as well as overall interest in PCS, to shift more quickly than Factor A and associated EPDs can be adjusted. As a result, the net-scrap approach is considered a more robust EOL modelling approach for LCAs in the metals industry, especially for long-lived products such as subsea cables.
To put this in perspective, modelling the use of PCS for subsea cables based on today’s market dynamics increases uncertainty of LCA results, since one cannot assume that, at their EOL in 25–40 years [34], the same dynamics will hold true. This is also because the credits and burdens in the CFF and net-scrap are included in the reported values for the current product system.
4. Conclusions
The study shows that as the PCS input and output are varied, the carbon footprint changes significantly. Despite all four studied modelling approaches crediting both the use of recycled inputs and the production of recyclable products, they show substantial differences in their results. The scale of this difference depends on the EOL modelling approach used, as some approaches distribute the credits/burdens equally for the first and second product systems (i.e., PEF 50:50 and BPX 50:50), while others attempt a fair and practical distribution of the credits/burdens based on supply and demand forces (i.e., PEF CFF and net-scrap). The authors suggest that, rather than confining the studied approaches to academia, practitioners must push them into industry to test their resilience and further develop them as needed.
Significant progress has indeed been made in improving EOL modelling in LCA for products in the European market. However, the authors, like several others, express concern about using parameters like the Factor A that are prone to high uncertainty due to volatility in market dynamics. In particular, given the strong influence of Factor A in the CFF, the authors recommend rigorous scientific effort to select relevant factors for respective sectors. Future work should also test the CFF approach to examine what happens when multiple types of recycled materials are involved in a product system and to assess how using a single Factor A can be problematic. To reduce uncertainty propagation, the authors strongly recommend designing CFF-aligned background datasets and making them openly available and integrable in existing software.
Future work should also examine the sensitivity of all parameters across all EOL approaches to help industry players identify low-hanging fruit and to aid the focused development of the respective approaches. In conclusion, the authors support the IAI’s recommendation of the net-scrap approach for the aluminium industry pending further development of the PEF framework. However, the authors make no claim about the general superiority of the net-scrap approach beyond the study’s scope, assumptions, and limitations (e.g., use of Ecoinvent cut-off method background dataset).
Author Contributions
Conceptualisation, C.N., J.H. and C.M.; methodology, C.N. and J.H.; formal analysis, C.N. and J.H.; validation, C.N. and J.H.; writing—original draft preparation, C.N. and J.H.; writing—review and editing, C.N., J.H. and C.M.; visualisation, C.N. All authors have read and agreed to the published version of the manuscript.
Funding
This research received no external funding.
Institutional Review Board Statement
Not applicable.
Informed Consent Statement
Not applicable.
Data Availability Statement
The raw data supporting the conclusions of this article will be made available by the authors on request since the data was obtained from third party company within a project.
Acknowledgments
During the preparation of this manuscript, the authors used Microsoft Copilot and ChatGPT to explain the existing literature and place the study’s results in the appropriate context. The authors have reviewed and edited the output and take full responsibility for the content of this publication.
Conflicts of Interest
The authors declare no conflicts of interest. SINTEF has no commercial conflicts of interest.
Abbreviations
| EU | European Union |
| PCS | Post-consumer scrap |
| LCA | Life Cycle Assessment |
| PEF | Product environmental footprint |
| CFF | Circular Footprint Formula |
| EPD | Environmental Product Declaration |
| DPP | Digital Product Passport |
| ISO | International Organisation for Standards |
| EOL | End-of-life |
| BPX | Bonnes Pratiques (Good Practices) |
| PCR | Product category rules |
| EAA | European Aluminium Association |
| tCO2e | Tonnes of carbon dioxide equivalents |
References
- European Aluminium. Critical Raw Materials Act: Enabling Conditions for a Thriving European Aluminium Value Chain; European Aluminium: Brussels, Belgium, 2022; Available online: https://european-aluminium.eu/wp-content/uploads/2022/11/22-11-2022-CRMs-Act_European-Aluminium.pdf (accessed on 2 September 2025).
- European Commission. Critical Raw Materials Act. 2024. Available online: http://data.europa.eu/eli/reg/2024/1252/oj/eng (accessed on 2 September 2025).
- Aluminum Production by Country 2026. World Population Review. Available online: https://worldpopulationreview.com/country-rankings/aluminum-production-by-country (accessed on 2 April 2026).
- Nwagwu, C.; Halfdanarson, J.; Meskers, C. Navigating the environmental footprint methodology for aluminium products with post-consumer scrap. Procedia CIRP 2025, 134, 479–484. [Google Scholar] [CrossRef] [Scilit]
- European Commission. Achieving the 10% Electricity Interconnection Target Making Europe’s Electricity Grid Fit for 2020. 2015. Available online: https://eur-lex.europa.eu/legal-content/EN/TXT/?uri=COM:2015:0082:FIN (accessed on 2 September 2025).
- Nwagwu, C.; Halfdanarson, J.; Meskers, C. How LCA Method Choice Skews the Carbon Footprint of Aluminium Cables with Post-consumer Scrap. In Light Metals 2026; Seno, R., Ed.; Springer Nature: Cham, Switzerland, 2026; pp. 1137–1145. [Google Scholar] [CrossRef] [Scilit]
- European Commission. The European Green Deal. Available online: https://commission.europa.eu/strategy-and-policy/priorities-2019-2024/european-green-deal_en (accessed on 2 April 2026).
- European Commission. A New Circular Economy Action Plan For a Cleaner and More Competitive Europe. 2020. Available online: https://eur-lex.europa.eu/legal-content/EN/TXT/?qid=1583933814386&uri=COM:2020:98:FIN (accessed on 2 April 2026).
- European Commission. Clean Industrial Deal-European Commission. Available online: https://commission.europa.eu/topics/competitiveness/clean-industrial-deal_en (accessed on 2 April 2026).
- European Union. EU’s Digital Product Passport: Advancing Transparency and Sustainability. Available online: https://data.europa.eu/en/news-events/news/eus-digital-product-passport-advancing-transparency-and-sustainability (accessed on 2 April 2026).
- Allacker, K.; Mathieux, F.; Pennington, D.; Pant, R. The search for an appropriate end-of-life formula for the purpose of the European Commission Environmental Footprint initiative. Int. J. Life Cycle Assess. 2017, 22, 1441–1458. [Google Scholar] [CrossRef] [Scilit]
- Huysman, S.; Yin, J.; Hammar, T. Evaluating the Circular Footprint Formula (CFF) in the environmental assessment of mono-material carpets recycling: A case study approach. Int. J. Life Cycle Assess. 2026, 31, 44. [Google Scholar] [CrossRef] [Scilit]
- Bergsma, G.C.; Sevenster, M.N. End-of-Life Best Approach for Allocating Recycling Benefits in LCAs of Metal Packaging: Report; CE Delft: Delft, The Netherlands, 2013. [Google Scholar]
- Atherton, J. Declaration by the Metals Industry on Recycling Principles. Int. J. Life Cycle Assess. 2007, 12, 59–60. [Google Scholar] [CrossRef] [Scilit]
- Frees, N. Crediting aluminium recycling in LCA by demand or by disposal. Int. J. Life Cycle Assess. 2008, 13, 212–218. [Google Scholar]
- Eland Cables. Recycling in the Cable Industry: Past, Present and Future|Eland Cables. Available online: https://www.elandcables.com/company/news-and-events/recycling-in-the-cable-industry-past-present-and-future (accessed on 2 September 2025).
- Haverkamp, P.; Traverso, M.; Lo Presti, D. Investigating end-of-life allocation approaches for bituminous mixtures. Road Mater. Pavement Des. 2025. [Google Scholar] [CrossRef] [Scilit]
- PEP Ecopassport® PROGRAM. Product Category Rules for Electrical, Electronic and HVAC-R Products. Available online: https://pep-ecopassport.org/site/wp-content/uploads/2026/06/PCR-4-ed4-EN-2021-09-06-PCR-edition-4.pdf (accessed on 2 September 2025).
- European Platform on LCA. EF 3.1 Annex C. Available online: https://eplca.jrc.ec.europa.eu/LCDN/developerEF.html (accessed on 2 April 2026).
- Raadal, H.L.; Saxegård, S.A.; Modahl, I.S.; Callewaert, P. Comparison of single-use and reuse beverage containers in Norway using different recycling modelling approaches. J. Clean. Prod. 2025, 519, 146003. [Google Scholar] [CrossRef] [Scilit]
- Ekvall, T.; Albertsson, G.S.; Jelse, K. Modeling Recycling in Life Cycle Assessment; IVL Svenska Miljöinstitutet: Stockholm, Sweden, 2020. [Google Scholar]
- European Commission. Building the Single Market for Green Products Facilitating Better Information on the Environmental Performance of Products and Organisations. 2013. Available online: https://eur-lex.europa.eu/legal-content/EN/TXT/?uri=celex:52013DC0196 (accessed on 2 April 2026).
- Finkbeiner, M. Product environmental footprint—Breakthrough or breakdown for policy implementation of life cycle assessment? Int. J. Life Cycle Assess. 2014, 19, 266–271. [Google Scholar] [CrossRef] [Scilit]
- BP X30-323-0; General Principles for an Environmental Communication on Mass Market Products: Part 0: General Principles and Methodological Framework. Afnor EDITIONS: La Plaine Saint-Denis, France, 2015. Available online: https://www.boutique.afnor.org/en-gb/standard/bp-x303230/general-principles-for-an-environmental-communication-on-mass-market-produc/fa059632/45364 (accessed on 2 April 2026).
- Luthin, A.; Traverso, M.; Crawford, R.H. Circular life cycle sustainability assessment: An integrated framework. J. Ind. Ecol. 2024, 28, 41–58. [Google Scholar] [CrossRef] [Scilit]
- Damiani, M.; Ferrara, N.; Ardente, F. Understanding Product Environmental Footprint and Organisation Environmental Footprint Methods. JRC Publications Repository. Available online: https://publications.jrc.ec.europa.eu/repository/handle/JRC129907 (accessed on 2 April 2026).
- Zampori, L.; Pant, R. Suggestions for updating the Product Environmental Footprint (PEF) Method. JRC Publications Repository. Available online: https://publications.jrc.ec.europa.eu/repository/handle/JRC115959 (accessed on 2 April 2026).
- Antonio Carlos Farrapo, J.; Matheus, T.T.; Lagunes, R.M.; Filleti, R.; Yamaji, F.; Silva, D.A.L. The Application of Circular Footprint Formula in Bioenergy/Bioeconomy: Challenges, Case Study, and Comparison with Life Cycle Assessment Allocation Methods. Sustainability 2023, 15, 2339. [Google Scholar] [CrossRef] [Scilit]
- Malabi Eberhardt, L.C.; van Stijn, A.; Rasmussen, F.N.; Birkved, M.; Birgisdottir, H. Towards circular life cycle assessment for the built environment: A comparison of allocation approaches. IOP Conf. Ser. Earth Environ. Sci. 2020, 588, 032026. [Google Scholar] [CrossRef] [Scilit]
- Battery Pass Consortium. Comparison of End-of-Life Allocation Approaches: An Analysis Complementing the Battery Pass Rules for Calculating the Carbon Footprint of the “End-of-Life and Recycling” Life Cycle Stage. 2023. Available online: https://thebatterypass.eu/assets/images/content-guidance/pdf/2023_Battery_Passport_EOL_Analysis.pdf (accessed on 4 September 2025).
- Rickert, J.; Ciroth, A. Application of the Circular Footprint Formula (CFF) in Product Environmental Footprint (PEF). Available online: https://www.greendelta.com/wp-content/uploads/2020/10/2020-10-PEF-application-of-CFF.pdf (accessed on 2 April 2026).
- Santero, N.; Hendry, J. Harmonization of LCA methodologies for the metal and mining industry. Int. J. Life Cycle Assess. 2016, 21, 1543–1553. [Google Scholar] [CrossRef] [Scilit]
- European Aluminium Association. Aluminium Recycling in LCA. 2013. Available online: https://european-aluminium.eu/wp-content/uploads/2022/10/2013-09-23-aluminium-recycling-in-lca.pdf (accessed on 2 April 2026).
- Ardelean, M.; Minnebo, P. HVDC Submarine Power Cables in the World: State-of-the-Art Knowledge; EUR 27527; Publications Office of the European Union: Luxembourg, 2015. [Google Scholar]

Disclaimer/Publisher’s Note: The statements, opinions and data contained in all publications are solely those of the individual author(s) and contributor(s) and not of MDPI and/or the editor(s). MDPI and/or the editor(s) disclaim responsibility for any injury to people or property resulting from any ideas, methods, instructions or products referred to in the content. |
© 2026 by the authors. Licensee MDPI, Basel, Switzerland. This article is an open access article distributed under the terms and conditions of the Creative Commons Attribution (CC BY) license.