


Abstract
Air duct contamination in HVAC systems degrades indoor air quality and reduces energy efficiency by increasing aerodynamic resistance, pressure drop, and electricity consumption. This study systematically analyzes contamination causes and their effects on indoor health, system performance, and energy use. It examines physical, biological, and chemical pollutants and their accumulation mechanisms. Emphasis is placed on inspection and diagnostic methods to guide effective monitoring strategies. Ten methods were evaluated using five criteria: reliability, applicability, speed, cost efficiency, and diagnostic value. Optical camera inspection with image processing and pressure drop measurement ranked highest, highlighting the importance of continuous monitoring for preventive maintenance and energy optimization.
1. Introduction
1.1. Relevance of the Problem
Ventilation is a critical element of indoor air management systems in buildings and directly affects air quality and the health and comfort of occupants. Mechanical ventilation is provided by systems that mechanically control the supply and exhaust of air, mainly heating, ventilation, and air conditioning (HVAC) installations. Currently, there are no precise data available on the proportion of the building stock that relies on mechanical ventilation.
Publications in scientific journals, official studies, and trade reports make it clear that the percentage of public and residential buildings with fully or partially installed HVAC systems varies significantly among both countries and building types.
For example, data from the United States Environmental Protection Agency (EPA) indicate that approximately 97% of office and industrial buildings use mechanical ventilation systems, whereas only around 3% rely on natural ventilation [1]. This shows that, in the commercial sector in the USA, installation with mechanical ventilation is a dominant practice. For the residential sector, there are good indications from various analyses that around 90% of homes have HVAC systems that provide heating and cooling. Many of these systems also provide controlled supply and exhaust outdoor air through grilles/filters, rather than merely recirculating indoor air [2].
In the European Union, the available data are considerably more fragmented. The current quantitative data, derived from actual measurements and surveys in European official services, are incomplete, making it difficult to obtain more precise percentages at the EU level [3].
Reports from projects such as HealthVent demonstrate that the use of mechanical ventilation does not follow the same practices across the EU [4]. For example, the majority of buildings in the EU still use natural ventilation, and the share of HVAC systems is lower in Southern Europe and higher in northern countries, where climate conditions impose more strict requirements.
The data indicate that, in residential buildings, mechanical ventilation remains less popular than natural ventilation in many countries (with natural ventilation exceeding 50% in many cases); however, substantial differences exist between countries.
For example, in Finland, there are mechanical ventilation systems installed in almost 48% of homes; Bulgaria comprises almost entirely naturally ventilated homes; and Germany, France, and Greece have varying shares with different types of HVAC systems.
There are no official national statistics for Bulgaria on the percentage of buildings equipped with mechanical ventilation. However, partial data are available. A report by the Bulgarian Association for Heating, Ventilation, and Air Conditioning (BAOVK) states that only slightly more than 1% of educational facilities in Bulgaria have a central HVAC system, while partial solutions have been implemented in about 20% [5]. From indirect sources, mainly commercial reports, it can be concluded that between 50 and 60% of office buildings in Bulgaria are equipped with modern HVAC systems, including those built before the 1990s, which are already being modernized [6,7,8].
Recent amendments to the Energy Performance of Buildings Directive, adopted in 2024, require Member States (including Bulgaria) to move towards a zero-emission building standard. This effectively makes modern ventilation and air conditioning systems mandatory for all new business projects; this is also obligatory according to national strategies such as the “Long-term national strategy to support the renovation of the national building stock of residential and non-residential buildings by 2050” [9] and the “Integrated energy and climate plan of the republic of Bulgaria 2021–2030 (updated 2024)” [10].
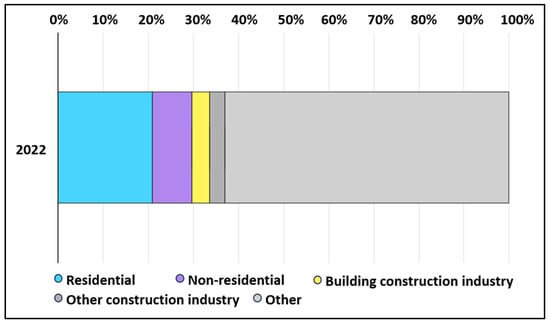
Globally, the building sector represents one of the major energy consumers and sources of greenhouse gas emissions. Data from the International Energy Agency (IEA) indicate that operational energy use in buildings amounted to around 30% of the world’s final energy consumption in 2022 (Figure 1) [11].
Figure 1.
IEA (2023), Final energy consumption of buildings relative to other sectors, 2022 [11].
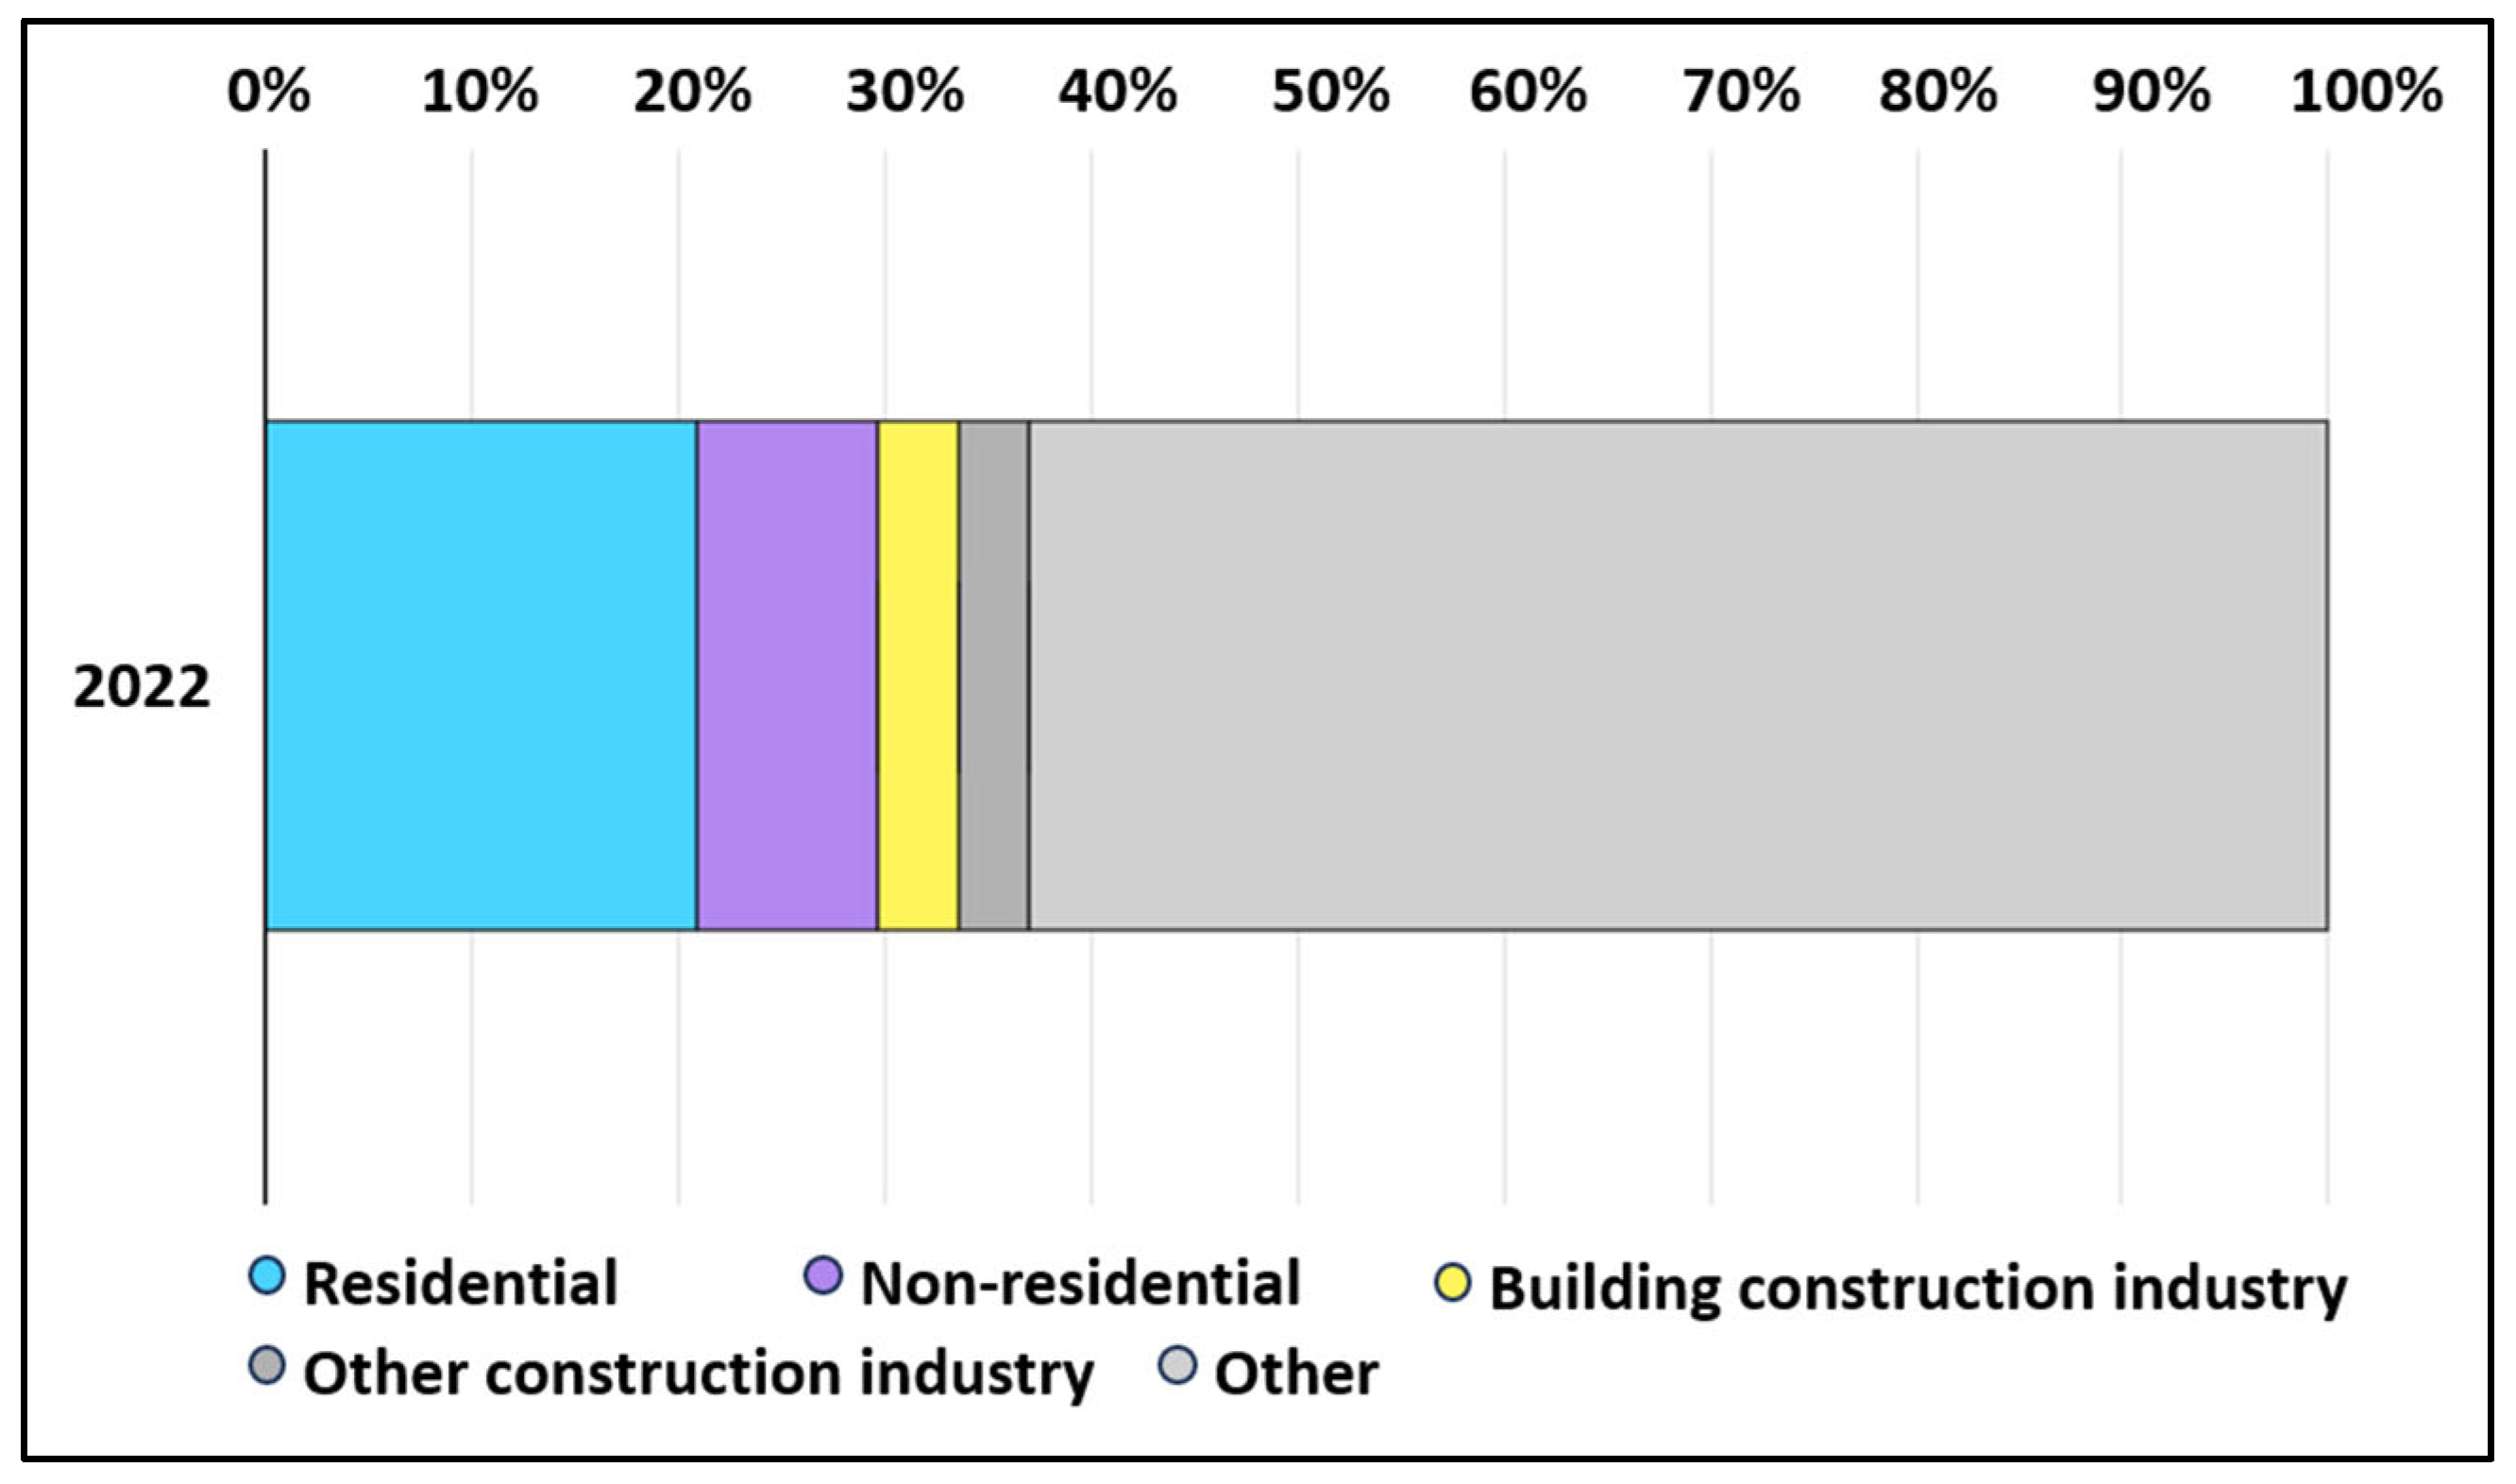
The amount of carbon emissions generated by the building sector is also significant and, according to the IEA, amounts to about 27% of the total generated for the sector (Figure 2) [12].
Figure 2.
IEA (2023), Global CO2 emissions from buildings, including embodied emissions from new construction, 2022 [12].
HVAC systems account for 40–60% of the operational energy consumption of buildings [13] and play a dual role. On the one hand, technical components, including air ducts and air-conditioning units, contribute significantly to both the operational and life-cycle CO2 emissions of buildings [14]. On the other hand, they are essential for maintaining a healthy and safe indoor environment.
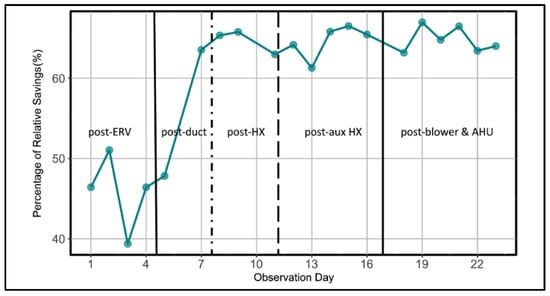
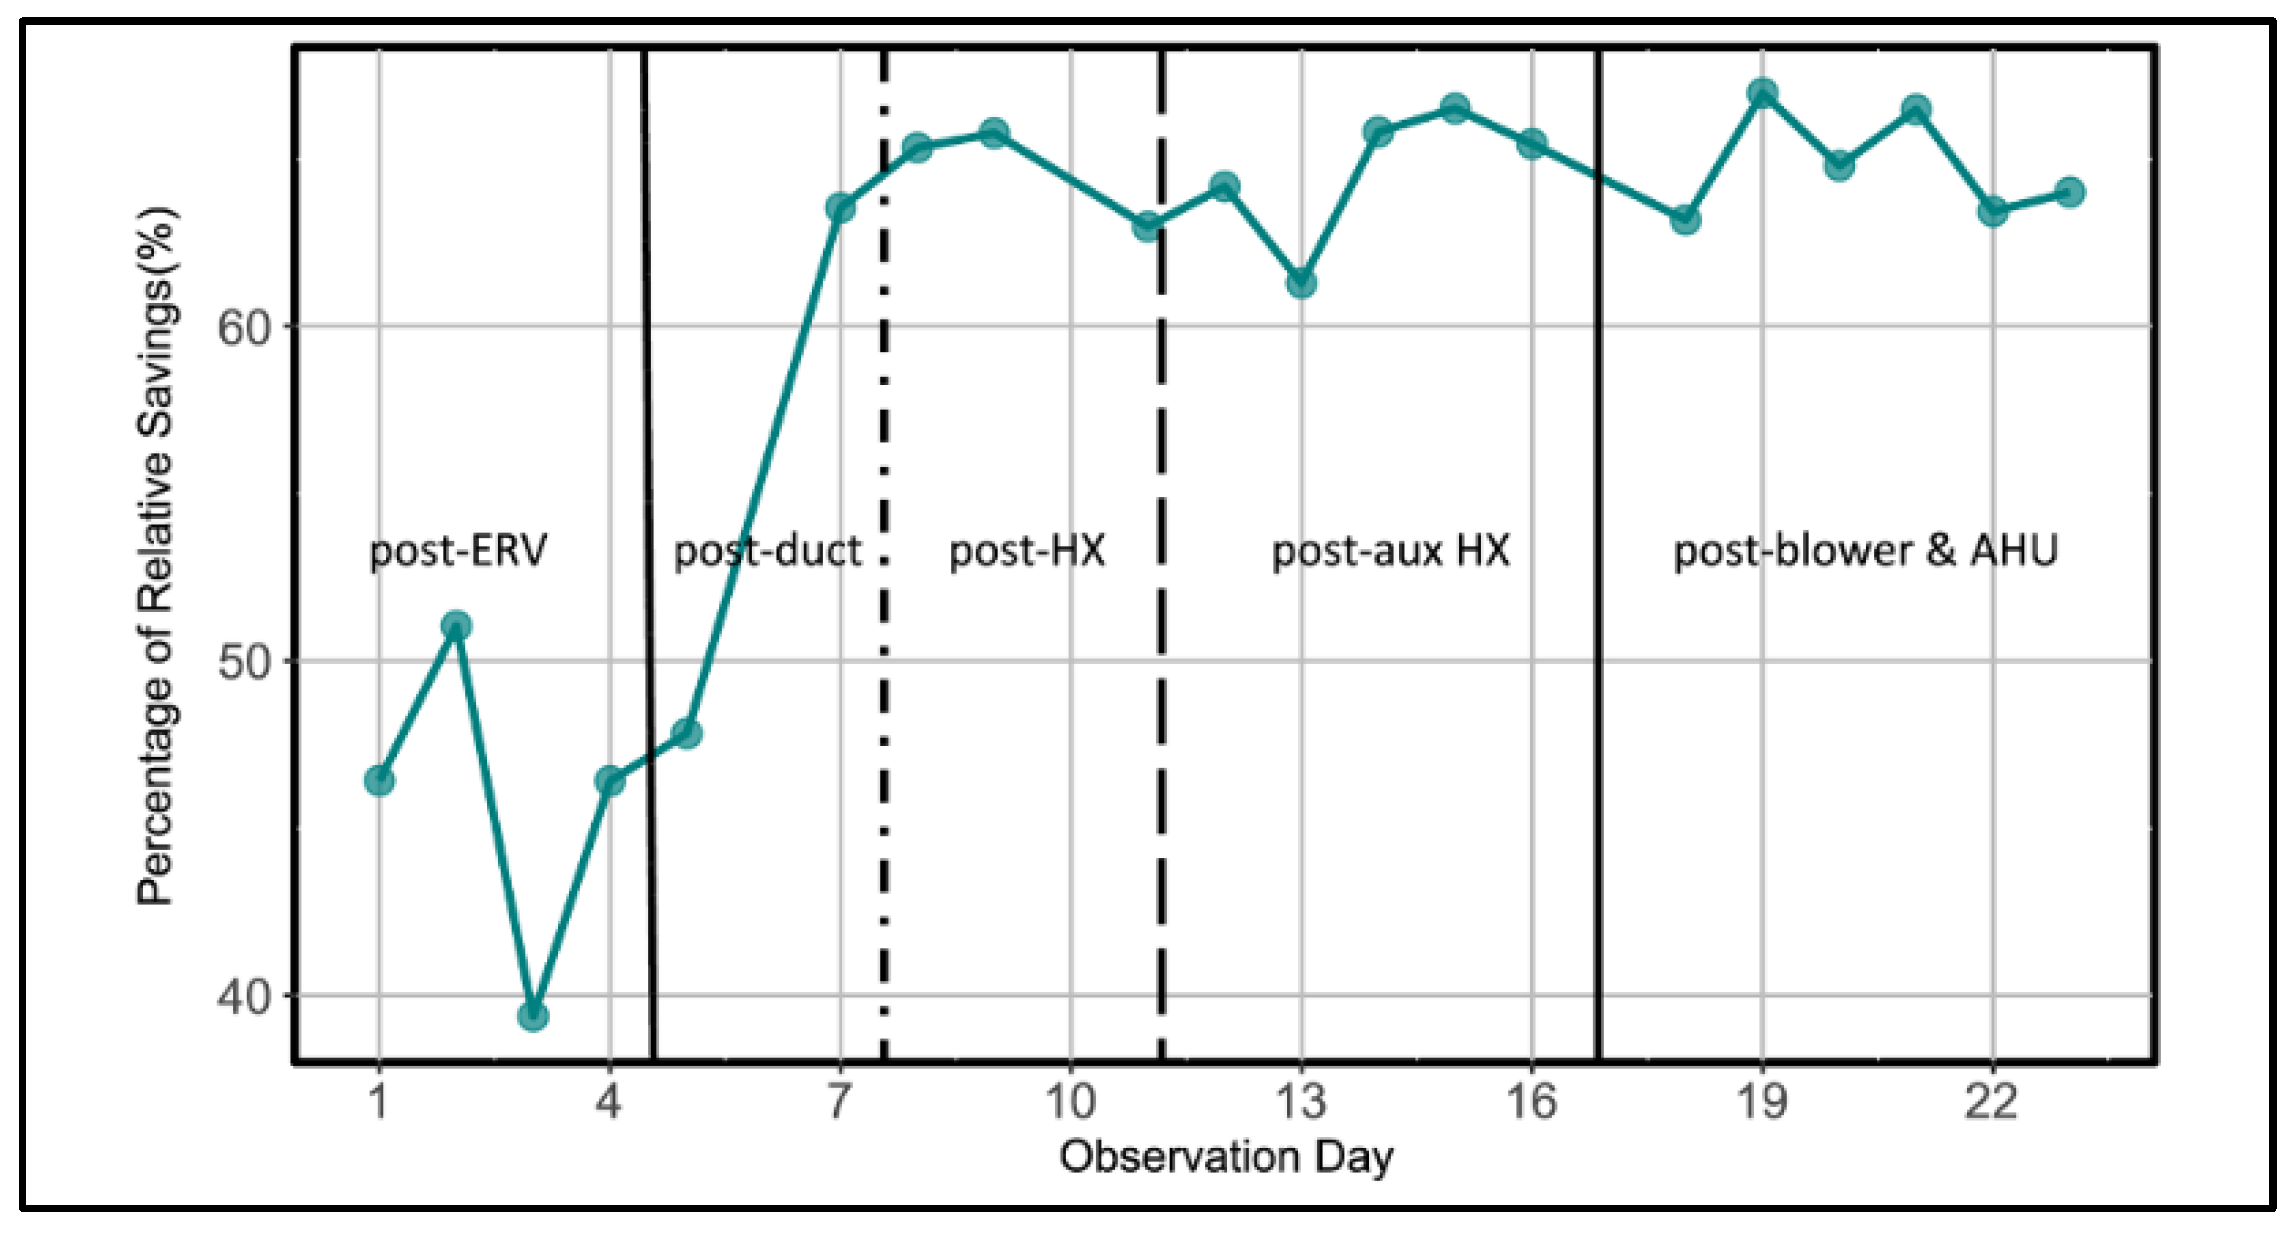
The contamination of air ducts with dust, biological agents, and chemical residues causes an increase in aerodynamic resistance, forcing fans to operate at higher speeds and pressures. A recent large-scale field study conducted by the National Air Duct Cleaners Association (NADCA) across buildings in four different climate zones found that the professional cleaning of HVAC systems reduces energy consumption for fans and blowers; see Figure 3. The percentage of relative energy savings after cleaning in different stages [15] is 41–60%, while improving air delivery by 10–46% (Figure 3).
Figure 3.
Percentage of relative energy savings after cleaning in different stages [15].
At the national level in Bulgaria, this problem is particularly relevant due to the intensive development of office and retail premises after 2000. According to data from the ODYSSEE-MURE project, the total energy consumption in the building sector of Bulgaria increased from 2.8 million tons of oil equivalents (Mtoe) in 2000 to 3.3 Mtoe in 2023 (an increase of 20%, or an average of 0.8% per year). In the services sector (including offices and public buildings), consumption grew by 76% over the same period—from 0.66 Mtoe to 1.2 Mtoe [16]. In this context, HVAC systems in both new and renovated buildings often operate without sufficient maintenance, resulting in higher energy costs and non-compliance with the EU Energy Performance of Buildings Directive (EPBD). Beyond energy losses, the contamination of air ducts substantially degrades indoor air quality (IAQ). Accumulated dust, mold, bacteria, and volatile organic compounds (VOCs) can spread throughout the premises and are associated with Sick Building Syndrome (SBS). According to a meta-analysis [17], SBS symptoms—such as headaches, fatigue, mucous membrane irritation, and respiratory issues—are reported in approximately 20–30% of office buildings worldwide.
There are no large-scale national studies on the direct relationship between air duct contamination and health or energy performance in Bulgaria. However, EU data show that poorly ventilated buildings contribute to approximately 15% of occupational respiratory diseases [18]. The relevance of this issue is further enhanced by climate change, as the increasing demand for cooling during the summer months increases the load on HVAC systems and the risk of pollution.
1.2. Brief Overview of Existing Standards
International and European standards set clear requirements for the cleanliness of ventilation systems. The European standard EN 15780:2025 (“Ventilation for buildings—Ductwork—Cleanliness of ventilation systems”) defines three classes of cleanliness (low, medium, high) according to the building. The introduction of the standard emphasizes that the “cleanliness of ventilation systems is considered important for human comfort and health, energy consumption, system service life and for fire safety” [19]. The standard introduces limits for accumulated dust (g/m2) and methods for inspection and cleaning.
The American standard ASHRAE 180-2018 (“Standard Practice for Inspection and Maintenance of Commercial Building HVAC Systems”) requires the periodic inspection and cleaning of air ducts: “HVAC systems shall be inspected and maintained to ensure proper operation and to minimize energy consumption and IAQ problems” [20]. The standard recommends visual and microbiological assessments at least once every 1–3 years, depending on the level of risk. ISO 16890:2016 (“Air filters for general ventilation”) replaces the older MERV classifications with PM1, PM2.5, and PM10, directly linking filtration efficiency to outdoor air pollution. In Bulgaria, these standards have been transposed through BDS EN 15780 and are applied in the design and operation of new buildings under Regulation No. 7/2004 [21] and Directive 2018/844/EU (EPBD) [22].
Additional guidance is provided by standards such as VDI 6022 (Germany) [23] and NADCA ACR-2021 (USA) [24], which emphasize the use of robotic cleaning, as well as the tracking and validation of cleaning results.
1.3. Aim and Scientific Contributions
The aim of this study is twofold:
- −
- To synthesize the latest international evidence on HVAC duct contamination and its quantified effects on energy use and IAQ;
- −
- To develop and validate a practical MCDA-based ranking of inspection methods, supported by preliminary local data from Bulgaria.
The main scientific contributions are as follows:
- −
- The systematic integration of contamination mechanisms with multi-climate field evidence [15];
- −
- The first application of transparent weighted-sum MCDA (with expert-elicited weights, score justifications, and sensitivity analysis) to rank ten HVAC inspection methods;
- −
- A preliminary Bulgarian case study demonstrating real-world applicability and energy savings.
2. Types and Mechanisms of Ventilation Duct Contamination
The contamination of ventilation ducts in HVAC systems is a complex process in which various contaminants accumulate on the internal surfaces of ducts, filters, heat exchangers, and fans. This accumulation leads to increased aerodynamic resistance, the deterioration of indoor air quality (IAQ), and potential health and energy-related risks. Contaminants are classified into three main groups—physical, biological, and chemical—and their accumulation depends on a combination of operational, structural, and climatic factors.
2.1. Physical Contaminants
Physical contaminants are the most common and include dust, mineral particles, fibers, pollen, soot, and particulate matter (PM) of various sizes—from PM10 to ultrafine particles (<0.1 μm). They come mainly from the outdoor air through insufficiently effective filters, from construction debris during installation, or from the recirculation of indoor air.
According to the AIVC review report [25], “particulates are deposited in ventilation ductwork. If the process is continuous, particulates could build-up within the ventilation system to such an extent that system performance becomes impaired”. Measurements show surface dust densities from 1.10 to 140.8 g/m2 (mean 6.8–18.2 g/m2), with annual deposition rates of between 0.51 and 12.8 g/m2. In concrete ducts (TermoDeck) at velocities below 1 m/s and EU3 filtration, deposition is about 2 g/m2 per year.
The mechanisms of particle deposition include gravitational settling (for particles >10 μm at low air velocities), inertial impaction at bends, and diffusional deposition for fine PM. Lower air velocities (<2.5 m/s) increase deposition, while high turbulence at bends and filters accelerates the accumulation of coarse particles. In ventilation systems with low filtration efficiency (MERV < 8 or EU3), dust accumulates up to three times faster compared to systems equipped with EU7 filters. The EPA [26] emphasizes that “much of the dirt in air ducts adheres to duct surfaces and does not necessarily enter the living space”. However, when excessive accumulation occurs, particles may become resuspended and subsequently spread throughout indoor spaces.
2.2. Biological Contaminants
Biological contaminants thrive on accumulated dust, which provides a favorable growth medium, especially in the presence of moisture. The main components include bacteria (Staphylococcus spp., Pseudomonas spp., Micrococcus), fungi (Penicillium, Aspergillus, Cladosporium, Alternaria), viruses, and endotoxins (lipopolysaccharides produced by Gram-negative bacteria).
A review study [27] notes that “filters, heat exchangers (e.g., cooling coil and evaporative condenser), and ventilation ducts are the common components of microbial contamination because their environmental conditions are suitable for their survival and growth”. Penicillium species predominate in air ducts (accounting for up to 63% of isolates), while cooling coils often harbor bacterial biofilms, reaching concentrations of 105–106 CFU/cm2. Fungal spore concentrations have been reported to range from 79 to 6200 CFU/g in air ducts and from 70 to 3400 CFU/g in filters.
Growth mechanisms include adhesion to the dust layer and colonization at RH > 75% and temperatures of 15–40 °C (optimally 19–30 °C for Penicillium and Aspergillus). The dust on ventilation ducts offers sufficient nutrients for fungal growth if moisture is available [28].
2.3. Chemical Pollutants
Chemical pollutants include volatile organic compounds (VOCs), ozone, and formaldehyde, which can be generated or transformed in the ventilation system itself. The main sources include reactions between ozone from the outdoor air and organic materials in filters or ducts, as well as emissions from sealants, insulation materials, and cleaning products.
A study [29] reported that “reaction with ozone and with water vapour (hydrolysis) as air flows through particle filters can constitute a small, albeit measurable, source of formaldehyde and other indoor pollutants”. Under high-humidity conditions (80% RH), formaldehyde concentrations increase by 4–6 μg/m3 when air passes through fiberglass filters—levels comparable to typical concentrations found in office environments. Morrison et al. in [30] demonstrated that ozone reacts with duct and sealant materials, releasing aldehydes (formaldehyde and acetaldehyde). VOCs originate from building materials, cleaning agents, and recirculated air; inside ducts, they can adsorb onto dust particles and later desorb when the temperature or humidity changes.
Ozone (originating from outside air or ozone-generating devices) can decompose on filter surfaces, but it also generates secondary pollutants. A study notes, “Exposure to ozone increased the emission rates of aldehydes from a duct liner, duct sealing caulk, and neoprene gasket” [30].
3. Impacts on Aerodynamic Performance and Electricity Consumption
The contamination of air ducts and related components in HVAC systems leads to significant changes in aerodynamic performance and increased electricity consumption. The accumulation of dust and biological and chemical contaminants increases air flow resistance, reduces the efficiency of fans and heat exchangers, and generates additional operating costs.
3.1. Increase in Aerodynamic Resistance and Pressure Drop Losses
The accumulation of dust, fibers, and biological deposits on the inner walls of air ducts reduces the effective cross-sectional area and increases the surface roughness. This leads to a significant increase in aerodynamic resistance and static pressure losses in the entire ventilation system. According to the empirical model developed in [31], “The accumulation increases the flow resistance of the air duct and changes the airflow through, and pressure drop across, the duct in accordance with the controls of the fan rotational speed”. This increased resistance forces the fans to generate higher static pressure to maintain the design air flow rate, which directly leads to increased electricity consumption. In simulations with EnergyPlus, even moderate contamination (fault intensity 20–30%) leads to a measurable increase in pressure drop.
3.2. Impacts on Electricity Consumption and Heat Transfer
When pressure drop increases, fans must generate higher pressure to maintain the design airflow rate, which directly increases electrical energy consumption. At the same time, contamination acts as a thermal insulation layer on heat exchangers, reducing the heat transfer coefficient.
These quantitative relationships are well documented in the literature. A one-year comparative study [32] found that regular cleaning leads to energy savings ranging from 16.2% to 71.4%. Heat exchange efficiency improved by 15–25%, while air flow velocities increased by up to 12%.
A classic study [33] shows that typical cooling coils accumulate sufficient contamination to double the pressure drop within approximately 7.5 years under standard work conditions. This results in reduced airflow and, consequently, increased fan energy consumption and a decline in the overall efficiency of the system. These findings confirm that even moderate contamination (above 1–2 g/m2) leads to measurable energy losses of 15–30%, while heavy contamination can increase fan energy consumption by more than 50%. In real office and industrial buildings, this may translate into a 20–60% increase in annual electricity costs.
3.3. Modeling and Simulations (CFD, EnergyPlus, Empirical Relationships) and Comparisons with Standards
Advanced modeling approaches are widely used to quantitatively predict the effects of contamination in HVAC systems. Computational modeling techniques such as computational fluid dynamics (CFD) enable detailed analysis of local changes in airflow and heat transfer. In a study [34], it is shown that the presence of a fouling layer with a thickness of 1.55 mm can reduce the local Nusselt number (convective heat transfer coefficient) by up to 50 times in affected areas, while the wall temperature may increase by as much as 130 K. CFD simulations clearly demonstrate that dust accumulation in bends and constrictions increases turbulence and local aerodynamic resistance.
EnergyPlus and similar tools for the dynamic energy modeling of buildings integrate empirical fouling factors. They introduce an additional resistance (k-factor or fouling resistance Rf) that depends on the dust weight (g/m2). Models show that, when exceeding 3 g/m2 in supply ducts, the annual fan consumption can increase by 25–45% depending on the climate and operating mode. Combining EnergyPlus with CFD (co-simulation) gives the most accurate results, taking into account the resuspension of particles.
Empirical relationships usually follow the modified Darcy–Weisbach equation, where the friction coefficient f increases with increasing relative roughness (ε/D) due to the accumulated dust [35]:
where:
- —frictional pressure drop, ;
- —Darcy friction factor;
- —absolute wall roughness, m—starts at 0.05–0.15 mm for clean smooth metal and can grow to 1–10 mm or more with heavy dust;
- —hydraulic diameter, m;
- —length of duct or airway, m;
- —fluid (air) density, kg·m−3;
- —mean fluid velocity, m·s−1;
- —Reynolds number ;
- —dynamic viscosity of the fluid, .
The Darcy factor is no longer constant—it increases continuously because dust deposits on the inner walls raise the absolute roughness , which in turn increases the relative roughness .
is obtained from the Colebrook equation (or Moody chart):
The greater the value of , the larger becomes (especially in the fully turbulent regime).
Practical consequences are as follows:
Clean duct (start of operation): low → low → low losses.
After months/years of dust accumulation: much higher → significantly higher → frictional losses often 2–5 times greater (or more).
3.4. Comparison with Standards
The European standard EN 15780:2011 (and the updated version for 2025) defines clear limit values for acceptable dust accumulation according to the cleanliness class:
- −
- High cleanliness (hospitals, clean rooms): <0.6 g/m2 for supply ducts;
- −
- Medium cleanliness (offices, public buildings): <3.0 g/m2;
- −
- Low cleanliness: <4.5 g/m2.
Exceeding these values leads to unacceptable increases in energy losses. The American standard ASHRAE 180-2018 recommends periodic inspection and cleaning precisely to prevent excessive static pressure increases and maintain the design flow rate. Thus, the EN 15780 and ASHRAE 180 standards directly link the amount of dust (g/m2) to the permissible energy losses, recommending cleaning when the limits are exceeded.
3.5. Economic Aspects (Return on Investment from Cleaning)
The cleaning of contaminated air ducts and HVAC components is one of the fastest returnable investments in building management, with an emphasis on the direct reduction of operating costs for electricity. The return on investment (ROI) is calculated by the formula
Meanwhile, the payback period is calculated by the formula
According to the classic NADCA study [36], cleaning lightly contaminated systems leads to 11% energy savings for heating and cooling, which, with average annual HVAC costs in an office building of EUR 20,000–50,000, generates EUR 2200–5500 per year. With an investment of EUR 3000–8000 (typical for public/office buildings in Bulgaria), the payback period is less than 2 years, and the ROI is over 30–70% per year.
A real case study confirms the payback period of less than 2 years described in [37]—cleaning coils and air ducts results in a 6.7% total reduction in energy costs—namely USD 21,000 per year. With optimization, this reaches up to USD 46,000.
Additional benefits—extending the life of fans by 20–30% [38,39], reducing breakdowns, and lowering CO2 emissions [40]—increase the total ROI to over 100% over a 5-year horizon. In the Bulgarian context (high relative energy costs in public buildings and upcoming EPBD requirements), cleaning becomes a strategic investment with an extremely fast and measurable financial effect. Routine implementation (every 3–5 years) provides a sustainable ROI of over 40–60% per year with almost zero risk [41].
4. Methods for Assessment, Monitoring, and Cleaning
The assessment of air duct contamination is a mandatory step to determine the need for cleaning and to verify its effectiveness. International standards (NADCA ACR, 2021; EN 15780:2011) recommend a combined approach of visual, quantitative, microbiological and aerodynamic methods.
4.1. Inspection and Diagnostics
The most common inspection and diagnostic methods are described in detail below, with special attention paid to methods for determining the degree of contamination.
4.1.1. Visual Inspection
This is a basic and mandatory method. It is recommended to inspect at least 10% of the system (AHU, main ducts, terminals) annually by means of mirrors, borescopes, endoscopes, or robotic cameras. The surface is considered “visibly clean” when it is free of non-adherent dust, fibers, biofilms, or other contaminants [42]. In case of doubt, quantitative methods are used.
4.1.2. Methods for Determining the Degree of Contamination (Surface Dust Loading) as the Main Quantitative Indicator (Mass of Deposited Dust in g/m2 or mg/100 cm2)
- A.
- Vacuum Sampling Method (Gravimetric Vacuum Test)
This is the most widely accepted objective gravimetric method. The dust is collected from an area of 0.01 m2 (EN 15780) or 100 cm2 (NADCA) with a calibrated pump (15–17 L/min). The result is weighed in the laboratory. Limits according to EN 15780 (supply ducts) are as follows:
- High class: <0.6 g/m2;
- Medium class: <3.0 g/m2;
- Low class: <4.5 g/m2; after cleaning: <0.3 g/m2;
- For extract ducts, cleaning at >9.0 g/m2 [19].
- B.
- Adhesive Tape/Gel Tape Method
An adhesive or gel tape is pressed to the surface and weighed/analyzed optically. This is suitable for low levels (0.1–4 g/m2) and porous surfaces [43].
- C.
- Optical Inspection with Digital Image Processing from a HD Camera
This involves a HD camera (borescope/robot) combined with algorithms (thresholding, CNN, k-means clustering). It estimates the % dust coverage, which, after calibration, gives an approximate value in g/m2. It is fast and non-invasive [44].
Aerodynamic Methods
- D.
- Pressure Drop Measurement ()
This provides the static pressure drop (Pa) before/after a section is measured with a pressure gauge or IoT sensors. An increase of >15–25% signals contamination (EN 15780).
- E.
- Airflow Reduction Method
This is an indirect performance-based approach. The actual airflow (m3/h or m/s) is measured by means of an anemometer, flow hood, or pitot tube and compared to the design/initial value. Criteria according to EN 15780 include cleaning when the airflow reduction ≥15% (especially for extract ducts) or is combined with dust loading >9.0 g/m2. After cleaning, a recovery rate of 10–46% is reported (ref. [42]; studies show an improvement of 10–46% after cleaning). This directly correlates with the energy losses of the fans.
Other HVAC Duct Inspection Methods
- F.
- Deposit Thickness Test (DTT)
This measures the thickness of deposits.
An electromagnetic sensor or wet film thickness gauge measures the average thickness of the dust layer. Limits (EN 15780 Annex H/TR19® Medium class) are as follows: supply > 60 μm = cleaning; extract > 180 μm. It is fast and objective.
- G.
- Surface Comparison Test (NADCA)
A contact HEPA vacuum with a brush is passed four times; the result is compared visually before and after. It is applicable to porous surfaces (fiberglass, insulation). The surface is considered “clean” if there is no visible difference (ref. [42], Method 2).
- H.
- Infrared Thermography
An IR camera registers temperature differences (ΔT ≥ 5–6 °C) on walls and ceilings. It detects hidden ducts, leaks, moisture, biofilms, and blockages without dismantling. It requires a working HVAC system.
- I.
- Acoustic Imaging
An acoustic camera visualizes sound waves in real time. It detects air leaks, loose connections, vibrations, and blockages. It is very fast and non-invasive.
A brief description and comparison of the methods for the inspection of the degree of contamination are presented in Table 1.
Table 1.
Comparison of inspection methods.
4.2. Ranking of HVAC Cleaning Inspection Methods Using Multi-Criteria Evaluation
Multi-criteria decision analysis (MCDA) is widely used in building engineering and energy system evaluation when several performance indicators must be considered simultaneously. In HVAC research, MCDA methods are frequently applied for technology selection and system performance assessment. For example, a study published in Buildings highlights the use of MCDA for HVAC system evaluation, stating “This paper presents an integrated approach of two powerful MCDM techniques… to evaluate and rank HVAC systems” [45]. In this context, MCDA enables the comparison of inspection methods using criteria such as reliability, cost, and inspection time. Similarly, research on building energy interventions explains that the weighted-sum MCDA method is widely used to compare alternatives: “The MCDA method used in this study is known as the weighted-sum method… used to evaluate environmental and building interventions” [46]. Therefore, MCDA provides a structured approach for evaluating HVAC inspection techniques based on multiple technical and operational criteria.
The following criteria reflect the main factors influencing inspection method performance:
- Reliability determines the accuracy of contamination assessment;
- Applicability reflects feasibility in complex duct networks;
- Inspection time affects operational efficiency during maintenance;
- Cost efficiency impacts practical implementation;
- Diagnostic capability allows the detection of additional system defects.
In MCDA frameworks, assigning weights to criteria is necessary to represent their relative importance in decision-making. Studies evaluating energy systems emphasize that criteria weights directly influence the ranking results and therefore must be carefully determined [47].
Criterion weights were established by the authors using a systematic, literature-informed weighting methodology widely employed in building engineering MCDA research. The prioritization of criteria was guided directly by the principles outlined in EN 15780:2025 and NADCA ACR-2021, both of which underscore that an objective and reliable evaluation of contamination levels is essential for ensuring regulatory compliance, safeguarding health, and verifying energy performance. Accordingly, measurement reliability was assigned the highest weight (0.35). The remaining portion (0.65) was allocated across the four operational criteria, with values adjusted to 0.20/0.15/0.15/0.15 for practical implementation. This weighting framework ensures that the resulting ranking is aligned with the fundamental requirements of the standards rather than being influenced by subjective opinion.
The final weights are shown in Table 2. Method scores (1–5 scale) were assigned by the research team based on a systematic review of the peer-reviewed literature and the technical specifications given in the referenced standards (see Table 3 for detailed justification and supporting references).
Table 2.
Criteria, descriptions, and final weights.
Table 3.
Justification of MCDA scores (literature-based).
The WSM calculates the overall score of each alternative as the sum of the weighted criterion scores:
where
- —total score of inspection method i;
- —weight of criterion j;
- —score of alternatives i for criterion j.
The evaluation matrix is presented in Table 3.
Table 4.
Evaluation matrix results.
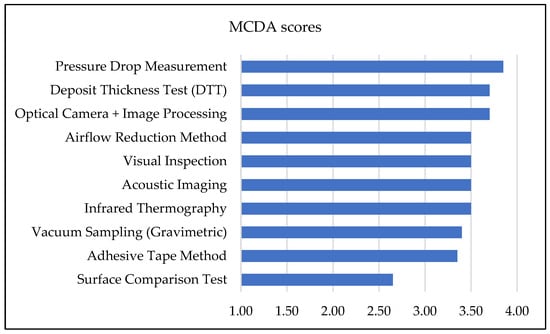
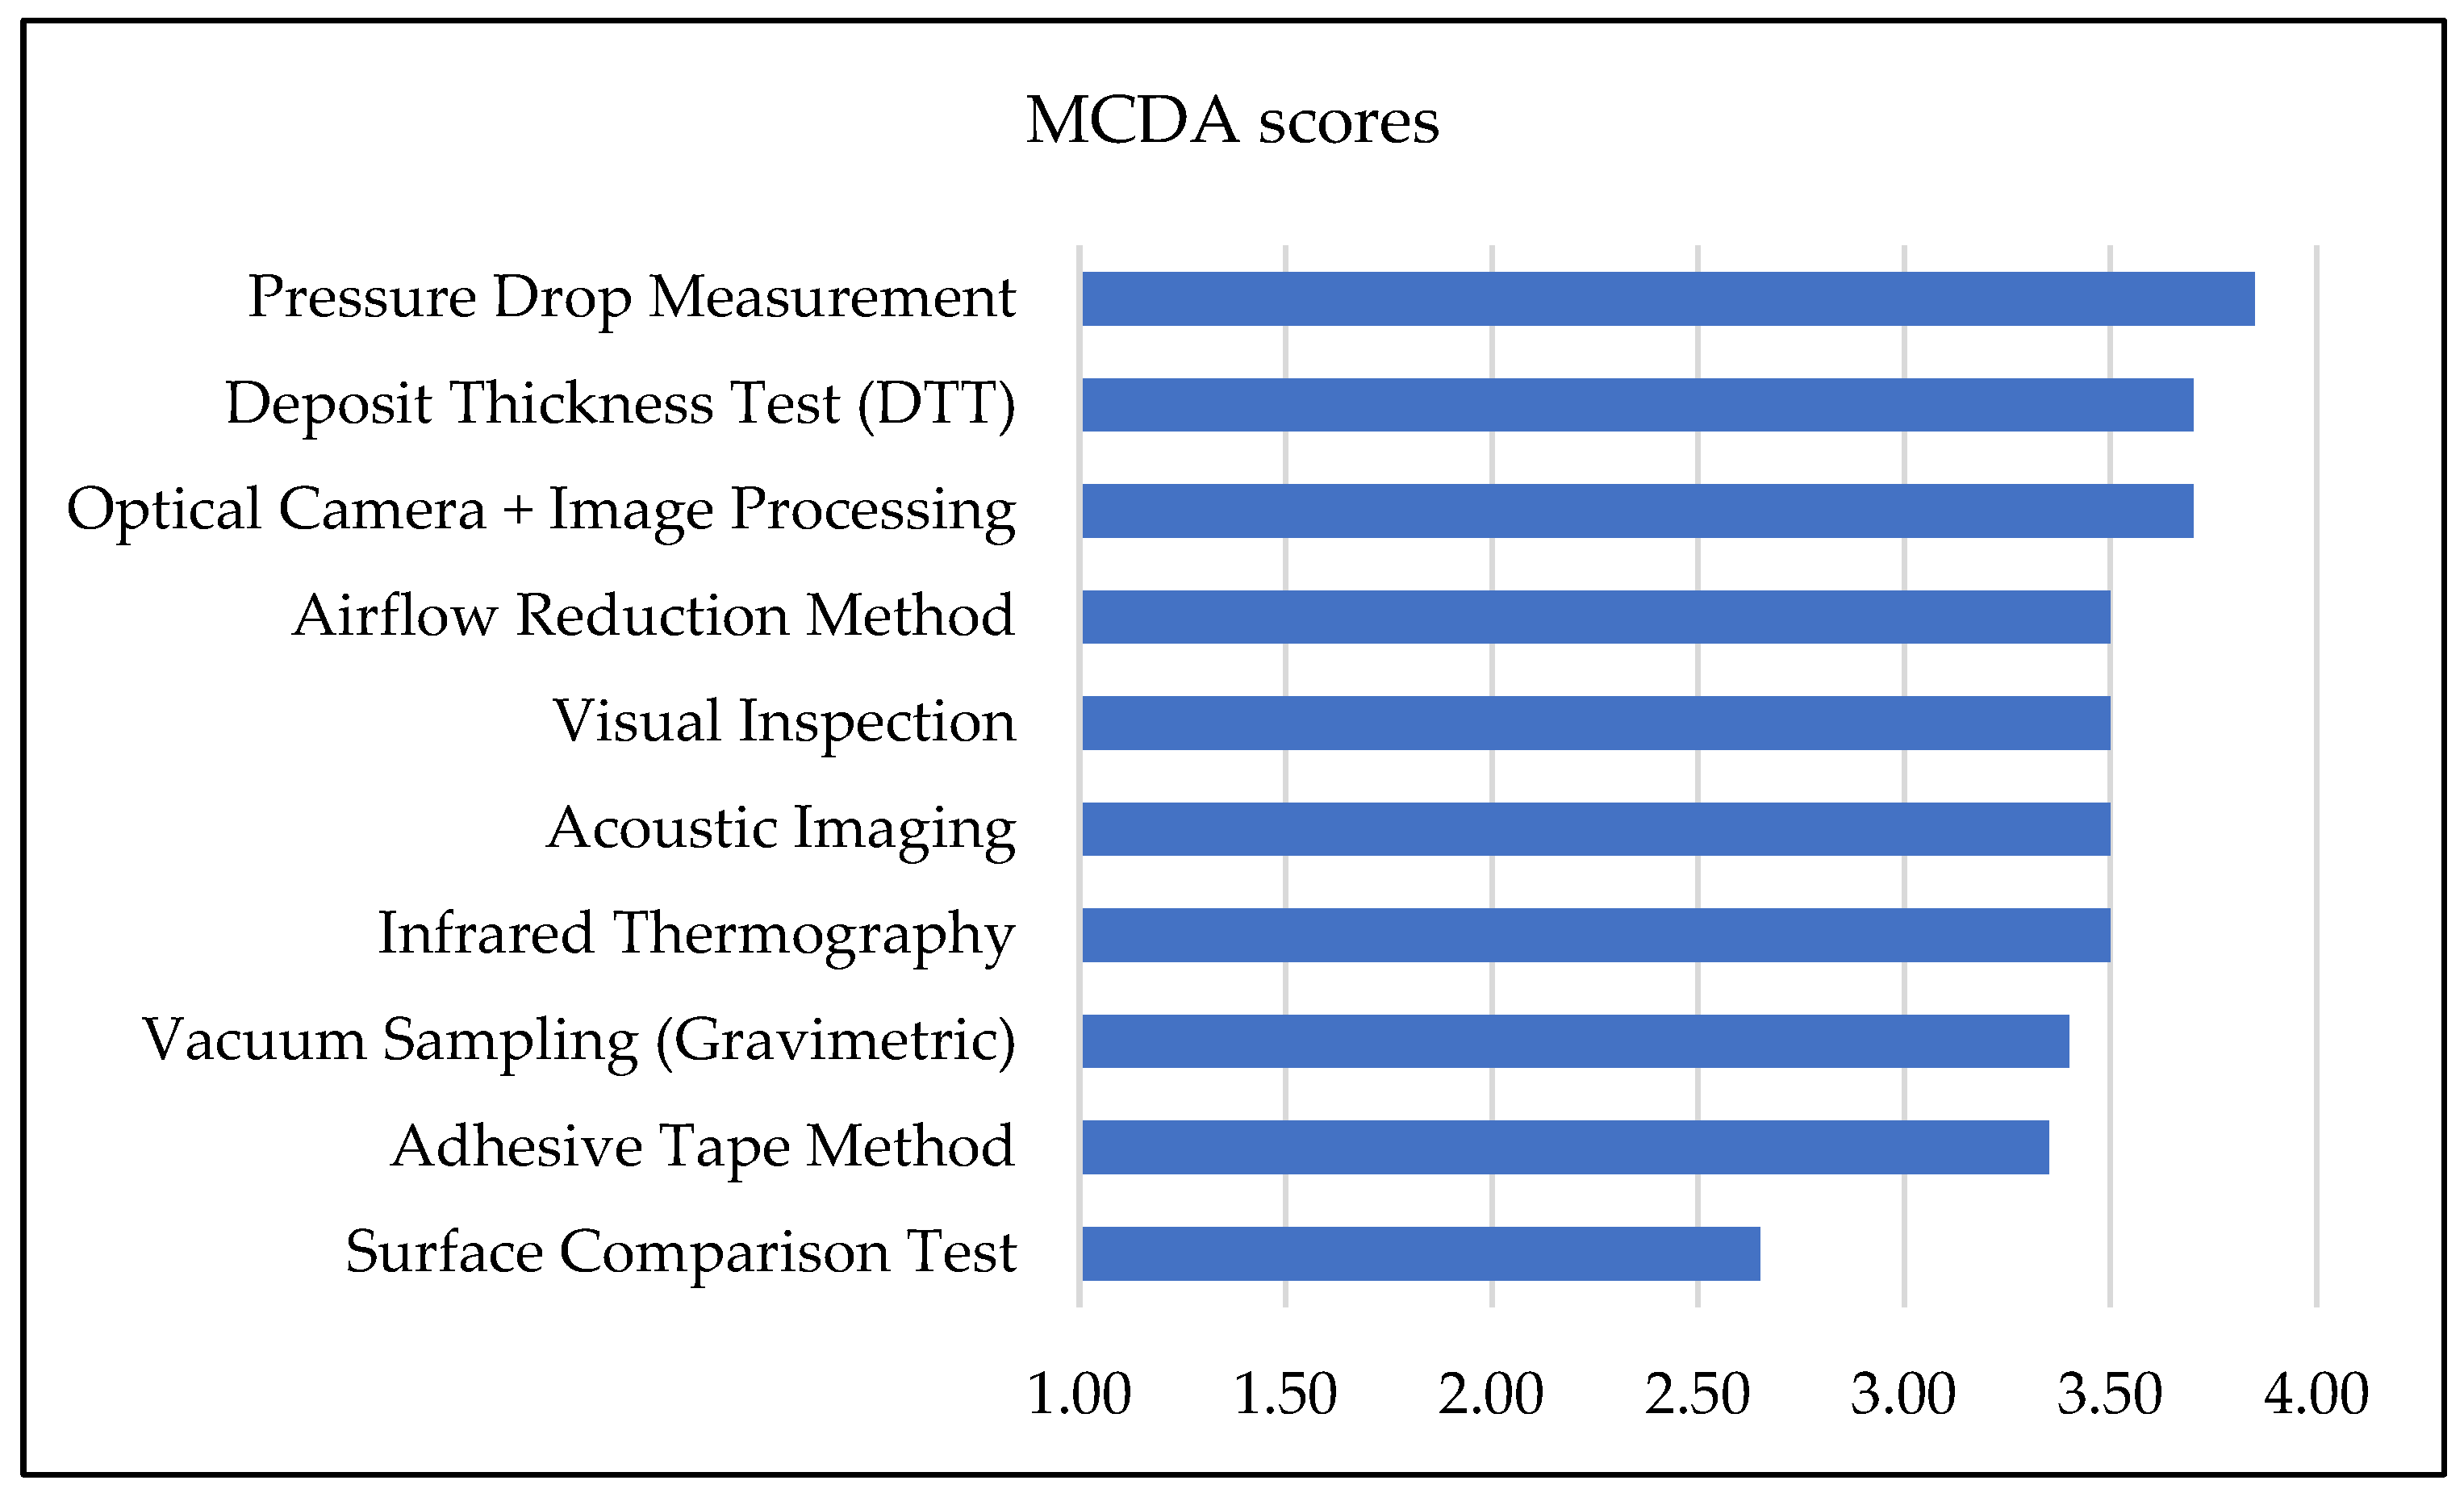
Figure 4.
Weighted MCDA scores of the ten HVAC duct inspection methods.
The results demonstrate that no single method fully satisfies all evaluation criteria, which confirms the conclusions of previous HVAC decision studies.
Multi-criteria evaluation approaches are suitable in order to compare technologies with different characteristics.
Pressure drop measurement, optical camera inspection, and the deposit thickness test have the highest scores due to their balance between reliability, inspection speed, and practical applicability.
Quantitative methods such as vacuum sampling provide the highest measurement accuracy but require laboratory analysis and longer inspection times. They are typically used for regulatory verification. Diagnostic methods such as infrared thermography and acoustic imaging offer strong capabilities for detecting leaks and moisture problems but are less suitable for direct dust quantification.
Sensitivity Analysis
A one-at-a-time sensitivity analysis was performed by varying each criterion weight by ±10% and ±20% (20 scenarios in total), with the remaining weights renormalized to sum to 1.0. In every scenario, pressure drop measurement remained the highest-ranked method, while optical camera inspection with image processing and the deposit thickness test consistently occupied the second and third positions. The top three (pressure, optical, DTT) were always the same. The ranking proved completely stable even under extreme ±20% weight changes. These results confirm that the recommended methods are highly robust and insensitive to moderate uncertainty in criterion weighting.
4.3. Preliminary Bulgarian Case Study
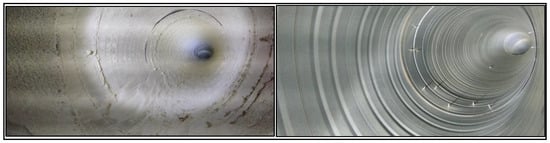
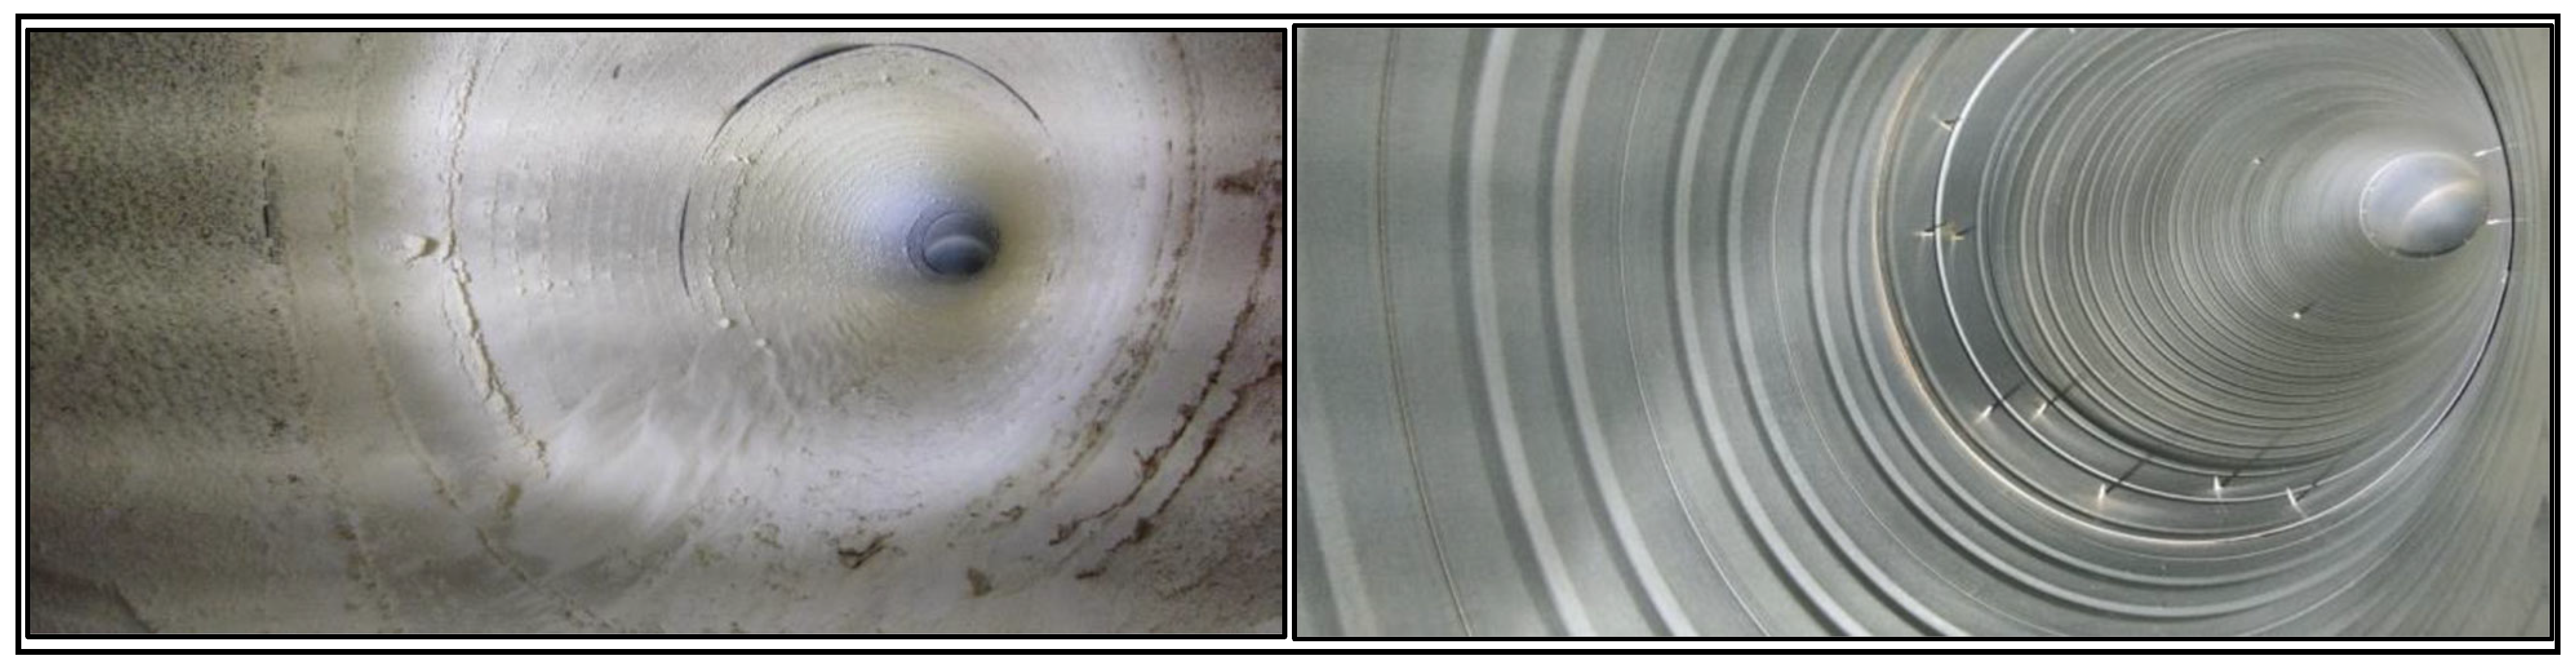
To provide local evidence, a preliminary inspection was conducted in a production factory in Bulgaria (constructed in 2018, medium cleanliness class per EN 15780). Optical camera inspection and pressure drop measurement (top-ranked methods) revealed a supply-duct dust loading of 11.2 g/m2 (Figure 5, left), exceeding the 3.0 g/m2 limit, and a 50 m duct-section pressure drop of 175 Pa (design value 110 Pa). After robotic mechanical cleaning (Figure 5, right), the pressure drop fell to 112 Pa. The frequency of the drives was reduced from 50 Hz to 40 Hz, which resulted in an approximately 20% decrease in fan rotational speed, given the near-linear relationship between the supply frequency and motor speed in induction machines. According to the fan affinity laws, this reduction led to a cubic decrease in power consumption. As a result, at 80% of the nominal speed, the electrical power demand decreased significantly to about 51% of the power demand before cleaning. This corresponds to an overall energy saving of approximately 49%.
Figure 5.
Before (left) and after (right) optical inspection photos of the same duct section.
4.4. Modern Cleaning Technologies
4.4.1. Mechanical Duct Cleaning
Mechanical cleaning remains the most widely used method for removing contaminants from air ducts. One of the most advanced approaches within this category is the use of robotic systems. These are remotely controlled or semi-autonomous devices equipped with cameras, rotating brushes, vacuum systems, and inspection sensors. Such robots can move through both horizontal and vertical ducts and clean areas that are difficult for operators to access. The main advantages of robotic systems include improved precision, the possibility of visual inspection before and after cleaning, and increased operational safety. Robots remove dust, biofilms, and other deposits through mechanical agitation, followed by vacuum extraction of the loosened particles. According to the National Air Duct Cleaners Association, robotic systems significantly improve the cleaning efficiency and enable the detailed inspection and documentation of duct conditions [48].
Research also shows that telerobotic systems can successfully automate duct inspection and cleaning, reducing risks for workers while improving the efficiency of maintenance operations [49].
However, there is a risk that robots may become stuck inside ducts when encountering obstacles such as mounting studs or structural elements or if their batteries become low.
For this reason, the most common cleaning technique remains mechanical brushing by means of long-range rotating brushes (up to 30 m). Such brushes are used to loosen contaminants, while the dislodged material is removed using vacuum extraction under negative pressure. The extracted dust is collected in filter bags, typically using filtration systems with efficiency of up to 99.97% at 0.3 µm (F7 and HEPA filters).
4.4.2. Chemical Cleaning and Disinfection
Chemical cleaning involves the use of specialized agents such as disinfectants, biocides, and detergents that break down organic contaminants, grease, and microbial biofilms on the internal surfaces of air ducts. This method is typically applied after mechanical cleaning and aims to eliminate bacteria, molds, and other microorganisms that may remain in the system.
Common techniques include aerosol spraying, foaming, and fogging of disinfectants within the ducts. However, international standards recommend that chemical products be used cautiously and only when necessary in order to avoid residual chemical contamination in the ventilation system.
The NADCA Standard [ACR2025] requires a prior system assessment and recommends the use of chemical agents only when microbiological contamination has been confirmed.
4.4.3. Cryogenic (Dry Ice) Cleaning
Cryogenic cleaning is a relatively new technology that uses granules of dry ice (solid CO2) accelerated by compressed air. The particles are directed at contaminated surfaces inside the ducts. Upon impact, the dry ice sublimates (transitions directly from a solid to a gaseous state), generating micro-explosive effects that loosen and remove deposits from the surface. The main advantages of cryogenic cleaning include the absence of secondary waste (CO2 sublimates into gas); minimal moisture introduction into the system; high efficiency in removing grease and biological deposits; and reduced risks of corrosion or chemical damage to surfaces. This method is particularly used in industrial environments and food-processing facilities, where strict hygiene requirements apply and contaminants may be persistent. Nevertheless, the technology also has several limitations. These include the potential risk of surface damage, the limited working time of dry ice pellets (typically less than 24 h), higher equipment investment costs, and the need for adequate ventilation due to the increased concentration of carbon dioxide during operation [50]. All cleaning procedures must be performed under controlled negative pressure and appropriate containment conditions (level 1–4) in order to prevent secondary contamination of the indoor environment [51].
5. Prevention and Mitigation Strategies
The prevention and mitigation of duct contamination is a key element in maintaining the optimal aerodynamic performance of HVAC systems, reducing energy consumption, and protecting occupant health. Strategies include design, operational, technological, and regulatory measures based on the hierarchy of controls (source control → engineering controls → administrative controls).
5.1. Design Solutions
It is critical to integrate solutions that prevent the accumulation of contaminants at the design stage. The implementation of multi-stage filtration according to ISO 16890 or ASHRAE Standard 52.2 is key—coarse pre-filters (MERV 8–10) and high-efficiency final filters (MERV 13–14 or HEPA for sensitive environments). These filters reduce the penetration of PM and biological and chemical contaminants into the ducts, while limiting the need for high ventilation rates and saving energy for fans.
According to the systematic review in [52], high-efficiency filters (MERV 13+) in combination with ultraviolet germicidal irradiation (UVGI) in ducts enable the effective disinfection of bioaerosols without a significant increase in pressure.
It is important to provide easy-access doors for inspection and cleaning through standard access panels and cleanouts (according to EN 12097 and ASHRAE 62.1), as well as external insulation of the ducts to avoid condensation and microbial growth. The CDC recommends a minimum distance of air intake from sources of contamination (>7.6 m from outlets) and positive pressure in the building to prevent infiltration. These design measures can reduce contamination accumulation by up to 70–90% in the initial years of operation.
5.2. Operational Management and Maintenance
Regular maintenance is the most effective operational strategy to minimize the impact. The US Occupational Safety and Health Administration emphasizes the need for a written preventive maintenance program (HVAC Maintenance Checklist), including monthly inspections of filters, cooling coils, and drain pans and semi-annual visual inspections of ducts for dust and microbes.
It is recommended to replace filters when ΔP > 2–3 times the initial value is reached and to clean ducts when the thickness of deposits exceeds the acceptable level of contamination according to EN 15780.
According to the US Centers for Disease Control and Prevention, routine cleaning and maintenance prolong the life of the system and prevent the spread of pathogens. The economic benefit is significant—regular maintenance leads to energy savings and increased labor productivity by reducing absenteeism due to SBS [53].
5.3. Intelligent Systems (IoT Monitoring, Predictive Cleaning)
Modern IoT-based systems enable a transition from reactive to predictive maintenance. Sensor networks (CO2, PM2.5/PM10, humidity, ΔP across filters) integrated into a building management system (BMS) via ZigBee/Wi-Fi and cloud platforms provide real-time data on the condition of ducts. Demand-controlled ventilation (DCV) automatically adjusts airflow according to occupancy, saving 10–30% of energy without compromising IAQ [52].
Predictive models (based on machine learning) predict pollution accumulation and recommend optimal cleaning intervals, reducing unnecessary interventions [54]. Examples from the literature show that IoT monitoring reduces energy losses from clogged filters by up to 20% and IAQ complaints by 60–80% [55]. These systems are particularly effective in office and industrial buildings with variable occupancy [56].
5.4. Regulatory and Economic Incentives
In the EU and Bulgaria, preventive measures are supported by Directive 2010/31/EU (EPBD) and national regulations on energy efficiency and indoor air quality (e.g., Regulation No. 7/2006 on health requirements for indoor climate, among others). Standards such as EN 15780 and ASHRAE 62.1 serve as reference guidelines for cleanliness classes and maintenance practices.
Economic incentives include subsidies under programs such as “Energy Efficiency and Renewable Energy” (Bulgaria), LEED/BREEAM certification with benefits for IAQ, and tax incentives for green investments. Cost–benefit analyses indicate a return on investment (ROI) of 1–3 years for cleaning and preventive maintenance, driven by reductions in energy consumption (10–25%) and healthcare costs.
6. Conclusions and Future Perspectives
The contamination of air ducts in HVAC systems leads to a substantial increase in aerodynamic resistance (up to 30–50%), higher electricity consumption (10–40%), and the deterioration of indoor air quality.
This directly affects the health of building occupants, contributing to Sick Building Syndrome, respiratory illnesses, and reduced concentration, particularly in public, industrial, and office buildings.
Effective measures—such as multi-stage filtration, regular maintenance, and intelligent IoT-based monitoring systems—can mitigate these impacts by 20–70%, achieving both energy savings and improved occupant health.
In the Bulgarian context, where the majority of public, office, and industrial buildings have outdated ventilation infrastructure and high energy consumption, this issue is particularly acute.
Addressing this problem could result in significant electricity savings and directly support national energy efficiency goals, as well as the requirements of the European Green Deal.
Despite the accumulated knowledge, sufficient local data are still lacking. It is recommended to introduce mandatory periodic inspections and cleaning of air ducts into national legislation, as well as to encourage the adoption of intelligent monitoring systems through targeted subsidies.
Future research should focus on long-term field experiments in Bulgarian buildings, the development of localized CFD models, and detailed cost–benefit analyses that take into account actual energy tariffs and the climatic conditions in the country. Specifically, these studies should aim to collect the following technical data:
- −
- Long-term measurements (minimum of 12–24 months) of the thickness, amounts, and composition of deposits in air ducts;
- −
- Dynamics of differential pressure (ΔP) in ducts and filters;
- −
- Actual electricity consumption of fans (kWh and specific energy use);
- −
- Airflow rate, air velocity, and performance of fans and heat exchangers;
- −
- Operating parameters (humidity, temperature, operating hours, and types and intensity of building usage).
These data should be used to establish precise correlations and relationships between the following:
- −
- Thickness and types of contamination and increase in aerodynamic resistance (ΔP);
- −
- Increase in ΔP and actual rise in electricity consumption for different types of fans;
- −
- Rate of contamination accumulation and factors such as air velocity;
- −
- Relative humidity and filtration efficiency;
- −
- Behavior of systems in different building types (industrial, office, public);
- −
- Contamination rate and building’s location and/or intended use;
- −
- Outdoor temperature, indoor temperature, contamination level, and resulting excess electricity consumption of the system.
The resulting relationships should be validated through CFD simulations using real boundary conditions and used to develop more accurate predictive models (e.g., machine learning) to determine optimal cleaning intervals. In this way, a solid technical foundation can be established for the sustainable management of HVAC systems and the achievement of carbon neutrality by 2050.
Author Contributions
Conceptualization, K.M. and R.K.; methodology, R.K. and T.T.; software, R.K.; validation, K.M. and R.K.; formal analysis, T.T.; investigation, T.T.; resources, T.T.; data curation, K.M.; writing—original draft preparation, K.M.; writing—review and editing, T.T. and R.K. All authors have read and agreed to the published version of the manuscript.
Funding
This research was funded by the European Regional Development Fund within the OP “Re-search, Innovation and Digitalization Programme for Intelligent Transformation 2021–2027”, Project No. BG16RFPR002-1.014-0005 Center of competence “Smart Mechatronics, Eco- and Energy Saving Systems and Technologies”.
Institutional Review Board Statement
Not applicable.
Informed Consent Statement
Not applicable.
Data Availability Statement
The data presented in this study are available on request from the corresponding author due to confidentiality.
Conflicts of Interest
Kristina Mashonova is employee of “Hamster Cleaning” Ltd. The authors declare no conflict of interest.
References
- Persily, A.; Gorfain, J. Analysis of Ventilation Data from the U.S. Environmental Protection Agency U.S. Environmental Protection Agency Evaluation (BASE) Study; U.S. Environmental Protection Agency: Washington, DC, USA, 2008.
- Martin, E.; Khan, T.; Chasar, D.; Sonne, J.; Withers, C., Jr. Ventilation and Indoor Air Quality in Recently Constructed U.S. Homes Measured Data from Select Southeastern States; DOE/GO-102024-5751; US Department of Energy: Cocoa, FL, USA, 2024.
- Dimitroulopoulou, C.; Bartzis, J.G. Ventilation rates in European office buildings: A Review. Indoor Built Environ. 2014, 23, 5–25. [Google Scholar] [CrossRef] [Scilit]
- Seppänen, O.; Brelih, N.; Goeders, G.; Lițiu, A. Existing Buildings, Building Codes, Ventilation Standards and Ventilation in Europe; REHVA—Federation of European HVAC Associations: Brussels, Belgium, 2012. [Google Scholar]
- BAACV. A Study by the Bulgarian Association of Air Conditioning and Ventilation (BAOVK) Reveals Serious Deficiencies in the Ventilation of Educational Institutions in Bulgaria; Bulgarian Association of Air Conditioning and Ventilation: Sofia, Bulgaria, 2016. [Google Scholar]
- Singh, B. Bulgaria HVAC Equipment Market (2025–2031); 6Wresearch: Sofia, Bulgaria, 2025. [Google Scholar]
- CBRE INC. Bulgaria Office Market Figures H1 2024; CBRE INC: Sofia, Bulgaria, 2024. [Google Scholar]
- Petrunova, P. The HVAC Systems Market Is Expected to Reach Nearly $220 Billion in 2030; HVAC-Bulgaria: Sofia, Bulgaria, 2022. [Google Scholar]
- Bulgarian Sustainable Energy Development Agency. Long-Term National Strategy to Support the Renovation of the National Building Stock of Residential and Non-Residential Buildings by 2050; Bulgarian Sustainable Energy Development Agency: Sofia, Bulgaria, 2020.
- Bulgarian Sustainable Energy Development Agency. Integrated Energy and Climate Plan of the Republic of Bulgaria 2021–2030 (Updated 2024); Bulgarian Sustainable Energy Development Agency: Sofia, Bulgaria, 2024.
- IEA. Final Energy Consumption of Buildings Relative to Other Sectors; IEA: Paris, France, 2022. [Google Scholar]
- IEA. Global CO2 Emissions from Buildings, Including Embodied Emissions from New Construction; IEA: Paris, France, 2022. [Google Scholar]
- Asim, N.; Badiei, M.; Mohammad, M.; Razali, H.; Rajabi, A.; Haw, L.C.; Ghazali, M.J. Sustainability of Heating, Ventilation and Air-Conditioning (HVAC) Systems in Buildings—An Overview. Int. J. Environ. Res. Public Health 2022, 19, 1016. [Google Scholar] [CrossRef] [Scilit] [PubMed]
- Rabani, M.; Petersen, A.J.; Steneng, C.; Utstøl, S.; Halla, H.; Liaøy, A.R. Quantifying greenhouse gas emissions from HVAC—A case study of natural, hybrid and mechanical ventilation strategies. J. Build. Eng. 2025, 112, 113642. [Google Scholar] [CrossRef] [Scilit]
- Ildiri, N.; Biesiada, E.; Facchinetti, T.; Anglani, N.; Ahmed, N.; Hernández, M. Impacts of HVAC cleaning on energy consumption and supply airflow: A multi-climate evaluation. Energy Build. 2025, 328, 115147. [Google Scholar] [CrossRef] [Scilit]
- ODYSSEE-MURE. Bulgaria | Energy Profile, January 2026—Energy Efficiency Trends and Policies; ODYSSEE-MURE: Brussels, Belgium, 2026. [Google Scholar]
- Fisk, W.J. Review of Health and Productivity Gains From Better IEQ. Proceeding Healthy Build. 2000, 4, 23–34. [Google Scholar]
- European Environment Agency. Occupational exposure and respiratory disease. In Beating Chronic Respiratory Disease—A European Perspective; EEA: Copenhagen, Denmark, 2024. [Google Scholar]
- European Committee for Standardization. Ventilation for Buildings—Ductwork—Cleanliness of Ventilation; CEN: Brussels, Belgium, 2011. [Google Scholar]
- ASHRAE Standard Project Committee. Standard Practice for Inspection and Maintenance of Commercial Building HVAC Systems; ASHRAE: Atlanta, GA, USA; ACCA: Atlanta, GA, USA, 2018. [Google Scholar]
- Bulgarian Minister of Regional Development and Public Works. Regulation no. 7 of 2004 on Energy Efficiency of Buildings; Ministry of Regional Development and Public Works: Sofia, Bulgaria, 2004.
- European Environment Agency. Directive (EU) 2018/844 of the European Parliament and of the Council of 30 May 2018 Amending Directive 2010/31/EU on the Energy Performance of Buildings and Directive 2012/27/EU on Energy Efficiency; European Union: Brussels, Belgium, 2018. [Google Scholar]
- VDI Standards Comitee. Ventilation and Indoor-Air Quality—Hygiene Requirements for Ventilation and Air-Conditioning Systems and Units (VDI Ventilation Code of Practice); VDI: Berlin, Germany, 2018. [Google Scholar]
- National Air Duct Cleaners Association. The NADCA Standard: 2021 Edition for the Assessment, Cleaning, and Restoration of HVAC Systems; NADCA: Mount Laurel, NJ, USA, 2021. [Google Scholar]
- Smith, J.; Wiech, C. Ventilation System Hygiene: A Review of Published Information on the Possible Effects of Contaminated Ventilation Systems; AIVC: Ghent, Belgium, 1994. [Google Scholar]
- United States Environmental Protection Agency. Should You Have the Air Ducts in Your Home CleanSed? EPA: Washington, DC, USA, 1997.
- Zhijian, L.; Shengyuan, M.; Cao, G.; Chong, M.; He, B. Distribution characteristics, growth, reproduction and transmission modes and control strategies for microbial contamination in HVAC systems: A literature review. Energy Build. 2018, 177, 77–95. [Google Scholar] [CrossRef] [Scilit]
- Kravchenko, I.; Pasanen, P.; Lestinen, S.; Kilpeläine, S.; Kosonen, R. Risk of Microbial Growth in Ventilation Ductwork Located in the Humid and Cold Conditions. Buildings 2023, 13, 1683. [Google Scholar] [CrossRef] [Scilit]
- Apte, M.; Destaillats, H.; Fisk, W.; Gundel, L.; Sidheswaran, M. Formaldehyde and Other Pollutants from Ozone Reactions in Ventilation Systems; US Center for Disease Control and Prevention (CDC): Atlanta, GA, USA, 2012.
- Morrison, G.; Nazaroff, W.W.; Cano, A.; Hodgson, A. Indoor air quality impacts of ventilation ducts: Ozone removal and emissions of volatile organic compounds. J. Air Waste Manag. Assoc. 1998, 48, 941–952. [Google Scholar] [CrossRef] [Scilit] [PubMed]
- Kim, J.; Frank, S.; Braun, J.E.; Goldwasser, D. Representing Small Commercial Building Faults in EnergyPlus, Part I: Model Development. Buildings 2019, 9, 233. [Google Scholar] [CrossRef] [Scilit]
- Ahmed, N.; Facchinetti, T.; Hernandez, M.; Anglani, N. The impact of air handling unit cleaning on HVAC electricity consumption and system performance. Energy Build. 2025, 353, 116896. [Google Scholar] [CrossRef] [Scilit]
- Siegel, J.; Walker, I.; Sherman, M. Dirty air conditioners: Energy implications of coil fouling. In ACEEE Summer Study on Energy Efficiency in Buildings; American Council for an Energy-Efficient Economy (ACEEE): Washington, DC, USA, 2002. [Google Scholar]
- Liu, X.; Zhang, X.; Mahkamov, K.; Wu, H.; Mirzaeian, M. Numerical simulation of sub-cooled boiling flow with fouling deposited inside channels. Appl. Therm. Eng. 2016, 103, 434–442. [Google Scholar] [CrossRef] [Scilit]
- McPherson, M.J. Subsurface Ventilation Engineering; Springer: Berlin/Heidelberg, Germany, 1993. [Google Scholar] [CrossRef] [Scilit]
- NADCA. NADCA Energy Research Project—Save Energy and Money: Clean Your Heating and Air Conditioning System; NADCA: Mount Laurel, NJ, USA, 2012. [Google Scholar]
- Green Air Environmental LLC. HVAC and Coil Cleaning Case Study; Green Air Environmental, LLC: Augusta, Georgia, 2016. [Google Scholar]
- DSX. What Is the Life Expectancy of an EC Fan? Maximizing Durability and ROI, DSX. Available online: https://www.ffufan.com/what-is-the-life-expectancy-of-an-ec-fan-maximizing-durability-and-roi.html (accessed on 4 March 2026).
- NADCA. Restoring Energy Efficiency Through HVAC Air Distribution System Cleaning; National Air Duct Cleaners Association (NADCA): Mount Laure, NJ, USA, 2020. [Google Scholar]
- Keating, A. New Research Shows HVAC Cleaning Could Be Key to Building Decarbonization, ACHR NEWS. 24 February 2025. Available online: https://www.achrnews.com/articles/164199-new-research-shows-hvac-cleaning-could-be-key-to-building-decarbonization (accessed on 4 March 2026).
- EN 15780:2025; What the New Standard Means for Ventilation Cleaning. Hamster Cleaning: Genk, Belgium, 2025.
- ACR-2021 Committee. The NADCA Standard for Assessment, Cleaning, and Restoration of HVAC Systems; National Air Duct Cleaners Association: Mt. Laurel, NJ, USA, 2021; Available online: https://nadca.com/sites/nadca/files/docs/2021/acr_the_nadca_standard_2021_edition.pdf (accessed on 14 September 2021).
- Holopainen, R.; Asikainen, V.; Pasanen, P.; Seppänen, O. The field comparison of three measuring techniques for evaluation of the surface dust level in ventilation ducts. Indoor Air 2002, 12, 47–54. [Google Scholar] [CrossRef] [Scilit] [PubMed]
- Wang, Y.; Su, J. Automated defect and contaminant inspection of HVAC duct. Autom. Constr. 2014, 41, 15–24. [Google Scholar] [CrossRef] [Scilit]
- Hamza, M.; Bafail, O.; Alidrisi, H. HVAC Systems Evaluation and Selection for Sustainable Office Buildings: An Integrated MCDM Approach. Buildings 2023, 13, 1847. [Google Scholar] [CrossRef] [Scilit]
- Karakas, F.; Grassie, D.; Schwartz, Y.; Dong, J.; Bagkeris, E.; Mumovic, D.; Milner, J.; Chalabi, Z.S.; Mavrogianni, A. A Multi-Criteria decision analysis framework to determine the optimal combination of energy efficiency and indoor air quality schemes for English school classrooms. Energy Build. 2023, 295, 113293. [Google Scholar] [CrossRef] [Scilit]
- Daugavietis, J.E.; Soloha, R.; Dace, E.; Ziemele, J. A Comparison of Multi-Criteria Decision Analysis Methods for Sustainability Assessment of District Heating Systems. Energies 2022, 15, 2411. [Google Scholar] [CrossRef] [Scilit]
- National Air Duct Cleaners Association. The Role of Robotics in Duct Cleaning: Revolutionizing the Industry, National Air Duct Cleaners Association. 30 July 2024. Available online: https://nadca.com/blog/role-robotics-duct-cleaning-revolutionizing-industry (accessed on 13 March 2026).
- Bulgakov, A.; Sayfeddine, D. Air Conditioning Ducts Inspection And Cleaning Using Telerobotics. Procedia Eng. 2016, 164, 121–126. [Google Scholar] [CrossRef] [Scilit]
- Dzido, A.; Krawczyk, P. Abrasive Technologies with Dry Ice as a Blasting Medium—Review. Energie 2023, 16, 1014. [Google Scholar] [CrossRef] [Scilit]
- Mata, T.M.; Martins, A.A.; Calheiros, C.S.C.; Villanueva, F.; Alonso-Cuevilla, N.P.; Gabriel, M.F.; Silva, G.V.V. Indoor Air Quality: A Review of Cleaning Technologies. Environments 2022, 9, 118. [Google Scholar] [CrossRef] [Scilit]
- Li, S. Review of Engineering Controls for Indoor Air Quality: A Systems Design Perspective. Sustainability 2023, 15, 14232. [Google Scholar] [CrossRef] [Scilit]
- Occupational Safety and Health Administration U.S. Department of Labor. Indoor Air Quality in Commercial and Institutional Buildings; OSHA: Washington, DC, USA, 2011.
- Alimohammadi, H.; Vassiljeva, K.; Petlenkov, E.; Kull, T.M.; Thalfeldt, M. Predict the remaining useful life in HVAC filters using a hybrid strategy. In Proceedings of the REHVA 14th HVAC World Congress, Rotterdam, The Netherlands, 22–25 May 2022. [Google Scholar] [CrossRef]
- Almatared, M.; Sulaiman, M.; Alghamdi, A.; Nasrallah, E. An Artificial-Intelligence-Based Predictive Maintenance Strategy Using Long Short-Term Memory Networks for Optimizing HVAC System Performance in Commercial Buildings. Buildings 2025, 15, 4129. [Google Scholar] [CrossRef] [Scilit]
- Oxmaint. IoT Sensors for Indoor Air Quality: Executive Brief for Commercial Towers. 4 December 2025. Available online: https://oxmaint.com/industries/property-management/iot-sensors-for-indoor-air-quality-executive-brief-for-commercial-towers (accessed on 4 March 2026).

Disclaimer/Publisher’s Note: The statements, opinions and data contained in all publications are solely those of the individual author(s) and contributor(s) and not of MDPI and/or the editor(s). MDPI and/or the editor(s) disclaim responsibility for any injury to people or property resulting from any ideas, methods, instructions or products referred to in the content. |
© 2026 by the authors. Licensee MDPI, Basel, Switzerland. This article is an open access article distributed under the terms and conditions of the Creative Commons Attribution (CC BY) license.