


Abstract
This article presents a high-performance system for classifying types of solar bursts. The proposed system was installed on Livingston Island, Antarctica. Results from early 2026 are presented—the period of maximum solar activity in the 11-year solar cycle. The results obtained are verified by correlation with satellite X-ray data. Unlike satellite data, the ground system-obtained data shows how an RF frequency (50–820 MHz band) is useful to classify radio bursts of types I, II, III, and IV. Capturing these radio signals simplifies solar burst classification and improves the reliability of space weather research.
1. Introduction
This article presents a reliable, high-performance system for studying solar radio bursts. The proposed system was installed at the Bulgarian Antarctic Base—St. Kliment Ohridski (62.6406° S, 60.3594° W), located on Livingston Island, part of the South Shetland Islands group, Antarctica. These observation sites were chosen for their lack of jammers, quiet radio frequencies, and long polar summer days, all of which increase the efficiency and sensitivity of the measurements. Results from the beginning of 2026 are presented and analyzed—the period of maximum solar activity for an 11-year solar cycle (Shave Cycle). The results obtained are verified by comparison with X-ray data from the GOES satellite. Unlike satellite data, the results obtained from the experiment show which frequencies from the studied area (50–820 MHz) are used to classify radio bursts of types I, II, III, and IV. Studying the processes associated with the solar events is key to space weather science and to understanding the effects on Earth during times of increased solar activity.
Solar radio bursts are one of the most prominent signs of solar activity. The study of this type of burst using appropriate systems provides data, analysis of which is a key to understanding energetic processes in the solar corona. Radio monitoring of these processes provides an opportunity to supplement studies of processes in space weather, such as particle acceleration, shock wave propagation, and plasma interactions, associated with solar radio bursts and coronal mass ejections [1]. The frequency range 50 MHz–820 MHz is extremely suitable for such observations, since in this range solar bursts of types I, II, III, and IV are observed (their characteristics are summarized in Table 1) [2,3,4].
Table 1.
Characteristics of solar radio burst types I, II, III and IV.
One of the main challenges in capturing solar radio bursts is the availability of reliable, high-performance radio monitoring equipment. This article presents a technical solution for this purpose. The proposed system is faster than other conventional systems used for similar research, such as e-CALLISTO [5]. Another important feature is its successful two-month operation at the Bulgarian polar radio observatory installed at the Bulgarian Antarctic Base “St. Kliment Ohridski” on Livingston Island (62°38′29″ S, 60°21′53″ W). Monitoring from this location offers additional advantages, including an exceptionally clean radio spectrum. Due to the lack of indigenous population and industrial activity, Antarctica provides a very quiet radio background. Another advantage is the installation during the polar summer, when daylight can last up to 20 h, enabling prolonged and continuous solar radio monitoring. This paper describes the system’s VHF and UHF hardware (50–820 MHz), used for the classification of solar radio bursts. Types I, II, III, and IV are the main burst types observed in this frequency range. The system’s high performance is achieved through a software-defined radio adapted for real-time spectral analysis. This enables high temporal and frequency resolution of the obtained spectrograms, as well as the identification of type I events. They are observed as clusters of multiple small bursts, each with a duration of less than 1 s. The results verify the system’s functionality through comparison between the observations and GOES satellite X-ray data.
2. Instrumentation
A system for solar spectrometer applications has been developed with the main goal of studying and classifying solar radio bursts of types I, II, III, and IV. A solar spectrometer can be regarded as a precise antenna-based measurement system, with different configurations implemented through mechanically rotating antennas for solar tracking [6] and spectrometers based on the concept of phased-array antennas [7], as well as systems based on classical VHF and UHF radio circuits [8]. The proposed solar spectrometer is implemented using a broadband log-periodic antenna operating over a bandwidth of 50–850 MHz, with SWR < 2 and antenna gain Gant ≈ 5 dBi. An antenna tracking positioner has been added to allow antenna rotation so that, at any given moment, the antenna is directed toward the Sun. One of the main advantages of radio-frequency tools in solar research is that, unlike classical optical methods, they can be used as long as the Sun is above the horizon, and clear-sky conditions are not required. In the immediate vicinity of the antenna, an LNA with a gain of is used over the antennas’ operating range.
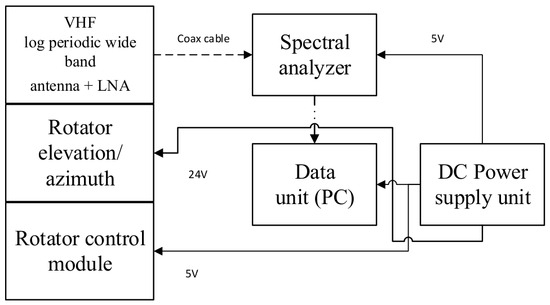
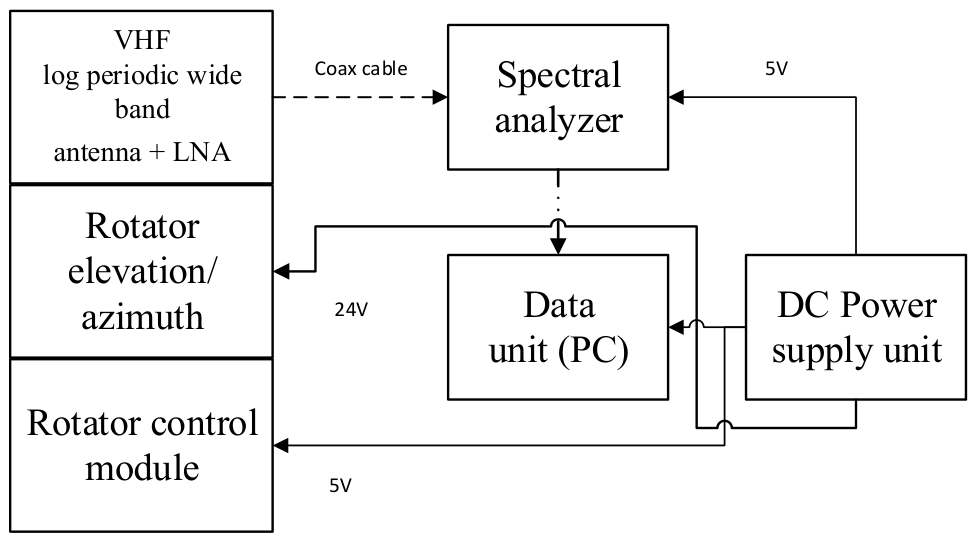
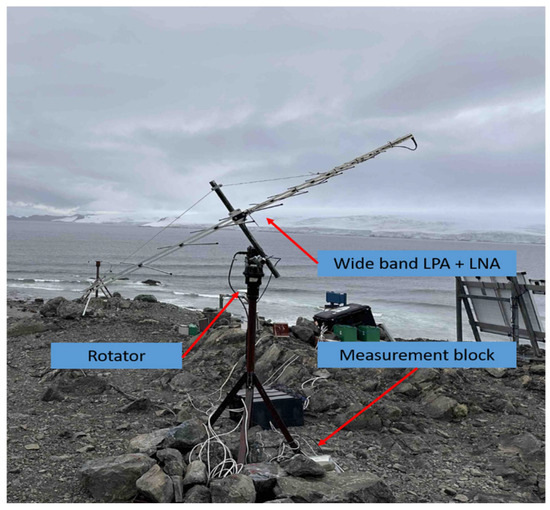
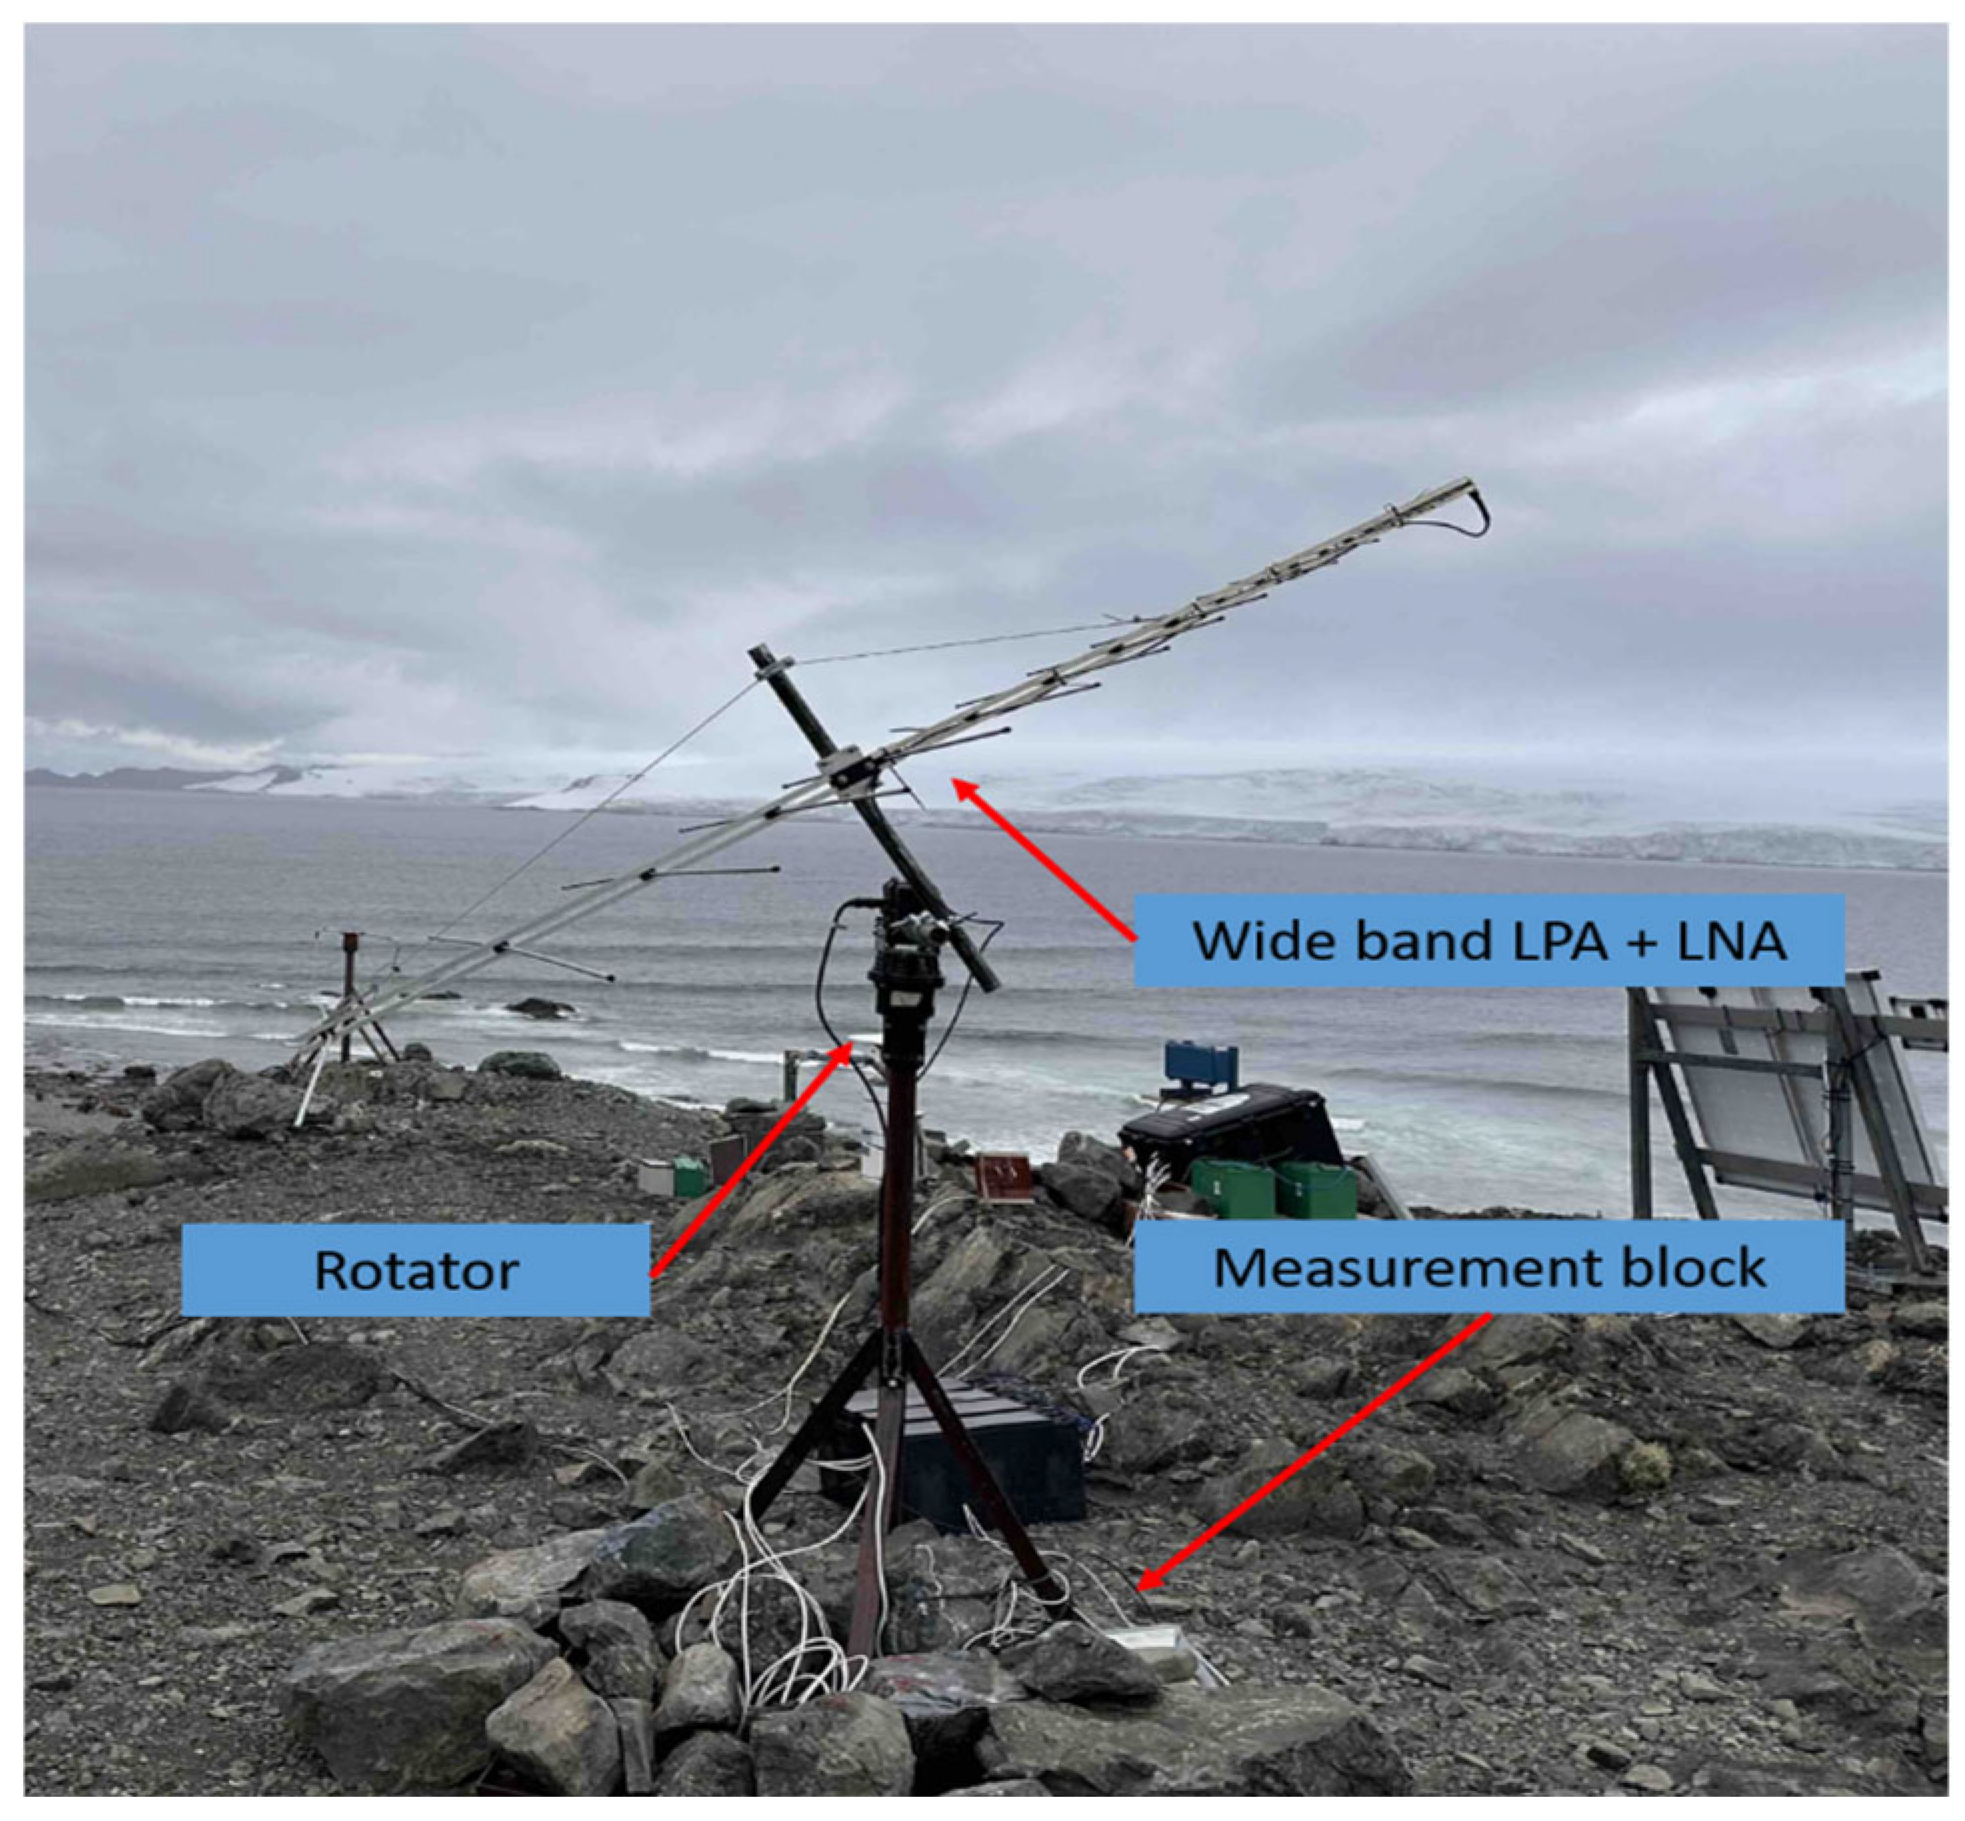
The amplified signal is transmitted to the input of a highly sensitive spectrum analyzer, which serves as the system’s main measuring device. A modern Harogic SAM-60 M3 real-time spectrum analyzer [8], based on software-defined radio (SDR), was used and connected to a computer, where the signal is recorded and processed. The spectrum analyzer software enables real-time visualization of the measured spectra. To reduce the hardware resource usage, the software is configured to process the recorded data every 2 h, allowing selected results to be reviewed. Figure 1 shows a block diagram of the assembled system, and Figure 2 presents the system during installation and operation.
Figure 1.
Block diagram of the proposed solar burst detection system.
Figure 2.
Photo of the installed proposed solar burst detection system.
One of the main advantages of the system is its scanning speed across the studied frequency spectrum of 0.1 s, with a frequency resolution of 15.38 kHz. Another factor contributing to the fast real-time operation and reliable scanning is the Fast Fourier Transform (FFT) embedded in the spectrum analyzer FPGA.
A software program has been developed for the presented system. The program continuously scans and acquires data from the spectrum analyzer over the studied frequency range of 50–820 MHz. Despite the high performance of the selected analyzer, it cannot scan the entire range at once. Therefore, the range is divided into segments, and a separate measurement is performed for each segment. The individual segments are then combined into a single scan cycle. The program sequence runs in a cycle:
- Read JASON configuration;
- Open the selected device—Spectral analyzer;
- Divides the entire frequency range into segments;
- For each segment a scan profile is selected;
- For each cycle:
- -
- Measures all segments one after the other;
- -
- Unite different segments;
- -
- Saves one composite recording to a file.
- The recording duration in each file is configurable, and after each recording, the file name changes and contains information about the absolute recording time, start, and end in UTC;
- According to the user’s settings, it measures only between sunrise and sunset.
Software algorithm following steps:
- Setting input parameters:
- JASON configuration file read:
- -
- Spectral analyzer data: start_freq_hz–starting frequency; stop_freq_hz–end frequency; subspan_hz–width of one segment; step_hz–desired frequency step; target_cycle_s–desired duration of one full cycle; rbw_hz, vbw_hz–resolutions; window type, detector, trace mode; settings for preamp, gain strategy, spur rejection, LO optimization;
- -
- Data for file records: prefix–prefix in the file name; daylight gating–yes/no; power recording format: 0.1 dB or 1 dB.
- 2.
- Dividing the frequency range into segments:
- 3.
- Spectral analyzer configuration for each segment (sweep):
- For each segment a sweep profile is created and fed to the SA:
- -
- StartFreq_Hz = f_s;StopFreq_Hz = f_e;TraceBinSize_Hz = step_hz;RBW_Hz = rbw_hz;
- -
- reference level;window type;detector;trace settings.
- Reading the actual parameters from the SA:
- -
- real starting frequency start_out; real bin width step_out; number of points npts; sweep time sweep_ms.
- 4.
- Measuring cycle:
- 4.1.
- Check for daylight window:
- If daylight only is enabled, the program checks whether the current UTC time is between sunrise and sunset.
- If not:
- -
- Does not measure and waits for a certain time interval;
- -
- Checking for a day window.
- 4.2.
- Open a file for the current bucket:
- For example, for a 6 h record: 00–05; 06–11; 12–17; 18–23;
- The name is of the form and is defined relative to UTC time: prefix_YYYYMMDD_00-05.bin.
- 4.3.
- Scan all segments:
- For each segment:
- -
- Makes profile settings;
- -
- Makes several “warm-up” calls;
- -
- Does a scan SWP_GetFullSweep;
- -
- If successful: takes the array of powers and adds a logo to a list of frames.
- 4.4.
- Segments merge:
- Once all segments have been measured:
- -
- Sorted by started frequency;
- -
- Arrays are concatenated;
- -
- One common trace is obtained for the entire frequency range.
- 4.5.
- Save data to file:
- A binary field for the entire scan cycle is written to the file.
- The data format when writing is in formats without separators. Each cycle is written as: header; array of powers.
- The file is a sequence of records:
- Each record has the structure:
- Header:
- The header has a fixed length of 24 bytes—Table 2.Table 2. Header structure of records.
Power data—Payload
After the header, the array of powers follows. To reduce the size of the recorded file, the measured power is recorded as an integer, and two modes are provided:
Mode A: power_precision = “1 db”; the record for a single power value is 1 byte, a signed integer. The measured and recorded power for the kth point is:
The conversion when saving is with a resolution of 1 dB and an array size of N bytes.
Mode B: power precision = “0.1 dB”.
Then the power in dBm is recorded in two bytes after multiplication by 10: the recovered power from recording is:
where the conversion record is , with a resolution of 0.1 dB and an array size of Nx2 bytes.
The full size of one record for header = 24 bytes and npts = N; for 1 dB: L = N + 24; and for 0.1 db: L = 24 + 2N.
For k record point, the frequency record depends on:
where is starting record frequency and is the frequency step.
Power:
For 1 db: , for: 0.1 db: .
3. Data and Results
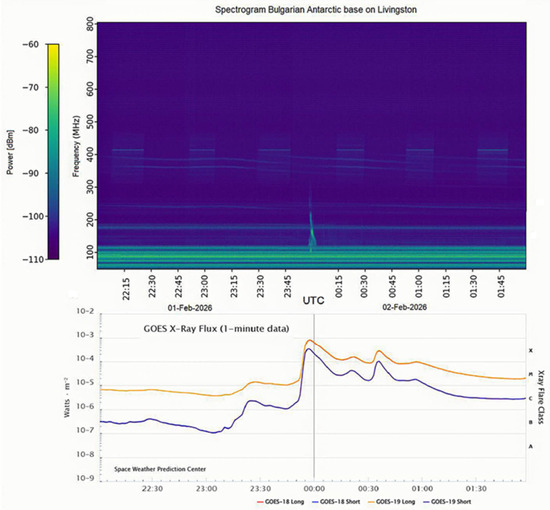
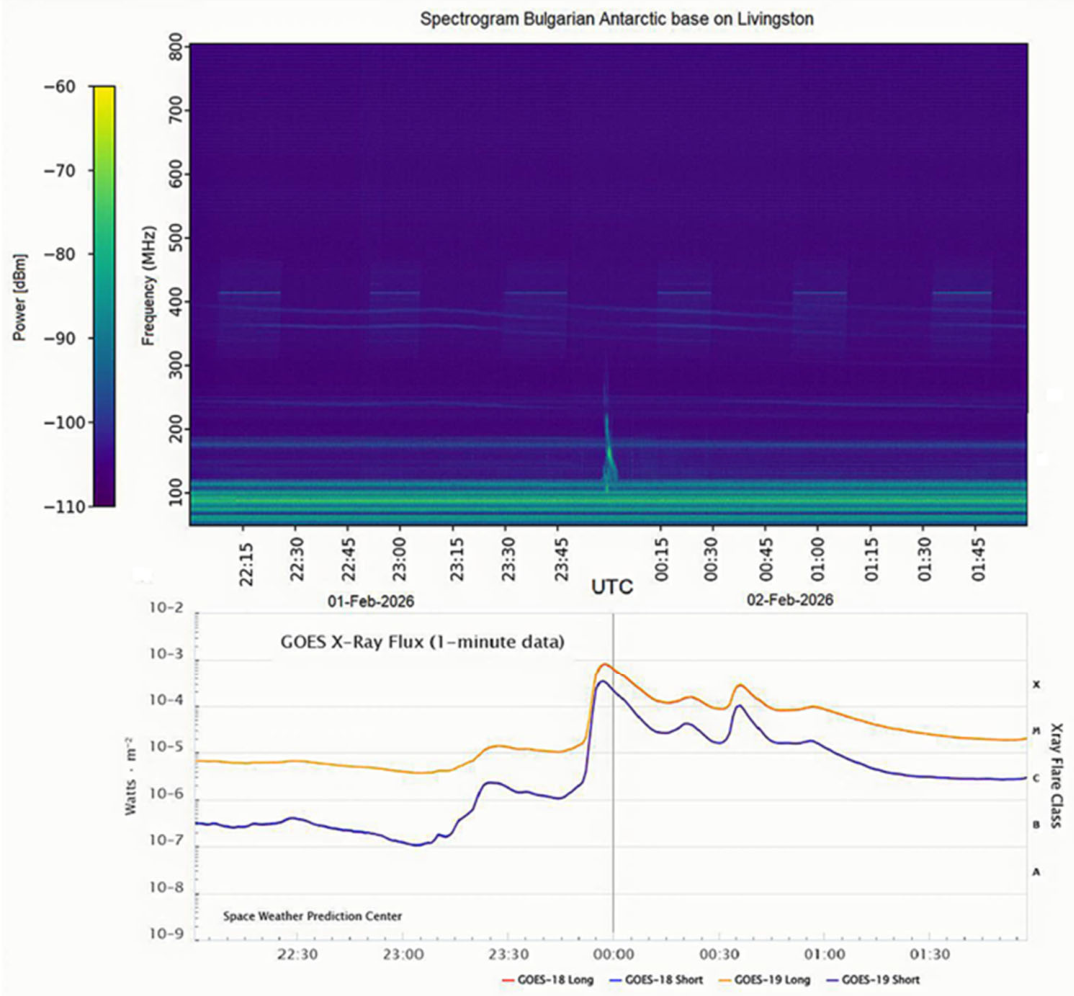
After the instruments were installed in late December 2025, the discussed equipment operated at the BAB during the period January–February 2026. A database containing approximately 3.5 TB of data was accumulated. After processing the results and performing a visual assessment, several spectrograms are presented below, showing the presence of solar radio burst artifacts. One of the first detected phenomena is shown in Figure 3. It presents the full spectrogram of the measurement containing a solar burst artifact. The lower graph is included for comparison and uses data from the NOAA Space Weather [9] Prediction Center. It shows a change in radiation power density in the X-ray range, and during the period from 23:57 to 00:04 there is a pronounced maximum corresponding to a solar flare of class X8.1.
Figure 3.
Comparison between a spectrogram of a detected solar burst on 1 February 2026, compared to X-ray GOES satellite data.
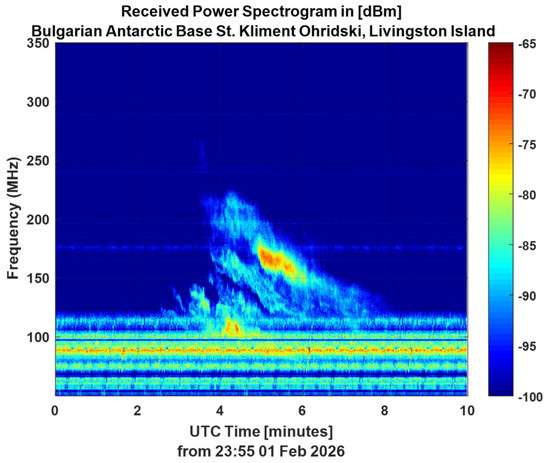
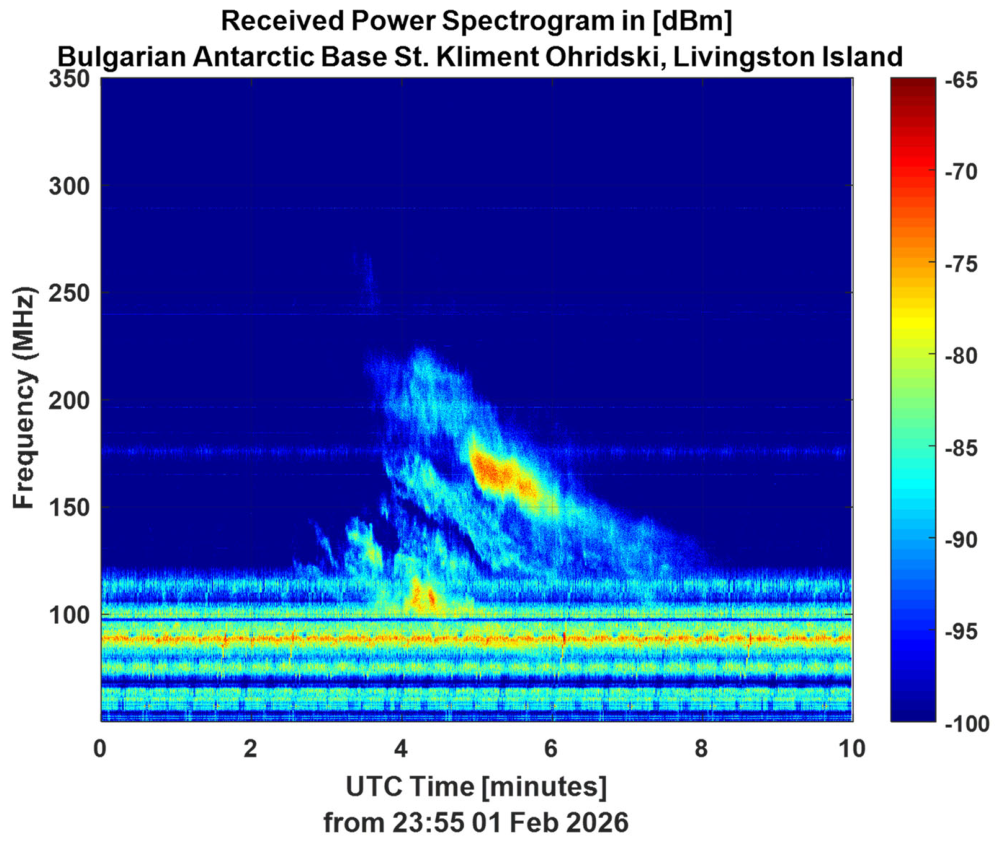
At the same time interval, the upper spectrogram clearly shows a noticeable radio burst artifact. It should be noted that the appearance of a radio burst in the spectrum is not always accompanied by a solar flare. Figure 4 shows the spectrogram over the observed frequency and time interval at high resolution, with a time resolution of 0.1 s and a frequency resolution of 13.380 kHz. The figure clearly shows a structure with a Doppler-shifted frequency drifting from 260 MHz to 100 MHz. The duration of the phenomenon is about 5.6 min. Four main harmonics of the drift in the frequency domain are observed. The second is the broadest and spans from 270 MHz to 100 MHz within seconds (23:58–23:59), while the remaining three have the same slope, with the third showing a drift from 220 MHz to 118 MHz. Because the frequency drift is slow, the predominant solar burst can be classified as type II.
Figure 4.
The spectrograph with the maximum resolution of the solar burst on 1 February 2026.
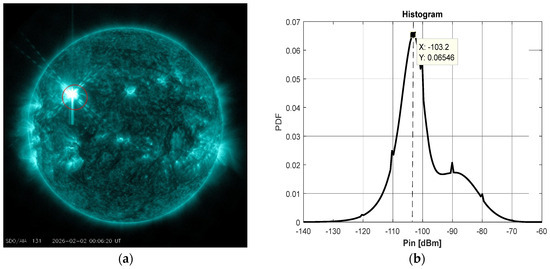
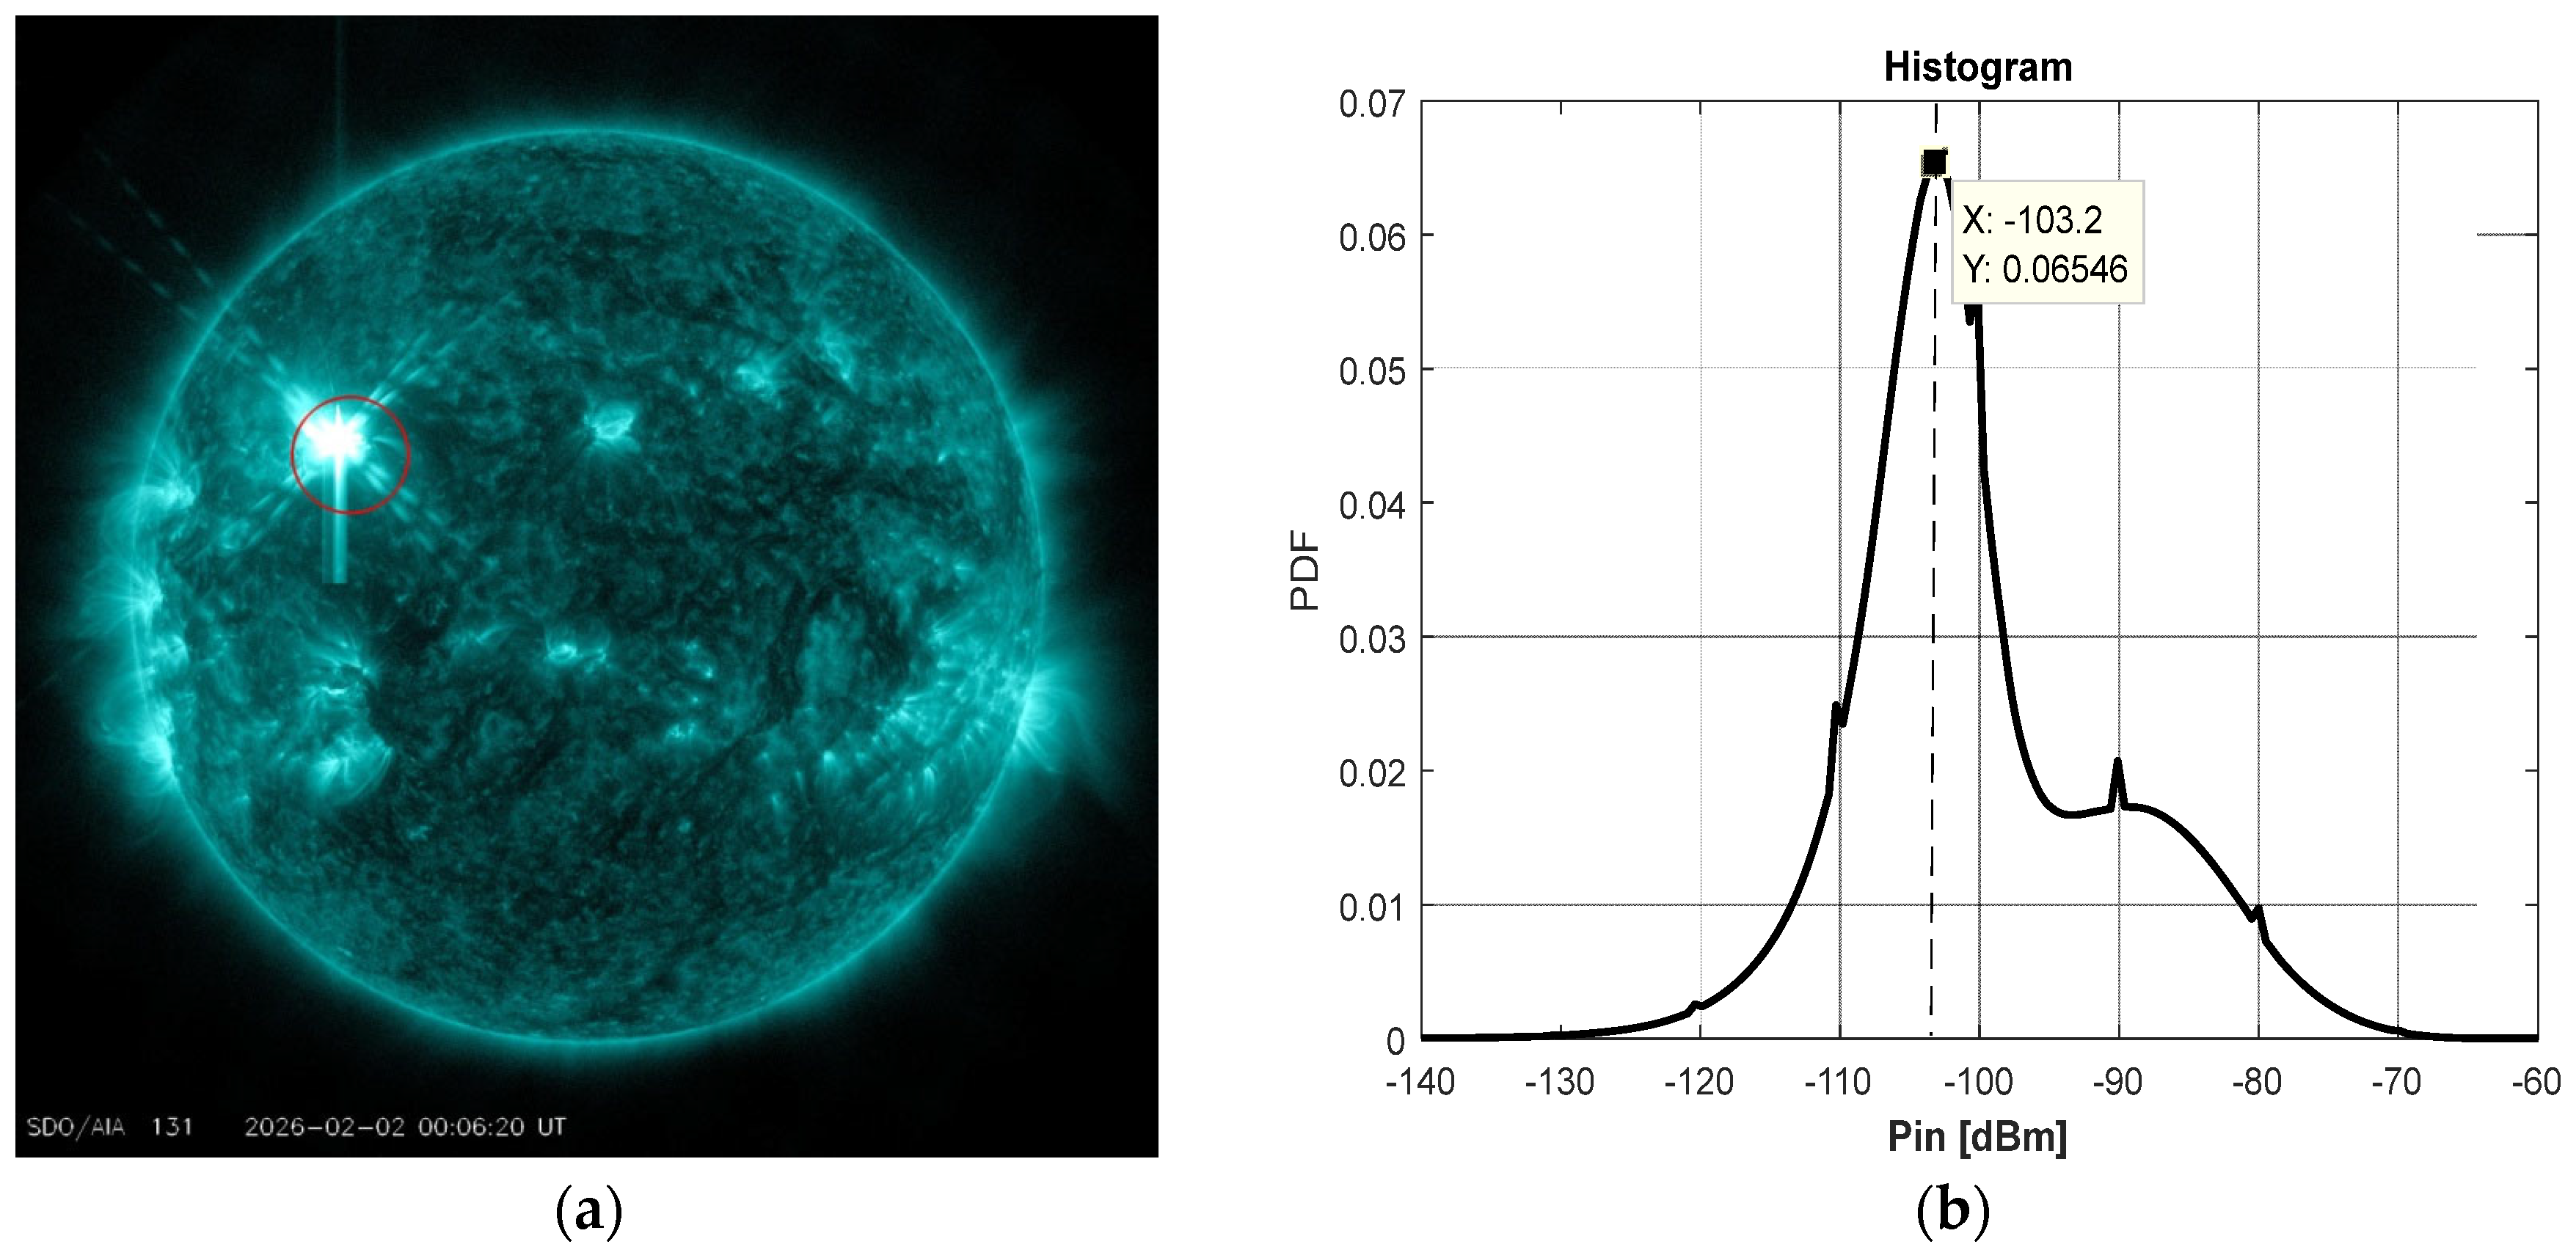
For illustration, Figure 5a shows the location of the sunspot associated with the discussed solar event. Figure 5b shows the histogram (PDF) of the received power. The histogram for the given frequency–time domain shows a maximum at −103 dBm, corresponding to the background noise level. This value can also serve as a reference level for processing and detecting solar events in the spectrograms.
Figure 5.
(a) Sunspot associated (circled in red) with solar event on 01.02.2026; (b) histogram–PDF of the spectrogram from Figure 4.
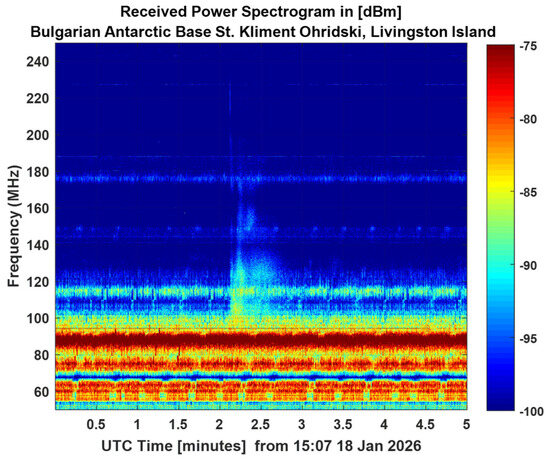
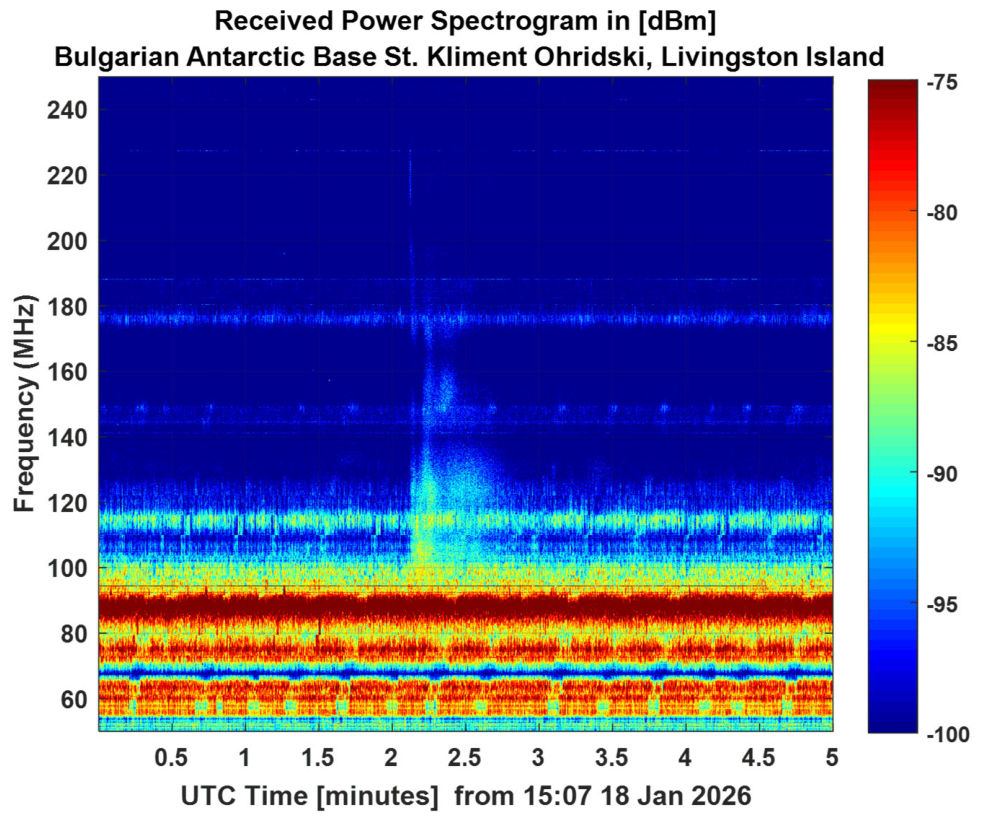
Figure 6 shows another radio burst captured by the discussed system on 4 February 2026. The radio burst can also be classified as class II, with a frequency change rate of approximately 0.4 MHz/s and a duration of 1–2 min in the frequency range of 170–130 MHz.
Figure 6.
The spectrograph with the maximum resolution possible of the solar burst on 18 January 2026.
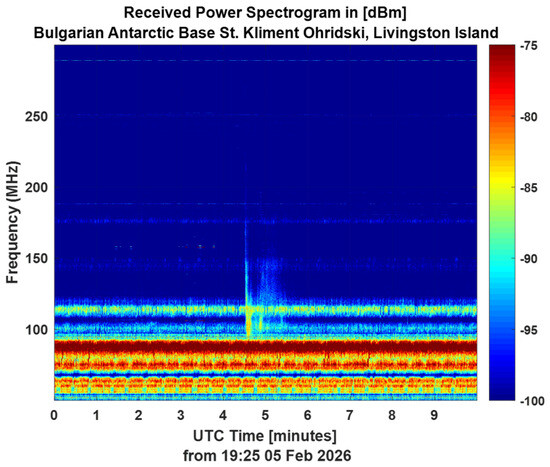
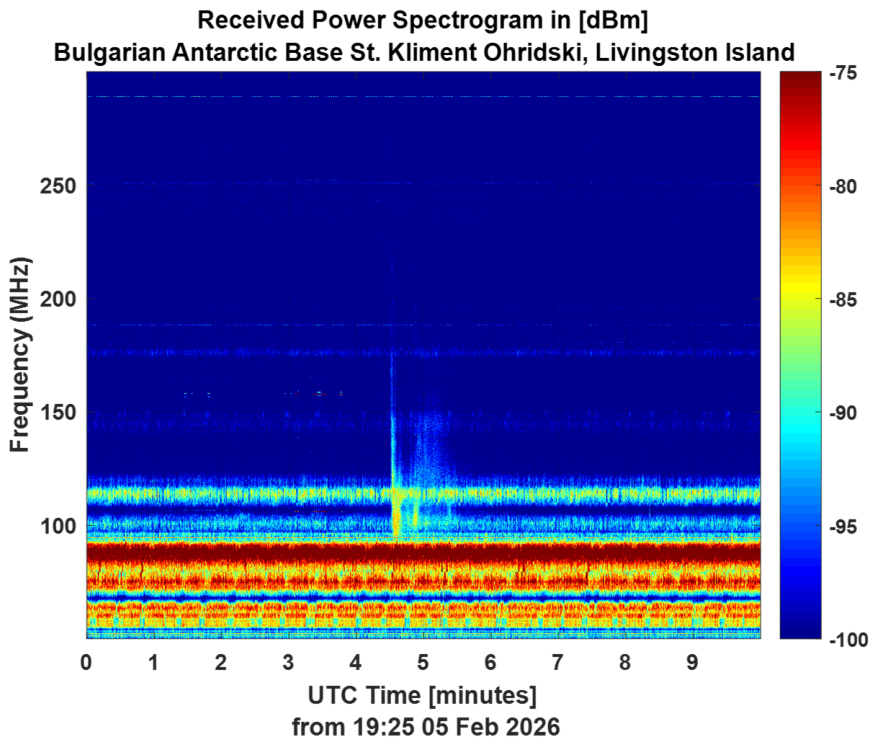
Figure 7 shows a spectrogram showing signs of a type 1 solar radio burst—noise storm-like activity. Around 140–150 MHz, a group of short bursts with almost zero frequency variation is observed, with a total duration of about 61 s.
Figure 7.
The spectrograph with the maximum resolution possible of the solar burst on 5 February 2026.
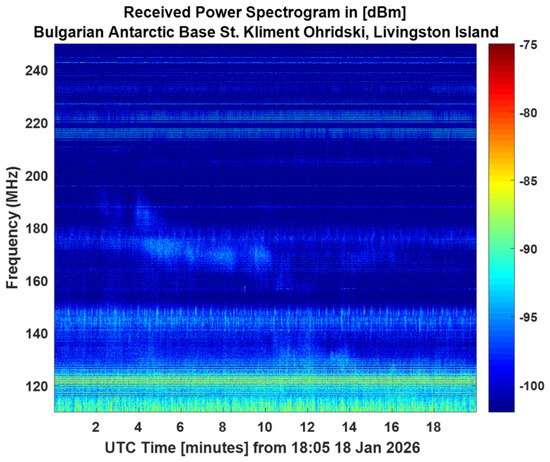
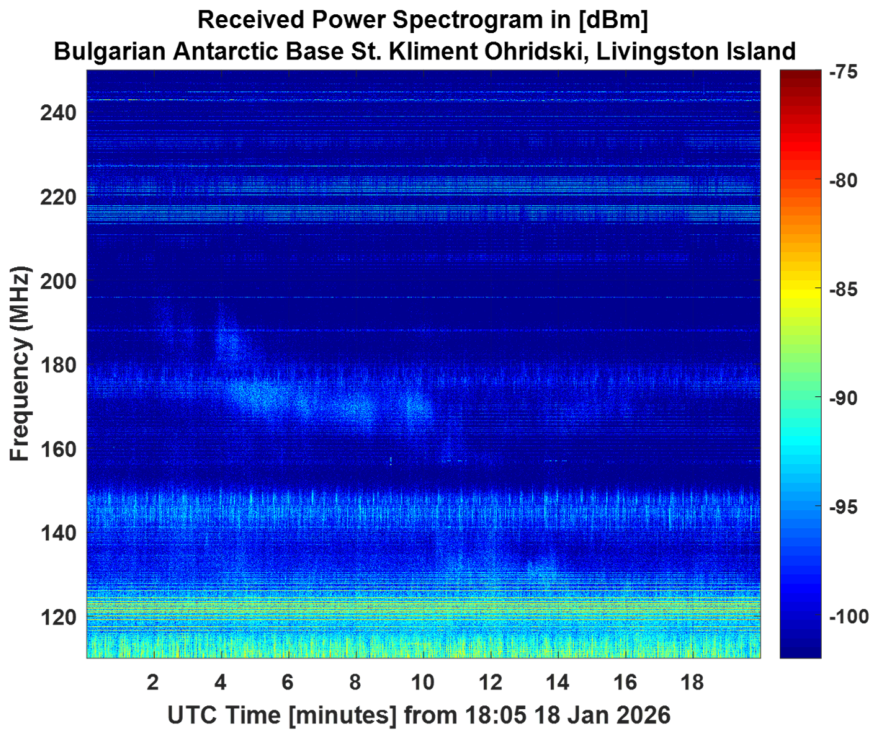
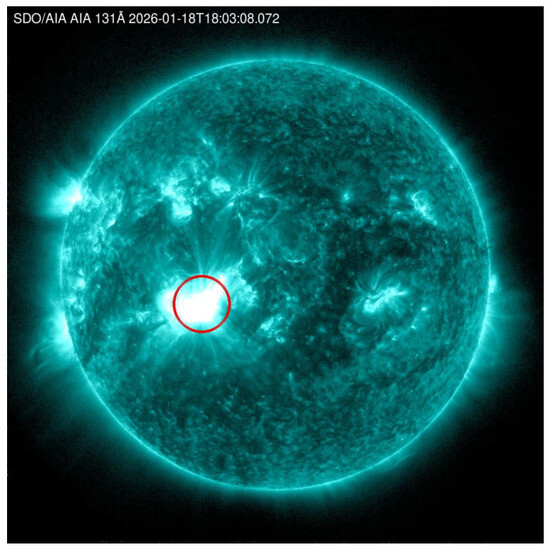
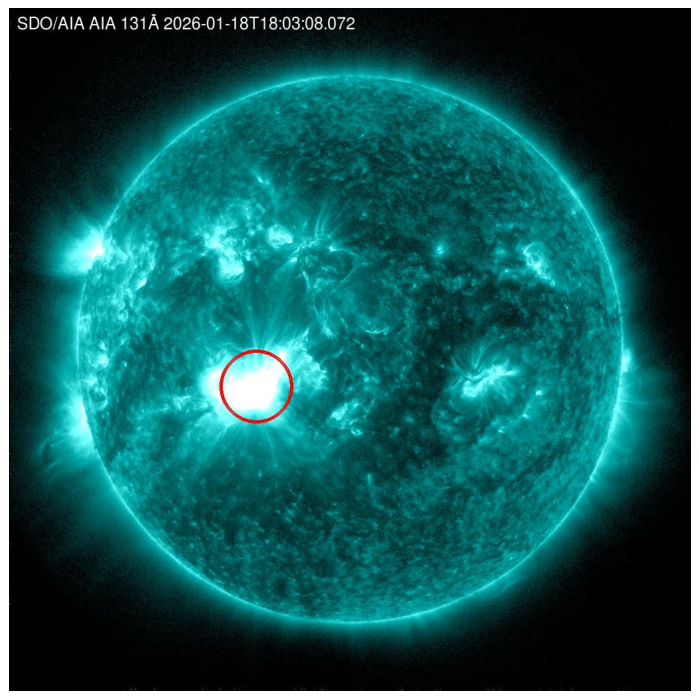
Figure 8 shows typical characteristic of a noise storm burst type—narrow-band spots without frequency drift around 170–2000 MHz. The event spans 11 min. In the observed time interval, a solar flare class X1.9 was detected—lasting from 17:26 to 18:50 [10]. From source [10], Figure 9 shows a photograph of the Sun in the ultraviolet range with the sunspot associated with the artifact.
Figure 8.
The spectrograph with the maximum resolution possible of the solar burst on 18 January 2026.
Figure 9.
Sunspot associated (circled in red) with solar event on 18 January 2026.
4. Conclusions
The study of space weather is an important and interesting field that undergoes continuous solar variation. Powerful instruments are available for assessing its parameters, most of which are satellite-based. There are also many ground-based instruments capable of measuring parameters and detecting solar activity. This work presents a high-performance ground-based instrument for monitoring and detecting solar radio bursts. Compared to other such systems (e.g., e-CALLISTO), the achieved high temporal resolution allows the proposed instrument to monitor solar bursts, including type I events. This high frequency and time resolution also allows the measured spectrograms to be used for studying and analyzing the fine structure of radio bursts.
The data obtained from the proposed high-performance monitoring station can be used to train artificial intelligence algorithms for the automatic detection and classification of solar events. The operational capability of the proposed system has been tested at the Bulgarian Antarctic Base. Data from monitoring the solar radio spectrum verify the system’s functionality through comparison of the observations with GOES satellite X-ray data. One disadvantage of such high-resolution systems is the generation of large databases. In the proposed system, the received power data format is limited to 2 bytes per frequency bin, fully covering the dynamic range and achieving an accuracy of 0.1 dB. The problem of the large amount of information is addressed through the use of data-compression algorithms. On the other hand, thanks to advances in modern computer technologies and permanent storage devices, this problem is gradually diminishing.
Author Contributions
Conceptualization, I.I. and P.Z.P.; methodology, I.I., B.B., Y.V. and I.N.; software, I.I. and Y.V.; validation, I.I., Y.V. and B.B.; formal analysis, I.I., Y.V. and B.B.; investigation, I.I. and I.N.; resources, P.Z.P.; data curation, I.I., Y.V. and B.B.; writing—original draft preparation, I.N. and I.I.; writing—review and editing, I.N., I.I. and P.Z.P., visualization, I.I. and I.N.; supervision, P.Z.P.; project administration, P.Z.P.; funding acquisition, P.Z.P. All authors have read and agreed to the published version of the manuscript.
Funding
This study was financed by the European Union, NextGenerationEU, through the National Recovery and Resilience Plan of the Republic of Bulgaria, project № BG-RRP-2.004-0005.
Institutional Review Board Statement
Not applicable.
Informed Consent Statement
Not applicable.
Data Availability Statement
Data are contained within the article.
Conflicts of Interest
The authors declare no conflicts of interest.
Abbreviations
The following abbreviations are used in this manuscript:
| VHF | Very high frequency |
| UHF | Ultra-high frequency |
| SDR | Software-defined radio |
| SA | Spectral analyzer |
| LNA | Low noise amplifier |
| LPA | Log-periodic antenna |
| FPGA | Field-programmable gate array |
| VSWR | Voltage standing wave radio |
| BAB | Bulgarian Antarctic Base |
| CME | Coronal mass ejection |
| MDH | Magnetohydrodynamics, |
| BW | Beamwidth |
| FFTF | Fast Fourier transform |
| Probability density function | |
| RF | Radio frequency |
References
- Berngardt, O.I. Space weather impact on radio device operation. Sol.-Terr. Phys. 2017, 3, 37–53. [Google Scholar] [CrossRef] [Scilit]
- Orwig, L.E.; Frost, K.J.; Dennis, B.R. The hard X-ray burst spectrometer on the solar maximum mission. Sol. Phys. 1980, 65, 25–37. [Google Scholar] [CrossRef] [Scilit]
- Ramli, N.; Hamidi, Z.S.; Abidin, Z.Z.; Shahar, S.N. The relation between solar radio burst types II, III and IV due to solar activities. In Proceedings of the 2015 International Conference on Space Science and Communication (IconSpace), Langkawi, Malaysia, 10–12 August 2015; pp. 123–127. [Google Scholar]
- Bykerk, T.; Karl, S.; Laureti, M.; Ertl, M.; Ecker, T. Retro-propulsion in rocket systems: Recent advancements and challenges for the prediction of aerodynamic characteristics and thermal loads. Prog. Aerosp. Sci. 2024, 151, 101044. [Google Scholar] [CrossRef] [Scilit]
- Hamidi, Z.S.; Ibrahim, Z.; Abidin, Z.; Maulud, M.; Radzin, N.; Hamzan, N.; Shariff, N. Designing and constructing log periodic dipole antenna to monitor solar radio burst: E-CALLISTO space weather. Int. J. Appl. Phys. Math. 2011, 2, 3. [Google Scholar]
- Bubnov, I.M.; Stanislavsky, A.A.; Shevchuk, N.V.; Stanislavsky, L.A.; Konovalenko, A.A.; Ulyanov, O.M.; Myrhorod, V.I. A solar-powered mobile phased array for radio astronomy observations at low frequencies. J. Astron. Instrum. 2025, 14, 2550009. [Google Scholar] [CrossRef] [Scilit]
- Rickard, L.J.; Craig, J.; Taylor, G.B.; Tremblay, S.; Watts, C.; Kassim, N.E.; Jenet, F.A. The Long Wavelength Array (LWA): A large HF/VHF array for solar physics, ionospheric science, and solar radar. In Ground-Based and Airborne Instrumentation for Astronomy III; Proceedings of SPIE; SPIE: Bellingham, WA, USA, 2010; Volume 7735. [Google Scholar]
- Krüger, A. Introduction to Solar Radio Astronomy and Radio Physics; Springer Science & Business Media: Berlin/Heidelberg, Germany, 2012. [Google Scholar]
- NOAA Spaceweaher Data Base. Available online: https://www.swpc.noaa.gov/ (accessed on 12 March 2026).
- Harogic SAM-60 M3 Datasheet. Available online: https://www.harogic.com/wp-content/uploads/2025/12/HAROGIC-SAN-SAM-NXN-NXM-Series-Spectrum-Analyzer-Product-Manual-V1.7.pdf (accessed on 12 March 2026).

Disclaimer/Publisher’s Note: The statements, opinions and data contained in all publications are solely those of the individual author(s) and contributor(s) and not of MDPI and/or the editor(s). MDPI and/or the editor(s) disclaim responsibility for any injury to people or property resulting from any ideas, methods, instructions or products referred to in the content. |
© 2026 by the authors. Licensee MDPI, Basel, Switzerland. This article is an open access article distributed under the terms and conditions of the Creative Commons Attribution (CC BY) license.