


Abstract
The advancement of 5G/6G infrastructure requires specifications that are challenging from an engineering point of view. Some of the advanced field-manipulation techniques rely on High Impedance Surfaces (HISs), including modulated appearances. However, their intense near-field energy localization for some frequencies poses challenges for bioelectromagnetic safety. Measurements of such hot spots require special attention; traditional metallic probes are often invasive and locally distort fields. This paper proposes and validates a non-invasive methodology using Transient Infrared (IR) Thermography for high-resolution mapping of a substantial area (in terms of wavelength). By capturing the initial thermal gradient (dT/dt) on a HIS built on an Arlon AD430 substrate, we estimate the local specific absorption rate (SAR) of energy deposition before heat diffusion occurs. Cross-validation with electric (E)-field measurements at two different distances from the HIS in the sub-6 GHz 5G frequency spectrum, namely at 2 mm and at 22 mm, reveals a remarkable spatial correlation between thermal hot-spots and peak intensities, which decrease by ~83% across these distances. This study demonstrates that transient IR thermography is a rapid, non-perturbing tool for auditing electromagnetic safety compliance, providing a robust framework for determining SAR in human tissues exposed to radiation from future 5G devices.
1. Introduction
The rapid rollout of 5G systems and the upcoming 6G architecture have pushed wireless communication into the millimeter-wave (mm Wave) spectrum, where signal behaviour becomes increasingly complex [1]. To effectively manage these high-frequency wave phenomena, High Impedance Surfaces (HISs) have become essential. These structures, often realized by periodic and/or quasi-periodic arrangement of unit cells, are characterized by a forbidden frequency band, and with extensive application of dispersion engineering, allow for sophisticated wave manipulation, such as beam steering and surface wave control, which are vital, for example, for maintaining signal integrity in dense urban environments [2,3].
However, the characteristic that makes these metasurfaces efficient—their ability to tightly confine and direct electromagnetic (EM) fields—presents a significant challenge for bioelectromagnetic safety [4]. In the near-field region of these devices, energy hot-spots can emerge [5]. These are localized areas where the EM power density might approach or exceed the safety limits established by guidelines such as those of the International Commission on Non-Ionizing Radiation Protection (ICNIRP) [6]. Understanding the thermal response of human skin and tissues to such millimeter-wave exposure is crucial for ensuring that these technological advancements do not compromise public health [7] and requires accurate quantification of the pointwise field/power density level.
Standard methods for evaluating these fields typically rely on metallic near-field probes connected to a signal and spectrum analyzer. While precise in terms of frequency response, this approach has significant drawbacks in near-field dosimetry. The physical presence of a metallic probe within the reactive near-field can scatter the waves, distorting the truthful distribution it is trying to measure—a challenge that remains a focal point in contemporary electromagnetic research [8]. Additionally, mechanical scanning is time-intensive and may fail to capture fast thermal dynamics.
To address these limitations, this paper explores Transient Infrared (IR) Thermography as a high-resolution, non-invasive alternative for RF field mapping [9,10,11]. By observing how a substrate heats up in the first few hundred milliseconds of radiofrequency (RF) exposure, we can calculate the specific absorption rate (SAR) of energy deposition in the dielectric material directly from the thermal slope, before heat conduction blurs the energy distribution. To ensure the reliability of this thermal approach, we cross-validate the results with traditional electric (E)-field mappings. By comparing the thermal “footprint” of a previously introduced metasurface with the measured E-field distribution at various distances (2 mm and 22 mm), we aim to provide a more holistic view of how energy is deposited on and near metasurfaces. The present study targets the sub-6GHz frequency band of the 5G spectrum.
2. Materials and Methods
2.1. Metasurface Design and Fabrication
The experimental study focuses on two versions of sinusoidally modulated HISs, introduced in [12]. Referring to the unit cell structures “1” and “2” in [12], the large extension HISs, respectively V1 and V2, are realized by their periodic arrangement in 11 × 12-unit cells. Both prototypes were fabricated on an Arlon AD430 substrate, with a dielectric constant εr = 4.3 and a very low dissipation factor tan δ = 0.0009 at 2–2.5 GHz [12]. The unit cell consists of a modulated microstrip line, whose transverse dimension is modulated to assure a sinusoidal profile of the media parameter, namely the effective dielectric constant. Such an appearance presents an analytically known dispersion diagram in terms of Mathieu’s and Hill’s functions for the transversal-electric (TE) and transversal-magnetic™ polarized surface waves, respectively. The traveling waves along the surface are bounded below the light-line or can leak above it.
In the present study, the investigation targets the behavior of the first bounded wave; hence, no radiation is expected. However, considering the open resonator, represented by each unit cell, in the proximity of the surface, a fringing field is present.
2.2. Near-Field E-Field Mapping Setup
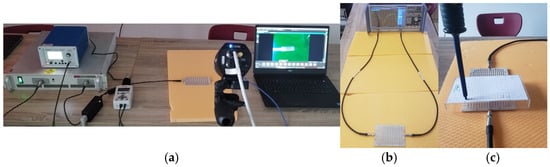
To establish a baseline for the EM distribution, we performed near-field scanning using a high-precision experimental setup. One of the central lines of the metasurfaces was excited using a signal generator at a controlled input power of 5 dBm (see Figure 1). The E-field strength was mapped using a calibrated near-field probe (PBS—E1 from Aaronia) at two distinct heights above the HIS–air interface: (a) 2 mm distance: to capture the reactive near-field and the high-intensity energy localization (hot-spots) directly at the substrate-air boundary; (b) 22 mm distance: to evaluate the field distribution at a safety-relevant distance, simulating the interaction with a nearby user or biological tissue.
Figure 1.
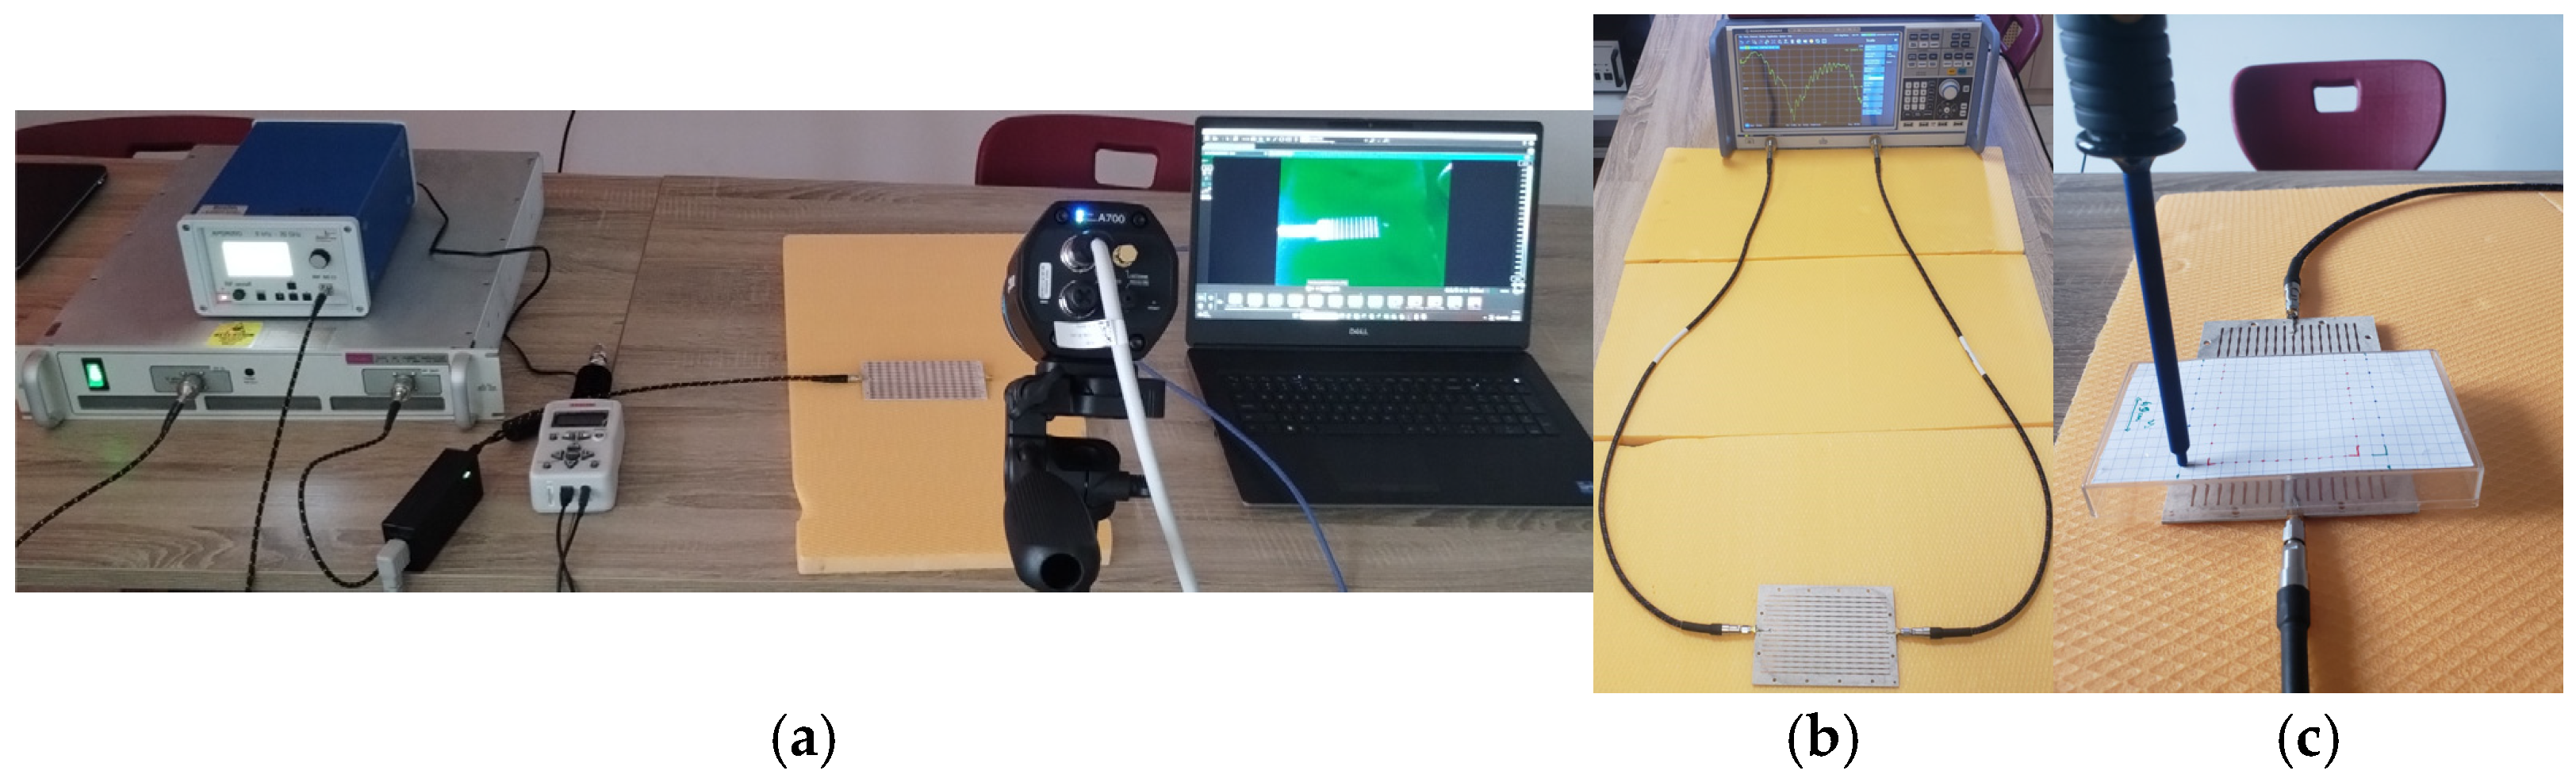
(a) Measurement system setup showing the RF generator, amplifier, power meter, FLIR A400 IR camera and HIS metasurfaces; (b) VNA measurement; (c) the E-field probe and field scanning are shown above the HIS V2 prototype.
The transmission coefficient S21 was recorded (not reported here, but presented in [11,12]) across a wide frequency range (from 5 GHz to over 12 GHz) with a vector network analyzer (VNA; model: Rohde&Schwarz ZNB 40 (Germany)) to identify the propagation bands and the stop-band regions where surface waves are suppressed.
2.3. C. Transient IR Thermography and SAR Estimation
The thermal characterization was conducted using a high-resolution Teledyn FLIR A400 IR camera (USA) with a macrolens, mounted on a fixed tripod to ensure spatial stability between frames. The metasurfaces were energized at medium power levels (1–3 W) to induce a detectable thermal gradient. The core of our methodology relies on the Transient Slope Method. Unlike steady-state thermography, which is affected by lateral heat conduction and environmental convection, the transient method focuses on the first 500–1000 ms of RF exposure. In this initial phase, the rate of temperature increase dT/dt is directly proportional to the localized energy deposition. The local SAR is then estimated using the formula SAR = Cp × (dT/dt), where Cp is the specific heat capacity of the Arlon AD430 substrate (1100 J/kg·K). This approach allows us to “freeze” the EM footprint before it diffuses, providing a high-fidelity map of the RF energy deposition.
Figure 1 indicates the main components of the experimental setup.
3. Results and Discussion
3.1. Electromagnetic Characterization via E-Field Mapping
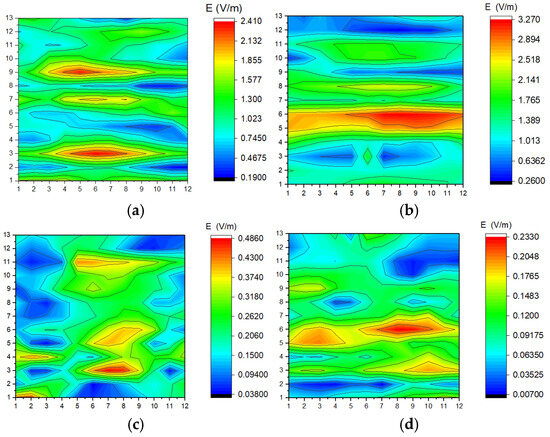
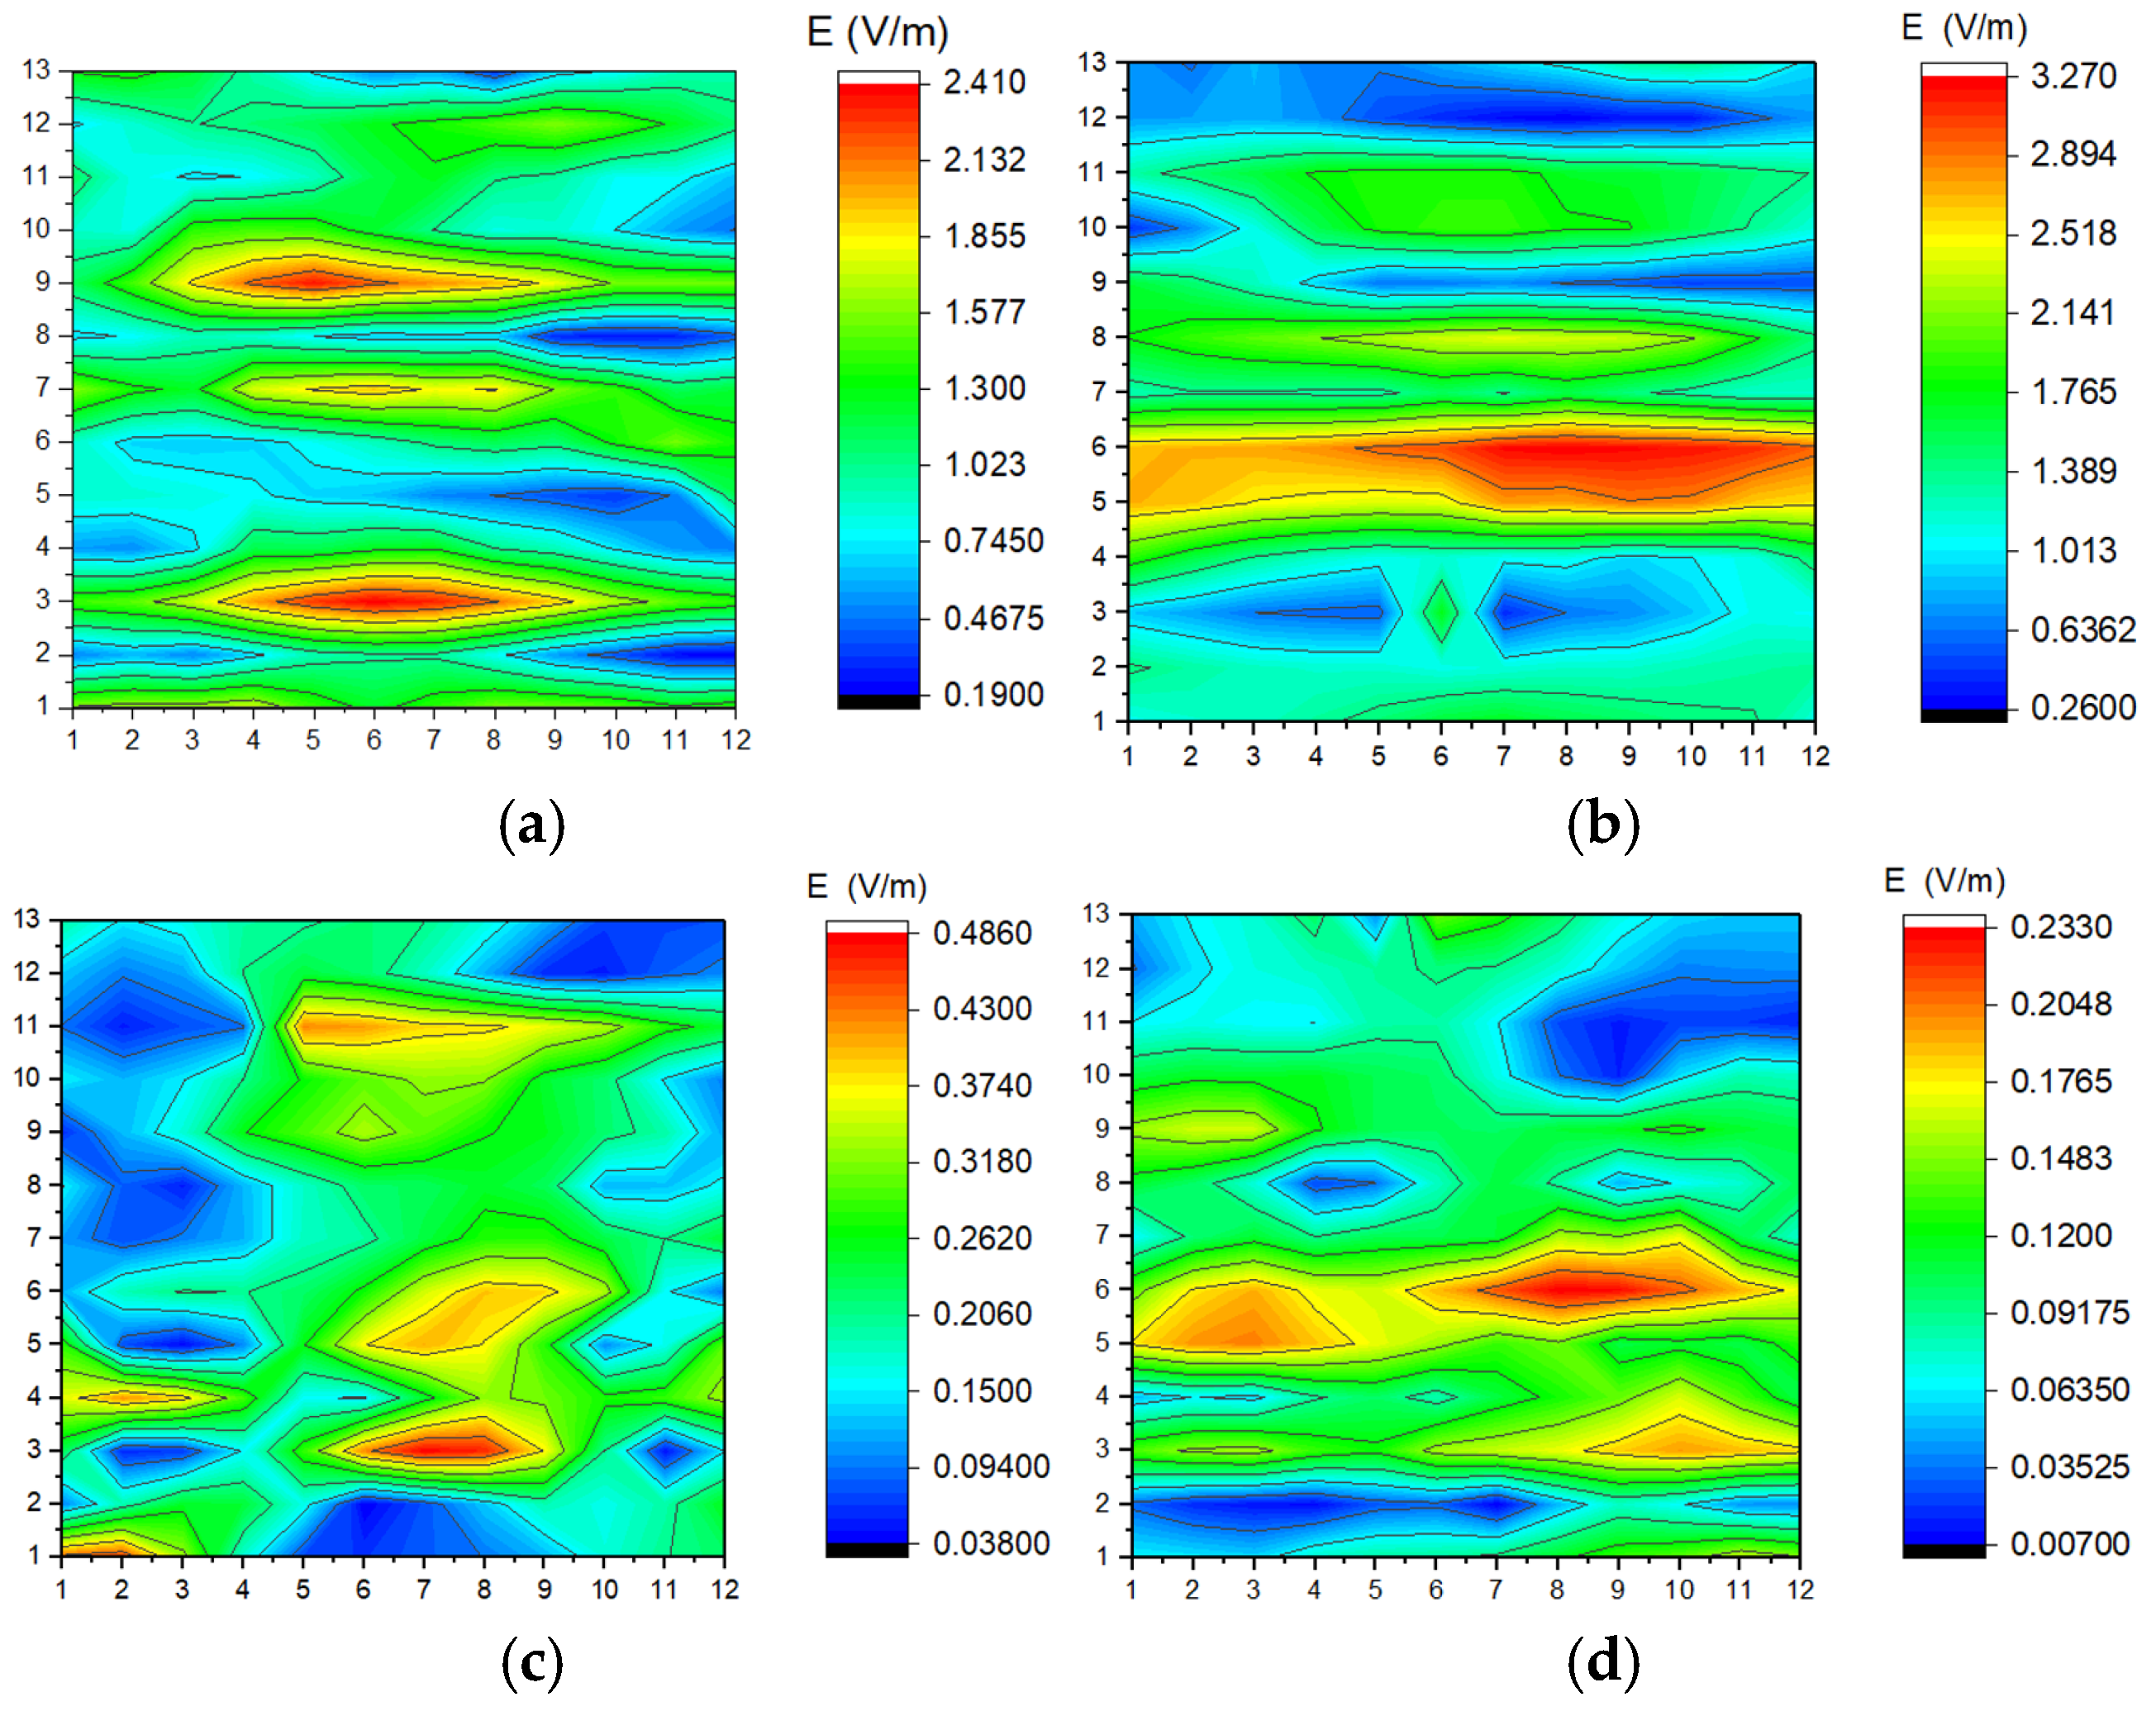
The EM behavior of the two metasurfaces, V1 and V2, was first evaluated through near-field scanning. The S21 parameters and corresponding E-field distributions (measured at 22 mm) reveal distinct propagation characteristics across the analyzed spectrum.
As shown in our measurements (Figure 2), Version V1 exhibits strong surface wave transmission at lower frequencies: at 5.65 GHz S21 = −2.065 dB and at 6.23 GHz S21 = −2.974 dB, the E-field is well-defined, reaching localized intensities that indicate efficient wave guiding along the modulated interface. Conversely, at higher frequencies such as 10.30 GHz (S21 = −58.41 dB), the metasurface enters a “stop-band” regime. Here, the E-field is drastically attenuated, confirming the high impedance nature of the surface, which prevents wave propagation.
Figure 2.
(a) E-field maps at 22 mm distance from the surface of prototype V1: (a) f = 5.65 GHz; S21 = −2.065 dB; (b) f = 6.23 GHz; S21 = −2.974 dB; (c) f = 10.30 GHz; S21 = −58.412 dB; (d) f = 12.49 GHz; S21: −49.99 dB. In all plots, microstrip lines are vertical.
Version V2 demonstrates even higher energy localization. At 5 GHz (S21 = −2.67 dB), the peak E-field intensity was measured, showing a more concentrated hot-spot compared to V1. This suggests that the specific modulation period in V2 enhances the near-field concentration, which is a critical factor for both signal gain and SAR considerations.
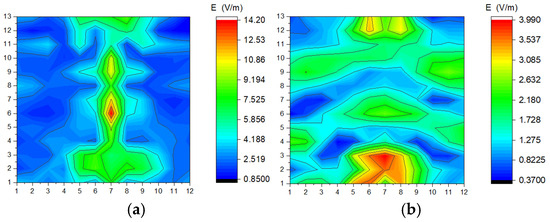
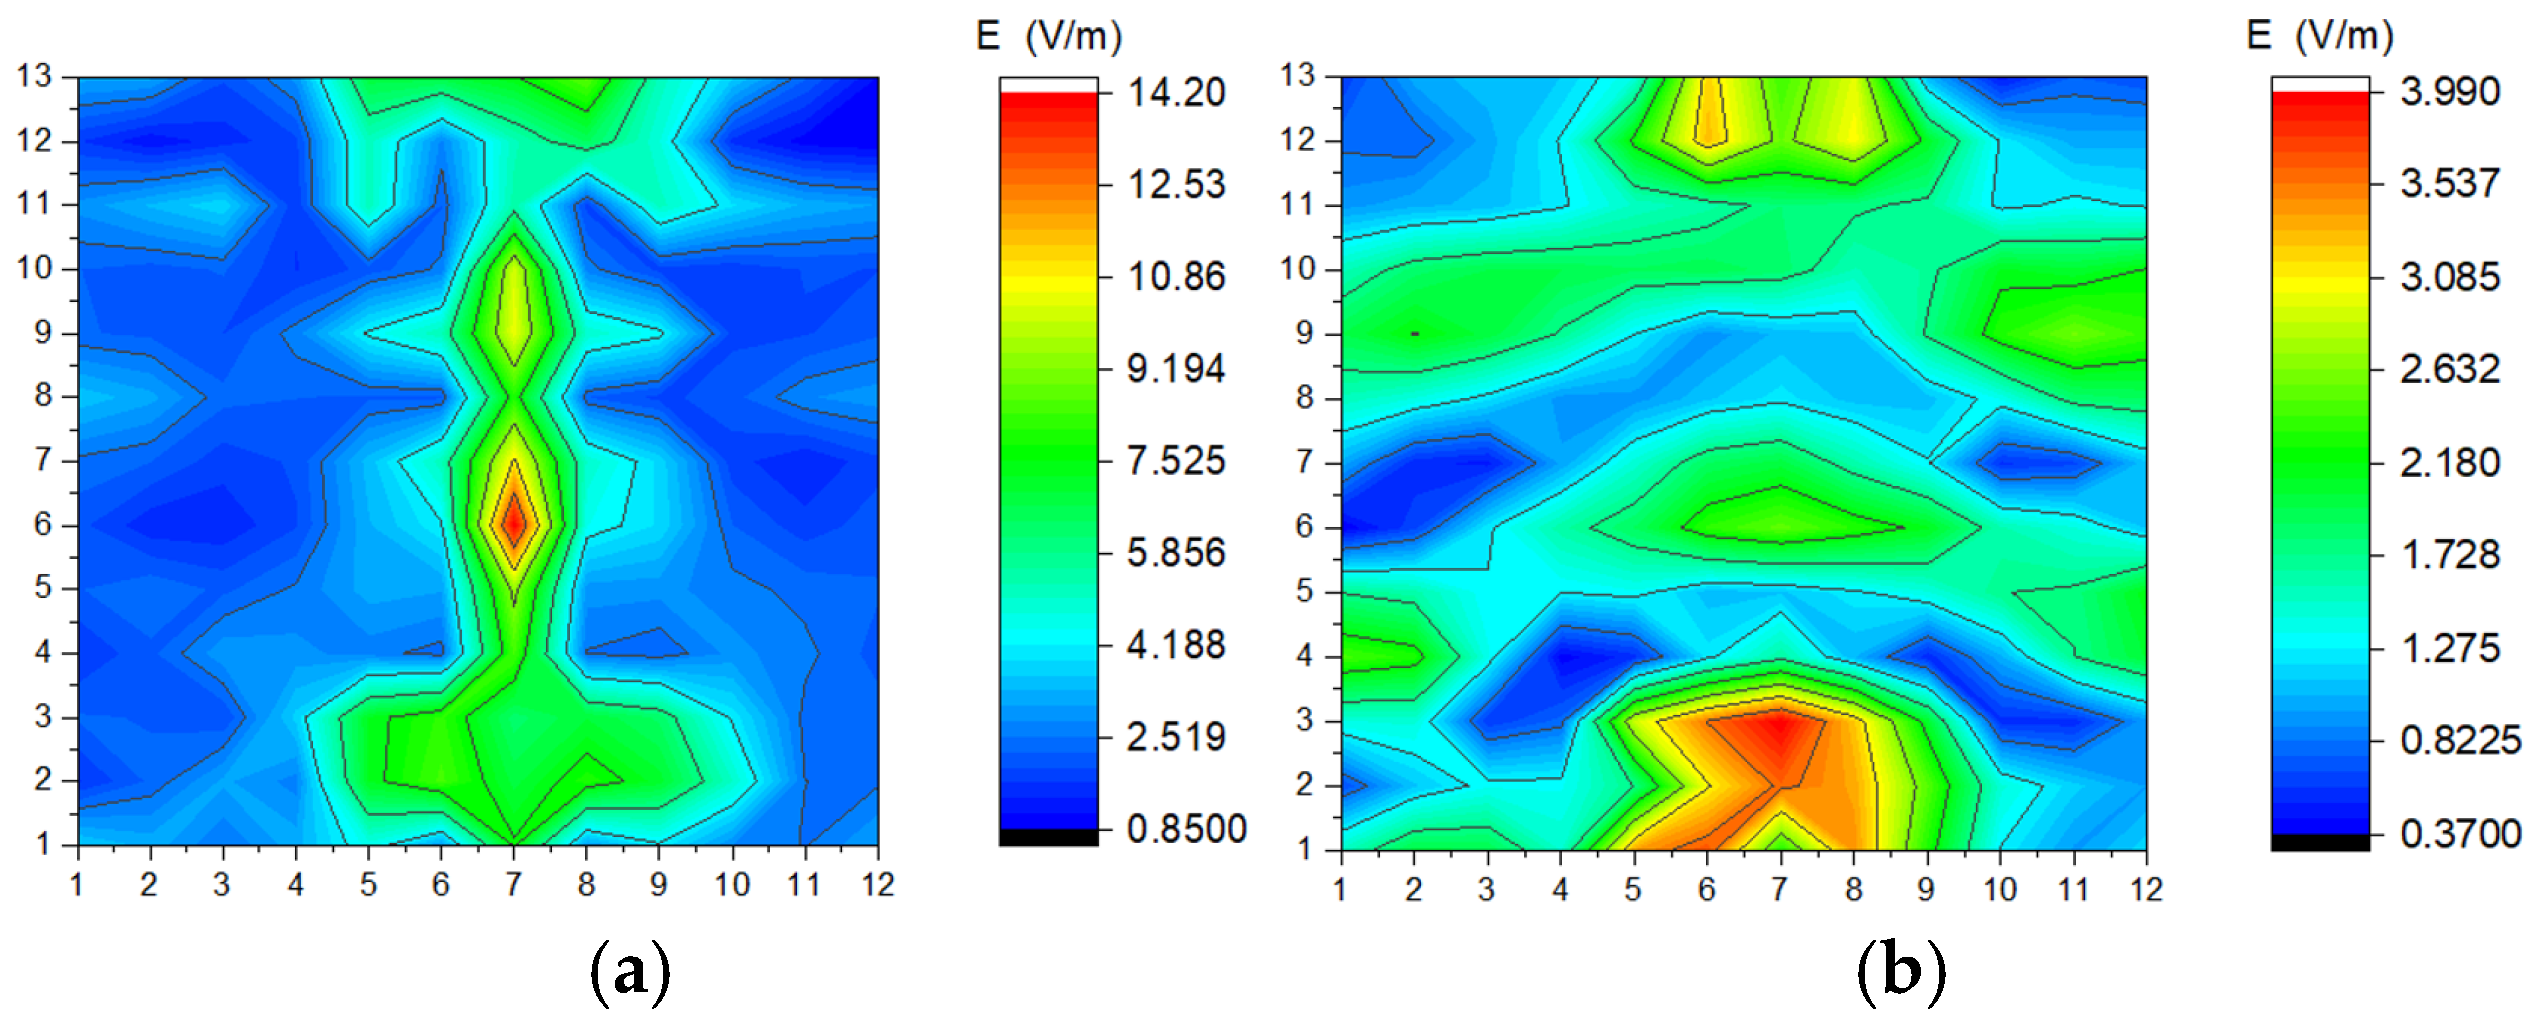
A comparative analysis between the E-field distribution at 2 mm and 22 mm provides deeper insights into the energy confinement capabilities of the metasurfaces (Figure 3a compared against Figure 2a and Figure 3b against Figure 2c). At a distance of 2 mm, the field mapping reveals a highly granular distribution, where the peak intensities (reaching up to 14.2 V/m for V1 at resonance) perfectly align with the physical modulation of the HIS. As the distance increases to 22 mm, a spatial smoothing effect is observed, with the peak field strength decreasing by approximately 83.1%. This rapid decay confirms that the EM energy is predominantly stored in surface wave modes, which is a critical observation for validating the transient thermal response measured by the IR camera at the substrate level.
Figure 3.
(a) E-field maps at 2 mm distance from the surface of prototype V1: (a) f = 5.65 GHz; S21 = −2.065 dB; (b) f = 10.30 GHz; S21 = −58.412 dB. In all plots, microstrip lines are vertical.
3.2. Thermal Analysis and SAR Correlation
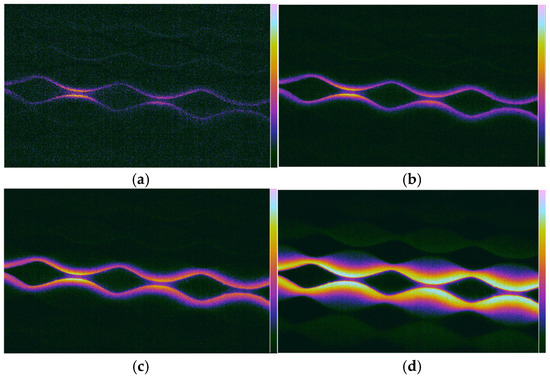
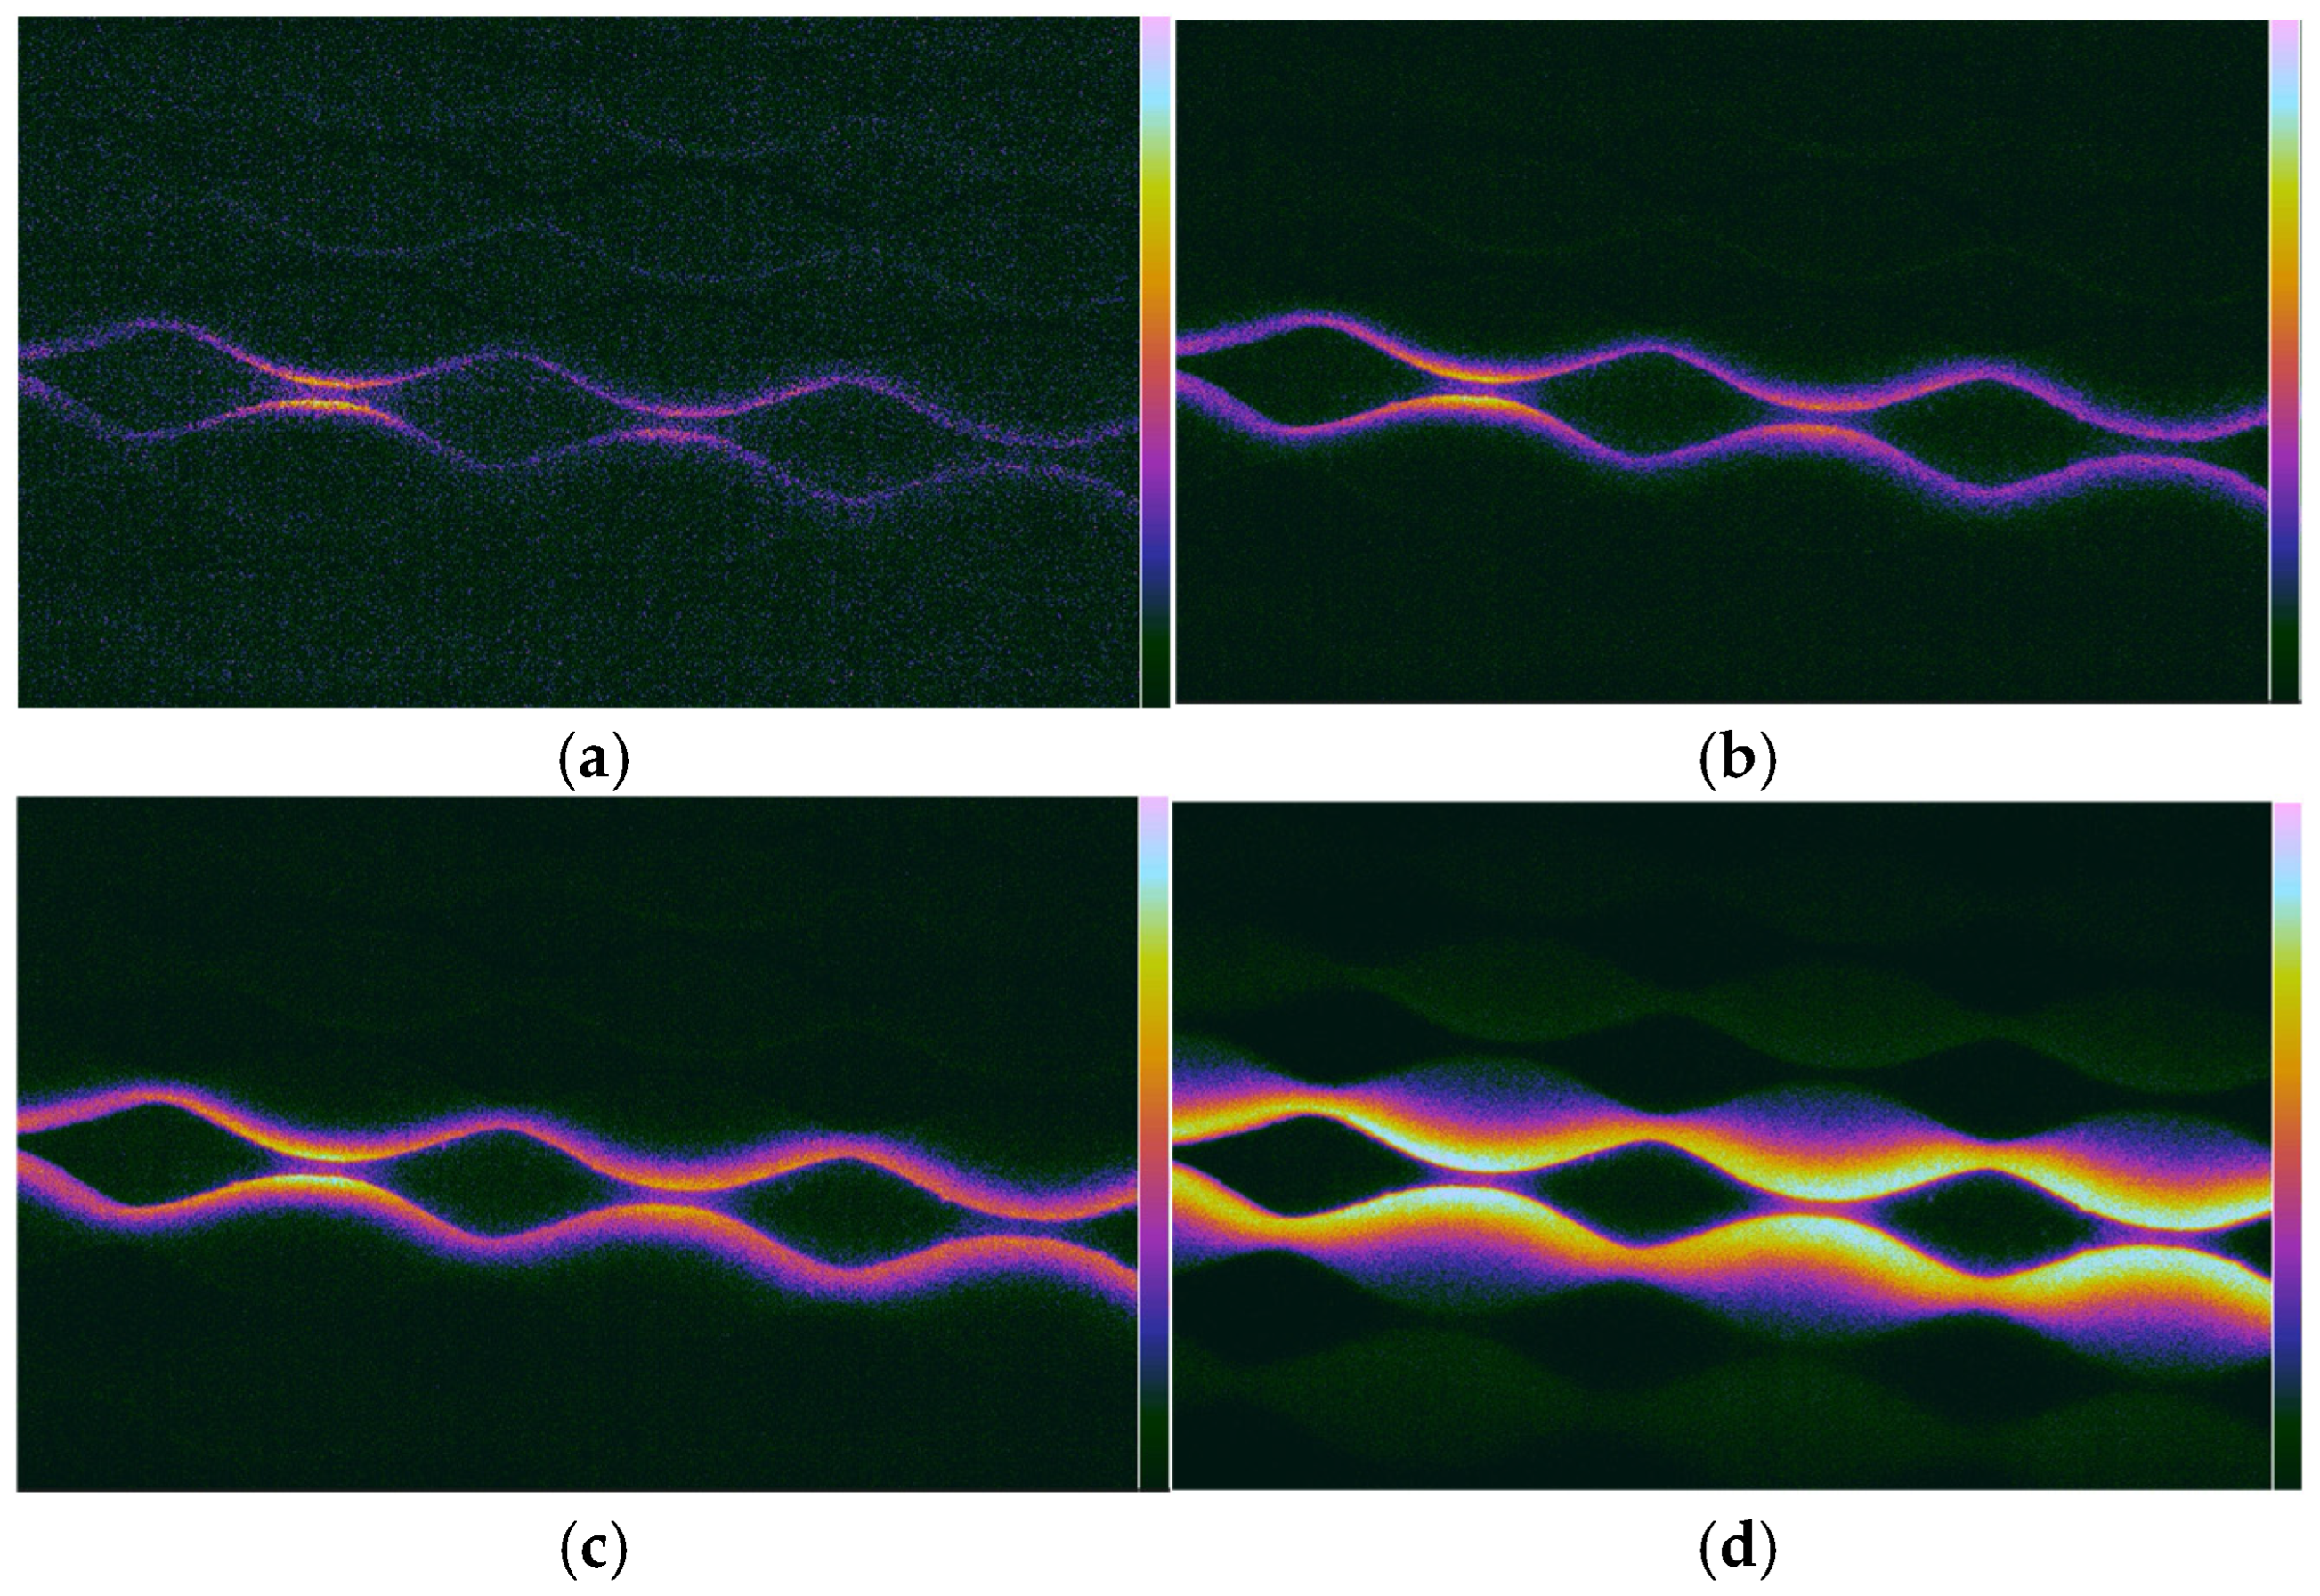
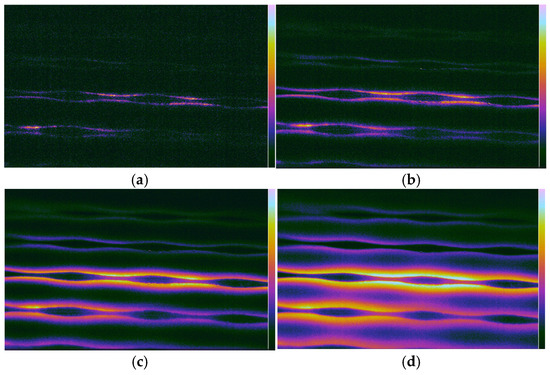
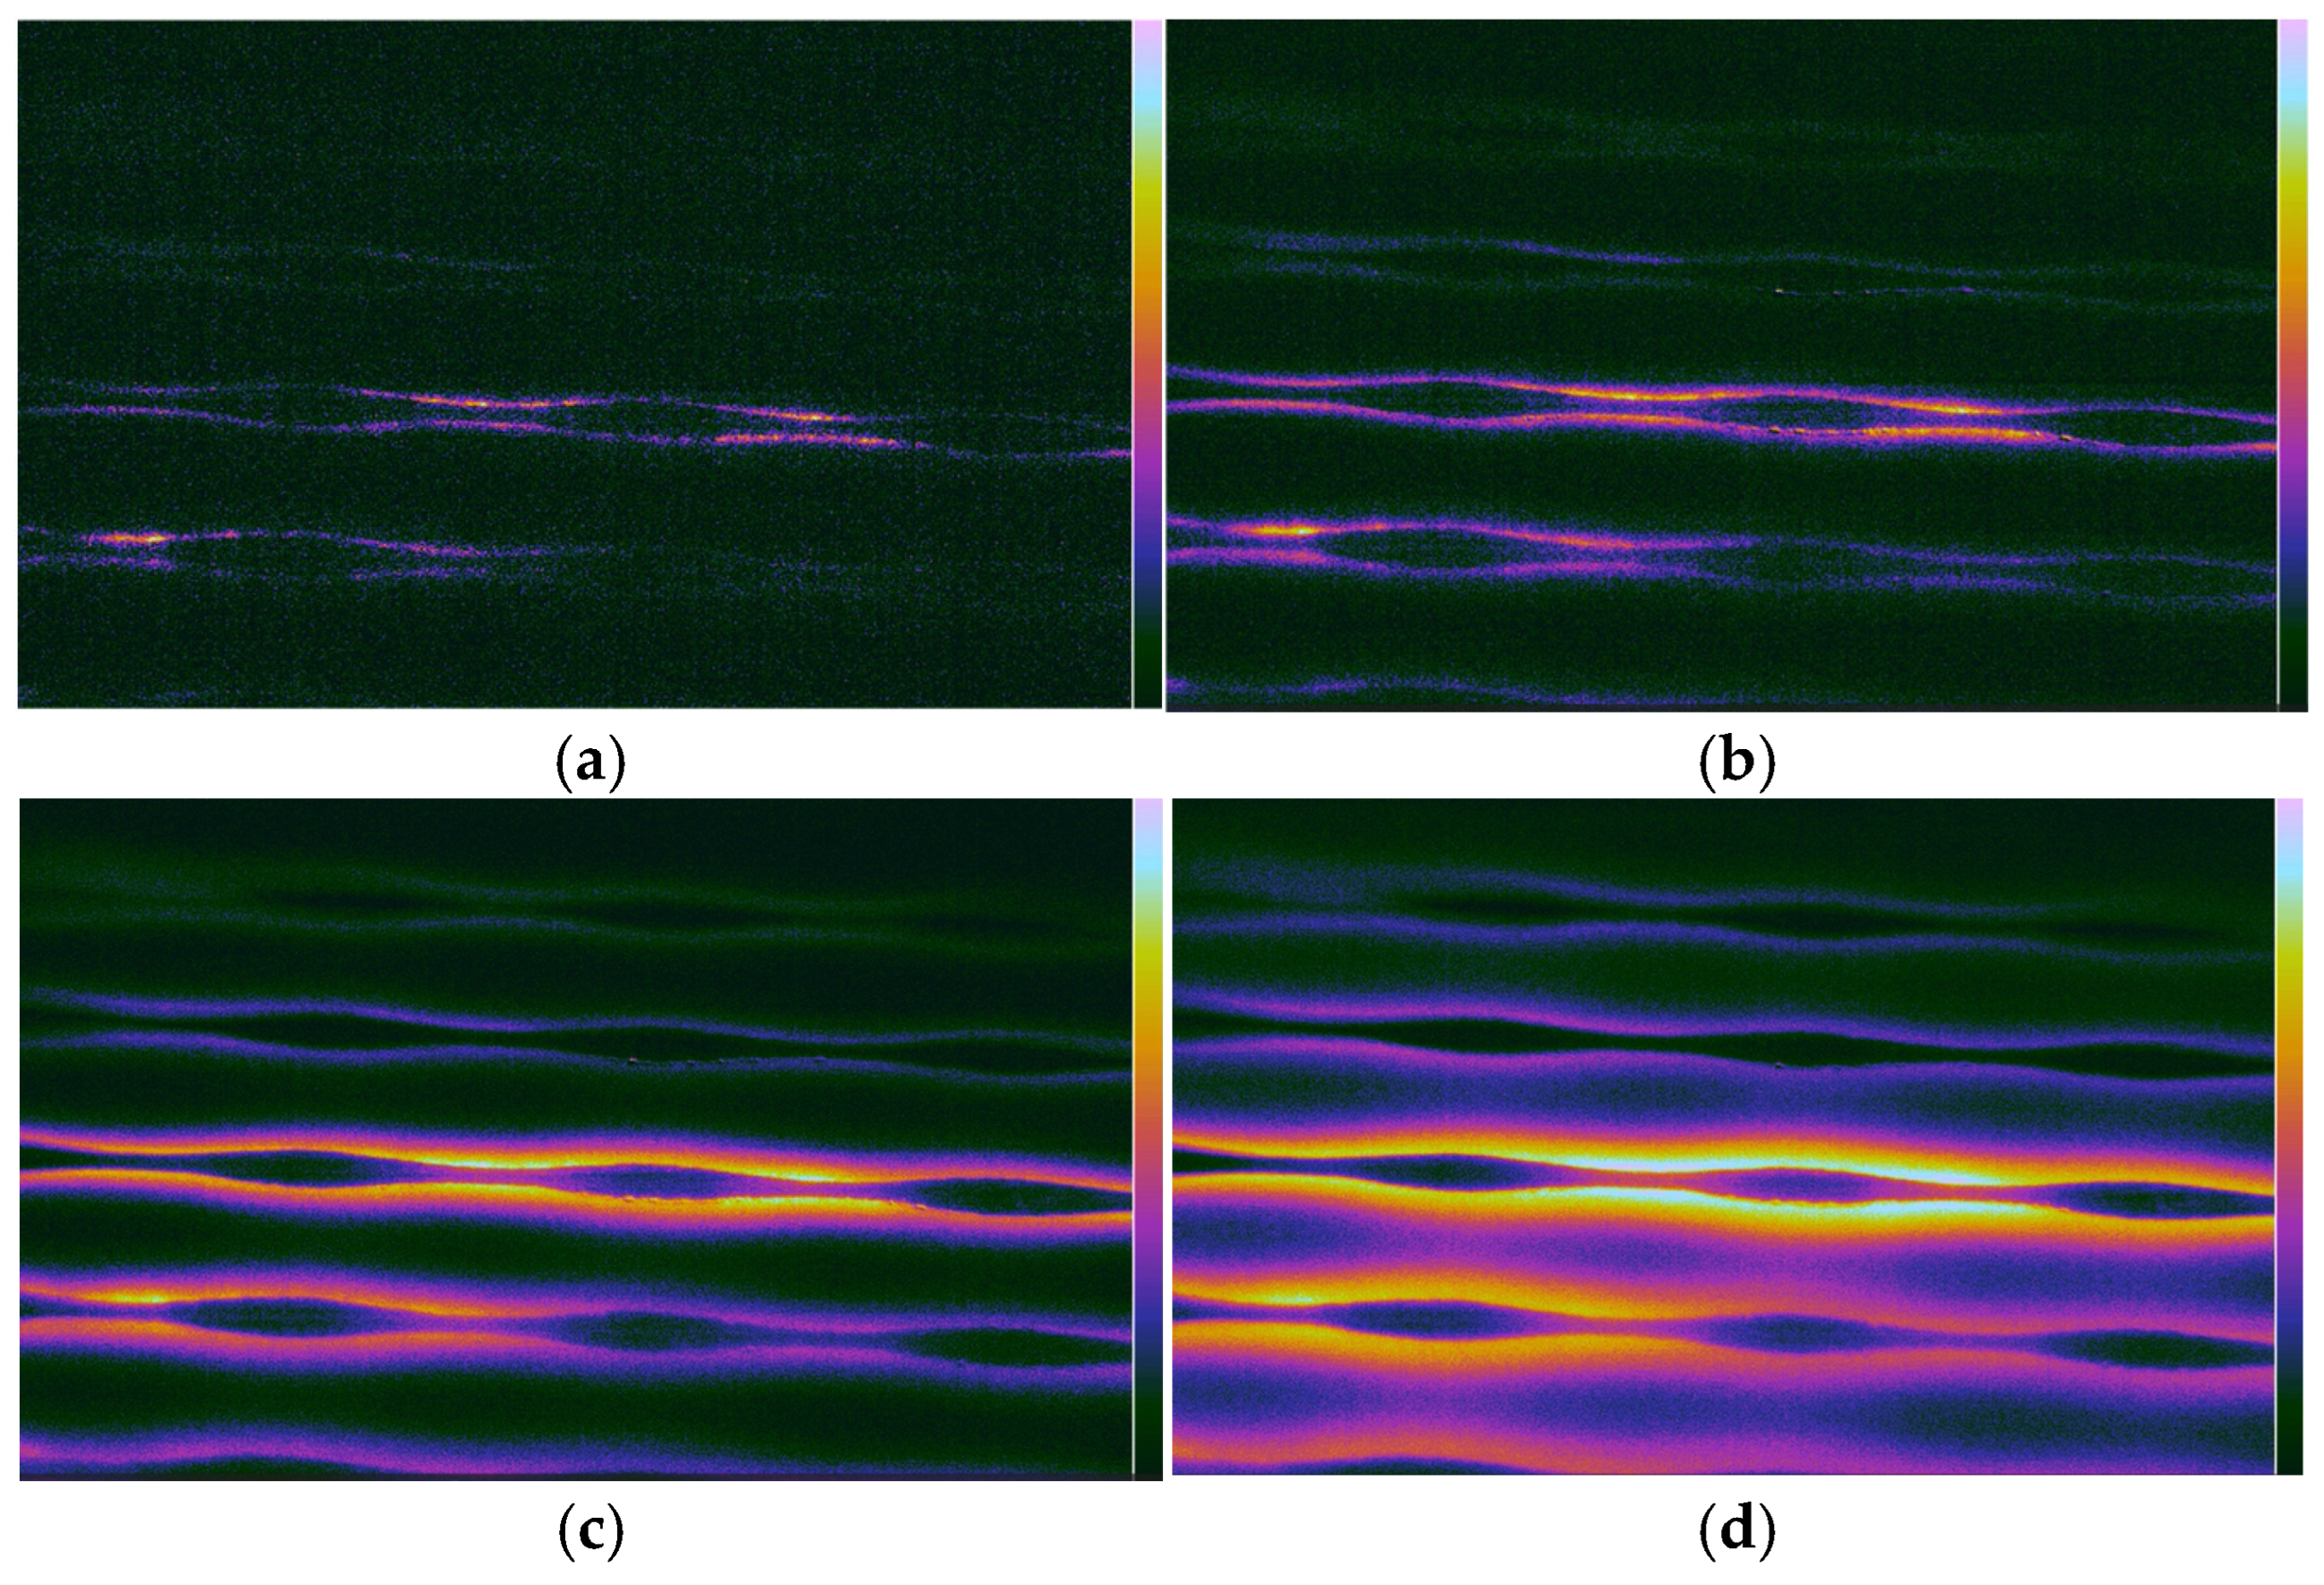
The IR thermography results (Figure 4 and Figure 5) correlate remarkably well with the E-field maps. While the E-field maps provide the orthogonal to the HIS component of the signal (measurement performed by a single linear polarized field probe positioned orthogonal to the HIS surface), the thermal maps provide a scalar proxy of the total energy absorbed by the substrate. During the transient phase (first 8–14 s of exposure), the “hot-spots” identified in the IR spectra coincide spatially with the regions of maximum E-field intensity recorded at 2 mm and 22 mm. Specifically, for a 3 W input power, the thermal gradient (dT/dt) in the first second of exposure was used to estimate the peak spatial SAR. By applying the SAR formula for Arlon AD430, we observed that the areas of maximum S21 (transmission) are the same areas where the localized SAR is the highest.
Figure 4.
V1 prototype: IR image frames obtained with macrolens after (a) 8 s of excitation; (b) 14 s of excitation; (c) 24 s of excitation; (d) 38 s of excitation.
Figure 5.
V2 prototype: IR image frames obtained with macrolens after (a) 8 s of excitation; (b) 14 s of excitation; (c) 24 s of excitation; (d) 38 s of excitation.
3.3. Impact of Distance on Field Distribution
A crucial finding in this study is the evolution of the field from 2 mm to 22 mm. At 2 mm, the E-field is highly granular, following the exact geometry of the sinusoidal modulation. At 22 mm, the field becomes more diffuse due to the propagation of the reactive near-field. One can also note the one-order-of-magnitude difference between the plots in Figure 2a–d, demonstrating the expected result that the surface wave tail (similarly to the fiber optical transmission) decays rapidly (approximately as 1/r2), allowing an application-dependent safety distance to be defined based also on the feeding power of the device.
This diffusion is mirrored in the IR images at longer feeding times (e.g., 38 s), where lateral heat conduction in the Arlon substrate mimics the spatial spreading of the EM field. This confirms that Transient IR Thermography (capturing the image early) is superior to steady-state thermography for precise SAR mapping, as it prevents this natural diffusion from masking the peak energy points.
4. Conclusions
This study successfully demonstrated the effectiveness of Transient IR Thermography as a surrogate method for near-field electromagnetic mapping and SAR estimation. Beyond the technical characterization of metasurfaces, the findings have direct implications for human exposure assessment at different frequency bands, from S-band to millimeter waves.
High-Fidelity Bio-Dosimetry: The spatial distribution of thermal gradients captured in the first 1000 ms aligns perfectly with the E-field maps. This confirms that transient thermography can accurately predict hot-spots on the skin surface, where the wave energy is predominantly absorbed due to the small penetration depth.
Quantifying Surface Exposure: We observed an 83.1% reduction in E-field strength from 2 mm to 22 mm. This steep decay emphasizes that for users in close proximity to 5G HIS-based antennas, SAR evaluation must be performed at the millimeter scale to avoid underestimating localized thermal stress on epithelial tissues.
Non-Invasive Safety Auditing: Unlike metallic probes that perturb the reactive near-field, the IR-based approach allows for a “true-to-life” visualization of energy deposition. This is critical for validating that metasurface designs comply with ICNIRP guidelines, ensuring that signal enhancement does not lead to localized SAR levels exceeding safety thresholds in human subjects.
Future Directions: The proposed methodology bridges the gap between antenna engineering and biological safety. Future work will focus on applying this transient thermal mapping to skin-equivalent phantoms to further refine the correlation between metasurface modulation and actual thermal rise in multilayered biological structures.
Author Contributions
Conceptualization, S.M.; methodology, S.M. and L.M.; software, M.E.; validation, S.M., M.E. and L.M.; formal analysis, S.M.; investigation, S.M. and M.E.; resources, S.M.; data curation, S.M.; writing—original draft preparation, S.M.; writing—review and editing, S.M. and L.M.; visualization, L.M.; supervision, S.M. and L.M.; project administration, S.M.; funding acquisition, S.M. and L.M. All authors have read and agreed to the published version of the manuscript.
Funding
This research received no external funding.
Institutional Review Board Statement
Not applicable.
Informed Consent Statement
Not applicable.
Data Availability Statement
The original contributions presented in this study are included in the article. Further inquiries can be directed to the corresponding author.
Conflicts of Interest
The authors declare no conflicts of interest.
References
- Rappaport, T.S.; Xing, Y.; Kanhere, O.; Ju, S.; Madanayake, A.; Mandal, S.; Alkhateeb, A.; Trichopoulos, G.C. Wireless communications and applications above 100 GHz: Opportunities and challenges for 6G and beyond. IEEE Access 2019, 7, 78729–78757. [Google Scholar] [CrossRef] [Scilit]
- Barbuto, M.; Hamzavi-Zarghani, Z.; Longhi, M.; Monti, A.; Ramaccia, D.; Vellucci, S.; Toscano, A.; Bilotti, F. Metasurfaces 3.0: A New Paradigm for Enabling Smart Electromagnetic Environments. IEEE Trans. Antennas Propag. 2022, 70, 8883–8897. [Google Scholar] [CrossRef] [Scilit]
- Tang, W.; Chen, M.; Xu, W.; Zhang, Z.; Li, Y.; Han, S. Wireless communications with programmable metasurface: New paradigms, opportunities, and challenges on transceiver design. IEEE Wirel. Commun. 2020, 27, 180–187. [Google Scholar] [CrossRef] [Scilit]
- Li, Z.; Tian, X.; Qiu, C.; Ho, J. Metasurfaces for bioelectronics and healthcare. Nat. Electron. 2021, 4, 382–391. [Google Scholar] [CrossRef] [Scilit]
- Estakhri, N.M.; Cheng, M.; Estakhri, N.M. Near-Field Hot Spots Using Patterned Metasurfaces; Photonics North (PN): Vancouver, BC, Canada, 2024; pp. 1–2. [Google Scholar]
- International Commission on Non-Ionizing Radiation Protection (ICNIRP). Guidelines for limiting exposure to electromagnetic fields (100 kHz to 300 GHz). Health Phys. 2020, 118, 483–524. [Google Scholar] [CrossRef] [Scilit]
- Foster, K.; Chou, C.; Omar, A. Health Aspects of Millimeter-Wave Exposures in 5G and Beyond: Millimeter Waves and Health. IEEE Microw. Mag. 2025, 26, 70–82. [Google Scholar] [CrossRef] [Scilit]
- Han, D.; Wei, X.; Wang, D.; Gao, R. An Improved Spectral Probe Calibration for Near-Field to Far-Field Transformation. IEEE Trans. Instrum. Meas. 2025, 74, 6004908. [Google Scholar] [CrossRef] [Scilit]
- Van Der Weide, D.; Kendig, D.; Shakouri, M. High-Speed Thermal Imaging Can Resolve Short RF Pulse Effects in Tissue Models. IEEE J. Electromagn. RF Microw. Med. Biol. 2024, 8, 201–205. [Google Scholar] [CrossRef] [Scilit]
- Miclaus, S.; Matekovits, L. Non-invasive near-field characterization of Bloch mode dispersion in sinusoidally modulated metasurfaces via transient infrared thermography. Sci. Rep. 2026; submitted.
- Miclaus, S.; Elisabeth, M.; Matekovits, L. Experimental Characterization of the Traveling Wave Strength in Modulated Mi-crostrip-Line-Based High Impedance Surface Through Infrared Thermography. In Proceedings of the 2025 International Conference on Electromagnetics in Advanced Applications (ICEAA), Palermo, Italy, 8–12 September 2025; pp. 549–552. [Google Scholar]
- Matekovits, L.; Colome, G.C.V.; Orefice, M. Controlling the bandlimits of the surface wave propagation along a modulated microstrip-line-based high impedance surface. IEEE Trans. Antennas Propag. 2008, 56, 2555–2562. [Google Scholar] [CrossRef] [Scilit]
Disclaimer/Publisher’s Note: The statements, opinions and data contained in all publications are solely those of the individual author(s) and contributor(s) and not of MDPI and/or the editor(s). MDPI and/or the editor(s) disclaim responsibility for any injury to people or property resulting from any ideas, methods, instructions or products referred to in the content. |
© 2026 by the authors. Licensee MDPI, Basel, Switzerland. This article is an open access article distributed under the terms and conditions of the Creative Commons Attribution (CC BY) license.