


Abstract
In recent years, the rapid development of wireless personal, local, and cellular networks has fundamentally changed our daily lives, allowing for ubiquitous connectivity and access to new services. This technological evolution is accompanied by changes in the exposure to radio-frequency electromagnetic fields (RF-EMFs) in urban areas, raising important questions about potential health risks. This paper presents results for the temporal variation in RF-EMF exposure in urban areas in Bulgaria. Measurements of the electric field (E-field) were performed across multiple locations, on different days of the week, and at selected time periods to capture variations related to human activity and network usage. The results reveal temporal variation in E-field values, while all measured values remain significantly below established international exposure limits.
1. Introduction
In recent years, the rapid development of wireless personal, local, and cellular networks has fundamentally changed our daily lives, allowing for ubiquitous connectivity and access to new services. This technological evolution is accompanied by changes in exposure, primarily to radio-frequency electromagnetic fields (RF-EMFs), in both rural and urban areas, raising important questions about potential health risks [1,2,3]. Hence, the measurement of electromagnetic fields and the assessment of their compliance with the “reference levels” established in internationally recognized recommendations (such as ICNIRP [4] and Council Recommendation 1999/519/EC [5]) or with country-specific national limits (such as Ordinance No. 9 of 14 March 1991 of Bulgaria [6]) are essential for establishing the safety of public environments.
The results of measurements of EMFs within different microenvironments (public places and transport, indoor, etc.) show significant variability both over time and across locations. For example, data from monitoring networks in Romania [2] and Serbia [3] show that electric (E)-field levels vary significantly between cities. Similarly, E-field measurements from drive-test campaigns [3,7] reveal differences in exposure levels across European cities and countries. Moreover, results from 24 h continuous monitoring measurements at preselected locations (with a large number of transmitters) in the capital of Bulgaria, Sofia, indicate that EMF levels are close to the national limits set by Ordinance No. 9 [8]. Also, the analysis of the results presented in [2,3,8,9,10] shows a clear temporal pattern in the E-field within the public places, with the highest values around midday and the lowest at night. Hence, we can conclude that continuous EMF monitoring indisputably provides information on the temporal variation in the E-field (for example, from a single day to several years) [2,3], but measurements are limited to fixed spatial points. Spot (in situ) measurements, on the other hand, allow for spatial characterization of the E-field at multiple points in different microenvironments but do not provide information on temporal variation in the E-field.
This work aims to investigate temporal variations in EMFs across multiple locations in different microenvironments. To achieve this, a hybrid approach was introduced, involving in situ measurements at multiple locations in different microenvironments, performed three times per day (morning, afternoon, and evening) at each point, and repeated over two seasons (summer and winter). By applying the proposed hybrid approach, empirical data on the combined influence of time of day, season, and location on EMF levels were obtained and presented.
2. Microenvironments, Methodology, and Measurement Equipment
2.1. Microenvironments
All measurements were conducted in Blagoevgrad, a medium-sized city (population of 50,000–100,000), since no data on EMF exposure levels are currently available for this location. In comparison, in Bulgaria, EMF data are available only for the capital [8] and larger cities (populations of 100,000–400,000), such as Plovdiv [11] and Varna [12].
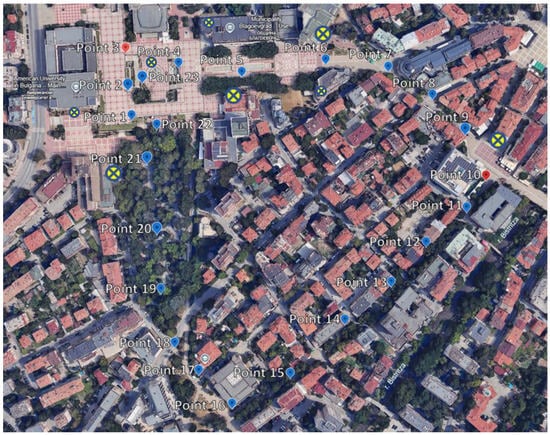
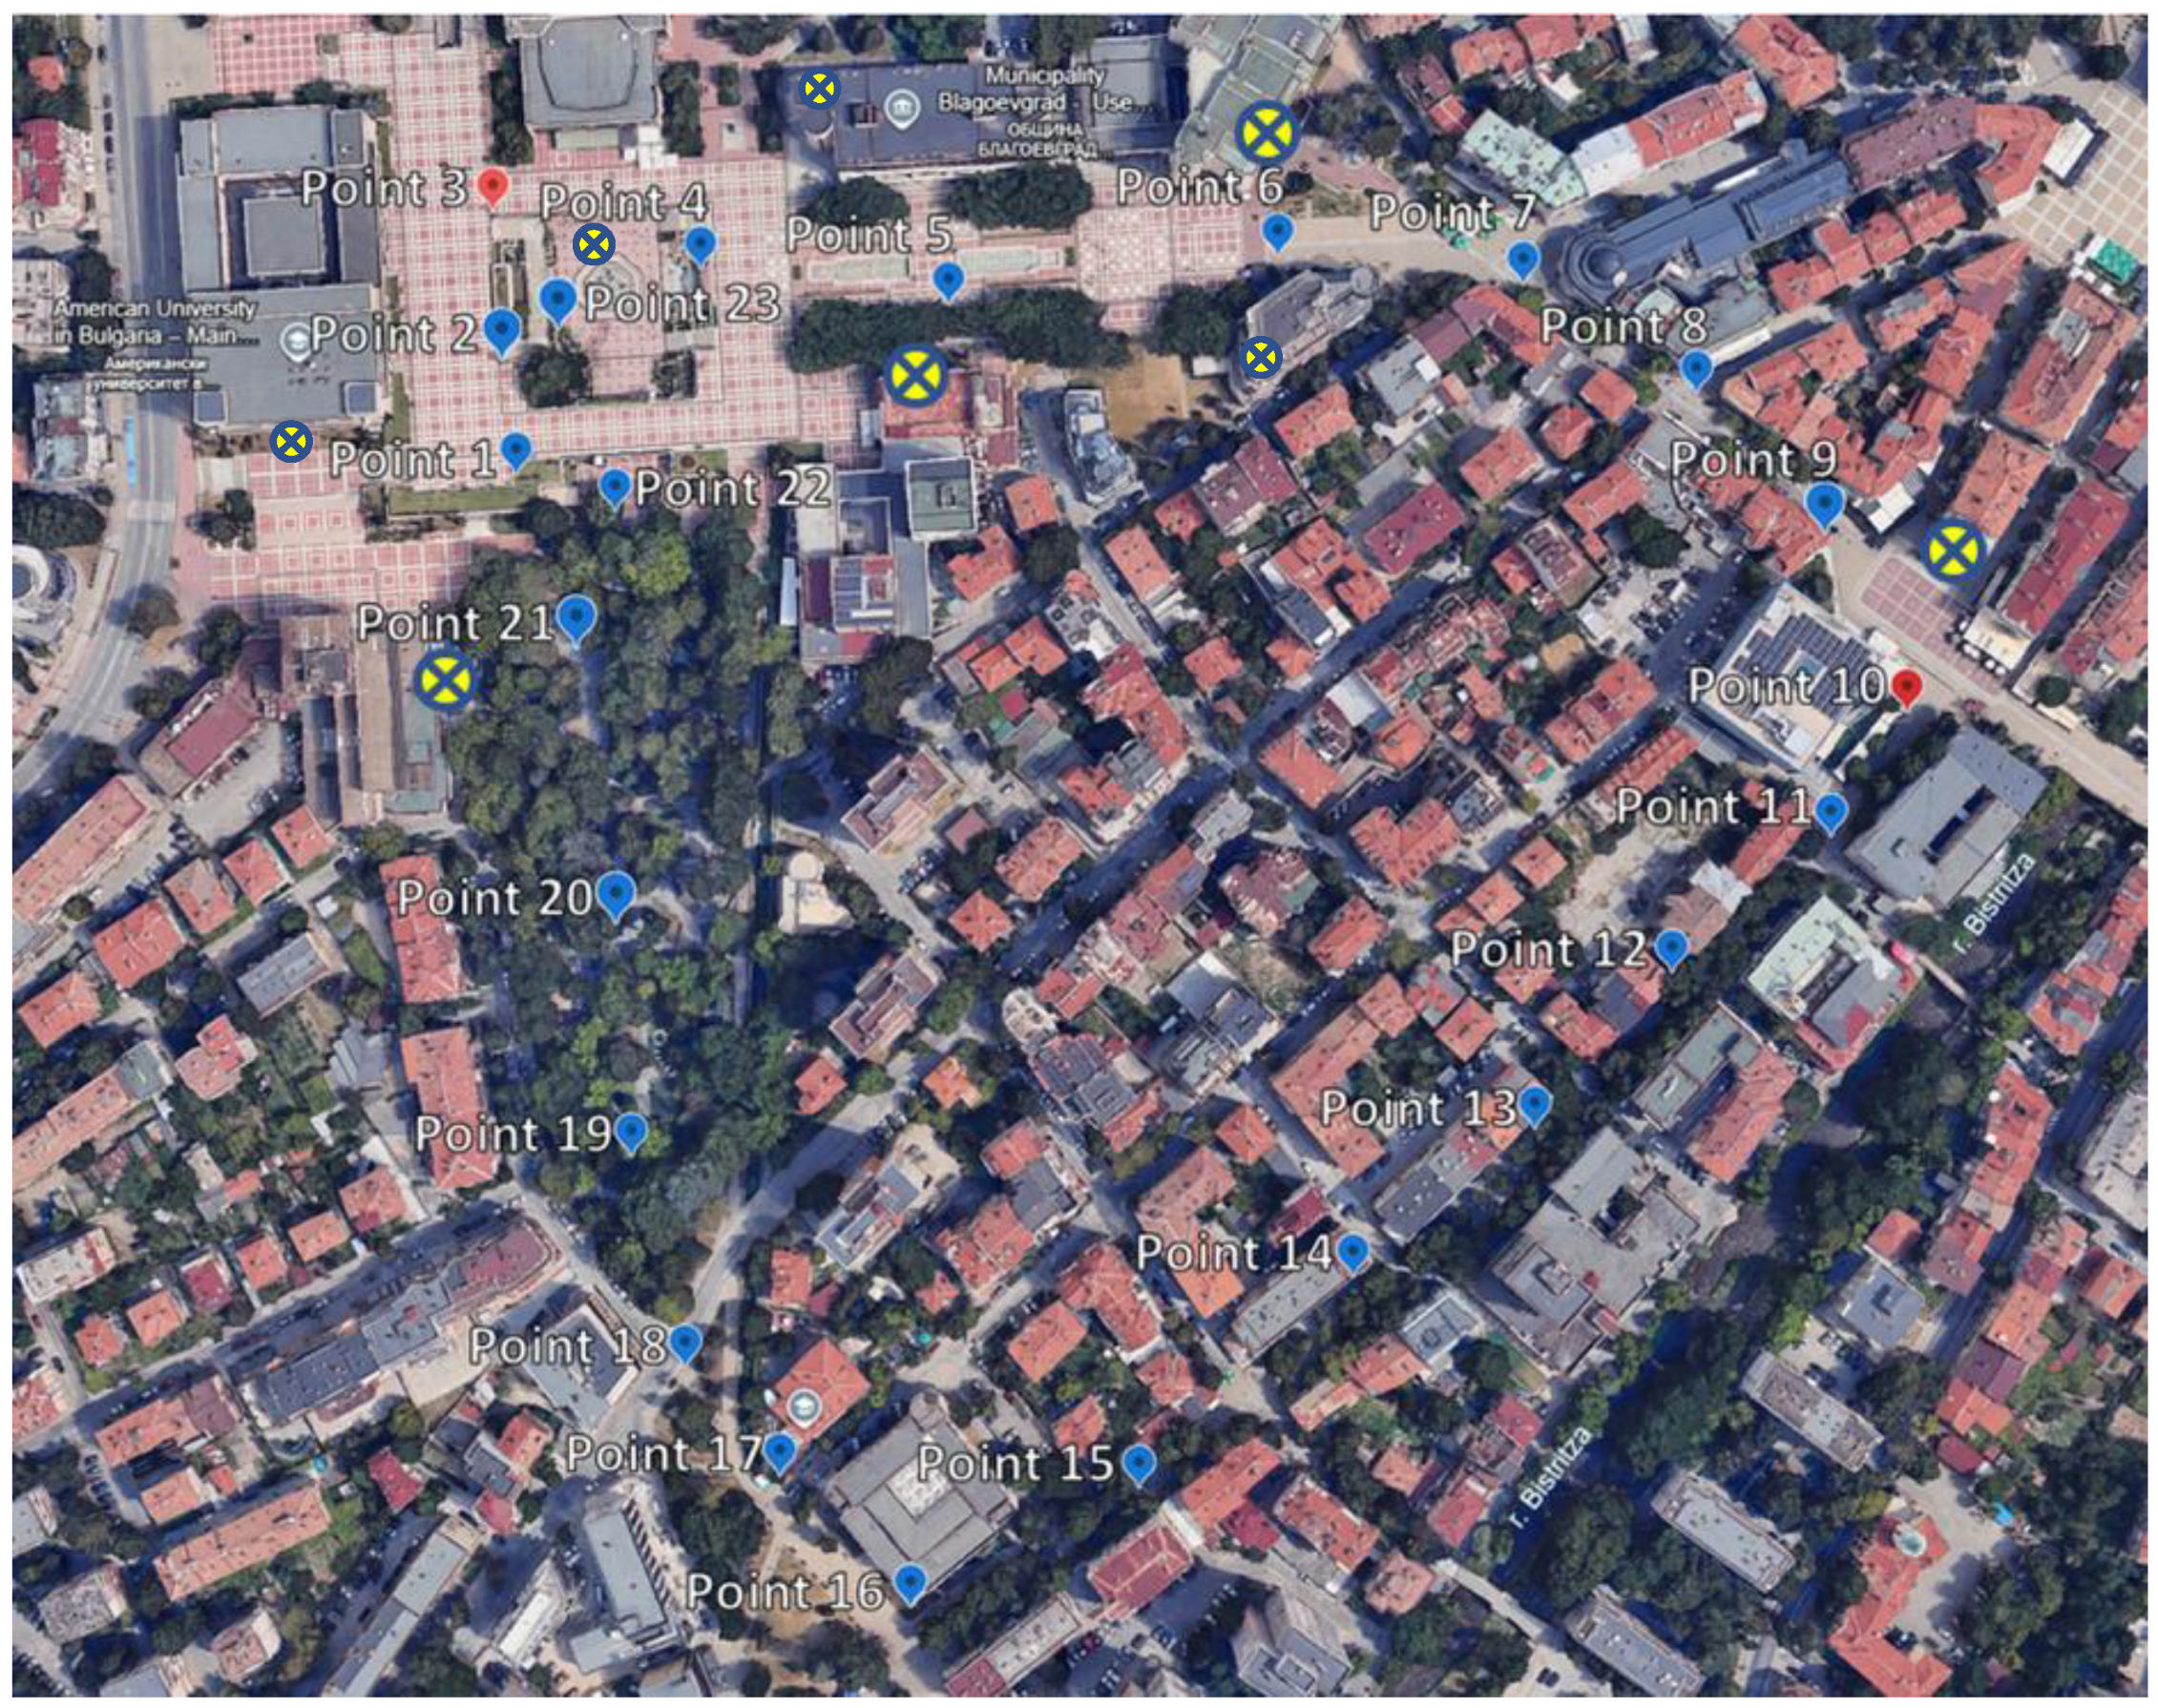
The measurements in Blagoevgrad were carried out in the central city area (see Figure 1), which is characterized by both high pedestrian density and the presence of base station antennas of all three Bulgarian mobile operators (supporting GSM, UMTS, LTE, and 5G standards).
Figure 1.
Map of the central part of Blagoevgrad showing EMF measurement points from 1 to 23. In the figure, the positions of the mobile operator antennas are marked with a yellow-filled circle and a blue outline.
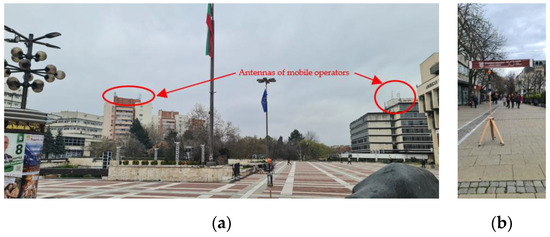
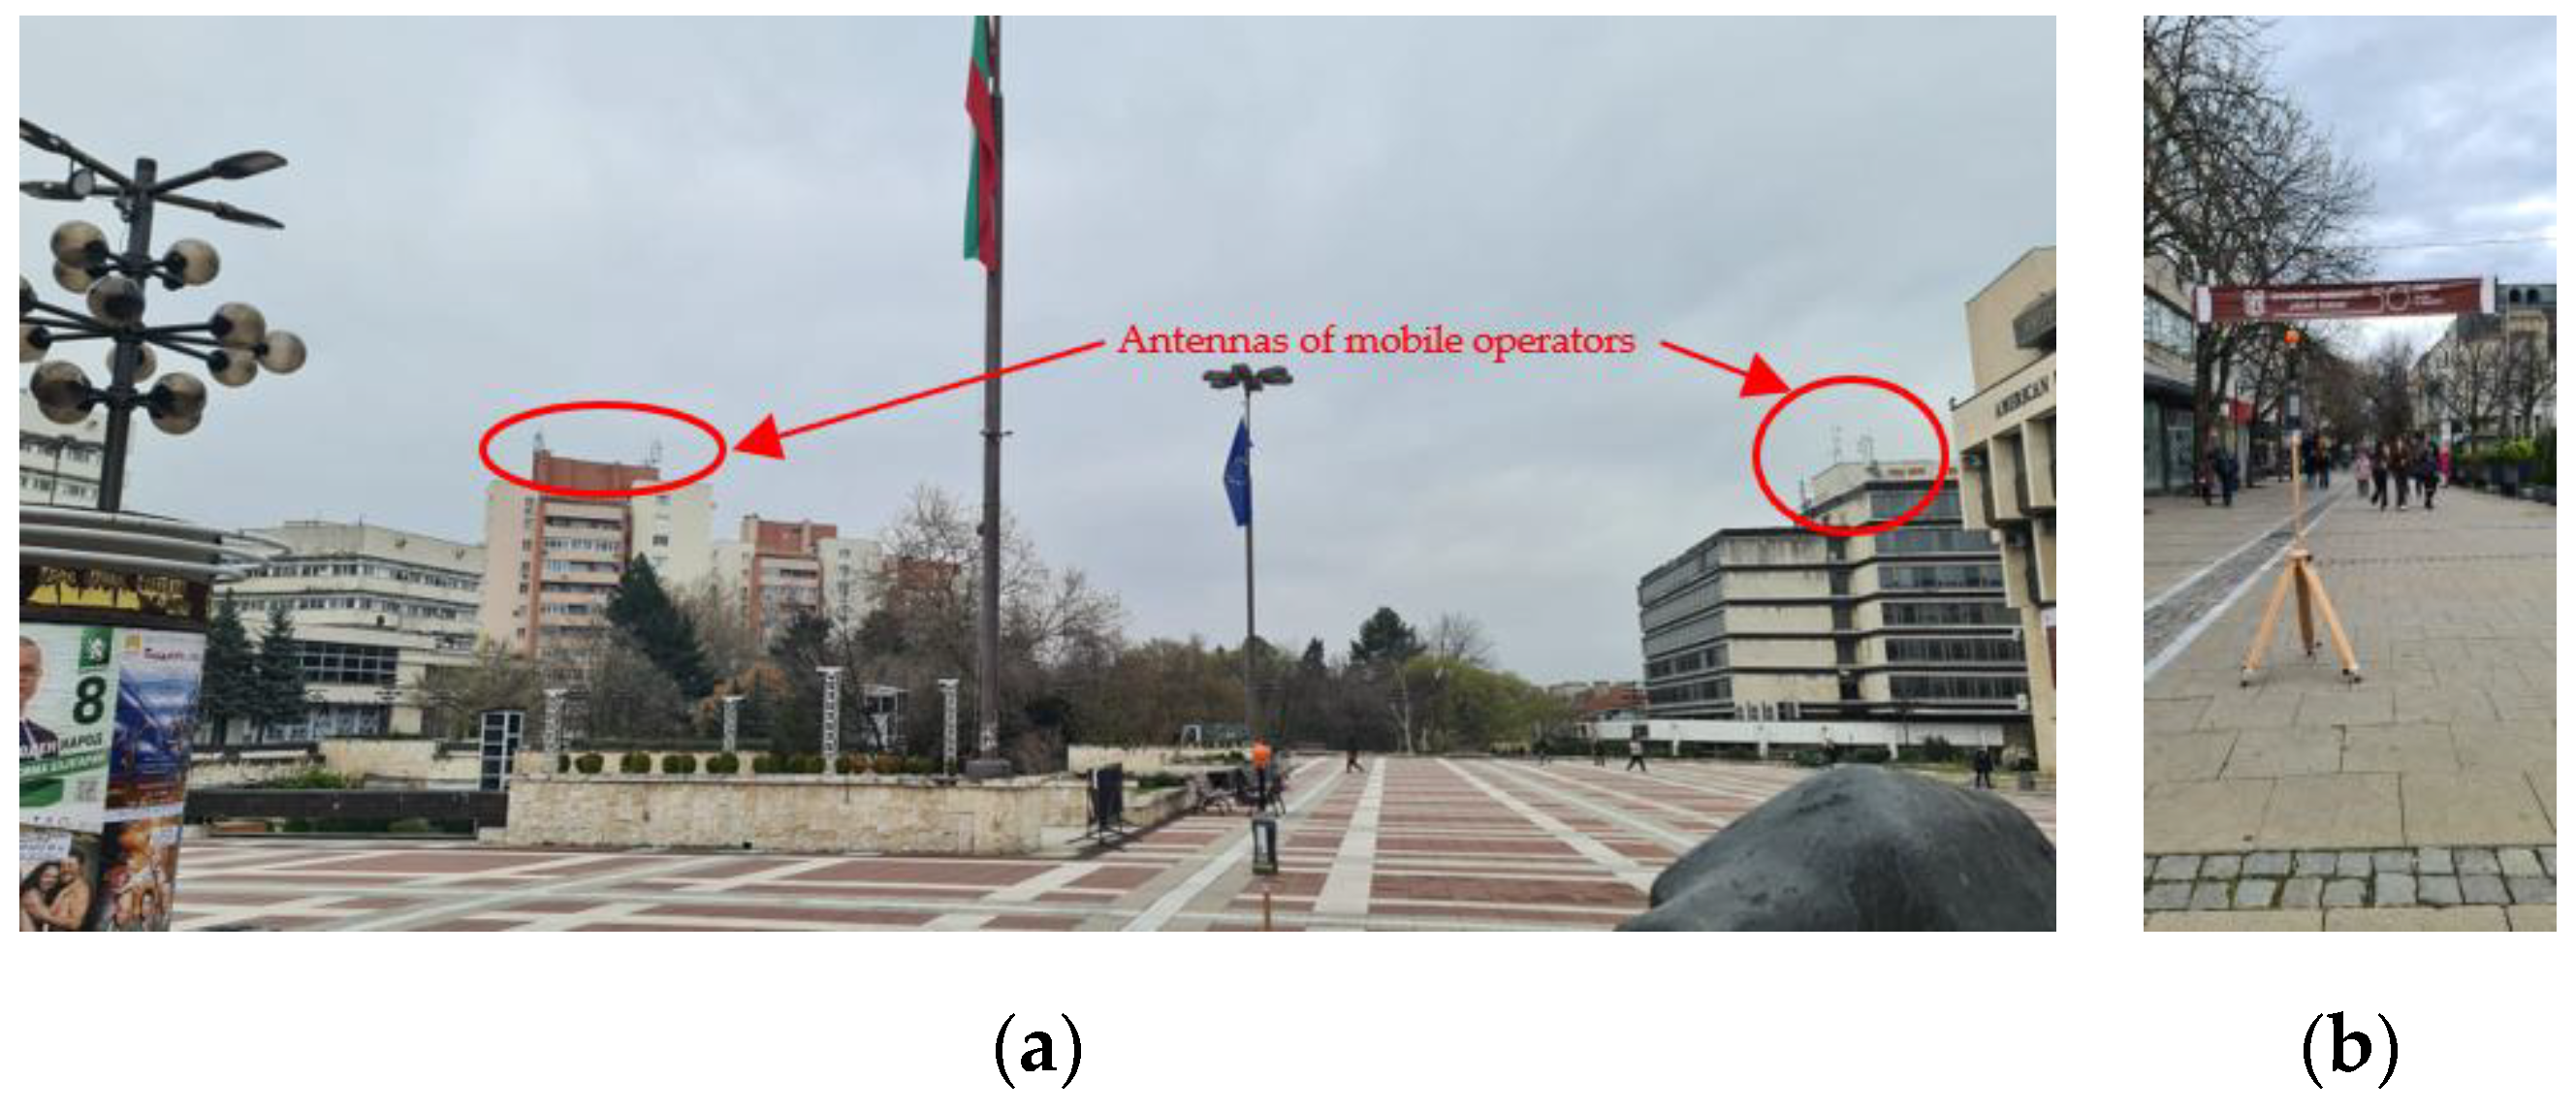
According to the main people activities carried out in the urban area and the presence or absence of line-of-sight (LOS) to antennas of mobile operators, the central city area was classified into three microenvironments: (1) squares (see Figure 2a): locations with line-of-sight to one or more antennas; (2) streets (see Figure 2b): locations with varying conditions, including both obstructive line-of-sight (O-LOS) and non-line-of-sight (N-LOS) to antennas; (3) parks: obstructive-line-of-sight to antennas.
Figure 2.
Photograph of: (a) a square in the Blagoevgrad central city area (showing line-of-sight to base station antennas); (b) a pedestrian street.
2.2. Methodology
The locations of the 23 points selected for EMF measurements are presented on the Google Earth map in Figure 1. The coordinates of each point are presented in Table A1 (Appendix A). Measurements were carried out using a hybrid approach based on the grid method [13] for in situ measurements, with approximately 50 m between points. In the context of this study, the term “hybrid” refers strictly to the combination of a spatial component (23 points across the study area) with a temporal component (multiple measurements at each point across different times of day and seasons), which enables a preliminary assessment of both short-term and seasonal variability of EMF levels in the selected area. In line with the proposed hybrid approach for assessing temporal EMF variations, measurements at each point were performed three times daily within the following time intervals: morning (8:30–10:00); afternoon (12:30–14:00) and evening (17:30–19:00).
The measurement campaign took place in two seasons, summer (13 August 2025) and winter (14 January 2026), on a weekday (Wednesday). Wednesday was selected as it represents the midpoint of the working week; consistent with previous findings, EMF levels on weekdays tend to be higher than on weekends [2,3,7]. Furthermore, Wednesday is a market day, attracting more visitors to the city.
At all measurement points, the measuring equipment was placed on a wooden tripod at a height of 1.5 m above ground level (see Figure 2). The duration of each measurement was one minute per point.
2.3. Measurement Equipment
E-field strength measurements were performed using a Wavecontrol SMP3 (Wavecontrol Inc., Roseland, NJ, USA) field strength meter [14] equipped with a WPF8 broadband isotropic probe (Wavecontrol Inc., Roseland, NJ, USA) with a frequency range of 100 kHz to 8 GHz.
3. Results and Discussion
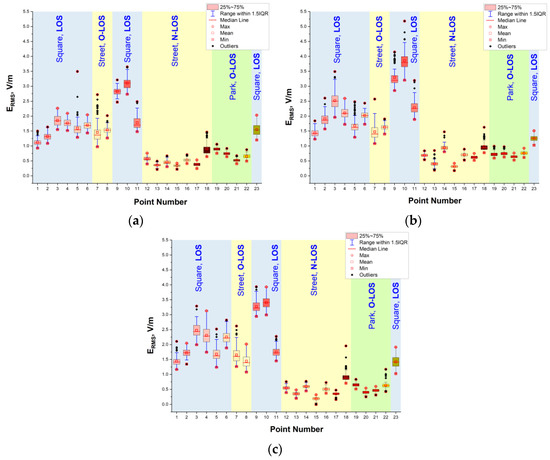
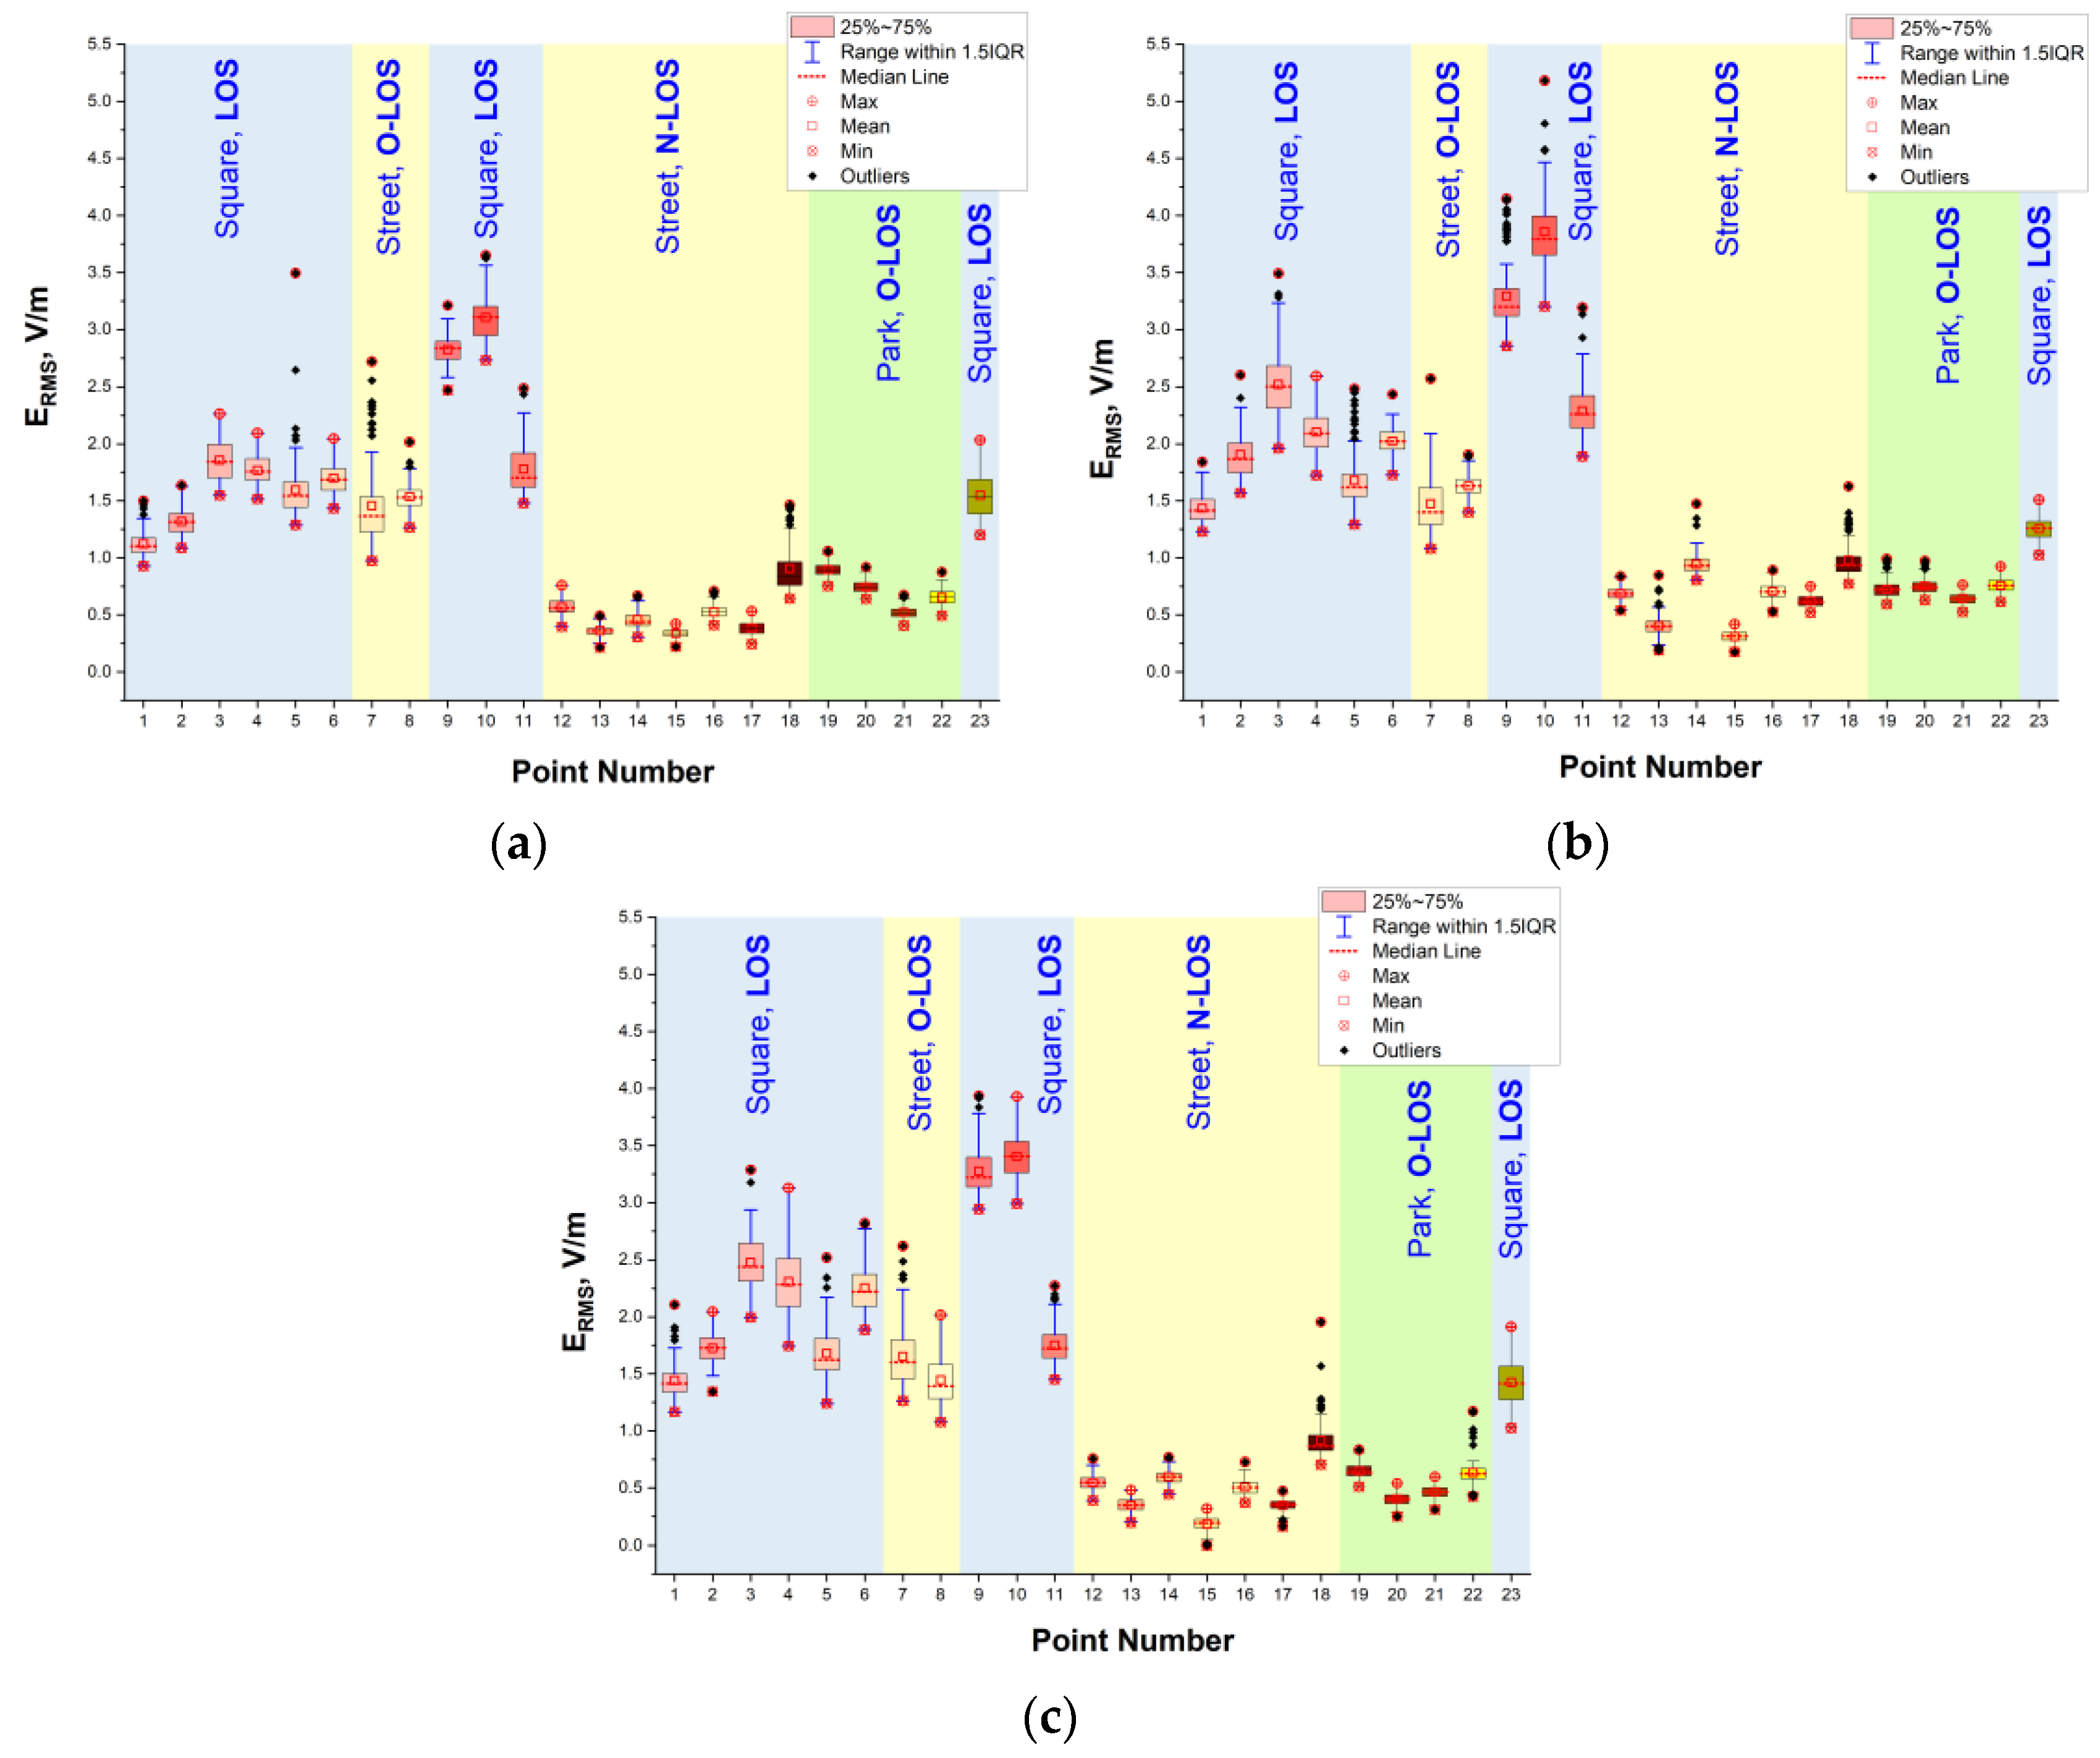
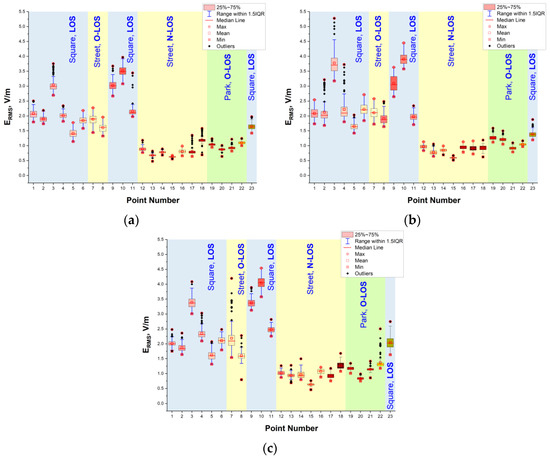
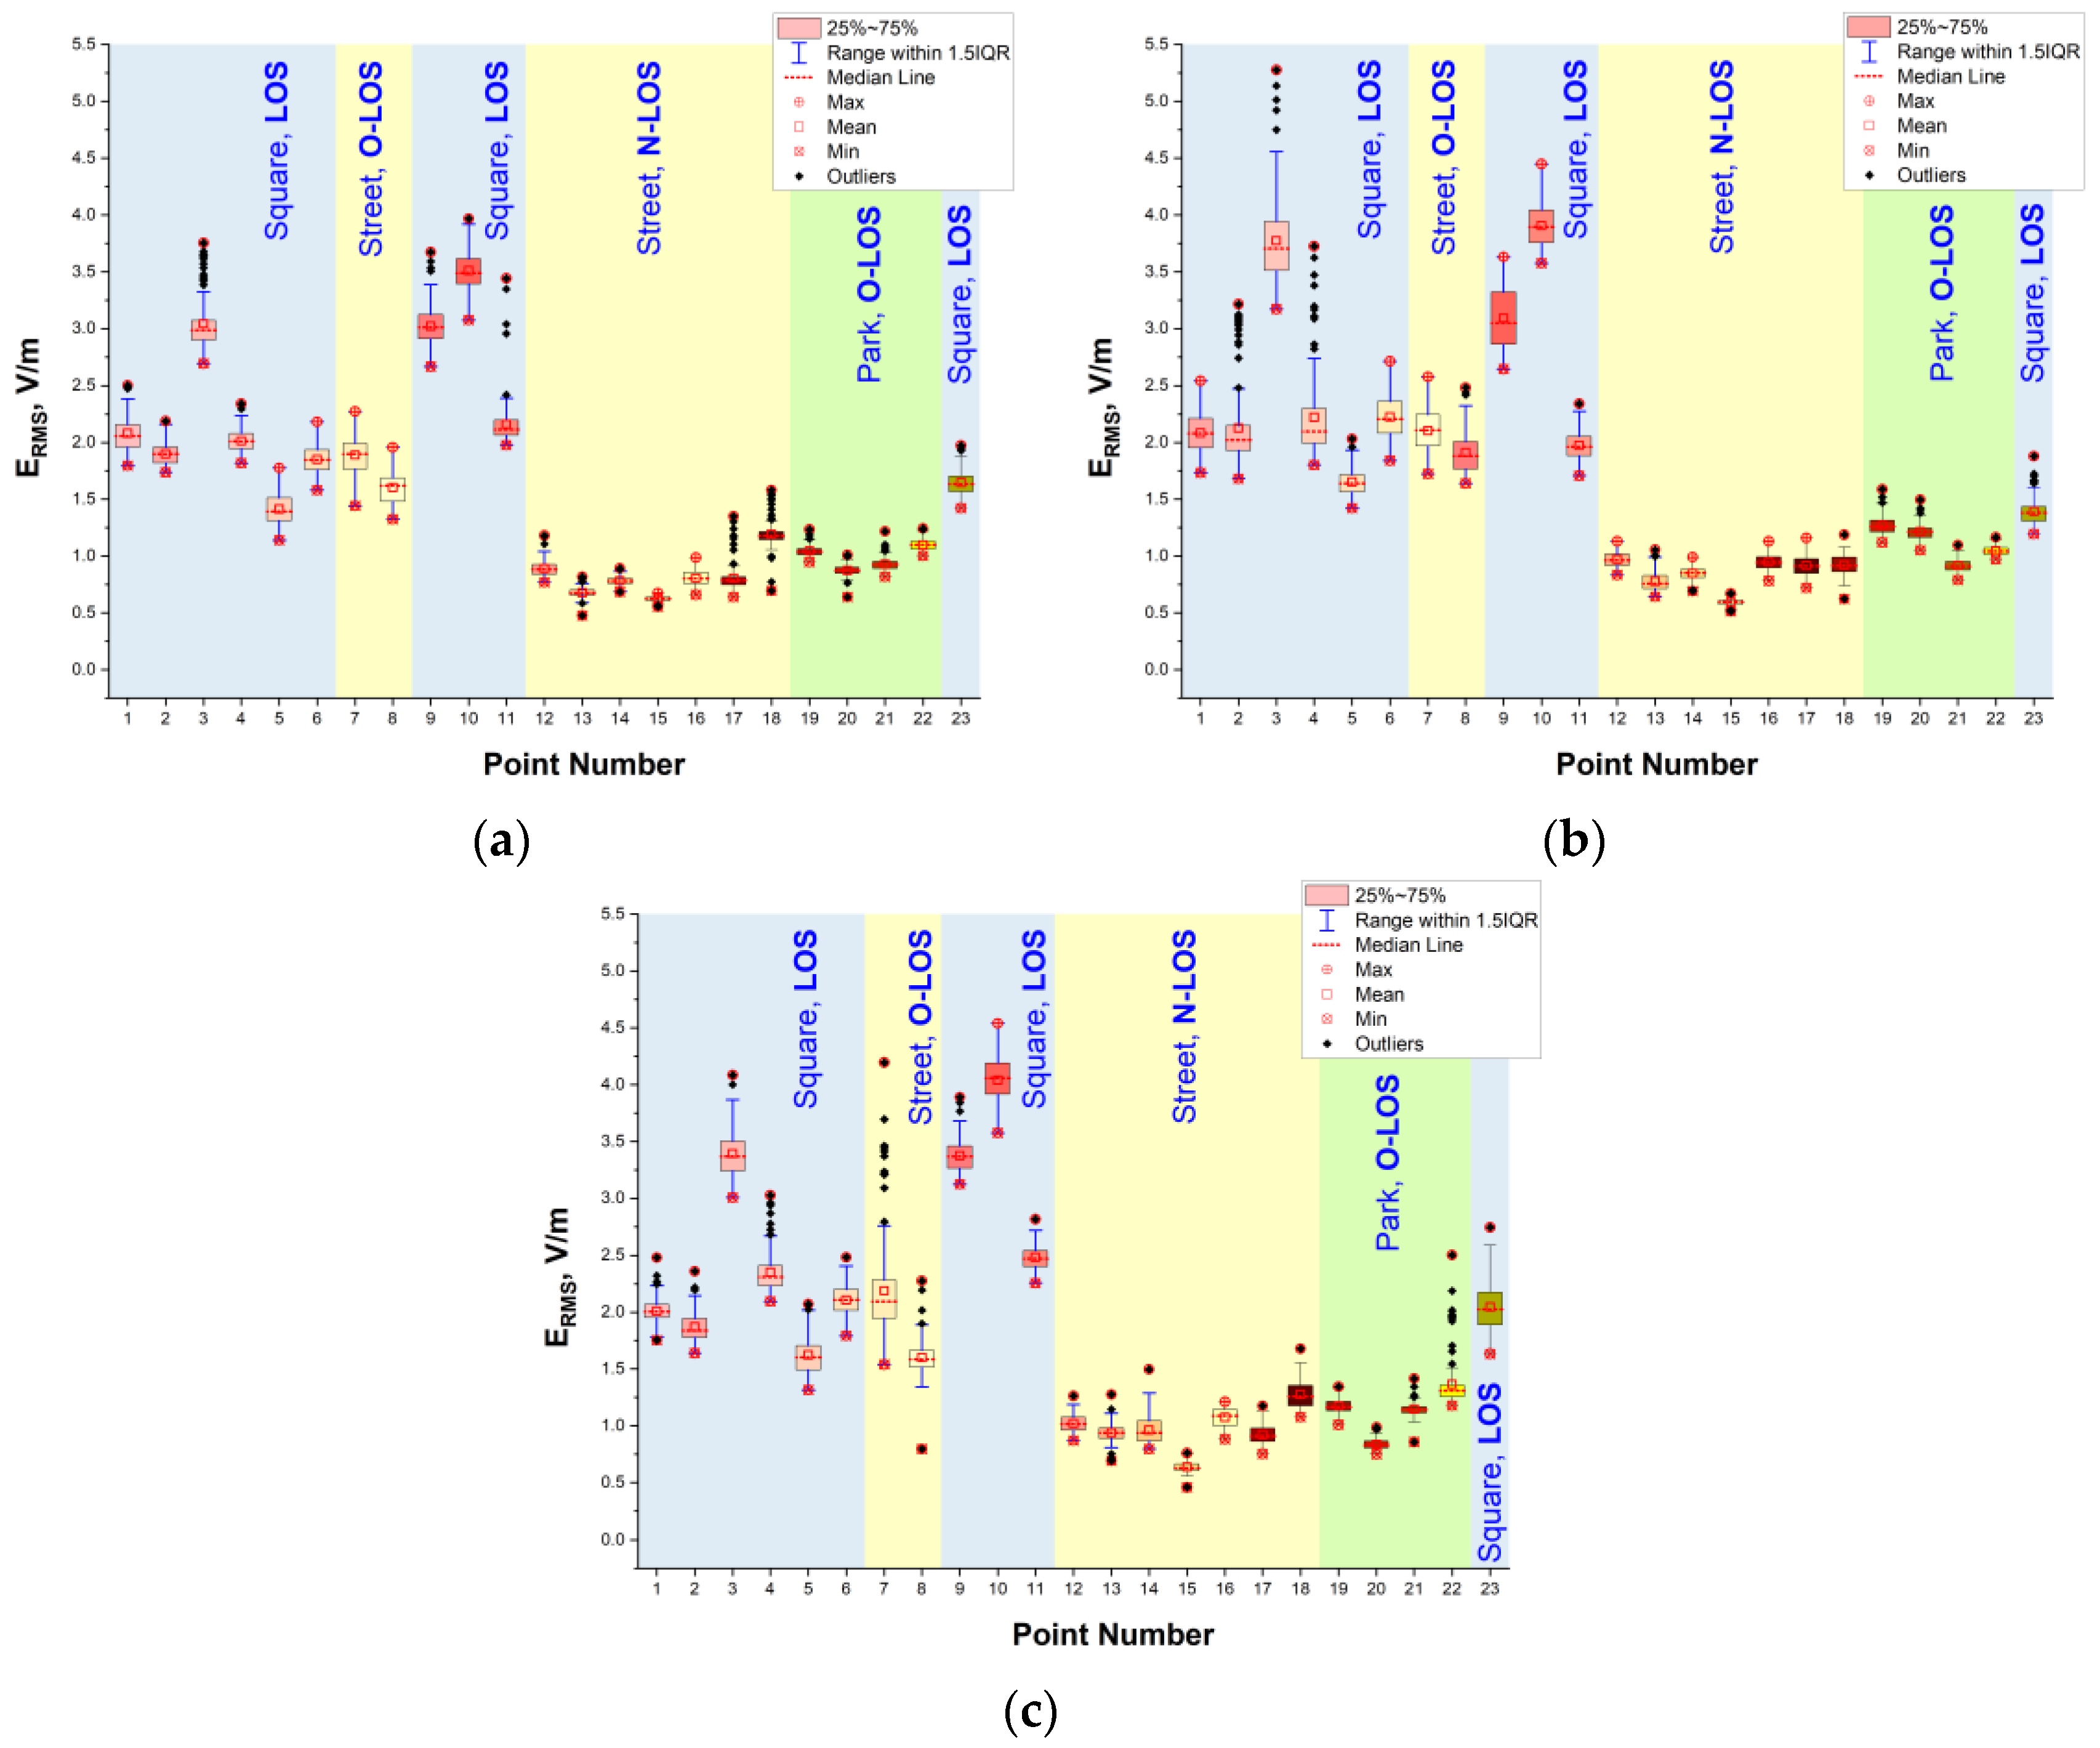
Figure 3 and Figure 4 present the results of the measurement campaigns conducted in summer and winter for the three daily periods: morning, afternoon, and evening. As shown in Figure 3, the highest E-field values were measured at squares (points 1–6, 9–11, and 23), where at least one antenna has a LOS to the measurement location. In August 2025, the mean values at these points varied between 1.0 and 3.0 V/m in the morning, 1.5 and 3.75 V/m in the afternoon, and 1.20 and 3.27 V/m in the evening (Figure 3). January 2026 measurements showed a similar pattern, with ranges of 1.4–3.5 V/m (morning), 2.1–3.8 V/m (afternoon), and 2.0–4.0 V/m (evening) (see Figure 4). The maximum E-field value recorded during the August 2025 campaign was 5.20 V/m at point 10 (afternoon), while the maximum values at the same point measured in the morning and evening were 3.6 V/m and 3.8 V/m, respectively. In winter (January 2026), the highest value was measured at point 3 (afternoon), reaching 5.25 V/m, whereas the maximum values at the same point in the morning and evening were 3.75 V/m and 4.15 V/m, respectively. The seasonal shift in maximum E-field values from point 3 (near the municipality, American University in Bulgaria, and the Faculty of Laws and History, South-West University “Neofit Rilski”) in winter to point 10 (near a shopping mall) in summer (August 2025) suggests an association with human activity patterns; specifically, the concentration of people indirectly influences E-field levels. Furthermore, in both seasons, E-field values are highest in the afternoon and lowest in the morning. This temporal pattern aligns with findings in [9,10] and likely reflects the daily rhythm of human activity and mobile network load.
Figure 3.
Boxplot of the RMS E-field measured during the summer campaign (August 2025). Results are shown for three microenvironments (square, street, park) across three daily periods: (a) morning, (b) afternoon, and (c) evening.
Figure 4.
Boxplot of the RMS E-field measured during the winter campaign (January 2026). Results are shown for three microenvironments (square, street, park) across three daily periods: (a) morning, (b) afternoon, and (c) evening.
As expected, the lowest electric-field values were measured at points with N-LOS conditions, such as points 12–18 (street), with mean values ranging from 0.3 to 0.8 V/m. At these locations, and during both measurement campaigns (summer and winter), very little variation was observed between the values recorded in the morning, at noon, and in the evening. Similar results were obtained at points with O-LOS, such as points 7 and 8 (street), and 19–22 (park). The low temporal variation in the E-field at points with NLOS and O-LOS conditions is likely due to a combination of two factors, with the averaging effect of multipath scattering playing a dominant role. At these locations, the signal reaches primarily through reflections, diffraction, and scattering off surrounding buildings and obstacles. This multipath propagation smooths out short-term fluctuations in mobile traffic or user distribution through the superposition of multiple reflected signals, resulting in a stable mean level. This interpretation is supported by the observation that streets with N-LOS in the study had pedestrian densities comparable to those in open squares, yet their temporal variability remained low—indicating that mobile traffic alone cannot fully explain the effect. In contrast, at park points (19–22), where pedestrian density was lower, the reduced and more stable mobile traffic likely contributes additionally to the observed low temporal variability.
From the results, we can conclude that the E-field exhibits temporal variations at both daily and seasonal scales. These variations are most visible in locations with LOS to the antennas (squares and open spaces), and less pronounced in locations with N-LOS or O-LOS, such as streets and parks, due to multipath propagation. Hence, we can conclude that the structure and shape of the urban environment play a key role in the spatial distribution and temporal stability of the electromagnetic field.
Furthermore, all measured RMS E-field values, ranging from 0.01 V/m to 5.25 V/m, are below ICNIRP 2020 [4] reference levels for public exposure and Bulgarian national limits [6].
4. Future Research Directions
In our future research, we will extend the hybrid approach by incorporating fast-response probes for time-resolved measurements and by implementing traffic-dependent scenarios, as described in ITU-T K.Suppl.32, to assess exposure from 5G. This is because the broadband isotropic probe (WPF8) employed in this study may not adequately capture the highly directional and transient characteristics of 5G.
5. Conclusions
In conclusion, this paper presents, for the first time, results from a seasonal measurement campaign of the E-field in three urban microenvironments (squares, streets, parks) in Blagoevgrad, Bulgaria, a medium-sized city, using a hybrid approach. By applying the proposed hybrid approach, empirical data on the combined influence of time of day, season, and location on EMF levels were presented. The results reveal that the E-field exhibits temporal variations at both daily and seasonal scales. These variations are most visible in locations with LOS to the antennas (squares and open spaces) and less pronounced in locations with N-LOS or O-LOS conditions, such as streets and parks. A relationship has been established between the spatial distribution of peak and mean E-field values and the seasonal dynamics of human activity, as reflected in a shift of the maximum from the administrative area in winter (point 3) to the shopping center in summer (point 10). All RMS E-field values (0.01–5.25 V/m) are below the ICNIRP 2020 reference levels and the Bulgarian safety limits.
Author Contributions
Conceptualization, N.A., R.M., B.A. and G.A.; methodology, N.A., R.M., B.A. and G.A.; validation, N.A. and G.A.; formal analysis, N.A., R.M., B.A. and G.A.; investigation, R.M.; resources, N.A. and G.A.; data curation, N.A. and B.A.; writing—original draft preparation, G.A.; writing—review and editing, N.A., R.M. and B.A.; visualization, N.A. and B.A.; supervision, N.A. and G.A.; project administration, N.A.; funding acquisition, N.A. All authors have read and agreed to the published version of the manuscript.
Funding
This research was funded by the BULGARIAN NATIONAL SCIENCE FUND, grant number KP-06-H67/4 from 12 December 2022, Development and testing of new models of radio channels and antennas for reliable and resilient wireless connectivity, enabling innovative applications in future IoT-based precision agriculture.
Institutional Review Board Statement
Not applicable.
Informed Consent Statement
Not applicable.
Data Availability Statement
The data presented in this study are available on request from the authors.
Conflicts of Interest
The authors declare no conflicts of interest.
Appendix A
This appendix presents additional data regarding the spatial distribution of the measurement points.
The coordinates of the 23 points selected for EMF measurements are presented in Table A1 in order to facilitate tracking of their locations within the selected area. Their spatial distribution is visualized on the map shown in Figure 1.
Table A1.
Selected points of measurement and coordinates.
References
- Iakovidis, S.; Apostolidis, C.; Manassas, A.; Samaras, T. Electromagnetic Fields Exposure Assessment in Europe Utilizing Publicly Available Data. Sensors 2022, 22, 8481. [Google Scholar] [CrossRef] [Scilit] [PubMed]
- Deaconescu, D.B.; Petrita, T.; Miclaus, S. Radiofrequency Emission Monitoring by ANCOM Fixed Stations in Eight Cities in Romania during One Whole Year. In Proceedings of the 2024 Advanced Topics on Measurement and Simulation (ATOMS), Constanta, Romania, 28–30 August 2024; pp. 7–10. [Google Scholar] [CrossRef] [Scilit]
- Djuric, N.; Kavecan, N.; Otasevic, V.; Kljajic, D.; Djuric, S. Empowering the Serbian EMF RATEL System for Monitoring RF-EMF Through Drive Test. IEEE Access 2025, 13, 180918–180940. [Google Scholar] [CrossRef] [Scilit]
- ICNIRP. Guidelines for Limiting Exposure to Electromagnetic Fields (100 kHz to 300 GHz). Available online: https://www.icnirp.org/en/activities/news/news-article/rf-guidelines-2020-published.html/ (accessed on 11 April 2026).
- Council Recommendation. 1999/519/EC of 12 July 1999 on the Limitation of Exposure of the General Public to Electromagnetic Fields (0 Hz to 300 GHz). Off. J. Eur. Communities 1999, L199, 59–70. [Google Scholar]
- Ordinance No. 9 of 14 March 1991 on Maximum Permissible Levels of Electromagnetic Fields in Populated Areas and the Determination of Hygienic Protection Zones Around Emitting Facilities. State Gazette, 1991, Issue No. 35 of 3 May; Correction, 1991, Issue No. 38 of 14 May; Amendment, 2002, Issue No. 8 of 22 January. Available online: https://lex.bg/laws/ldoc/-551794688?__cf_chl_f_tk=IPXdVDRxzZaFAyCkzoRuFzyBlGx8fbFda3hgSNrx230-1783000241-1.0.1.1-HSSs.kVBfVL8CsH1peVwSQouEdCipuCdN2dk1F63HdM (accessed on 10 April 2026).
- Atanasova, G.L.; Atanasov, B.N.; Atanasov, N.T. Assessment of Electromagnetic Field Exposure on European Roads: A Comprehensive In Situ Measurement Campaign. Sensors 2023, 23, 6050. [Google Scholar] [CrossRef] [Scilit] [PubMed]
- Topalova, I.; Shalamanova, T.; Zaryabova, V.; Israel, M. Electromagnetic Field Exposure from Telecommunication Sources in Areas with “Sensitive” Buildings and Places. Rad. J. 2018, 3, 197–201. [Google Scholar] [CrossRef] [Scilit]
- Djuric, N.; Kljajic, D.; Pasquino, N.; Otasevic, V.; Djuric, S. A Framework for RF-EMF Time Series Analysis Through Multi-Scale Time Averaging. IEEE Access 2025, 13, 84811–84825. [Google Scholar] [CrossRef] [Scilit]
- Šuka, D.; Pejović, P.; Simić-Pejović, M. Characterization of Exposure to Electromagnetic Emissions from Public Mobile Systems Using the Time-Averaged and Integral-Based Measure. Radiat. Prot. Dosim. 2020, 190, 226–236. [Google Scholar] [CrossRef] [Scilit] [PubMed]
- Regional Health Inspectorate—Plovdiv. Results from Monitoring of Electromagnetic Fields (EMF) for 2024, Plovdiv, Bulgaria, 2024. Available online: https://riokozpd.com/uploads/Zdraven%20kontrol/2024/2024%20%D0%94%D0%BE%D0%BA%D0%BB%D0%B0%D0%B4%20-%20%D0%95%D0%9C%D0%9F.pdf (accessed on 10 April 2026).
- Regional Health Inspectorate—Varna. Non-Ionizing Radiation; Regional Health Inspectorate—Varna: Varna, Bulgaria, 2024; Available online: https://rzi-varna.com/?page_id=2705 (accessed on 10 April 2026).
- ITU-T. Recommendation K.113: Generation of Radio-Frequency Electromagnetic Field Level Maps; International Telecommunication Union: Geneva, Switzerland, 2025. [Google Scholar]
- Wavecontrol. SMP3 Portable Field Strength EMF Meter; Wavecontrol S.L.: Barcelona, Spain, 2026; Available online: https://www.wavecontrol.com/emf-products/emf-meter/smp3/ (accessed on 10 April 2026).
Disclaimer/Publisher’s Note: The statements, opinions and data contained in all publications are solely those of the individual author(s) and contributor(s) and not of MDPI and/or the editor(s). MDPI and/or the editor(s) disclaim responsibility for any injury to people or property resulting from any ideas, methods, instructions or products referred to in the content. |
© 2026 by the authors. Licensee MDPI, Basel, Switzerland. This article is an open access article distributed under the terms and conditions of the Creative Commons Attribution (CC BY) license.