1. Introduction
Overhead power lines must function reliably for several decades under a range of complex conditions, including mechanical stresses and environmental factors. A substantial proportion of these stresses are of a cyclic nature, primarily arising from wind-induced forces. It is important to note that these forces encompass aeolian vibrations, galloping, and vibrations between conductors [
1,
2,
3]. Aeolian vibrations are recognised as the primary cause of fatigue issues in overhead lines, which occur in laminar airflow at relatively low speeds (usually between 1 and 7 m/s). A Karman vortex street is formed as a result of the circulation of air around the cylindrically shaped conductor. The alternating detachment of vortices induces transverse vibrations within the conductor, which are characterised by low amplitude (not exceeding the conductor’s outer diameter) and high frequency (ranging from 3 to 150 Hz). This condition gives rise to high cycle loads, leading to an accumulation of approximately 10
7–10
8 stress cycles per annum [
4,
5,
6,
7].
Historical research, supported by the International Council on Large Electric Systems (CIGRÉ), has demonstrated that wind-driven vibrations have a considerable effect on the longevity of live and lightning-arrester conductors. A survey of early high-voltage (HV) lines reported by CIGRÉ revealed that up to 78% sustained fatigue-related damage within their initial two decades of operation. Statistical analyses indicated a high recurrence rate for crack initiation points, with a frequency exceeding 90–95%, and damage accumulation was observed in various locations, including through-clamps, tension clamps, multi-strand spacer installation sites, and dampers [
8,
9,
10]. The deterioration process observed in overhead conductors is attributed to fretting fatigue phenomena; in particular, in regions adjacent to the clamps, cyclic bending has been observed to result in micro-slippage among individual wires in the outer layers. Displacement amplitudes on the micrometre scale have been demonstrated to trigger several adverse effects, including coating wear-off, microcrack formation within crystal structures, and localised corrosion spots. Laboratory tests have indicated that fretting can reduce the permissible fatigue limit for aluminium wire material by between 50% and 70%, when compared with non-fretted reference samples [
11,
12]. The failures of overhead conductors—i.e., ACSR (Aluminium Conductor Steel Reinforced)—are characterised by initial cracks in the outer layer of the aluminium braid, where maximum bending stress and fretting occur. In the event of a fracture in a single wire, the mechanical stresses are redistributed instantaneously across the remaining load-bearing elements in its cross-section. Concurrently, this reduction in effective cross-sectional area elevates the current density at defect locations, leading to increased local temperatures. The combination of heightened mechanical and thermal stress accelerates crack growth in subsequent wires to a significant degree; this cascading failure rapidly culminates in complete breakage or melting through a phase conductor after years of latent damage accumulation [
13,
14].
The aluminium wire drawing process is a cold deformation technique that is employed to reduce the diameter of a wire while simultaneously enhancing its mechanical properties, such as ultimate tensile strength (UTS) and ductility. This process is critical for the customisation of wire characteristics to meet the specific requirements of various industrial applications. A fundamental element of the wire drawing process is the sequence of reductions and the corresponding die angles employed at each pass. These parameters are instrumental in achieving the desired dimensional changes; moreover, they significantly influence the mechanical performance and operational efficiency of the process. The primary factors that influence this process are the level of wire diameter reduction, the lubricants utilised, and the configuration of the wire drawing die (encompassing both the material and geometry of the die). The influences of die geometry and design have been and continue to be the subject of numerous studies [
15]. The majority of extant studies have focused on the evaluation of the impacts of die geometry on three primary factors: wire surface quality, the risk of material discontinuity, and the formation of wire cracks. McAllen and Phelan [
16] presented studies on the effects of the draw die angle and the amount of deformation on the risk of wire failure after the drawing process. The authors found that, regardless of the draw angle, the propensity for central cracks to form was high at cross-sectional reduction ratios of 9%, 18%, and 25%. Conversely, at reduction ratios of 5% and 39%, the propensity for central cracks to form was found to be significantly diminished. In turn, Campos et al. [
17] investigated the effect of the draw angle on the coefficient of friction during axially symmetric drawing of copper. They utilised tungsten carbide dies with draw angles of 2°, 3°, 4°, 5°, and 6°, employing an industrial molybdenum disulfide lubricant. Their results indicated that, as the angle α increases, the coefficient of friction underwent an initial decrease followed by an increase. In contrast, Ahmadi and Farzin [
18] presented research focused on the influence of broach geometry parameters and friction conditions on herringbone or central cracking during steel wire drawing. The study revealed that wire fracture occurred under conditions of relatively small area reductions and large drawbar angles (15°). Furthermore, it was found that the average stress was predominantly tensile, and that low friction conditions (μ = 0.05) increased the tendency towards central fracture. These findings were supported by finite element numerical analyses and an analysis of the experimental results obtained. In turn, Kabayama et al. [
19] investigated the effect of die geometry on the distribution of internal stresses in annealed Cu wire. Their experimental studies demonstrated that an increase in drawing speed resulted in decreases in the wire drawing force and coefficient of friction. Intense residual stress manifested in the reduction zone at a 9° angle, exhibiting persistence and exerting a substantial influence on fatigue properties subsequent to the wire drawing process. Their simulation results demonstrated the presence of tensile axial stresses on the wire surface and compressive stresses in the intermediate region [
20,
21,
22].
The pivotal functions of the materials and die geometry are paramount, as they are instrumental in determining the surface quality of wires. For instance, J. Sheu [
23] noted that 9° angles yielded superb dimensional accuracies under defined reduction percentages. These findings align with data presented in numerous investigations evaluating the relationships between conductor efficiencies and geometric configurations, thus promoting homogeneous deformations and minimising strain. The enhancement of surface qualities was achieved concurrently with reduced stress magnitudes, thus confirming crucially pertinent observations. These observations demonstrate that moderate process parameter ranges are necessary to prevent undue tensile burdens and mitigate deteriorative impacts over the timeframes examined in industrial research employing consistent geometries across multi-pass draws [
24,
25,
26,
27].
In the course of this study, a programme of experimental research was conducted to investigate the relationship between the angle of the drawing die’s working section and the surface quality and fatigue strength of wires produced through the drawing process. A qualitative and quantitative assessment was performed, allowing the most favourable die geometry variants for the drawing of aluminium wires to be identified. Notably, these parameters guarantee the achievement of increased fatigue strength during the drawing process without the need for metallurgical intervention. The findings of this experimental study are expected to facilitate the formulation of guidelines for novel technology for the production of aluminium wires with enhanced fatigue strength, obviating the necessity for metallurgical intervention.
2. Materials and Research Methodology
The experimental tests were conducted on aluminium wires of the EN AW 1370 grade (NPA Skawina, Skawina, Poland), which are commonly used for ACSR overhead conductors. The chemical composition of the tested wires is presented in
Table 1.
Wires with a diameter of 3.01 mm were produced by the Eltrim cable manufacturing company (Ruszkowo, Poland). The wire drawing process was carried out under industrial conditions using a five-block SKET wire drawing machine (Sket Group, Magdeburg, Germany) designed to produce aluminium wires. The drawing speed was 5 m/s. The reduction in diameter from 3.21 to 3.01 mm was achieved using dies with different geometries (see
Table 2). The study utilised tungsten carbide wiredraw dies (grade W10) with a diameter of 3.01 mm and varying working cone opening angles: 12°, 16°, 20°, 24°, and 28°. The dies with different geometries were manufactured by the Technodiament company (Warsaw, Poland). Detailed die parameters and mechanical properties of the final wires are presented in
Table 2.
The surface quality of aluminium wires was assessed using scanning microscopy (Hitachi model, Tokyo, Japan) and surface topography and three-dimensional roughness was measured using a Taylor Hobson Form Talysurf 50 device (Taylor Hobson, Leicester, UK). The wires obtained after the drawing process were subjected to microstructural analysis using a scanning electron microscope (Hitachi model, Tokyo, Japan). An accelerating voltage of 15 kV was applied, and the electron beam current was 30 nA.
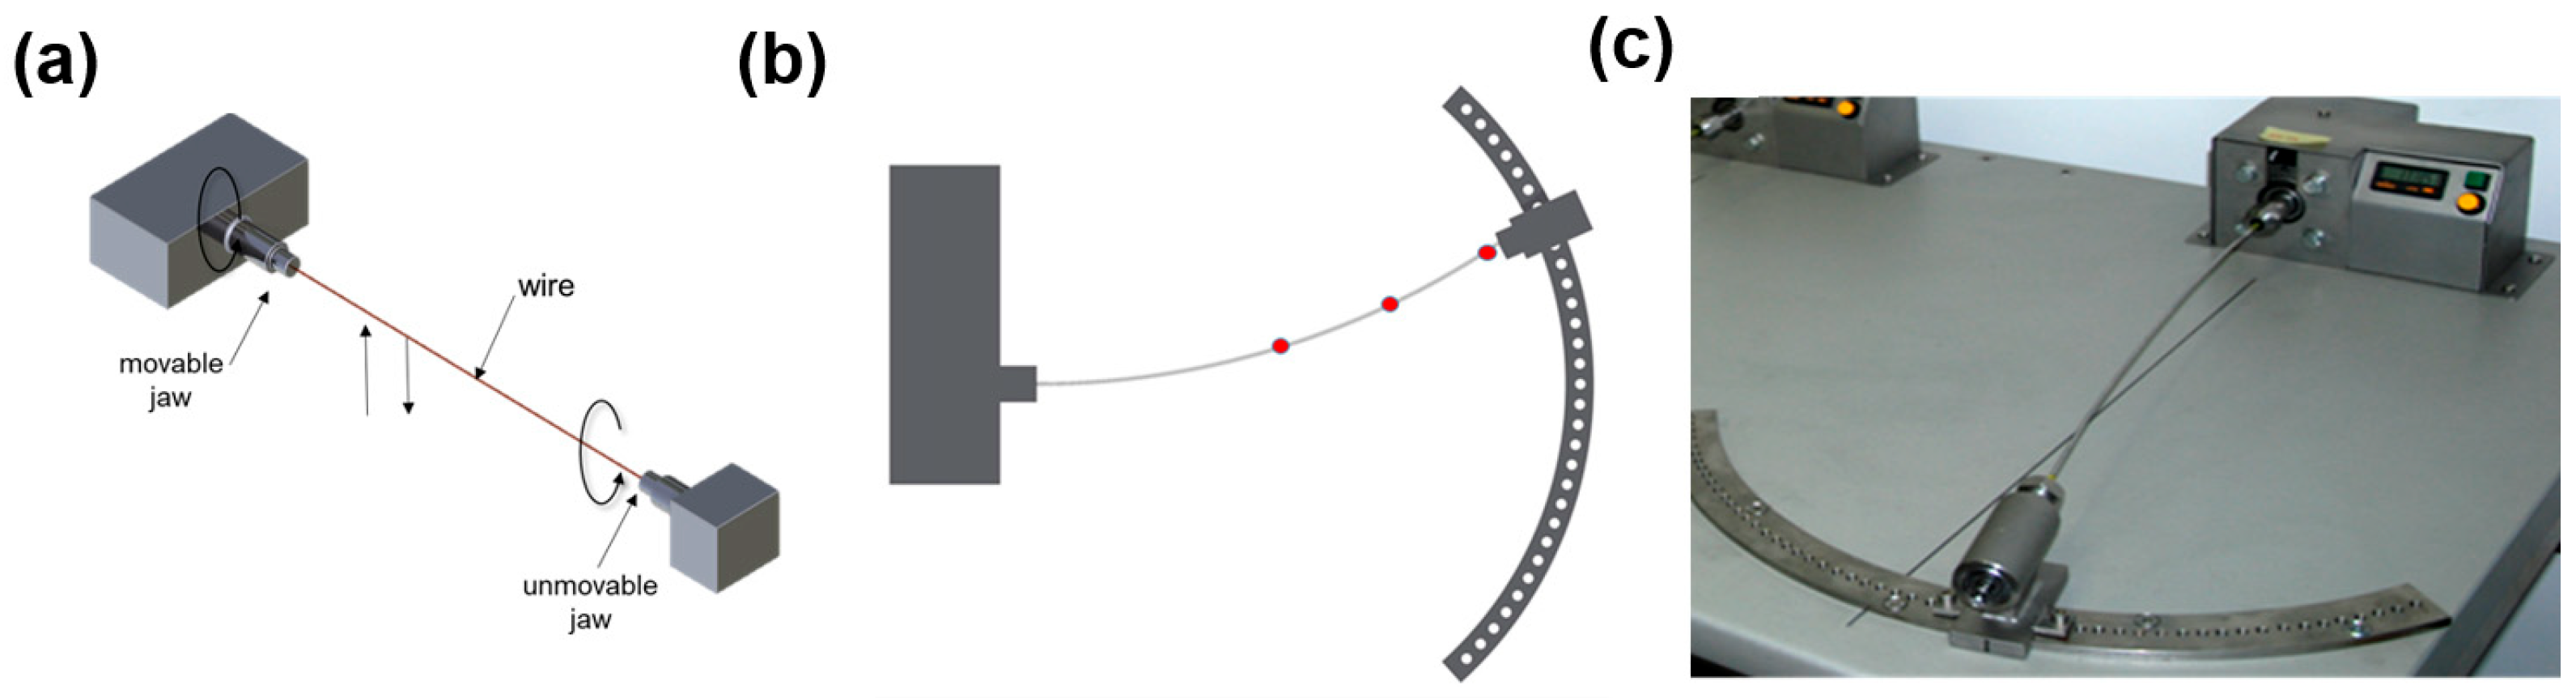
Fatigue strength tests on the wires were performed on a special fatigue testing laboratory stand using the rotational bending method. The specimen (wire) was subjected to an axial rotational motion at a speed of 3000 revolutions per minute (RPM). Stress modification is achieved by symmetrically bending the specimen to a known deflection, as shown in
Figure 1.
Each wire, produced using a wire drawing die with different geometry, was subjected to a fatigue test at three stress levels: 43, 71, and 129 MPa. Three wire specimens were tested at each stress level. Based on the results obtained for the number of cycles to failure, the average number of cycles was calculated; this average value was then used to plot the Wöhler curve. Consequently, determining a single Wöhler curve required approximately 45 measurements.
3. Research Results and Discussion
3.1. Wire Surfaces
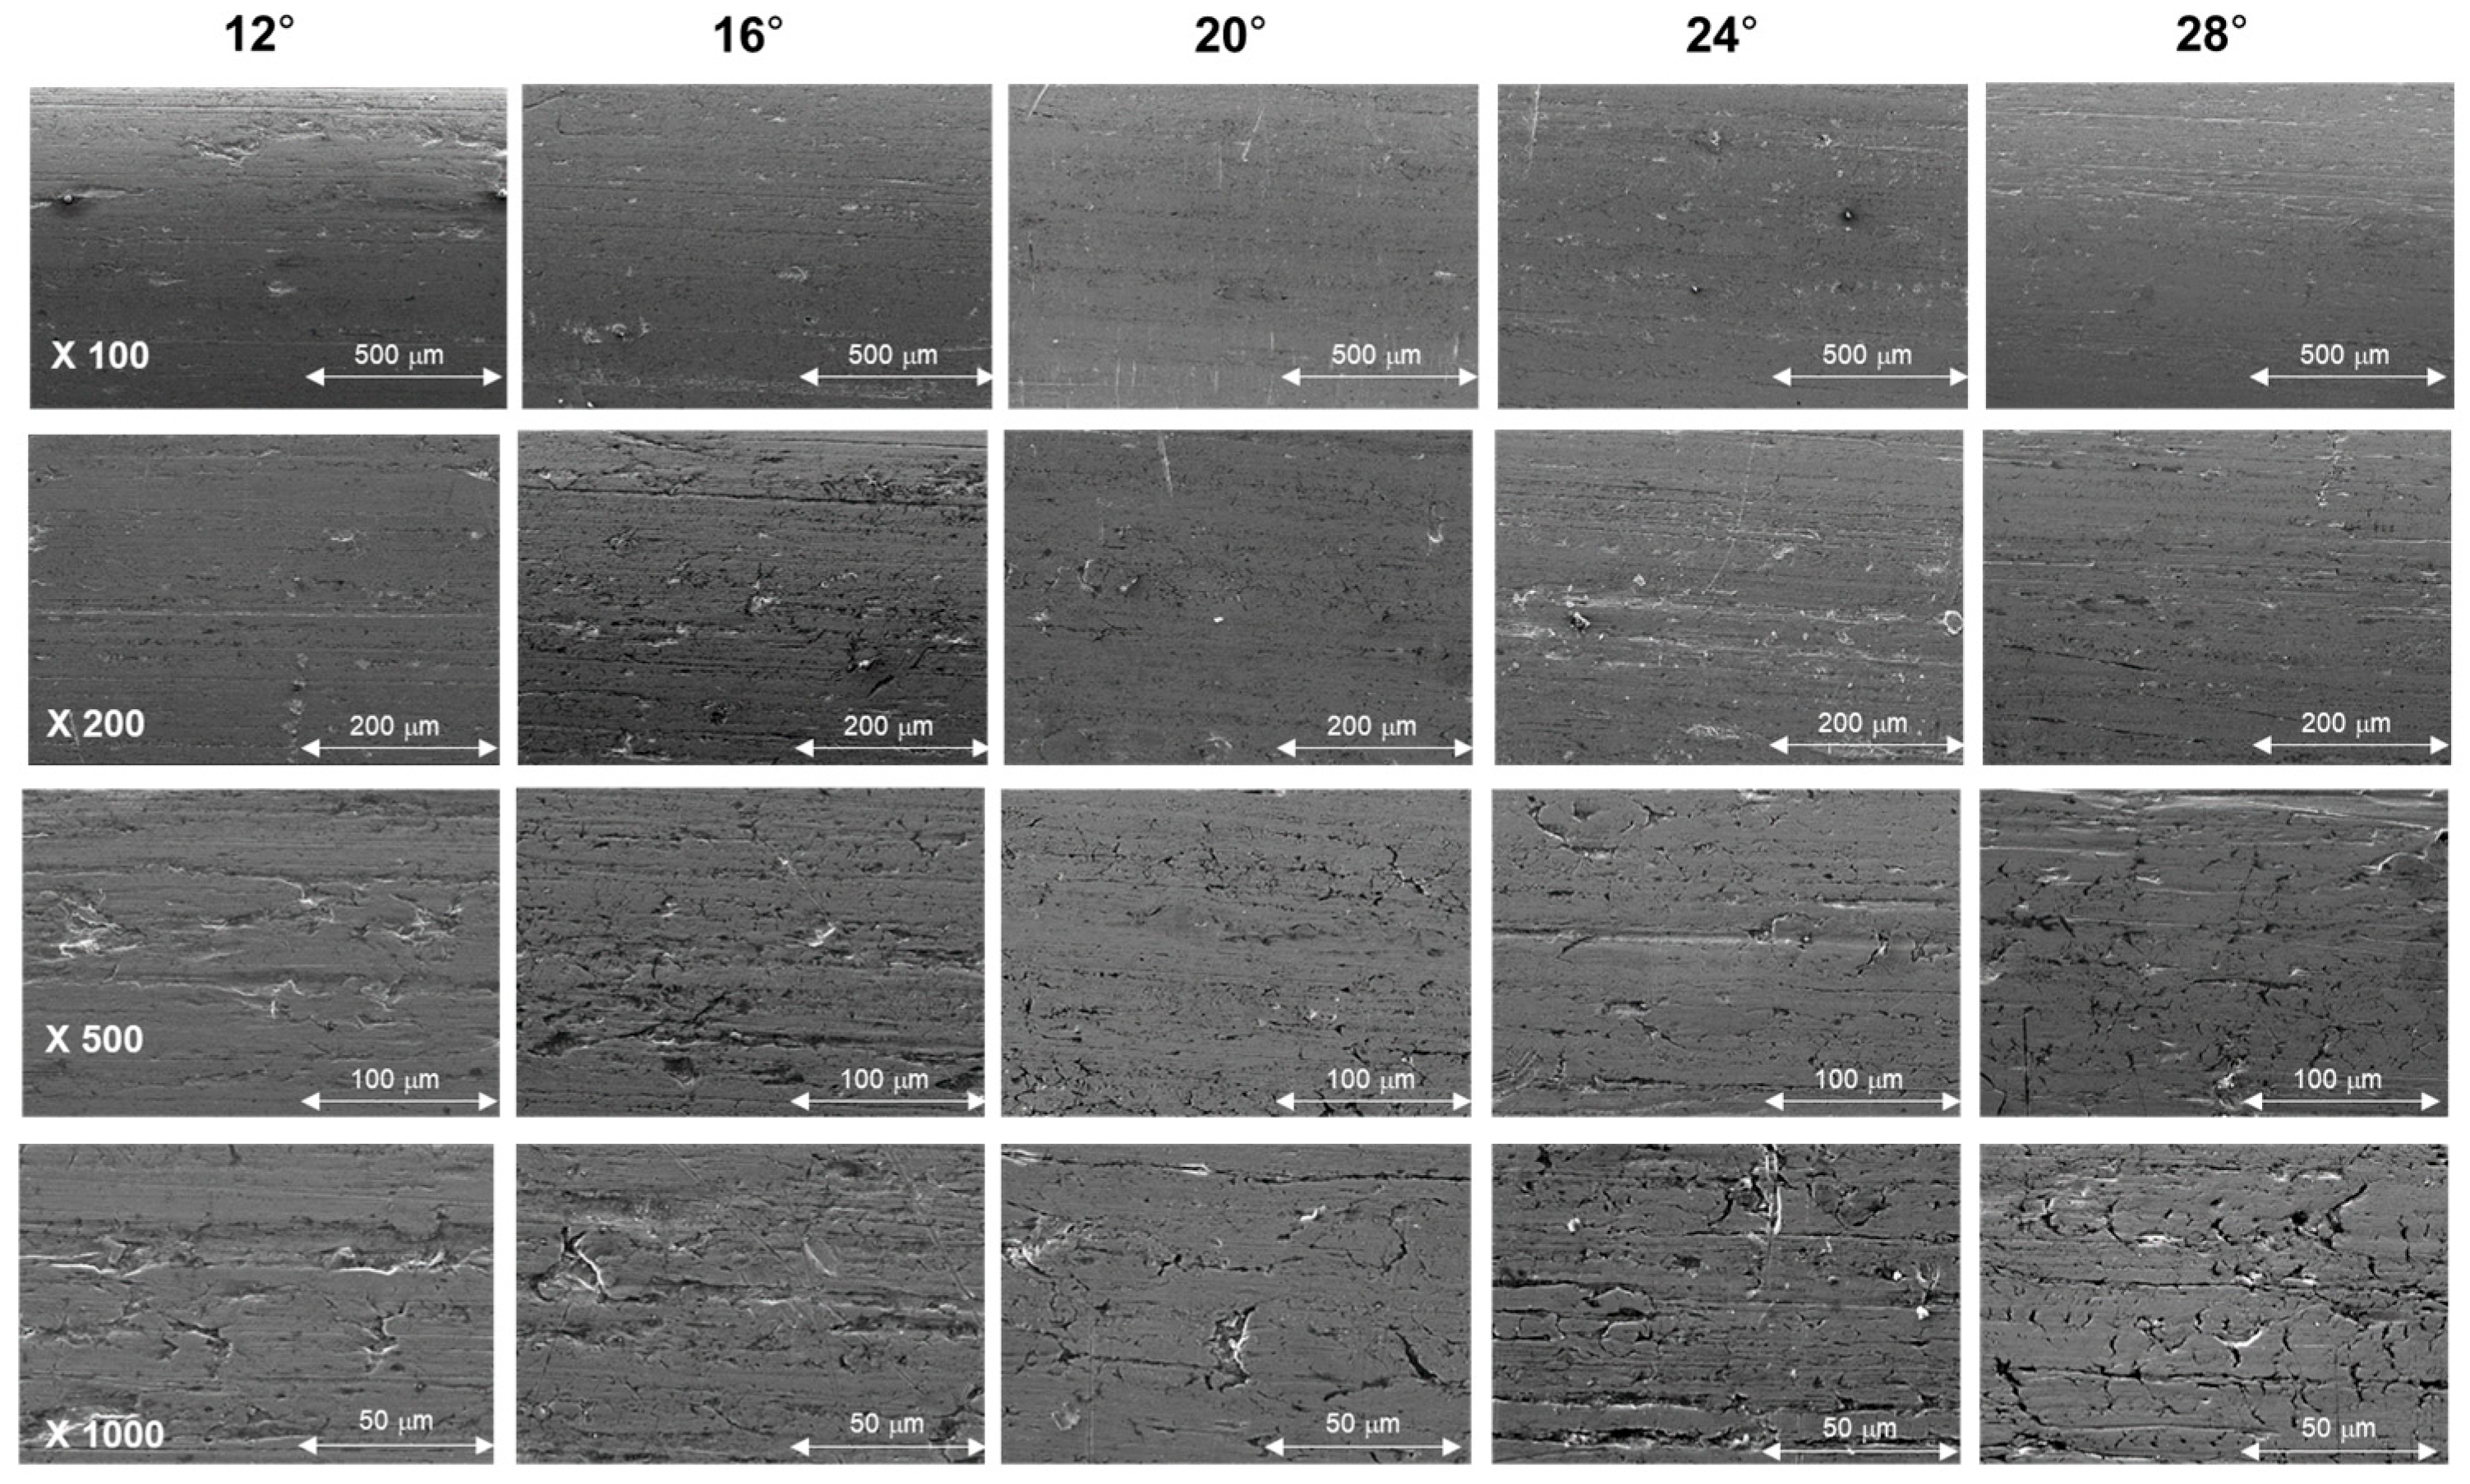
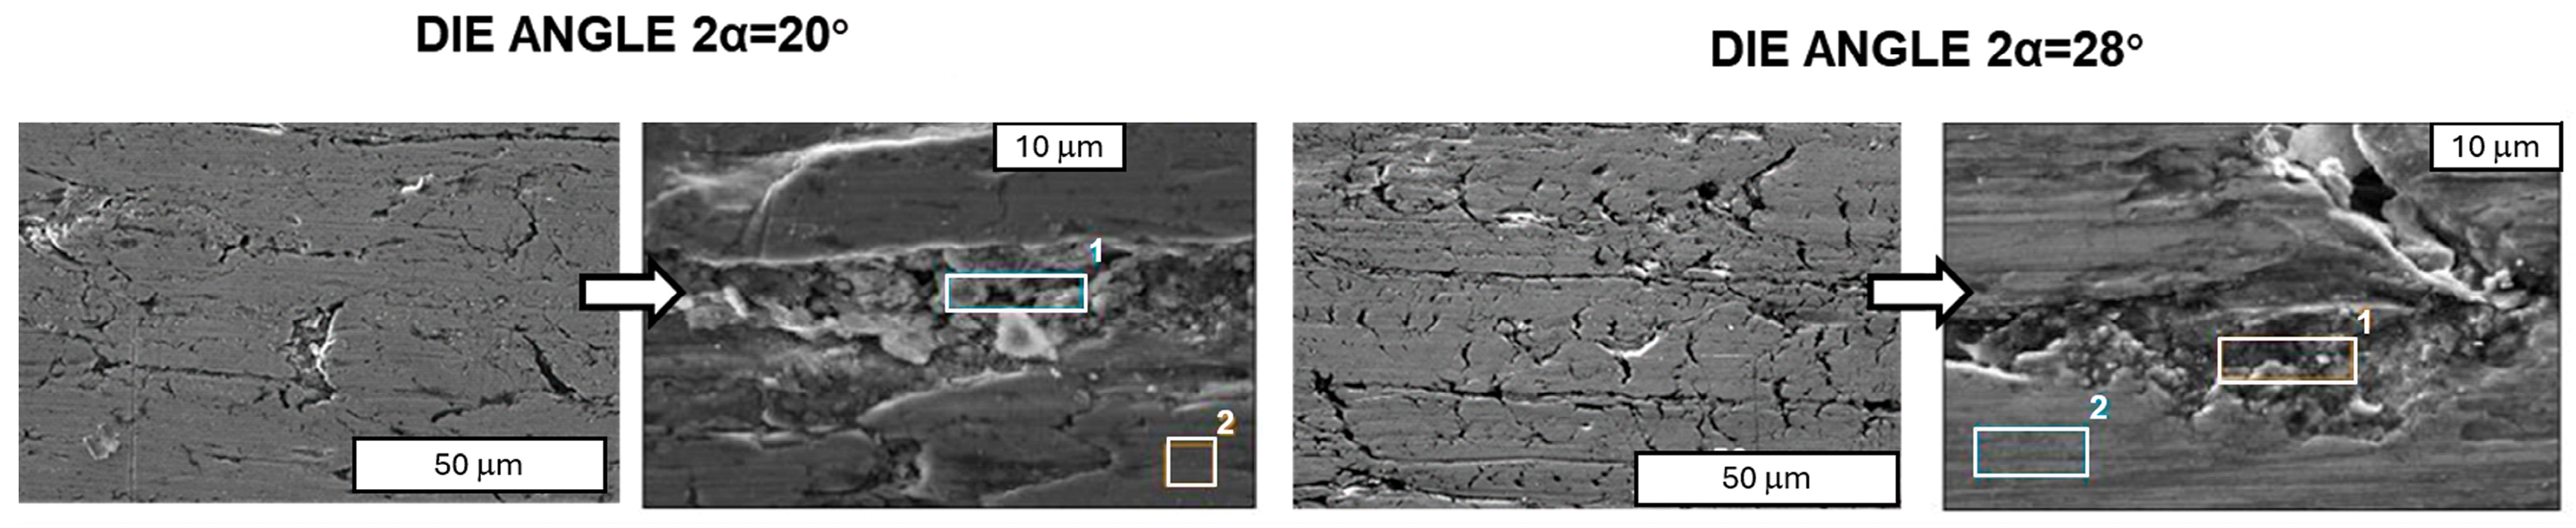
First, wires drawn using dies characterised by various angles were evaluated for surface quality via SEM (Hitachi model, Tokyo, Japan) and surface topography analyses. SEM images of the aluminium wire surfaces are shown in
Figure 2 and
Figure 3.
A detailed analysis of the surface of the aluminium wires is shown in
Figure 3, which reveals that the surfaces of the wires exhibit numerous scratches, irregular dents, irregularities, and material discontinuities resulting from the presence of a brittle near-surface layer of aluminium oxide. As part of the study, the chemical composition of the area around the post-failure cracks was evaluated.
Table 3 presents the results of the EDS analysis, and
Figure 3 shows the areas selected for EDS analysis.
Chemical analysis of the surface cracks on the wires revealed the presence of aluminium oxide, which forms a natural anti-corrosion layer that is several nanometres thick. Aluminium oxide is brittle and undergoes deformation and cracking during the deformation process, resulting in numerous cracks on the surface of the aluminium wires. Furthermore, silicon was also detected on the surface. The typical chemical composition of aluminium used for electrical purposes contains, depending on the grade, a total of 0.3 to 0.5% by weight of silicon and iron. These elements form various brittle phases of the Fe-Si and Al-Fe-Si types, which act as stress concentration points in the deformed wires. In particular, their presence on the surface of the drawn wire causes a network of surface microcracks to form during the drawing process, when the wire comes into contact with the wall of the drawing die’s working cone. It can be concluded that the larger the cone opening angle, the poorer the surface quality of the wire.
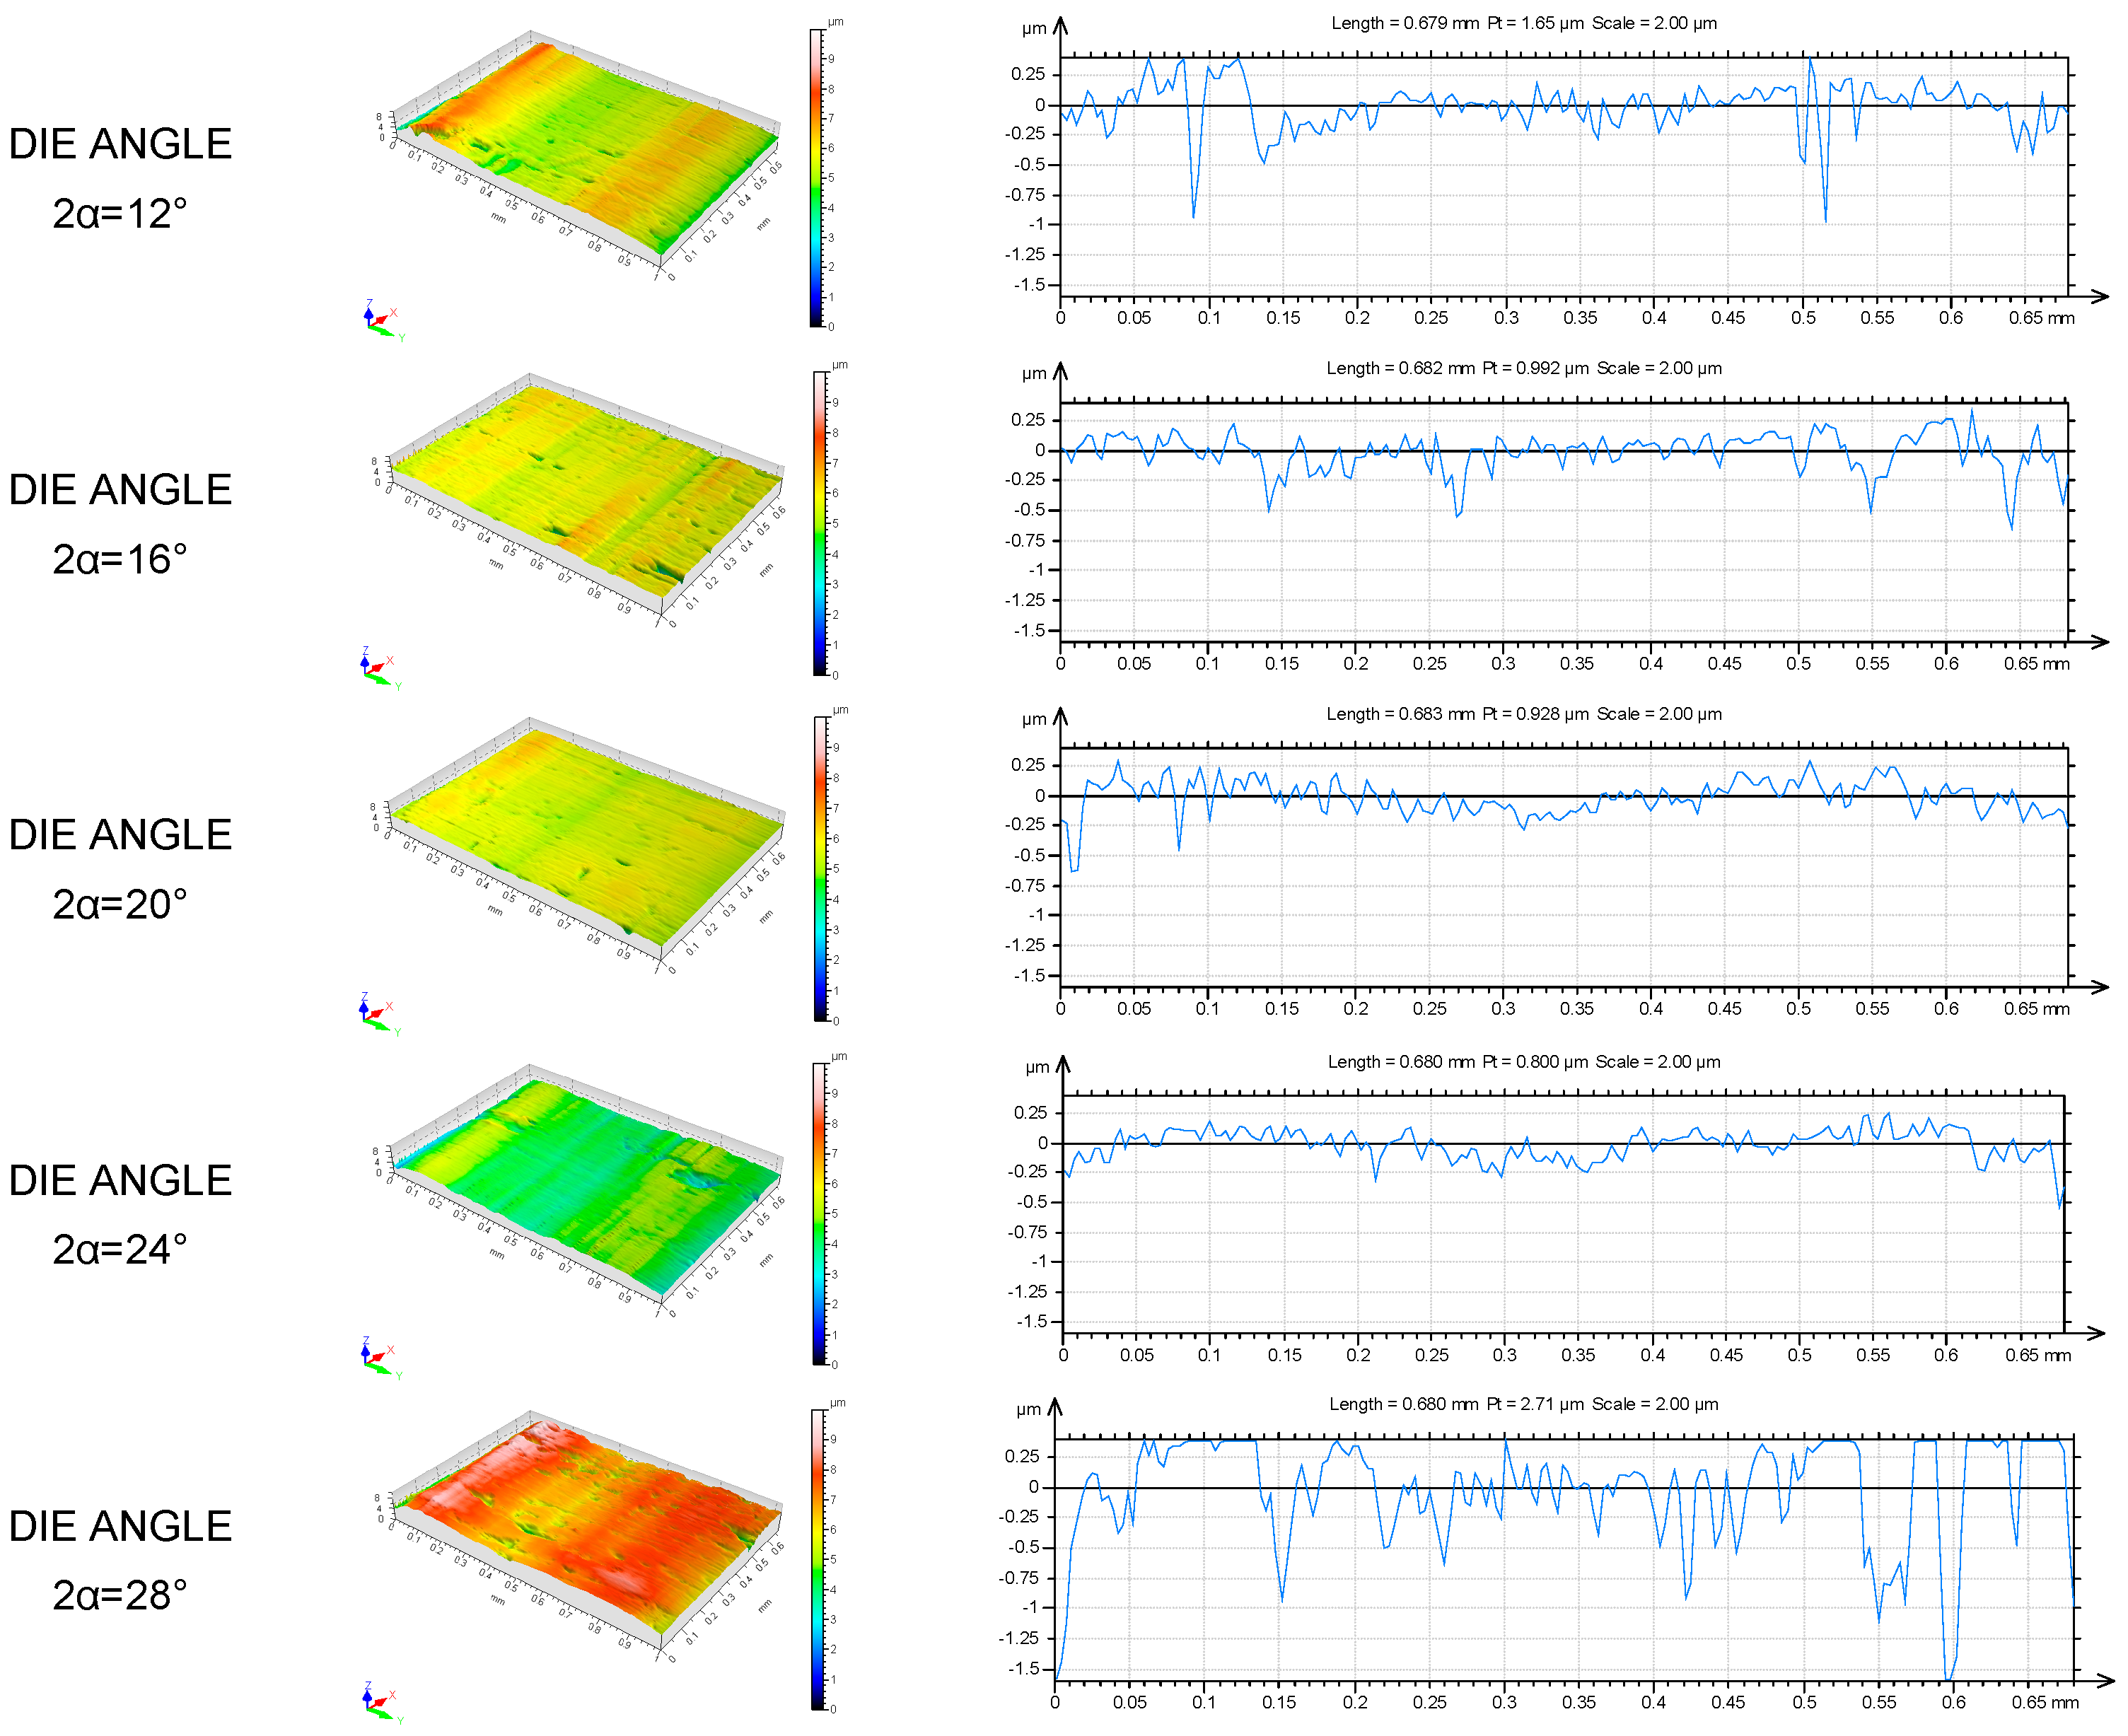
In a subsequent stage of the research, the surface topography and surface roughness of the aluminium wires were assessed.
Figure 4 presents the test results in the form of wire surfaces (surface topography) and profiles (roughness measurements).
Table 4 presents the determined surface topography and roughness parameters, specifically the arithmetic mean values of surface roughness (Sa), the maximum surface elevation (Sp), the maximum surface depression (Sv), the ten-point surface roughness (Sz), the density of elevations between specified cross-sections (Spc), the surface texture index (Str), and the roughness profile (Ra).
Based on the above test results, it can be concluded that the highest roughness profile Ra was observed when using wire drawing dies with angles of 28°. The remaining geometric die variants (12°–24°) demonstrated lower topographic parameter values.
The findings of the study suggest a correlation between surface quality and the fatigue strength of aluminium wires. It is important to note that any surface defect has the potential to become a crack initiation site during the fatigue process and, in the case of overhead conductors, the wires in the outer layer are particularly vulnerable. It has been established that inadequate surface quality and the presence of localised cracks in aluminium wires can serve as factors contributing to the initiation of cracks. It has been demonstrated that a reduced draw angle does not necessarily result in a surface that is characterised by a higher level of smoothness. It is evident that angles of a reduced size result in elevated friction levels, consequently increasing the risk of surface seizing, which, in turn, has a detrimental effect on surface quality. The angle should therefore be optimised to ensure a uniform balance between deformation and frictional forces. In addition, it is essential to guarantee continuous and effective lubrication.
3.2. Fatigue Results
This subsection presents the results of tests assessing the influence of the drawing die geometry—specifically, the opening angle of the working section—on the fatigue strength of the wires in question. Wöhler curves were constructed by plotting measurement points (the arithmetic mean of the number of cycles required to fail a specimen subjected to a given stress) on a stress-cycle number graph and then connecting them with a curve.
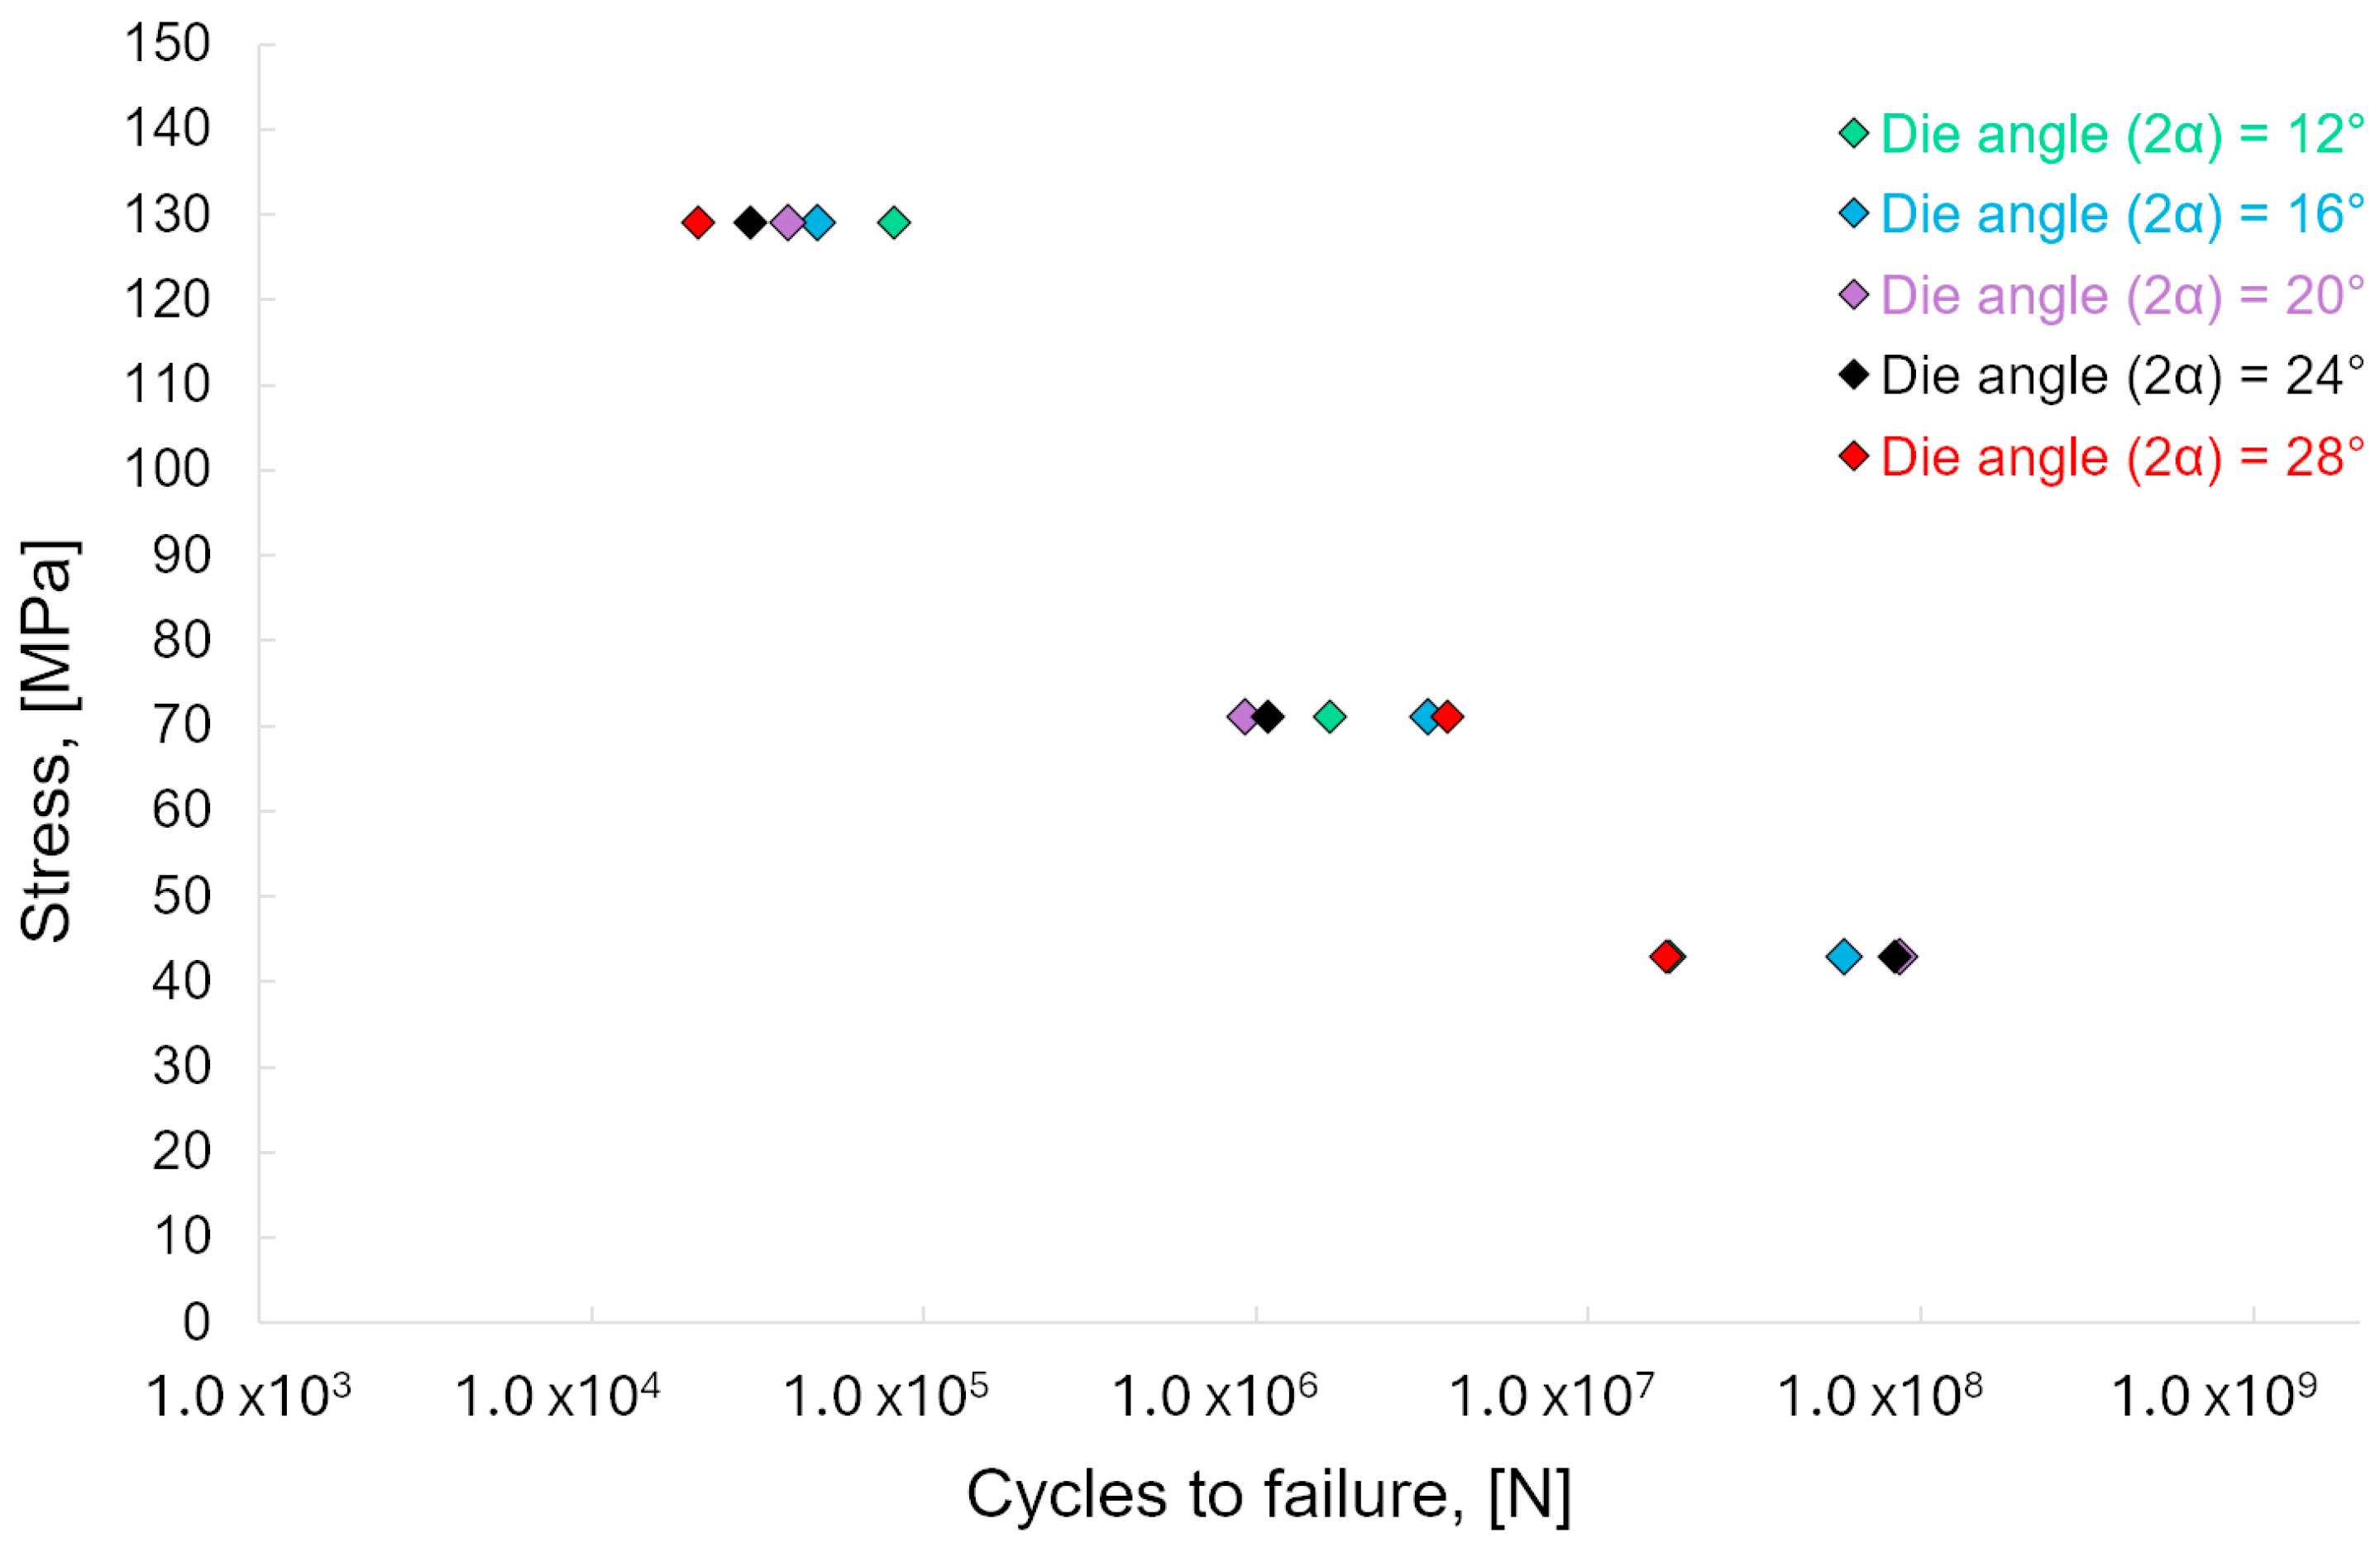
Table 5 and
Figure 5 show the fatigue test results and the aforementioned Wöhler curves for wires produced using drawing dies with different angles, respectively, illustrating the fatigue strength of the tested aluminium wires.
The preceding graph demonstrates that the highest fatigue strength was achieved by wires produced using drawing dies with working cone opening angles of 2α = 16° and 2α = 20°. At higher levels of bending stress (i.e., in the low-cycle fatigue strength test), the highest observed strength was recorded at an angle of 12°, while, at the lowest bending stress (i.e., in the high-cycle fatigue strength test), the highest number of cycles to failure was observed for wires produced using drawing dies with an angle of 2α = 16°. The results demonstrate that variations in the drawing angle result in variations in the high-cycle fatigue strength of the wires, with differences reaching up to 1 million cycles.
Conversely, alteration in the geometry of the drawing die results in non-uniform deformation across the cross-section of the wire. In particular, a modification in the drawing angle results in alterations in the distributions of compressive and tensile stresses within the outer and inner layers of the wires. This phenomenon impacts the magnitude of the residual stresses and can have both positive and negative effects. Previous research on residual stresses has demonstrated that the superposition of service and internal stresses frequently results in structural damage. A pivotal factor in the drawing process that influences the level of residual stress in the material is strain inhomogeneity, which is determined by the stresses present in the drawn material as it passes through the die. Plastic deformation occurs on the outer layer of the wire, while no such deformation occurs along the wire’s axis. This results in the material being strengthened, to varying degrees, in its deformation zone.
4. Conclusions
The experiments conducted as part of this study demonstrated the feasibility of controlling the fatigue strength of aluminium wires utilised in power cables without the need for metallurgical intervention. In particular, such control can be achieved by optimising the geometry of the drawing dies used in the wire drawing process. The detailed final conclusions obtained through the research and the analysis of the results are presented below.
1. The geometric parameters of the drawing die have a considerable impact on the surface quality of the wires that are produced. It was determined that the wires produced using drawing dies with large 2α angles (e.g., 28°) exhibited the poorest surface quality, characterised by a multitude of cracks, grooves, scratches, and inclusions. This was confirmed by the obtained 3D topography parameters, particularly the Ra parameter, which was lowest under die angles of 20 and 24 degrees.
2. The geometry of the die used during the drawing process has a substantial impact on the resulting material’s fatigue strength. It was found that, among the selected die parameters, aluminium wires produced using dies with an angle of 2α = 20° exhibited the highest fatigue strength. This conclusion pertains to high-cycle fatigue strength, for which disparities of up to one million cycles were observed.
3. Regarding low-cycle fatigue strength, the relationship stated in point 2 is not applicable. This is attributable to the greater role played by plastic deformation in low-cycle fatigue strength, with fatigue crack initiation occurring as a consequence of internal defects in the form of material discontinuities or inclusions. The experimental results reported here can be expected to inform the development of new drawing process technology, characterised by a variable unit strain value and variable die geometry in the deformation scheme. In the concluding phases of diameter reduction, the geometry of the drawing die assumes paramount importance.



 ,
,