1. Introduction
Aluminium, a key resource in manufacturing, is classified as a critical raw material by the European Union (EU) [
1,
2]. Its inherent qualities, such as lightweight, strength, corrosion resistance and recyclability, make it a suitable material for tackling the growing demand for sustainable products across different sectors [
3]. However, compared to other metals, producing aluminium from primary sources such as bauxite is highly energy intensive and results in significantly greater greenhouse gas emissions [
4].
Given this contrast between favourable properties and high production impacts, aluminium is increasingly investigated from a sustainability perspective [
3]. In this context, the sustainability of materials must be understood in a broad sense, encompassing environmental, energetic, metallurgical, and social dimensions across the entire supply chain. Meeting these expectations requires transparent and harmonised life cycle assessments (LCAs), based on agreed data and system boundaries among research and economic associations as well as legislators and standardisation bodies [
5].
Methodologically significant efforts have already been made to harmonise LCA approaches in the metals sector [
2], with the European Aluminium Association contributing with important reports and guidance for consistent assessment practices [
2,
3]. Nevertheless, substantial work remains to achieve fully comparable and context-sensitive LCA studies [
2,
6]. Key shortcomings in current aluminium LCA research include limited scope, in particular the frequent omission or strong simplification of the use phase, inconsistent timeframes and location as well as differing system boundaries and functional units (FUs) [
2,
6].
These issues manifest even more sharply when shifting the focus to the specific system under investigation: bridges. Here, several of the identified shortcomings become directly relevant. The challenge regarding the scope is particularly notable, as many bridge LCAs still adopt a cradle-to-gate perspective, leaving the use phase largely unaddressed, even though maintenance and degradation processes are responsible for substantial environmental burdens over the structure’s lifetime [
7]. Moreover, data availability during the use phase is limited. Degradation processes such as chloride-induced corrosion or fatigue damage are highly sensitive to environmental conditions. This dependency introduces significant uncertainty and has led researchers to propose the incorporation of physical deterioration and failure models into LCA frameworks [
6,
7].
Considering these methodological gaps, this study aims to contribute to a more robust modelling of bridge systems by focusing explicitly on the environmental impacts arising during the use phase. The main objective of this study is therefore to quantify and understand how modelling choices, related to degradation and maintenance, influence comparative LCA outcomes for aluminium- and steel-reinforced concrete bridge concepts.
2. Materials and Methods
This study applies a comparative LCA to assess how variations in degradation assumptions influence life-cycle impacts, with a focus on comparing an aluminium-reinforced concrete bridge to a steel-reinforced concrete alternative. A previously developed cradle-to-gate LCA is extended to include the use phase, enabling a broader scope evaluation of the initial results (cradle-to-gate).
The LCA methodology applied follows the EN ISO 14040/44 [
8,
9] standard. It was executed in the SimaPro 10.2.0.3 using the Ecoinvent v3.11 database. Environmental impacts were assessed using the Environmental Footprint (EF) v3.0 method, covering all impact categories listed in
Appendix A (
Table A1), with selected categories reserved to illustrate overall trends within the paper.
2.1. Goal and Scope Definition
The systems studied represent two metal-reinforced bridge designs:
An aluminium-reinforced concrete bridge concept based on recycled aluminium, and
a conventional steel-reinforced concrete bridge.
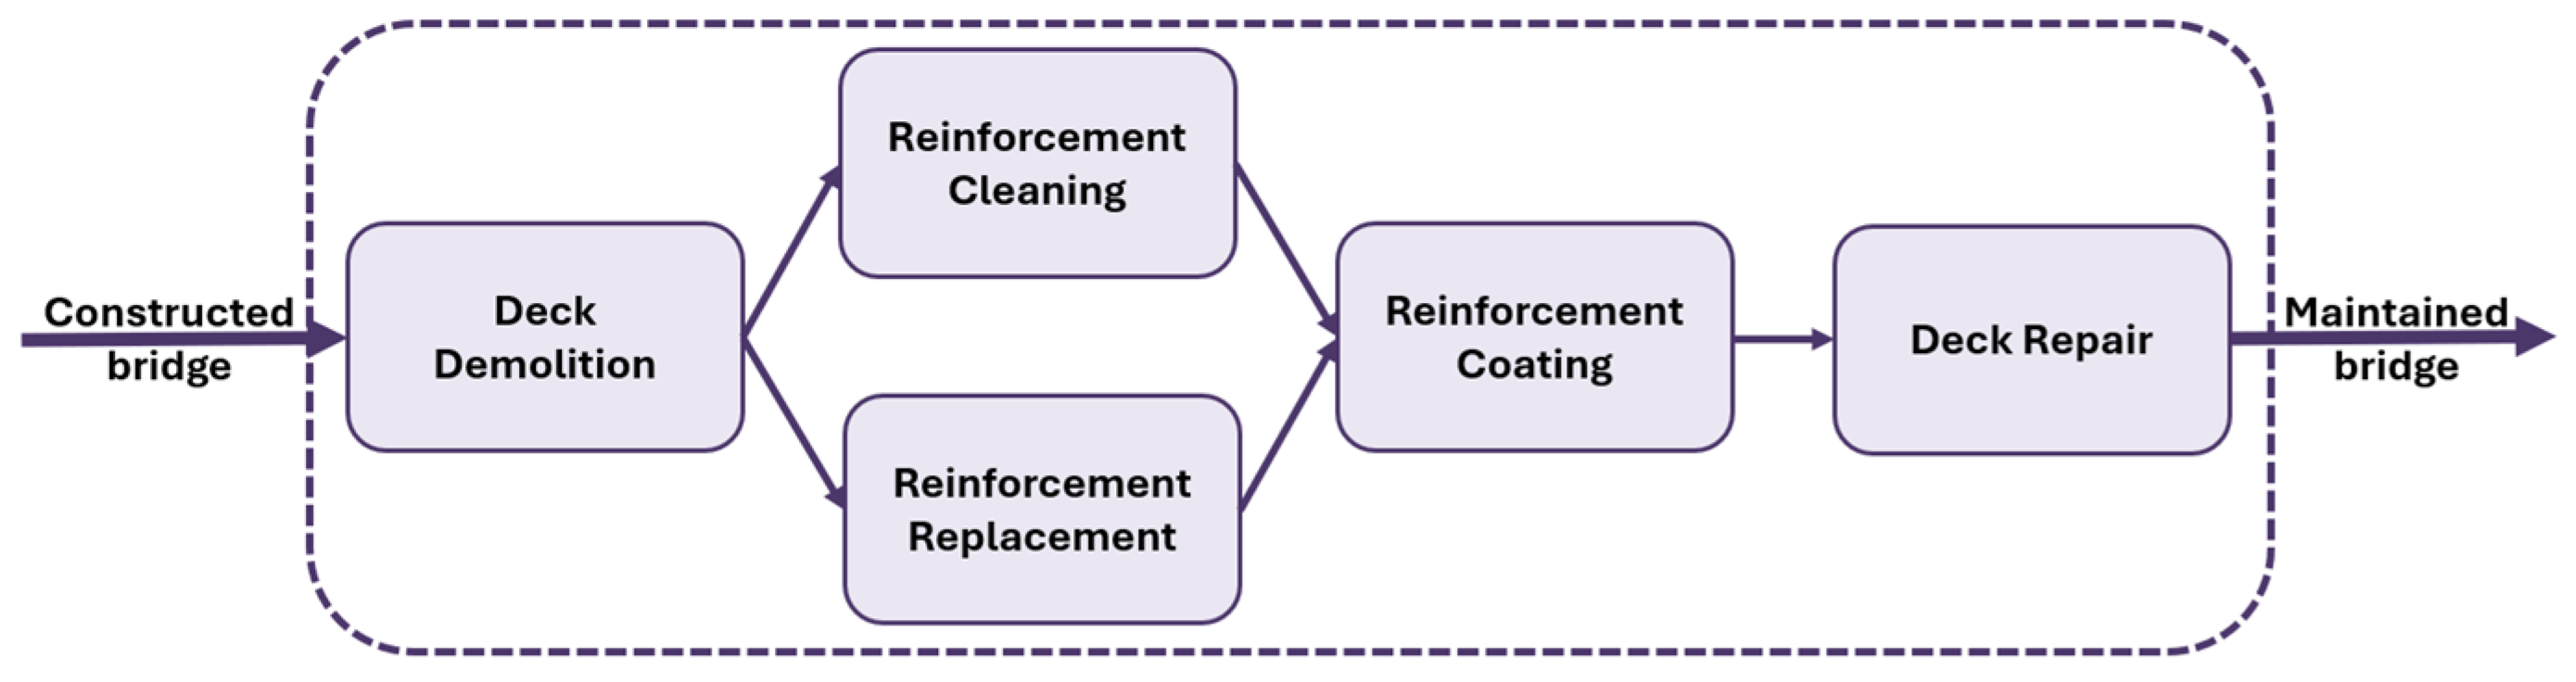
System boundaries were defined based on the use phase (maintenance). Bridge degradation assumptions and repair activities were taken into consideration over the defined service life (see
Figure 1).
The functional unit (FU) is defined as maintaining a 18 m long bridge deck with structural properties for supporting a 10 t axle load in a lifetime of 100 years. All inventory flows were normalised to this functional unit.
2.2. Description of the Bridges
The following section describes the analysed bridges, including structural design, materials, geometry and assumptions.
2.2.1. General Layout and Function
The bridges serve as a river crossing for vehicles and pedestrians on a private property in Norway. They have a total length of 18 m, divided into 3 spans with a deck width of 4 m.
2.2.2. Bridge Geometry
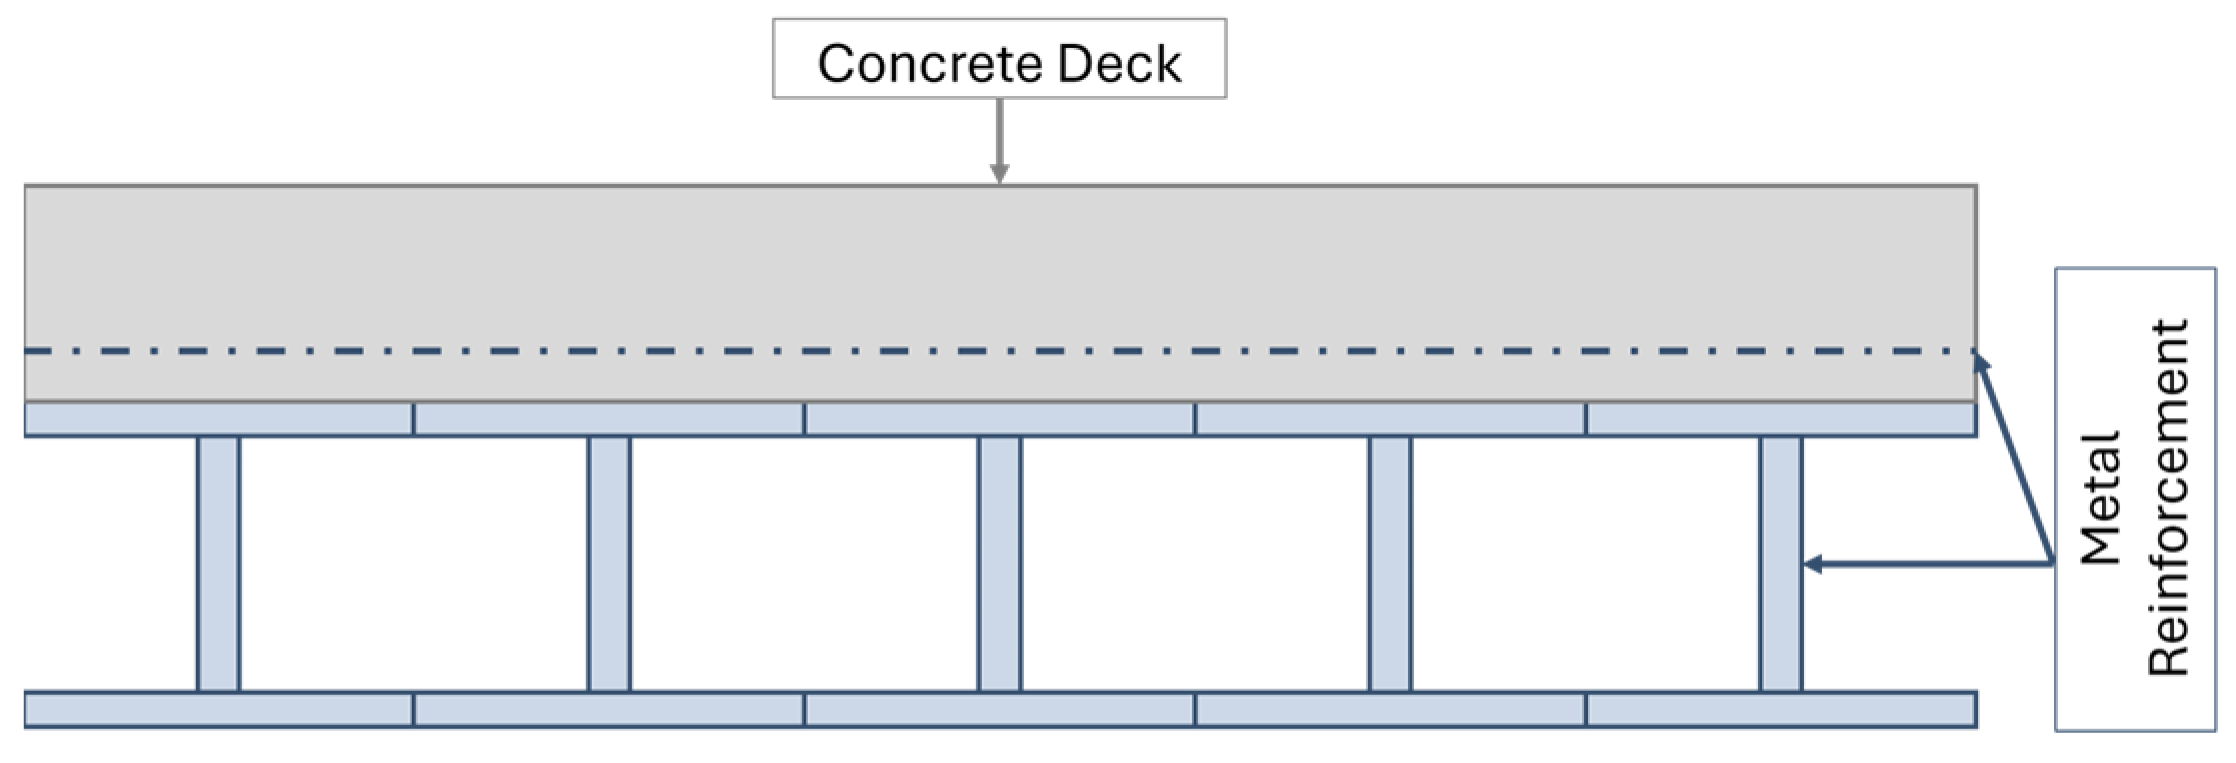
The aluminium-reinforced concrete bridge’s structure has an innovative design consisting of a concrete deck with aluminium reinforcement inlay built over aluminium profiles. A respective scheme is pictured in
Figure 2.
The steel-reinforced concrete bridge’s structure follows conventional design and holds equivalent structural properties to that of the aluminium-reinforced concrete bridge. For this reason, a schematic representation will not be depicted.
In
Table 1 below, the main dimensions of both bridges are listed.
Ultimately, these data define the material volumes and structural masses that determine the life-cycle inventory (LCI).
2.2.3. Material Specifications
The materials considered are as follows:
Aluminium-reinforced concrete bridge: Aluminium alloy composed of 92% aluminium scrap and 8% primary aluminium, combined with a low-pH concrete to prevent hydrogen evolution and corrosion of the aluminium reinforcement. The concrete contains 55% calcined clay (blue clay) and has a water–cement ratio of approximately 0.43.
Steel-reinforced concrete bridge: steel and commercial concrete in grade B35.
2.3. Life-Cycle Inventory (LCI) Development
Given the lack of comprehensive primary data for bridge maintenance and service-life modelling, the following hierarchy for data prioritisation was applied:
Primary data from project partners.
Peer-reviewed literature.
Industry sources, including technical specifications from equipment manufacturers, construction machinery data and product data sheets.
Where no data existed, assumptions were derived from comparable processes in the literature. All relevant studies were merged, compared, and validated with experts regarding their applicability to the studied system.
Bridge Lifetime and Maintenance Intervals
A 100-year service life was assumed in accordance with European design standards [
10] for both bridges. Maintenance of the steel-reinforced concrete bridge was modelled as shown in
Figure 1, including deck demolition (concrete removal), reinforcement cleaning and replacement, followed by reinforcement coating, and deck repair (reapplication of concrete). Transportation of materials was included based on data for Norwegian-owned lorries [
11]. The first maintenance is assumed to take place after 50 years on 50% of the deck area.
The aluminium-reinforced concrete bridge is currently assumed to be maintenance-free over its service life, based on performance projections by the project partners. Consequently, the use phase modelling in the LCA excludes the aluminium-reinforced concrete bridge. However, this assumption has not yet been experimentally or practically validated and is therefore critically examined in the discussion section of this paper.
2.4. Scenario and Sensitivity Analysis
The baseline assumption of 50% deck deterioration is varied to assess how different maintenance intensities (deterioration) influence environmental impacts of the steel-reinforced concrete bridge. This variation also addresses uncertainty associated with the use of secondary data. Two sensitivity parameters are introduced: deterioration extent (D) and reinforcement replacement ratio (R).
Deterioration extent (D) represents the share of the total deck area requiring maintenance after 100 years (25%, 50%, and 75%). An increase in D proportionally increases the volume of deck demolition, deck repair (concrete reapplication), and reinforcement treatment (cleaning and coating).
Reinforcement replacement ratio (R) represents the share of reinforcement within the deteriorated area that must be fully replaced (25%, 50%, and 75%). Importantly, R applies only to the portion of the deck affected by deterioration (D). Higher R values therefore increase the demand for new reinforcement, while lower values reflect scenarios where more reinforcement can be retained and treated (cleaned and coated).
Table 2 summarises the parameter values and the modelling rationale. Both parameters were selected, as the timing and intensity of maintenance interventions constitute one of the major sources of uncertainty in the use phase of infrastructure LCAs, largely driven by the uncertain nature of environmental exposures and site-specific degradation processes [
12].
3. Results
The modelled deterioration states lead to distinct environmental impact distributions, with increasing deterioration generally resulting in higher total impacts and three characteristic patterns emerging across replacement rates, which will be described in the following subsections.
3.1. Constant Impacts
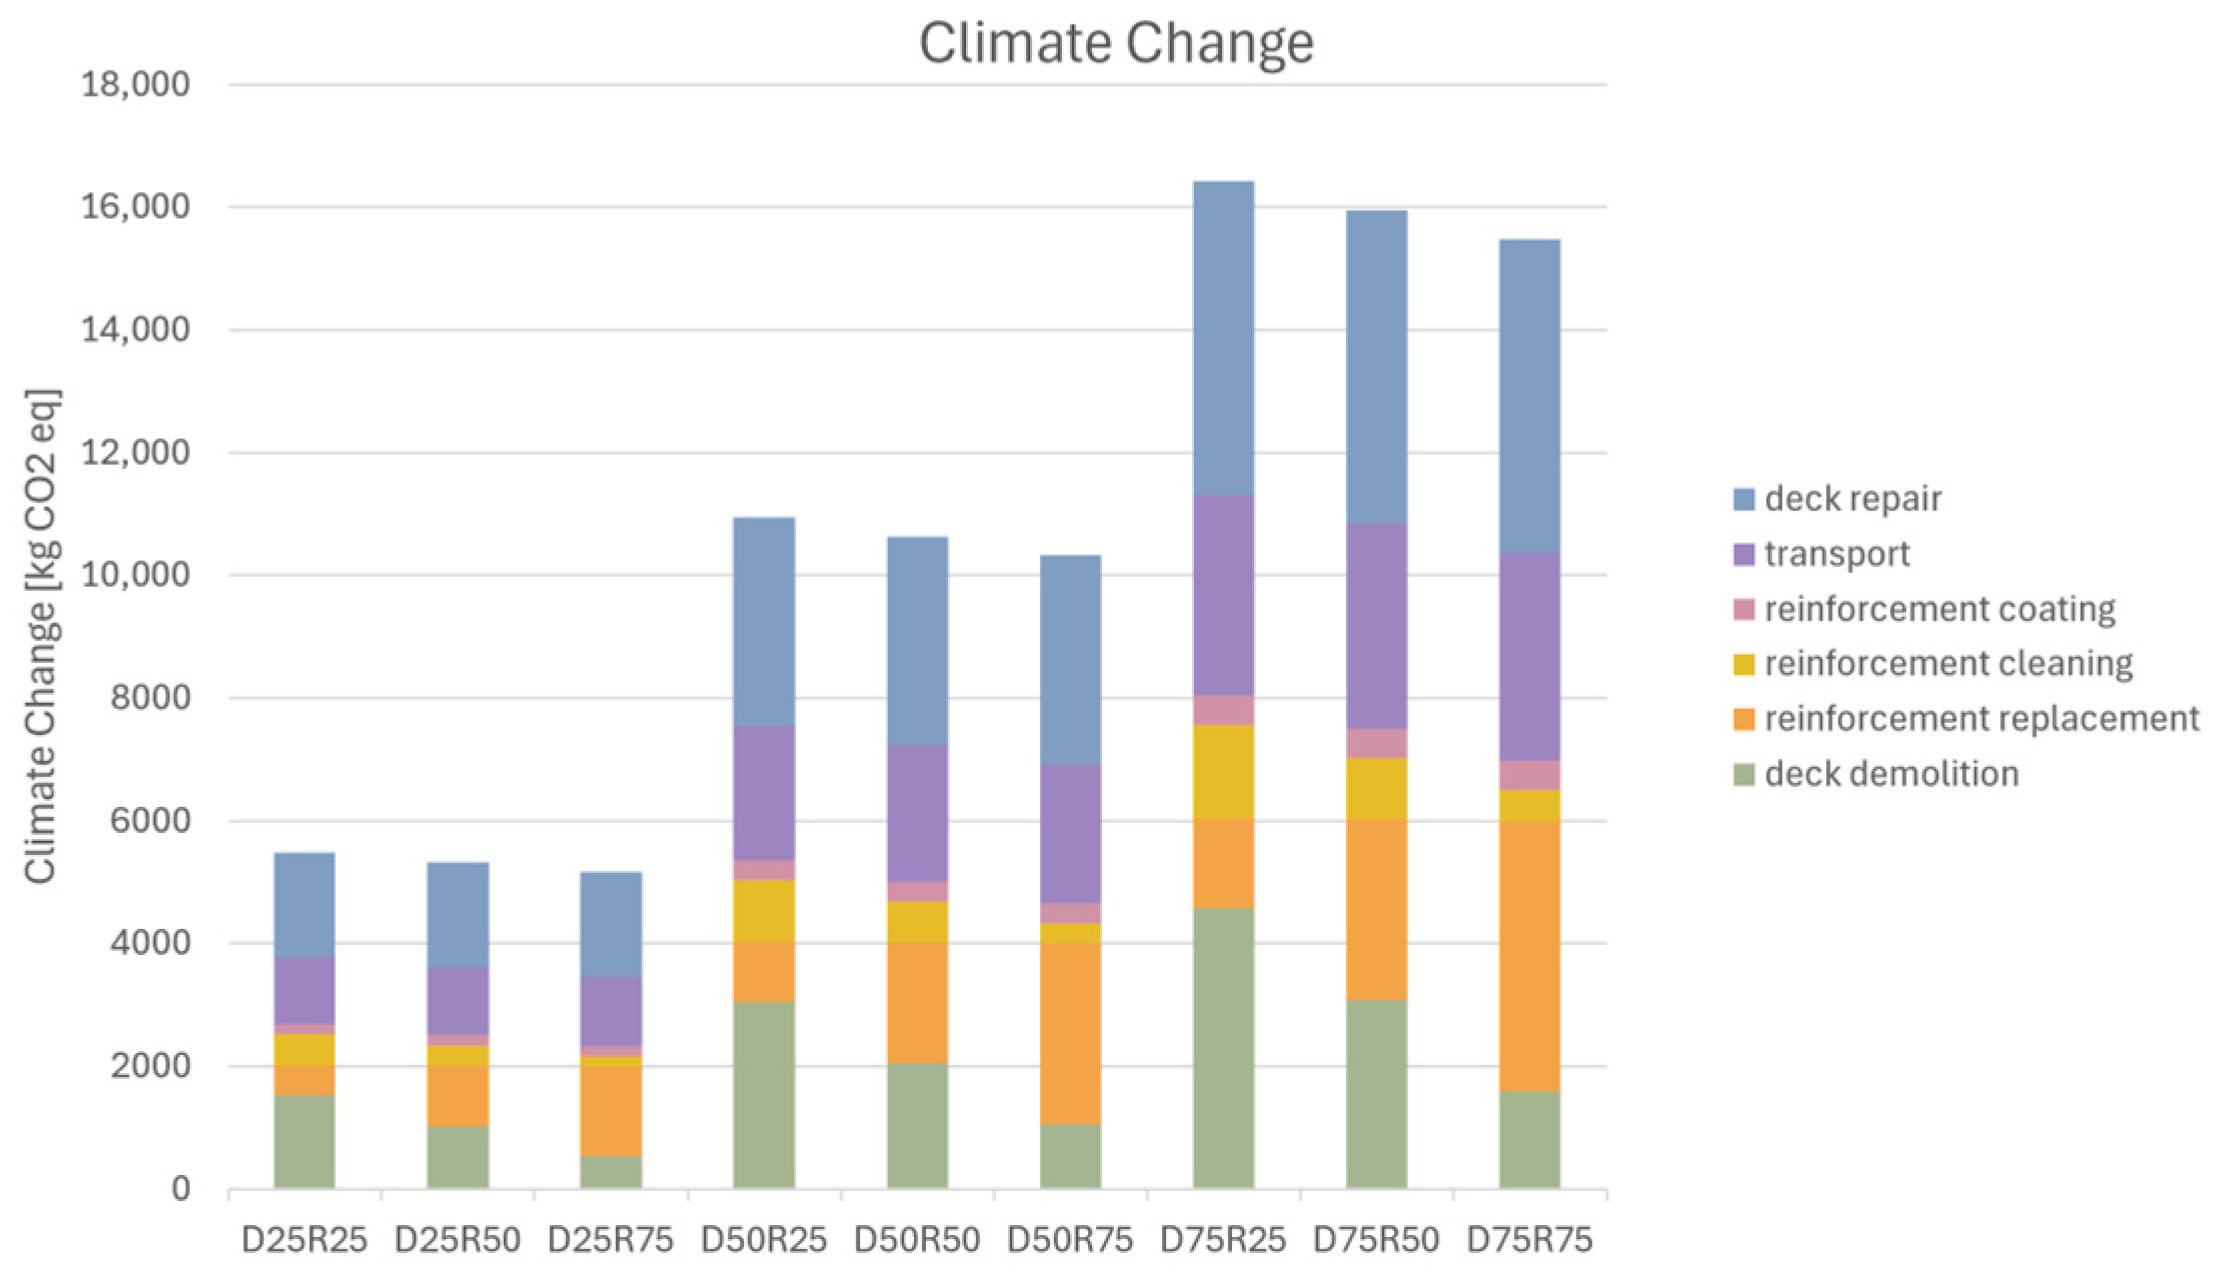
The first pattern is a nearly constant impact across replacement rates within one deterioration scenario. This is most pronounced in the climate change impact category but also occurs in land use, ozone depletion and the resource use categories. In deterioration state D25, the climate change results vary only slightly among replacement rate scenarios (5159.95–5472.01 kg CO
2-eq) (see
Table 3), which translates to a relative difference of around −2.9% between (R)-rates. The relative differences are similarly small in the other deterioration states.
The near-constant total impact (
Figure 3) arises from two opposing subprocesses: increasing impacts from reinforcement replacement and decreasing impacts from deck demolition. These effects largely cancel each other out.
3.2. Decreasing Impacts
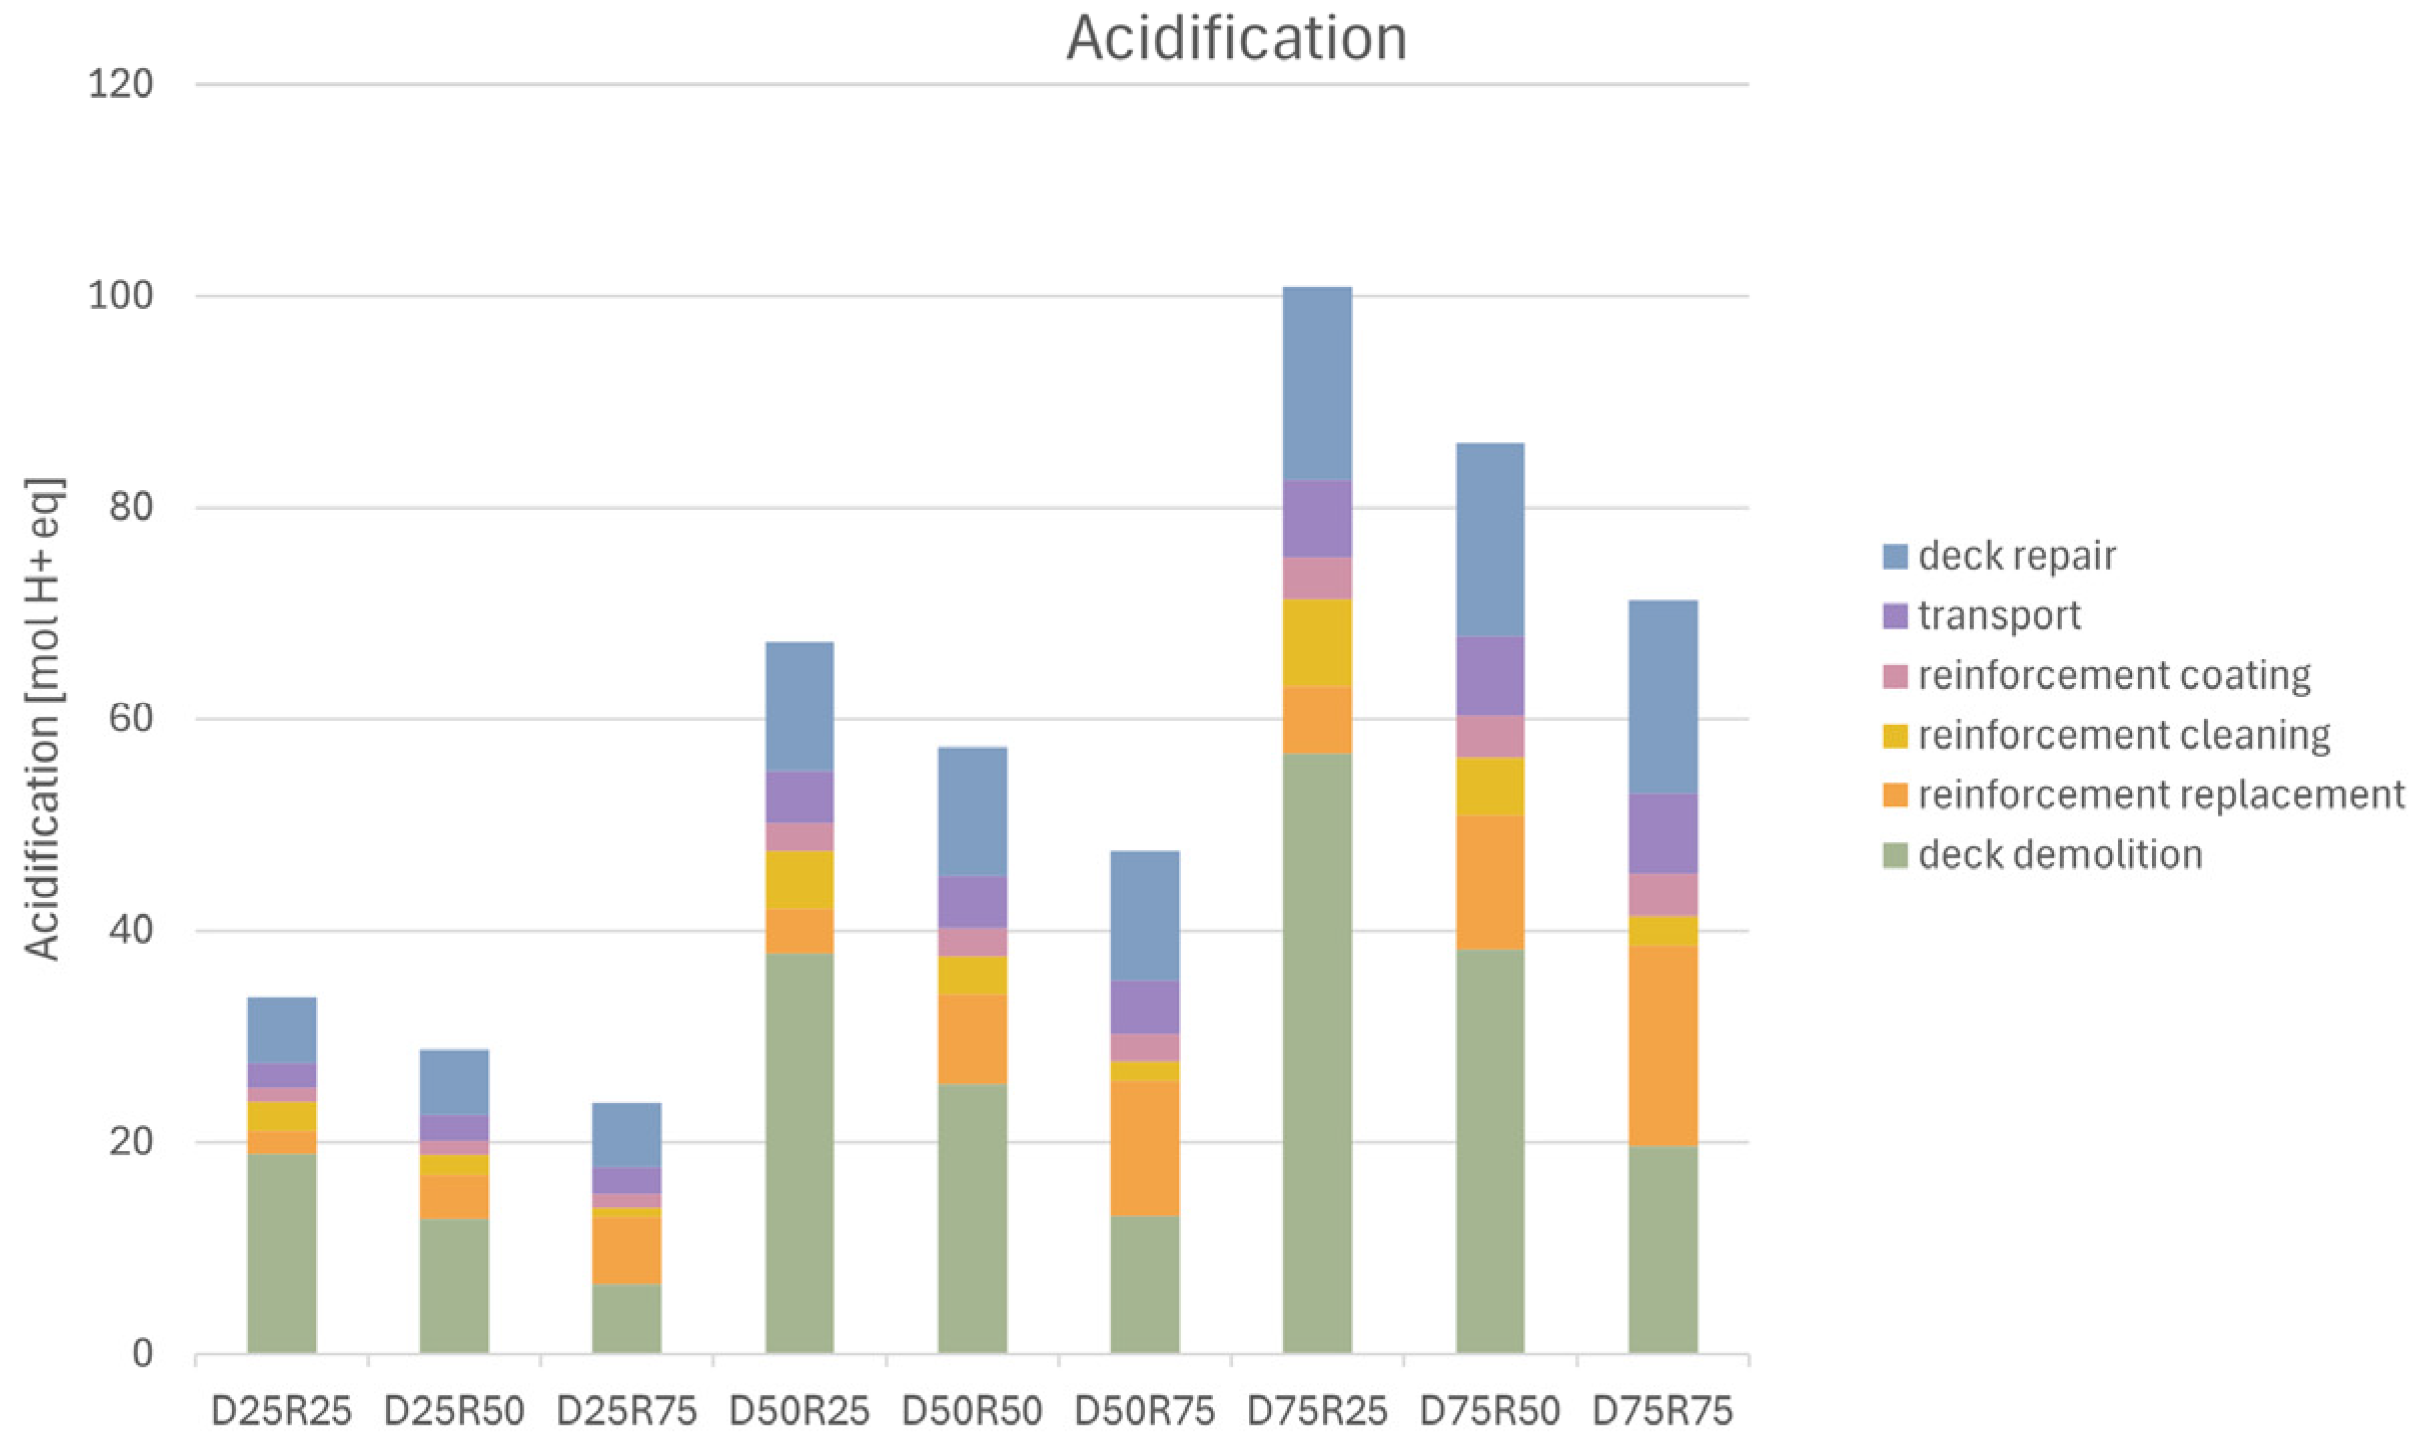
A different pattern is observed in several other impact categories, where impacts decrease with increasing replacement rate within a given deterioration state. This behaviour occurs for acidification, marine and terrestrial eutrophication and photochemical ozone formation and is particularly pronounced for acidification (see
Figure 4).
In D25, for example, acidification decreases from 23.74 to 33.63 mol H
+-eq (
Table 4). The relative reductions in replacement rates are −14.7% and −17.2%. This pattern also holds for the remaining deterioration scenarios (
Figure 4).
The net decrease in total impact with increasing replacement rate (
Figure 4) is again driven by opposing subprocess trends, with the decreasing deck demolition impacts dominating.
3.3. Increasing Impacts
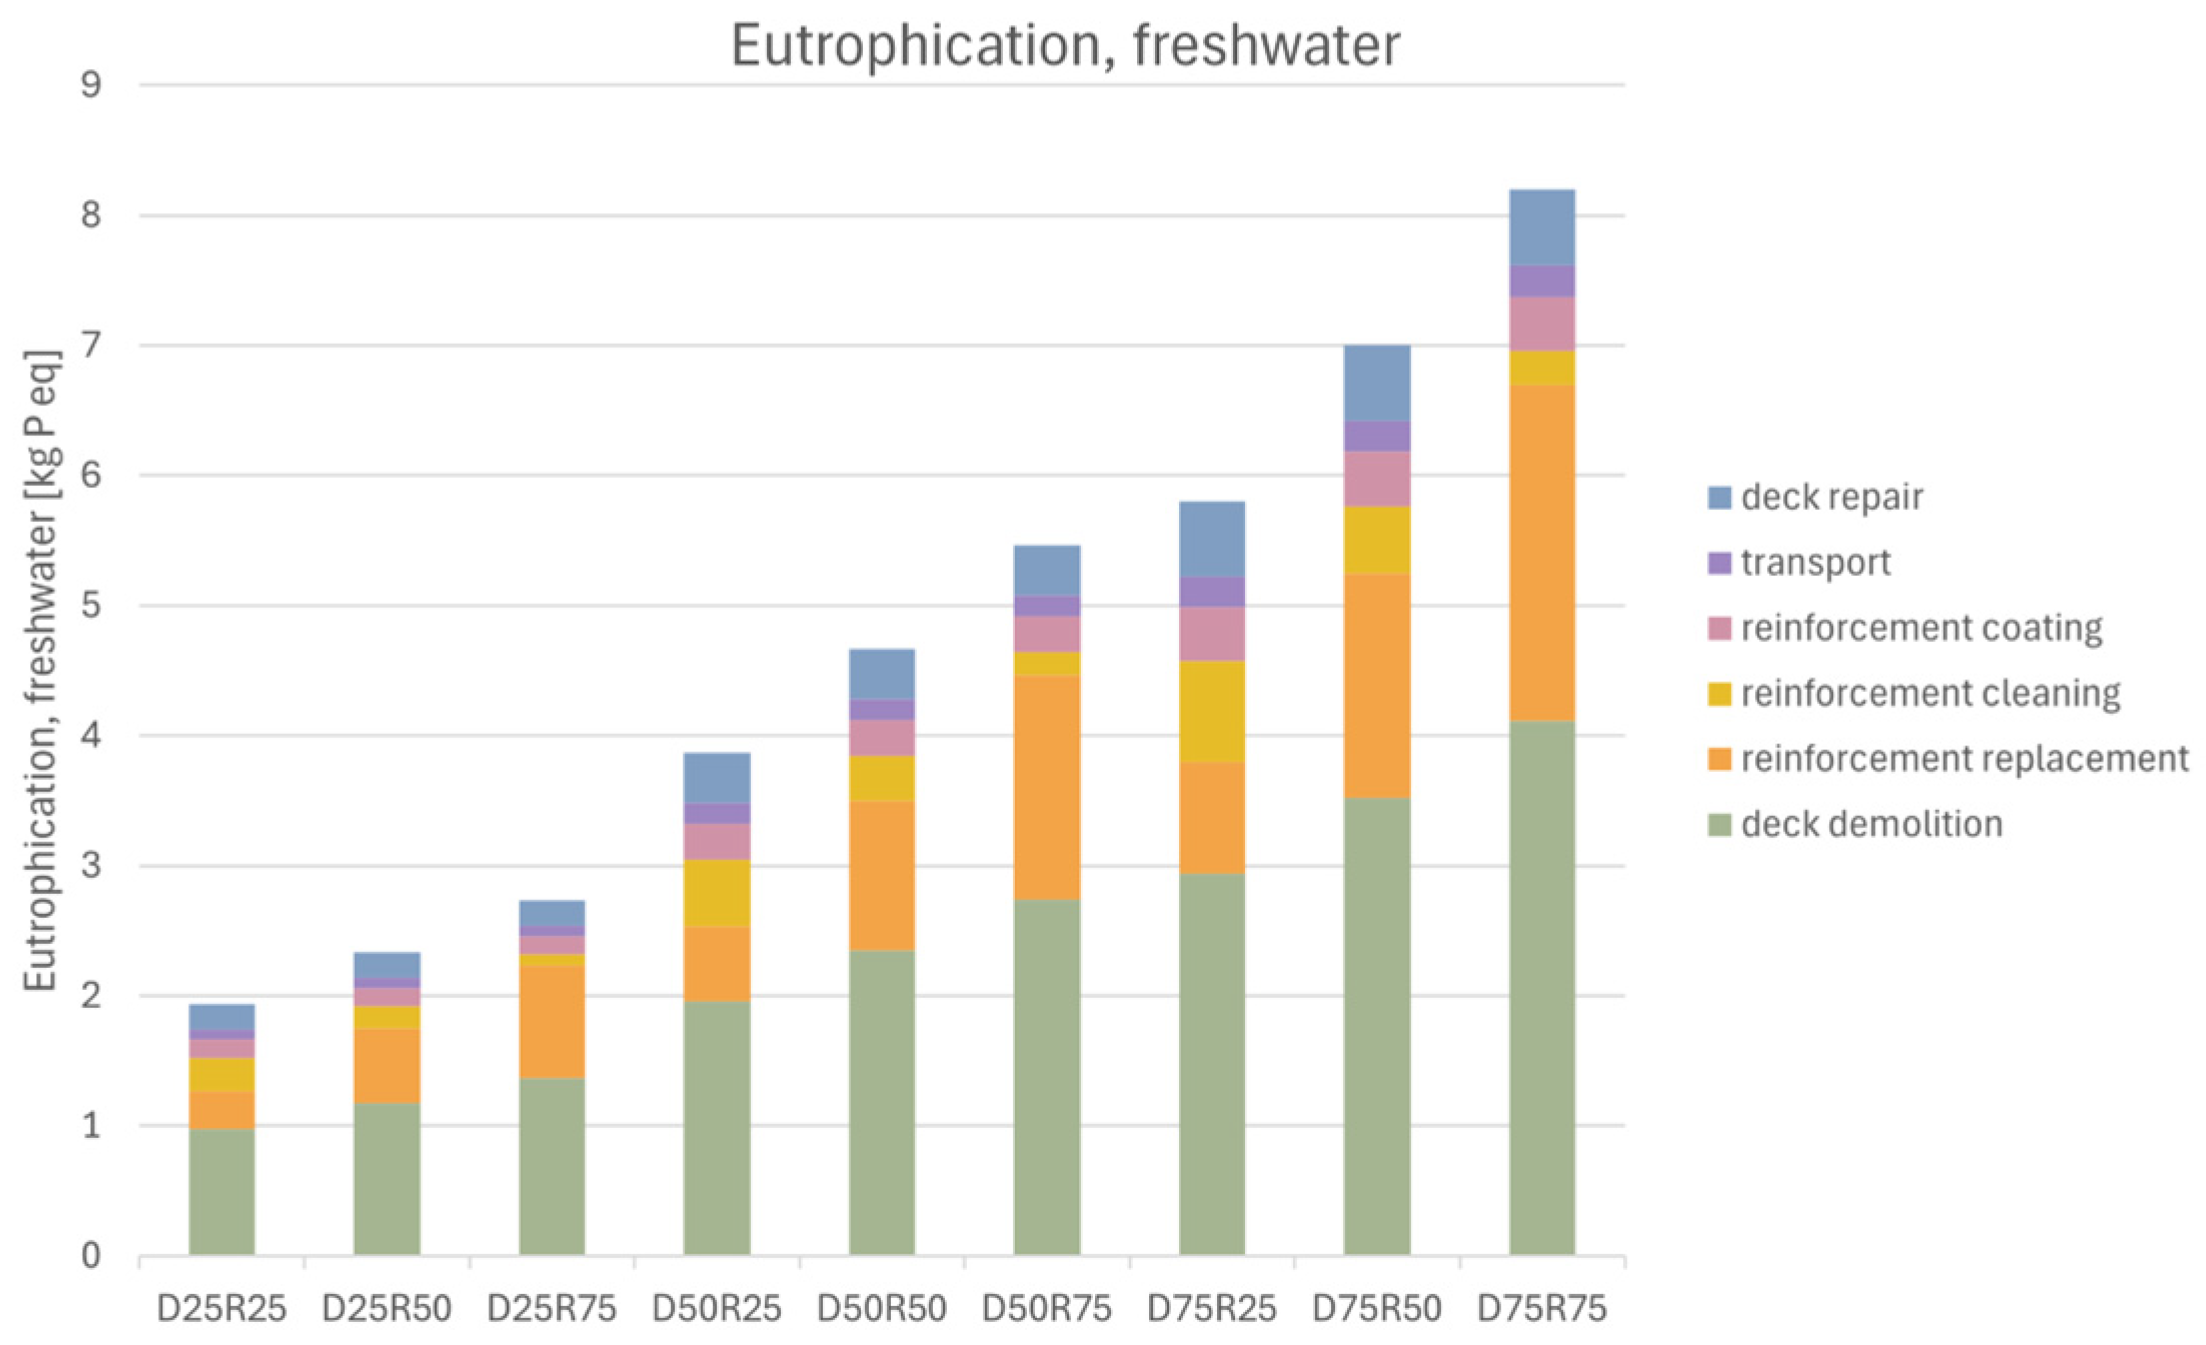
The third behavioural pattern is characterised by increasing environmental impacts with a rising replacement rate and is observed for the remaining EF v3.1 impact categories. This behaviour is exemplified by the impact category eutrophication of freshwater, where impacts increase with replacement rate across all deterioration levels, following the same qualitative trend.
As shown in
Figure 5 and
Table 5, impacts from reinforcement replacement increase while demolition impacts decrease. However, in this category, the contributions of the process reinforcement replacement are dominant, which results in a net increase in total impact that intensifies at higher deterioration levels.
3.4. Statistics
To evaluate how sensitive the results are to different deterioration scenarios, descriptive statistics were used to calculate the range of impacts across all scenarios (
Table 6). The wide range observed (over 218.14%) shows that assumed deterioration states strongly influence the overall environmental performance of the steel-reinforced concrete bridge.
3.5. Comparison of Bridge Types
The results underline the substantial influence of maintenance-related processes on the overall impacts of conventional steel-reinforced concrete bridges. For the aluminium-reinforced concrete bridges, there are no impacts connected to the bridge’s use phase due to the assumption of a maintenance-free life cycle. This can be illustrated by having the climate change impact category as an example. The cradle-to-gate LCA result for climate change impact was estimated in our previous study at 8.28 t CO
2-eq for the aluminium-reinforced concrete bridge and 15.45 t CO
2-eq for the steel-reinforced concrete bridge. When compared with the use phase (maintenance) impact determined in this study, which ranges from 5.16 to 16.42 t CO
2-eq (
Figure 3), it becomes evident that the use phase represents a sizeable share (25.04–51.52%) of the cradle-to-use life-cycle emissions.
4. Discussion
The discussion addresses the results considering the methodological restrictions inherent in long-term infrastructure LCAs. Environmental outcomes are therefore evaluated with respect to uncertainties in the use phase representation, deck deterioration extent and reinforcement replacement rates.
4.1. Methodological Challenges
For the steel-reinforced concrete bridge, the representation of the use phase model was constrained by limited primary data, a common challenge in infrastructure LCAs [
2,
13]. To address the uncertainty, a scenario-based framework was applied to systematically assess the influence of key assumptions.
For the aluminium-reinforced concrete bridge, a key limitation is the assumption of a maintenance-free use phase over the 100-year service life. Although this assumption is supported by project partners and justified by the high corrosion resistance of aluminium [
5], it affects the comparability with the steel-reinforced concrete bridge by introducing an asymmetry in the reliability of a key modelling parameter. As the sensitivity results for the conventional bridge indicate that maintenance can contribute a significant share of the total environmental impacts, deviations from the assumed maintenance-free scenario could result in substantially higher impacts than currently reported. Therefore, the comparison between the bridge alternatives should be interpreted with caution, and future empirical validation is required.
4.2. Interpretation of Findings
Regarding the environmental results, it is to say that higher deterioration levels generally increase environmental impacts due to greater maintenance demand.
The importance of deck demolition techniques varies by impact category, contributing up to 55% in acidification but down to 10% in climate change. The observed deterioration (D)-related patterns are largely driven by the applied demolition methods. Water-jet demolition, used when reinforcement is retained, is more energy- and water intensive than the pneumatic hammer technique and therefore dominates the impacts. This effect can outweigh impacts of the reinforcement replacement process, leading to decreasing total impacts with increasing replacement rate (R).
Impacts from the reinforcement cleaning unit process decrease with increasing reinforcement replacement rates (R). This is due to a smaller reinforcement surface requiring cleaning treatment. While its contribution to climate change is negligible, reinforcement cleaning is more relevant for acidification due to associated energy use and waste generation.
The increasing contribution from reinforcement replacement with higher replacement rates (R) is due to the increasing metal demand, which relies on intense metal extraction and processing that are energy- and resource-intensive, therefore affecting multiple impact categories.
Reinforcement coating impacts are independent of replacement rates (R), as both cleaned and replaced reinforcement require coating, resulting in constant impacts within each deterioration rate.
Deck repair impacts are independent of replacement rate (R), as concrete application and levelling remain unchanged within each deterioration level (D). In contrast, transport impacts increase with replacement rate (R) and deterioration level (D) due to higher material demand, with stronger contributions to climate change driven by diesel combustion.
Overall, the wide impact range of outcomes from descriptive statistics highlights the strong sensitivity of results to deterioration (D) and replacement assumptions (R). This emphasises the importance of selecting appropriate maintenance assumptions when modelling long-term impacts.
Acknowledging that around 25–51% of the cradle-to-use impacts are caused by maintenance activities highlights the relevance of the use phase for the life cycle impacts of a steel-reinforced concrete bridge. For the aluminium-reinforced concrete bridge, expanding the analysis’ scope to include the use phase highlights its relative environmental advantage due to the applied assumptions.
5. Conclusions
This study extended a cradle-to-gate LCA by incorporating deterioration and maintenance, enabling a cradle-to-use comparison between an aluminium-reinforced concrete bridge and a steel-reinforced concrete bridge. The results show that deterioration assumptions and reinforcement replacement rates strongly influence environmental impacts, specifically in three characteristic behavioural patterns.
The large impact variation ranges observed across scenarios demonstrate that the use phase modelling introduces substantial uncertainty and confirm the critical role of deterioration modelling in infrastructure LCAs. Even moderate changes in deterioration or replacement assumptions can significantly alter the environmental performance of the bridge.
The findings further highlight the importance of a complete life-cycle perspective, particularly for reinforced concrete systems, as omitting life-cycle phases risks overlooking key environmental drivers. While the aluminium reinforced concrete bridge appears environmentally favourable within the assessed scope, the assumption of maintenance-free service life remains unverified and represents a major source of uncertainty.
Overall, the study underscores the need for improved understanding of degradation processes, their temporal progression, higher-quality, and more consistent data to enable robust environmental assessments.
6. Outlook
Future research should strengthen the empirical basis for degradation and maintenance modelling, particularly for aluminium-reinforced concrete bridges. Validation of the maintenance-free assumption through field data or experimental studies is essential to reduce current uncertainties, alongside the development of consistent degradation models and more detailed maintenance inventories for steel-reinforced concrete bridges.
Extending the analysis to a cradle-to-grave scope and including additional bridge types, material concepts, and real-world monitoring data would further improve the robustness and generalisability of environmental assessments for bridge designs.
Author Contributions
Conceptualization, J.R. and A.L.T.D.S.; methodology, J.R. and A.L.T.D.S.; software, J.R.; validation, J.R. and A.L.T.D.S.; formal analysis, J.R. and A.L.T.D.S.; investigation, J.R. and A.L.T.D.S.; resources, G.R.; data curation, J.R.; writing—original draft preparation, J.R.; writing—review and editing, A.L.T.D.S.; visualization, J.R.; supervision, G.R.; project administration, G.R.; funding acquisition, G.R. All authors have read and agreed to the published version of the manuscript.
Funding
The authors would like to express their gratitude to the Research Council of Norway for supporting the project number 328843.
Institutional Review Board Statement
Not applicable.
Informed Consent Statement
Not applicable.
Data Availability Statement
Restrictions apply to the availability of these data, which were used under license for the current study, and so are not publicly available. Data are however available from the authors upon reasonable request and with permission of the involved Alugreen project partners’ Review Board.
Conflicts of Interest
The authors declare no conflict of interest.
Abbreviations
The following abbreviations are used in this manuscript:
| LCA | Life Cycle Assessment |
| LCI | Life Cycle Inventory |
| LCIA | Life Cycle Impact Assessment |
| EU | European Union |
| FU | Functional Unit |
| EAA | European Aluminium Association |
| EF | Environmental Footprint |
Appendix A
Table A1.
Impact categories of environmental footprint (EF) v3.0 method.
Table A1.
Impact categories of environmental footprint (EF) v3.0 method.
| Impact Category | Unit |
|---|
| Acidification | mol H+-eq |
| Climate change | kg CO2-eq |
| Ecotoxicity, freshwater | CTUe |
| Particulate matter | disease inc. |
| Eutrophication, marine | kg N-eq |
| Eutrophication, freshwater | kg P-eq |
| Eutrophication, terrestrial | mol N eq |
| Human toxicity, cancer | CTUh |
| Human toxicity, non-cancer | CTUh |
| Ionising radiation | kBq-235-eq |
| Land use | Pt |
| Ozone depletion | kg CFC-11-eq |
| Photochemical ozone formation | kg NMVOC-eq |
| Resource use, fossils | MJ |
| Resource use, minerals and metals | Kg Sb-eq |
| Water use | m3 depriv. |
References
- Haghani, R.; Yang, J.; Pasquale, A.; Ricci, F.; Valvo, P.S. SUREBRIDGE Deliverable: D2.1 Refurbishment of Existing Concrete and Steel-Concrete Bridge Structures; Technical Report; FiberCore Europe B.V: Rotterdam, Netherlands, 2017. [Google Scholar] [CrossRef]
- Rossi, F.; De Bernardi, C.; Frey, M.; Niero, M. From past critiques to present challenges: A review of LCA approaches and results in the aluminum industry. Waste Manag. 2025, 204, 114900. [Google Scholar] [CrossRef] [Scilit] [PubMed]
- European Aluminum Association. Environmental Profile Report 2024: Executive Summary Version 2.0; European Aluminum: Brussels, Belgium, 2025. [Google Scholar]
- Norgate, T.E.; Jahanshahi, S.; Rankin, W.J. Assessing the environmental impact of metal production processes. J. Clean. Prod. 2007, 15, 838–848. [Google Scholar] [CrossRef] [Scilit]
- Raabe, D.; Ponge, D.; Uggowitzer, P.J.; Roscher, M.; Paolantonio, M.; Liu, C.; Antrekowitsch, H.; Kozeschnik, E.; Seidmann, D.; Gault, B.; et al. Making sustainable aluminum by recycling scrap: The science of “dirty” alloys. Prog. Mater. Sci. 2022, 128, 100947. [Google Scholar] [CrossRef] [Scilit]
- Liu, G.; Müller, D.B. Addressing sustainability in the aluminum industry: A critical review of life cycle assessments. J. Clean. Prod. 2012, 35, 108–117. [Google Scholar] [CrossRef] [Scilit]
- Nagai, Y.; Ferrara, L. Comparative life cycle assessment of UHPFRC bridge deck overlays. Case Stud. Constr. Mater. 2025, 23, e05442. [Google Scholar] [CrossRef] [Scilit]
- ISO 14040; Environmental Management—Life Cycle Assessment—Principles and Framework. International Organization for Standardization: Geneva, Switzerland, 2006. [CrossRef] [Scilit]
- ISO 14044; Environmental Management—Life Cycle Assessment—Requirements and Guidelines. International Organization for Standardization: Geneva, Switzerland, 2006. [CrossRef] [Scilit]
- EN 1992-2; Eurocode 2—Design of Concrete Structures—Part 2: Concrete Bridges—Design and Detailing Rules. European Committee for Standardization: Brussels, Belgium, 2005. [CrossRef] [Scilit]
- Sener, A.B.; Norsk Bane, C.D. VESTLANDSBANEN FEASIBILITY STUDY—Deliverable 2.2: Current Demand for Freight Transport; Norsk Bane: Ålesund, Norway, 2024. [Google Scholar]
- Navarro, I.J.; Yepes, V.; Martí, J.V.; González-Vidosa, F. Life cycle impact assessment of corrosion preventive designs applied to prestressed concrete bridge decks. J. Clean. Prod. 2018, 196, 698–713. [Google Scholar] [CrossRef] [Scilit]
- Barbhuiya, S.; Das, B.B. Life Cycle Assessment of construction materials: Methodologies, applications and future directions for sustainable decision-making. Case Stud. Constr. Mater. 2023, 19, e02326. [Google Scholar] [CrossRef] [Scilit]
Figure 1.
System’s boundary, covering deck demolition, reinforcement cleaning, reinforcement replacement, reinforcement coating and subsequent deck repair.
Figure 1.
System’s boundary, covering deck demolition, reinforcement cleaning, reinforcement replacement, reinforcement coating and subsequent deck repair.
Figure 2.
Schematic representation of the aluminium-reinforced concrete bridge structure, illustrating the concrete deck and underlying metal reinforcement system.
Figure 2.
Schematic representation of the aluminium-reinforced concrete bridge structure, illustrating the concrete deck and underlying metal reinforcement system.
Figure 3.
Absolute climate change impacts for scenarios with 25–75% deck deterioration and reinforcement replacement rates. The results show how individual maintenance processes contribute to overall emissions across varying degradation levels.
Figure 3.
Absolute climate change impacts for scenarios with 25–75% deck deterioration and reinforcement replacement rates. The results show how individual maintenance processes contribute to overall emissions across varying degradation levels.
Figure 4.
Absolute acidification impacts for scenarios with 25–75% deck deterioration and corresponding reinforcement replacement rates. The results show how individual maintenance processes contribute to overall impact across varying degradation levels.
Figure 4.
Absolute acidification impacts for scenarios with 25–75% deck deterioration and corresponding reinforcement replacement rates. The results show how individual maintenance processes contribute to overall impact across varying degradation levels.
Figure 5.
Eutrophication: Freshwater impacts for scenarios with 25–75% deck deterioration and corresponding reinforcement replacement rates. The results show how individual maintenance processes contribute to overall impact across varying degradation levels.
Figure 5.
Eutrophication: Freshwater impacts for scenarios with 25–75% deck deterioration and corresponding reinforcement replacement rates. The results show how individual maintenance processes contribute to overall impact across varying degradation levels.
Table 1.
Overview of bridges’ span dimensions.
Table 1.
Overview of bridges’ span dimensions.
| Parameter | Aluminium Bridge | Steel Bridge |
|---|
| Span length | 6 m | 6 m |
| Span width | 4 m | 4 m |
| Metal reinforcement mass | 1135 kg | 1279 kg |
| Concrete volume | 2.16 m3 | 6.24 m3 |
Table 2.
Overview of sensitivity parameters and modelling rationale.
Table 2.
Overview of sensitivity parameters and modelling rationale.
| Parameter | Values Tested | Rationale/Explanation |
|---|
| Deterioration extent (D) | 25%, 50%, 75% of deck area | Share of the bridge deck requiring maintenance after 50 years. The parameter influences volumes of deck demolition, reinforcement cleaning and coating, and deck repair (concrete reapplication). |
| Replacement ratio (R) | 25%, 50%, 75% replacement
of reinforcement | Share of reinforcement that must be fully replaced during maintenance. 25% captures an optimistic scenario and 75% the pessimistic scenarios. |
Table 3.
Climate change impacts for a 25% deterioration rate of the bridge deck and steel reinforcement replacement rates of 25%, 50%, and 75%.
Table 3.
Climate change impacts for a 25% deterioration rate of the bridge deck and steel reinforcement replacement rates of 25%, 50%, and 75%.
| Scenario | Value | Unit |
|---|
| D25R25 | 5472.01 | kg CO2-eq |
| D25R50 | 5315.98 | kg CO2-eq |
| D25R75 | 5159.95 | kg CO2-eq |
Table 4.
Acidification impacts for a 25% deterioration of the bridge deck and steel reinforcement replacement rates of 25%, 50%, and 75%.
Table 4.
Acidification impacts for a 25% deterioration of the bridge deck and steel reinforcement replacement rates of 25%, 50%, and 75%.
| Scenario | Value | Unit |
|---|
| D25R25 | 33.63 | mol H+-eq |
| D25R50 | 28.68 | mol H+-eq |
| D25R75 | 23.74 | mol H+-eq |
Table 5.
Eutrophication, freshwater impacts for a 25% deterioration of the bridge deck and steel reinforcement replacement rates of 25%, 50%, and 75%.
Table 5.
Eutrophication, freshwater impacts for a 25% deterioration of the bridge deck and steel reinforcement replacement rates of 25%, 50%, and 75%.
| Scenario | Value | Unit |
|---|
| D25R25 | 0.98 | kg P-eq |
| D25R50 | 1.17 | kg P-eq |
| D25R75 | 1.37 | kg P-eq |
Table 6.
Relative ranges of impacts in % for all deterioration stages of the bridge deck and all reinforcement replacement rates.
Table 6.
Relative ranges of impacts in % for all deterioration stages of the bridge deck and all reinforcement replacement rates.
| Impact Category | Value |
|---|
| Acidification | 324.99% |
| Climate Change | 218.14% |
| Eutrophication, freshwater | 320.16% |
| Disclaimer/Publisher’s Note: The statements, opinions and data contained in all publications are solely those of the individual author(s) and contributor(s) and not of MDPI and/or the editor(s). MDPI and/or the editor(s) disclaim responsibility for any injury to people or property resulting from any ideas, methods, instructions or products referred to in the content. |