


Abstract
Global energy-related carbon dioxide (CO2) emissions reached approximately 37.4 Gt in 2023, reflecting continued dependence on fossil fuels. In the Philippines, coal accounted for about 62% of total electricity generation in 2023, highlighting the need for renewable and lower-carbon fuel alternatives. At the same time, increasing urbanization has intensified municipal solid waste generation, with fruit and vegetable residues (FVRs) comprising a substantial biodegradable fraction. This study investigated the effects of torrefaction temperature and residence time on the physicochemical properties, fuel quality, and structural transformation of heterogeneous market-derived FVR to assess its potential as a renewable torrefied solid fuel. Torrefaction was conducted in a batch, crucible-based muffle-furnace system using a full factorial 22 design at 200 and 300 °C and residence times of 30 and 90 min, with three replicates per condition. Each covered 100 mL alumina crucible was loaded with 50.0 g of oven-dried, milled, and homogenized feedstock. The crucibles were initially purged with nitrogen, and residence time was counted after the furnace reached the target temperature. Product performance was evaluated through mass and energy yields, proximate analysis, higher heating value (HHV), fuel ratio, visual comparison, Fourier Transform Infrared (FTIR) spectroscopy, and analysis of variance (ANOVA). Temperature exerted the largest statistical effect on mass yield, HHV, and fuel ratio. Mean mass yield decreased from 96.05 ± 1.00% at 200 °C/30 min to 46.97 ± 0.51% at 300 °C/90 min, while HHV increased from 20.75 ± 0.06 MJ kg−1 in the untreated feedstock to 25.97 ± 0.80 MJ kg−1. Volatile combustible matter decreased from 76.30 ± 0.36% in the untreated feedstock to 41.60 ± 2.40% at 300 °C/90 min, whereas fixed carbon increased from 18.13 ± 0.49% to 45.50 ± 3.42%. The fuel ratio increased from 0.238 ± 0.007 in the untreated feedstock to 1.099 ± 0.142. FTIR spectra showed weaker hydroxyl and aliphatic C–H bands and a more pronounced aromatic C=C band near 1600 cm−1 as severity increased, consistent with progressive darkening and carbonization. Lower torrefaction severity favored solid and energy retention, whereas higher severity improved energy density and carbonization. The products should be regarded as potential renewable solid fuels or co-firing materials; ultimate analysis, combustion performance, and NOx/SOx emissions require further evaluation before direct coal-substitution claims can be made.
1. Introduction
Global energy demand continues to increase despite efforts to reduce greenhouse gas emissions and transition toward sustainable energy systems. Although renewable technologies have expanded considerably in recent years, fossil fuels remain the primary source of global energy production, with coal continuing to play a major role in electricity generation [1]. In the Philippines, coal accounted for approximately 62% of electricity generation in 2023, highlighting the country’s continued dependence on carbon-intensive energy sources [2]. The development of renewable solid fuels capable of partially replacing coal is therefore essential for improving energy security while reducing environmental impacts.
Rapid urbanization has also increased municipal solid waste generation. Fruit and vegetable residues (FVRs) constitute a substantial proportion of biodegradable market waste and are commonly disposed of through landfilling or open dumping, contributing to methane emissions and other environmental concerns [3]. Converting these residues into renewable energy products offers an attractive strategy for waste valorization while supporting circular economy initiatives.
Torrefaction is a mild thermochemical pretreatment conducted under oxygen-limited conditions, typically between 200 and 300 °C, that improves biomass properties through dehydration and devolatilization [4,5]. As oxygen-rich volatile compounds are removed, carbon becomes concentrated in the remaining solid matrix, producing a fuel with lower moisture content, higher heating value, greater fixed carbon content, and improved storage stability [5].
Previous studies have demonstrated the effectiveness of torrefaction in upgrading agricultural residues, forestry biomass, and energy crops [5,6,7]. Most investigations, however, use relatively homogeneous feedstocks, whereas public-market residues vary in botanical composition, ash-forming minerals, and thermochemical behavior. Limited information is available on the combined effects of temperature and residence time on the recovery, fuel quality, and structural transformation of a heterogeneous, coconut-shell-rich FVR mixture. Therefore, this study evaluated mass and energy yields, HHV, proximate composition, fuel ratio, physical appearance, and FTIR spectra under a 22 factorial design to determine how torrefaction severity governs the trade-off between solid recovery and fuel upgrading.
2. Materials and Methods
2.1. Feedstock Preparation
Fruit and vegetable residues (FVRs) were collected as a single composite batch from the public market of Barangay Anos, Los Baños, Laguna, Philippines. Non-biomass materials were manually removed. After drying, the mixture was fruit-dominated (93.39% of dry mass) and contained 68.15% coconut shells, 14.88% banana peels, 6.23% eggplant crowns, 2.77% banana leaves, and 6.61% vegetable residues, with minor fruit components comprising the balance. Because the mixture was not formulated to a prescribed composition, the findings represent this specific market-waste batch; feedstock composition is therefore considered a limitation when extrapolating the results to other waste streams.
The feedstock was air-dried for approximately one week and subsequently oven-dried at 105 °C for 3 h. The dried biomass was hammer-milled and sieved, and only particles within 0.25–2.00 mm were pooled for the experiments. The pooled fraction was manually mixed for 30 min before subsampling to improve consistency among runs. All twelve experimental aliquots were taken from this homogenized batch; however, the particle-size distribution of each individual aliquot was not measured.
2.2. Torrefaction Experiments
Torrefaction was performed as a batch process in a laboratory muffle furnace using covered 100 mL ceramic alumina crucibles. Each crucible was loaded with 50.0 g of oven-dried feedstock. Before heating, the covered crucibles and furnace chamber were initially purged with nitrogen to establish a nominally oxygen-limited environment. Nitrogen was not supplied continuously, and the gas flow rate, purge duration, and residual oxygen concentration were not recorded; consequently, the atmosphere is described as nitrogen-purged rather than instrumentally confirmed as fully inert.
A full factorial 22 design was used with temperatures of 200 and 300 °C and residence times of 30 and 90 min, producing four treatments with three replicates each. The two temperatures represented mild and severe conditions within the conventional torrefaction range, while 30 and 90 min represented short and extended treatment durations used in previous torrefaction investigations [5,8]. Residence time was counted only after the furnace reached the prescribed temperature.
The furnace temperature was controlled using its built-in controller; the heating rate to the target temperature was not recorded. At the end of the holding period, the crucibles were removed and cooled to room temperature with their lids in place before the torrefied solids were weighed and stored in resealable bags inside a desiccator.
2.3. Fuel Characterization
The untreated feedstock and torrefied solids were evaluated through mass yield, energy yield, proximate analysis, HHV, fuel ratio, visual comparison, and FTIR spectroscopy. Three untreated feedstock samples and three torrefaction replicates per condition were analyzed. Ultimate analysis (C, H, N, S, and O) was not conducted and is not included among the methods or reported results.
Mass yield was calculated as the oven-dried mass of torrefied solid divided by the initial oven-dried feedstock mass. Energy yield was calculated as mass yield multiplied by the ratio of the torrefied-solid HHV to the mean untreated-feedstock HHV. Fuel ratio was calculated as fixed carbon divided by volatile combustible matter (VCM).
Moisture, VCM, ash, and fixed carbon were determined according to ASTM D1762 (Modified) [9], and HHV was determined by bomb calorimetry following ASTM D5865 [10]. Results are reported primarily in MJ kg−1 for HHV and as mean ± standard deviation (SD). Coefficients of variation (CV) were calculated to describe replicate variability.
Physical changes were documented by photographing the untreated feedstock and the three replicate products from each torrefaction condition. FTIR spectroscopy was used to identify changes in hydroxyl, aliphatic, aromatic, and polysaccharide-associated functional groups during thermal treatment.
2.4. Statistical Analysis
The main and interaction effects of temperature and residence time on mass yield, HHV, and fuel ratio were evaluated using two-factor ANOVA at a 95% confidence level (p < 0.05) [11]. For proximate-composition and energy-yield results, treatment means, SDs, and CVs were used for descriptive comparison.
3. Results and Discussion
3.1. Effect of Torrefaction Severity on Solid Recovery
Mass yield and energy yield are fundamental indicators of torrefaction performance because they quantify the extent to which biomass is retained as a usable solid fuel. Increasing torrefaction severity generally enhances fuel quality at the expense of product recovery, resulting in a trade-off between solid retention and fuel upgrading [5,6,7].
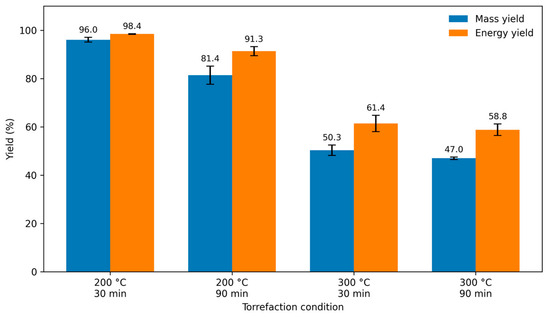
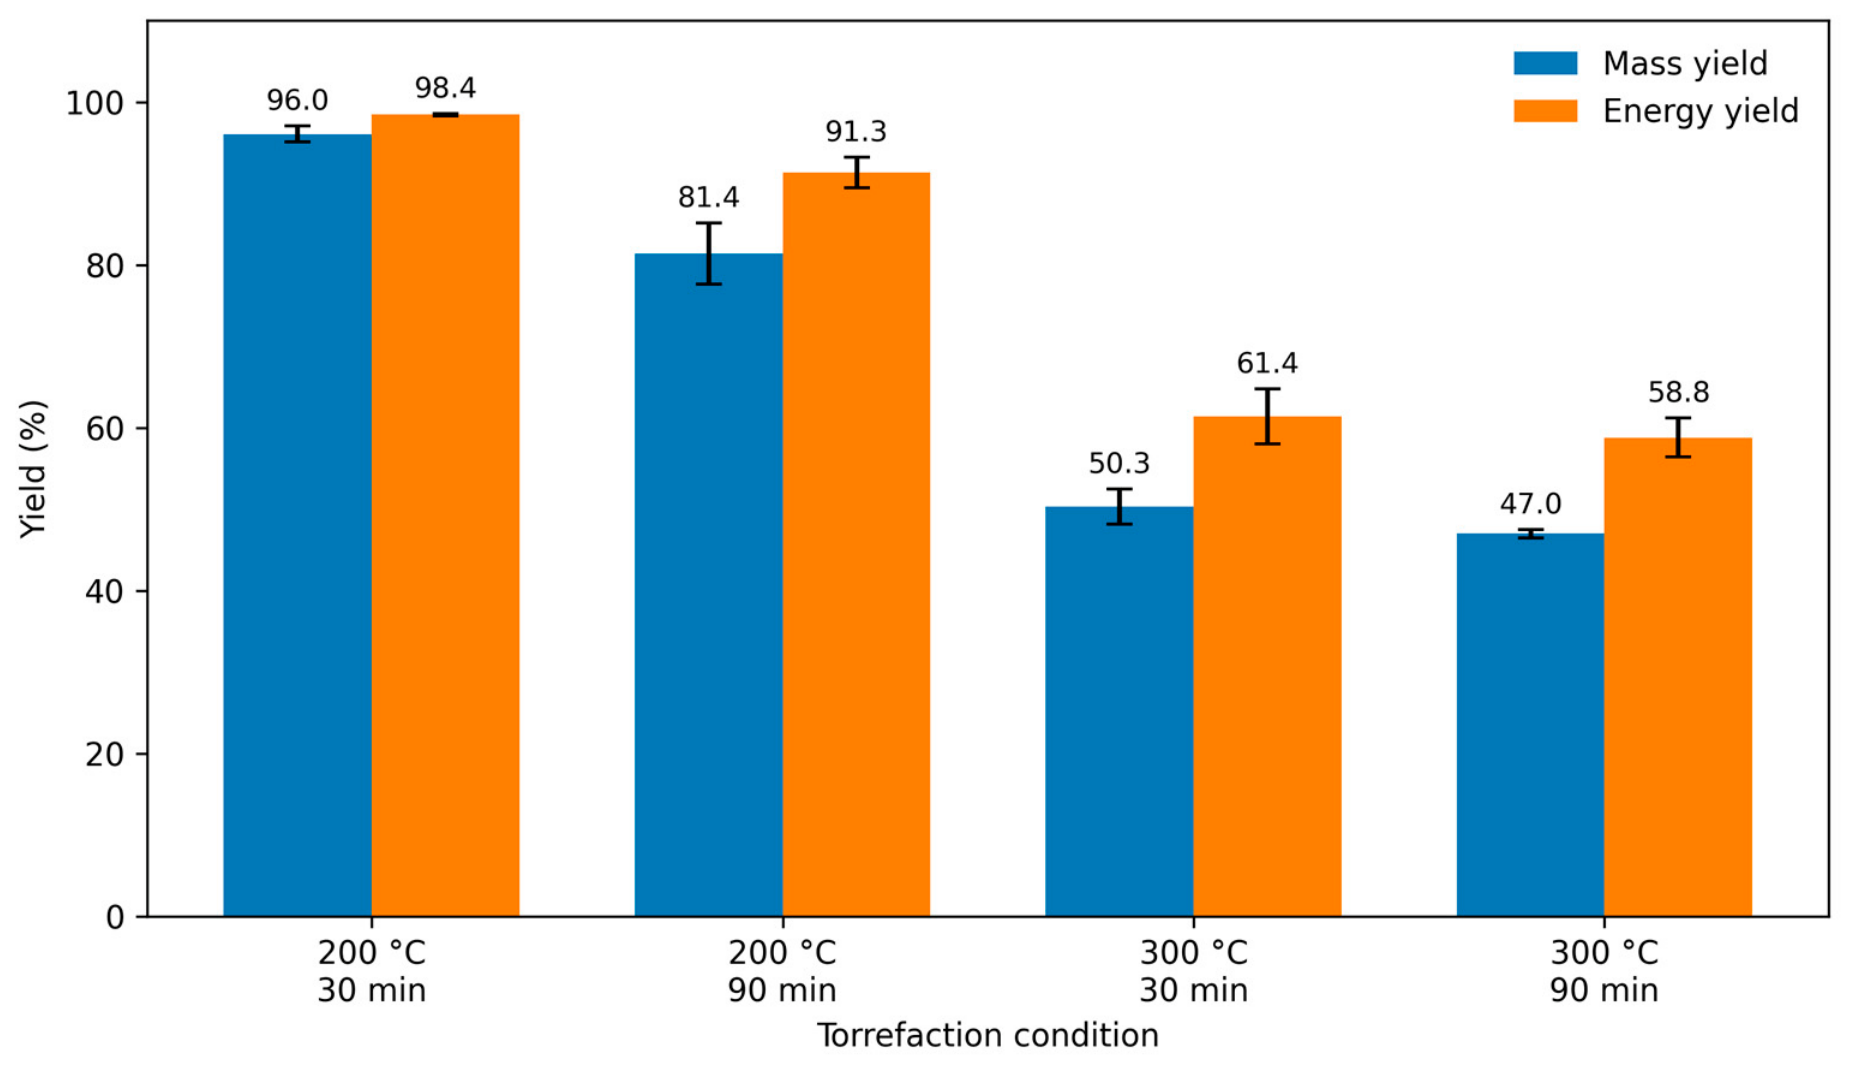
As shown in Figure 1, extending residence time from 30 to 90 min reduced mean mass yield from 96.05 ± 1.00% to 81.36 ± 3.80% at 200 °C, a decrease of 14.69 percentage points. At 300 °C, the corresponding reduction was smaller, from 50.31 ± 2.15% to 46.97 ± 0.51% (3.34 percentage points). Thus, residence time had a stronger practical effect on solid recovery at 200 °C, whereas substantial devolatilization had already occurred by 30 min at 300 °C.
Figure 1.
Effect of torrefaction temperature and residence time on mass yield and energy yield. Error bars represent SD (n = 3).
ANOVA confirmed that temperature was the largest contributor to mass-yield variation (F = 947.26, p < 0.0001), followed by residence time (F = 47.91, p = 0.0001). The temperature × residence-time interaction was also significant (F = 18.99, p = 0.0024), consistent with the unequal residence-time effects observed at 200 and 300 °C (Table 1).
Table 1.
ANOVA summary for factorial responses.
Energy yield followed the mass-yield trend. It decreased from 98.41 ± 0.16% to 91.31 ± 1.87% when residence time increased at 200 °C and from 61.36 ± 3.36% to 58.78 ± 2.37% at 300 °C. Lower severity therefore retained more of the feedstock energy in the solid phase, whereas higher severity transferred a greater fraction of mass and energy to volatile products.
Replicate variability was generally low to moderate. Treatment-level CVs ranged from 1.04% to 4.67% for mass yield and from 0.16% to 5.47% for energy yield. These results demonstrate a clear yield–quality trade-off: low severity maximized solid and energy recovery, while high severity favored greater carbonization and energy density.
3.2. Effect of Torrefaction Severity on Fuel Quality
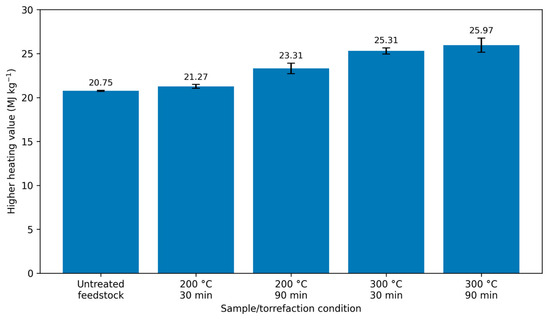
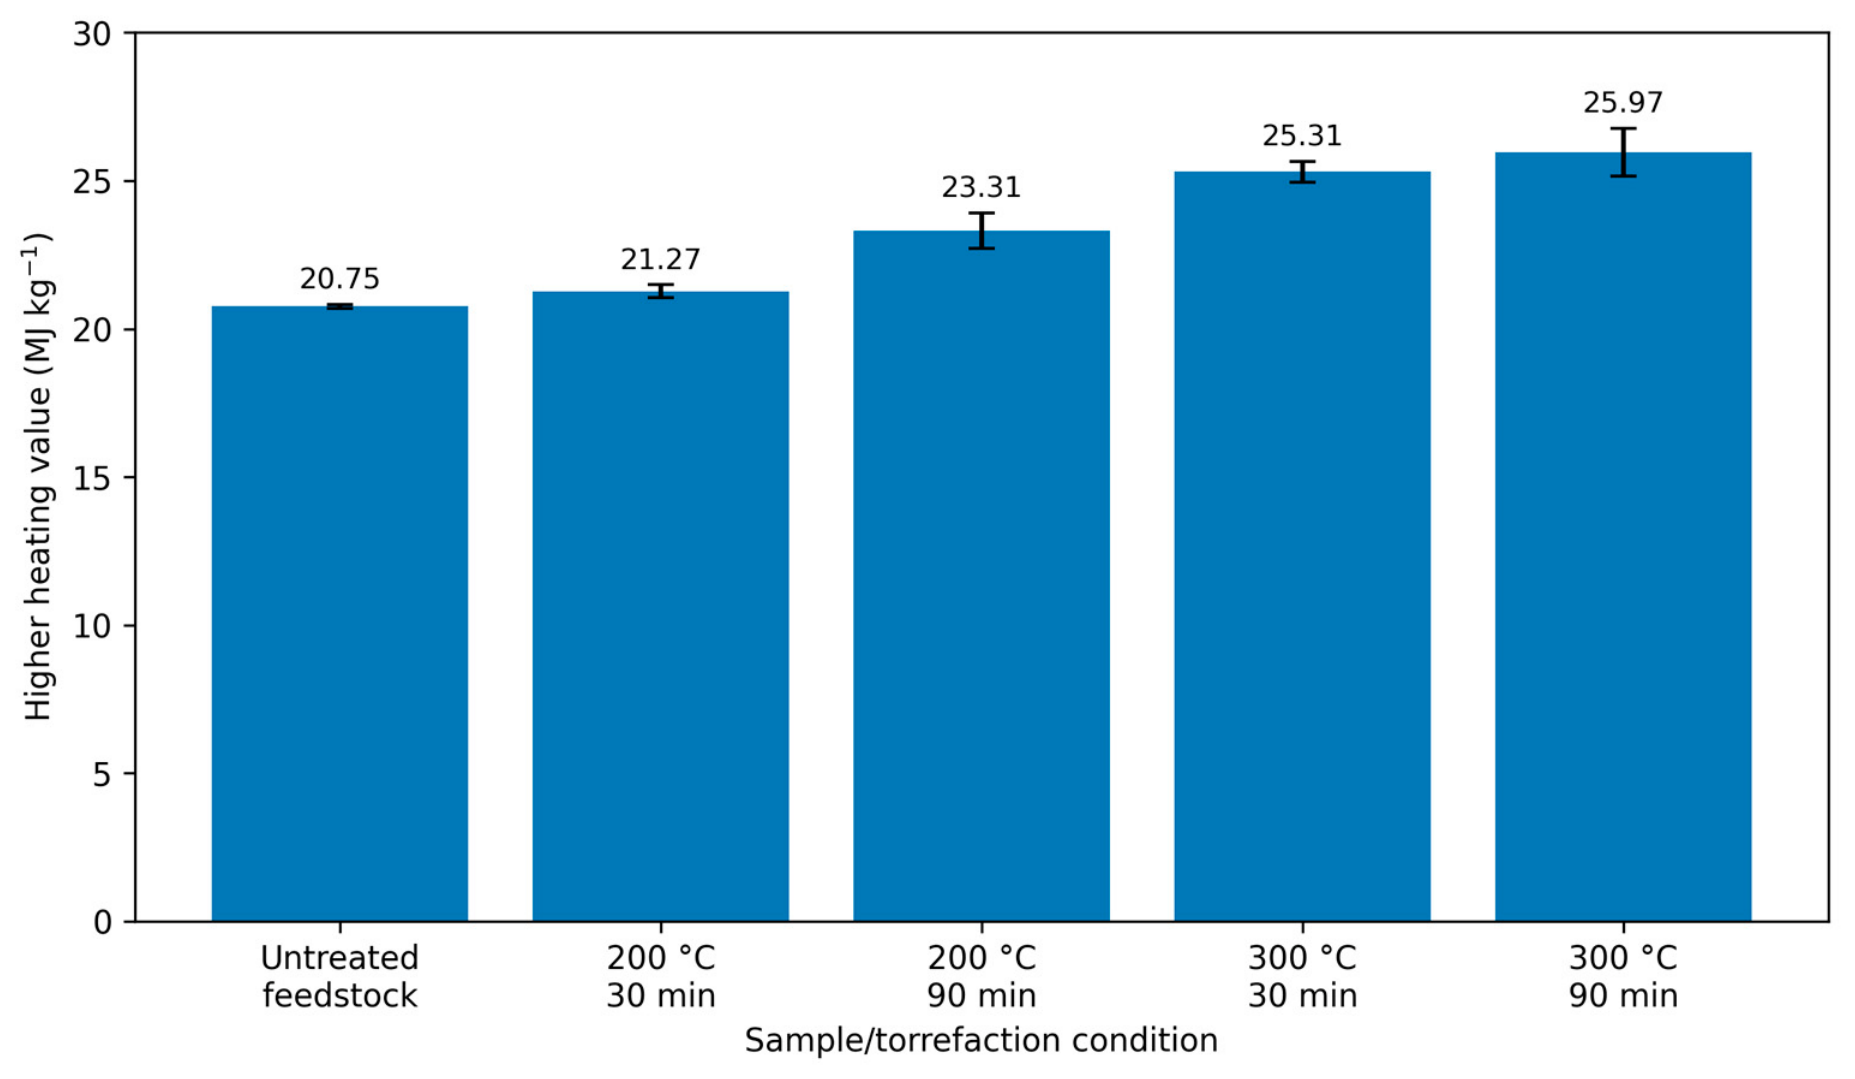
The primary objective of torrefaction is not only to preserve biomass but also to improve its suitability as a solid fuel. Fuel quality is commonly evaluated through its energy content and physicochemical composition, both of which are strongly influenced by the extent of thermal decomposition [4,5]. As torrefaction severity increased, the fruit and vegetable residues underwent progressive devolatilization, resulting in a carbon-enriched solid with improved combustion characteristics. The higher heating values of the untreated feedstock and torrefied solids are presented in Figure 2.
Figure 2.
Higher heating value of the untreated feedstock and torrefied solids. Error bars represent SD (n = 3).
The untreated feedstock had an HHV of 20.75 ± 0.06 MJ kg−1. At 200 °C, increasing residence time from 30 to 90 min increased HHV from 21.27 ± 0.22 to 23.31 ± 0.60 MJ kg−1. At 300 °C, the increase was smaller, from 25.31 ± 0.35 to 25.97 ± 0.80 MJ kg−1, indicating that most fuel upgrading at the higher temperature occurred within the first 30 min. Temperature (F = 114.93, p < 0.0001) and residence time (F = 18.71, p = 0.0025) were significant, whereas their interaction was not (F = 4.90, p = 0.0578).
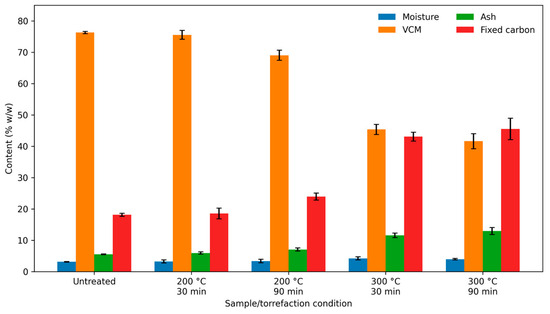
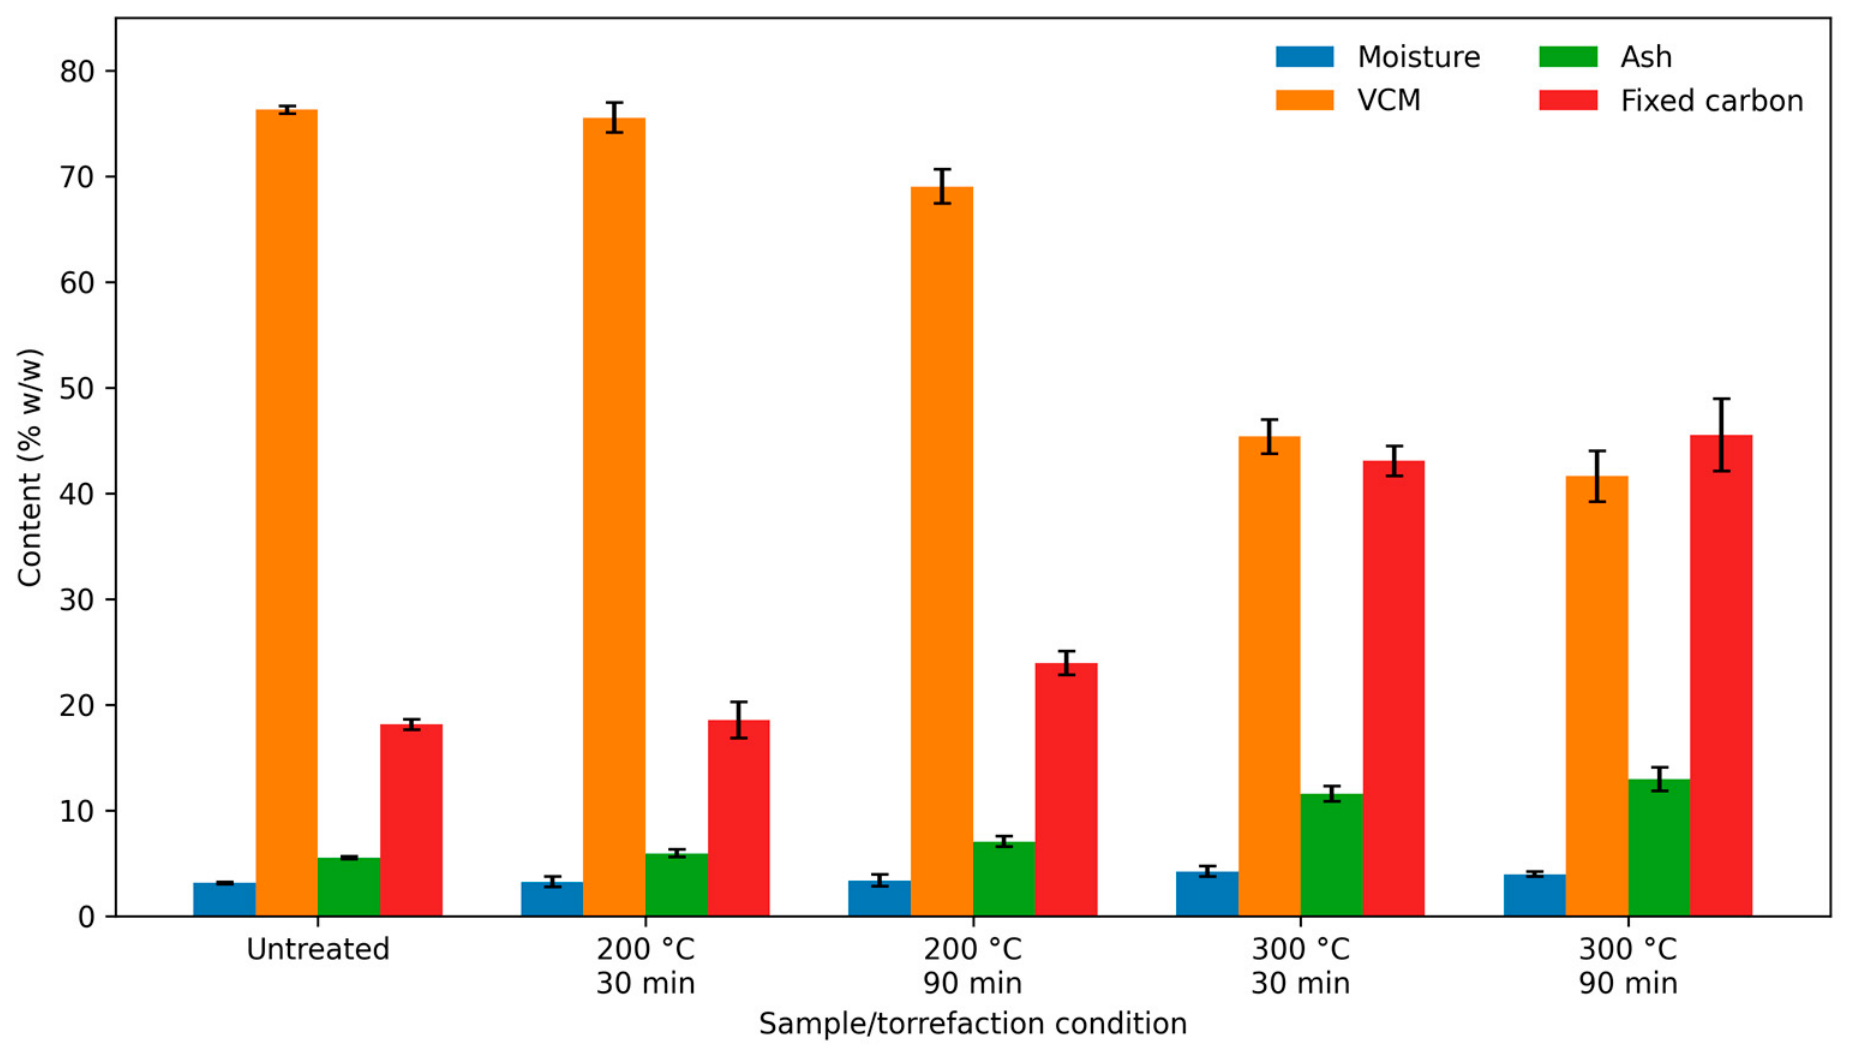
The untreated feedstock contained 3.12 ± 0.09% moisture, 76.30 ± 0.36% VCM, 5.53 ± 0.14% ash, and 18.13 ± 0.49% fixed carbon. At 200 °C/30 min, its composition remained similar (3.23 ± 0.47% moisture, 75.53 ± 1.42% VCM, 5.92 ± 0.34% ash, and 18.53 ± 1.69% fixed carbon). At 300 °C/90 min, VCM decreased to 41.60 ± 2.40%, while fixed carbon and ash increased to 45.50 ± 3.42% and 12.93 ± 1.10%, respectively (Figure 3). The proximate properties and higher heating values of the untreated feedstock and torrefied solids are summarized in Table 2.
Figure 3.
Proximate composition of the untreated feedstock and torrefied solids. Error bars represent SD (n = 3). Moisture is reported separately; VCM, ash, and fixed carbon were determined using the modified ASTM D1762 method.
Table 2.
Proximate properties and higher heating value of the untreated feedstock and torrefied solids (mean ± SD, n = 3).
The changes reflect progressive devolatilization and concentration of both carbonaceous and inorganic fractions. Across treatments, CVs were 1.03–3.09% for HHV, 5.81–8.48% for ash, and 3.29–9.13% for fixed carbon. The greater variability in ash and fixed carbon is consistent with the heterogeneous market-waste matrix, even though a single homogenized batch was used.
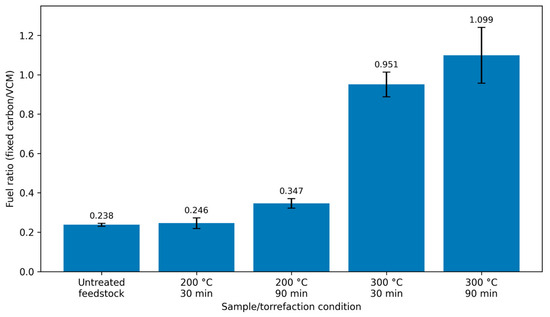
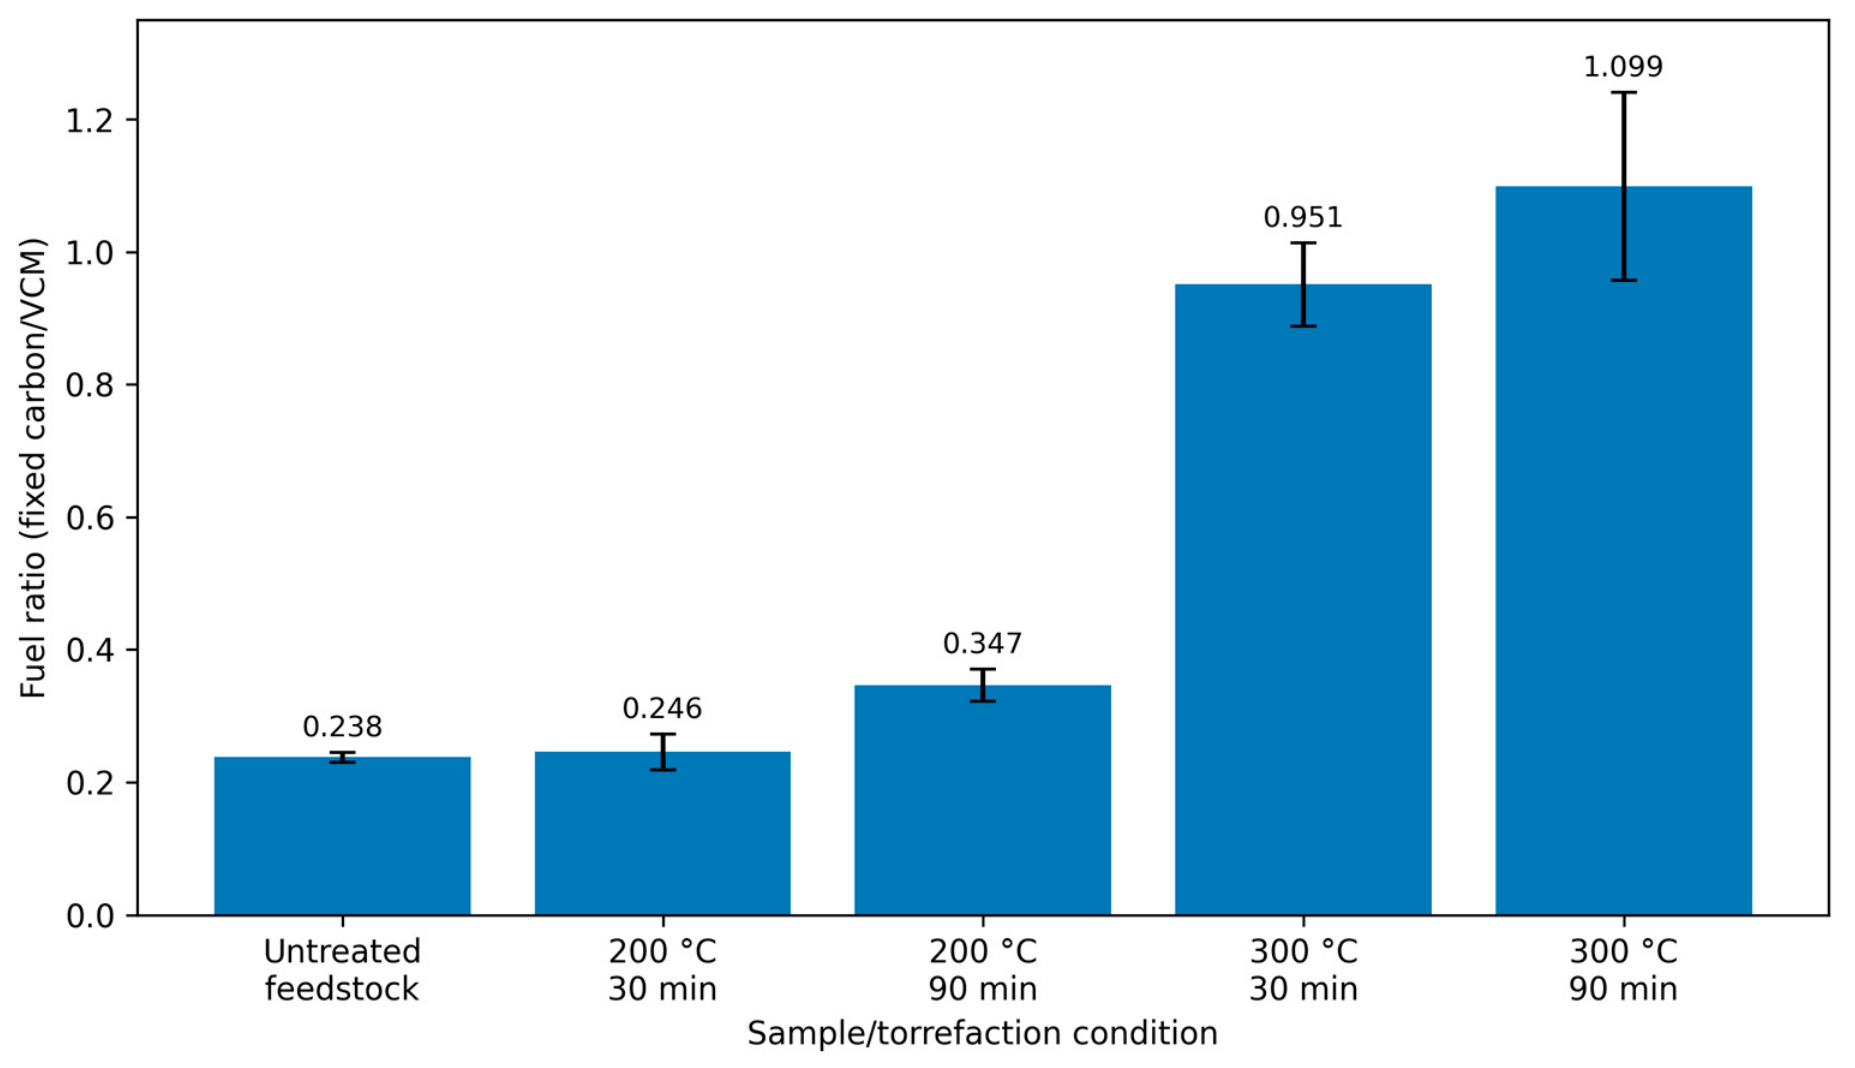
Fuel ratio provides an integrated measure of the balance between fixed carbon and VCM and was therefore evaluated separately from the proximate-composition plot.
As shown in Figure 4, the mean fuel ratio increased from 0.238 ± 0.007 in the untreated feedstock to 0.246 ± 0.027 and 0.347 ± 0.024 at 200 °C/30 and 90 min, respectively, and to 0.951 ± 0.063 and 1.099 ± 0.142 at 300 °C/30 and 90 min. Temperature was the dominant factor (F = 250.91, p < 0.0001), residence time had a smaller but significant effect (F = 7.34, p = 0.0267), and the interaction was not significant (F = 0.267, p = 0.6192).
Figure 4.
Fuel ratio of the untreated feedstock and torrefied solids. Error bars represent SD (n = 3).
For the direct energy-content context, the 300 °C products (25.31–25.97 MJ kg−1) overlap the calorific-value boundary between subbituminous and high-volatile bituminous coals reported in coal-rank classifications, whereas the 200 °C products (21.27–23.31 MJ kg−1) fall within the broad subbituminous range [12,13]. This is only an indicative comparison: the ASTM D388 classification uses moist, mineral-matter-free calorific values, fixed carbon, and agglomerating behavior, which were not fully determined for the present samples.
3.3. Structural Transformation of Torrefied Solids
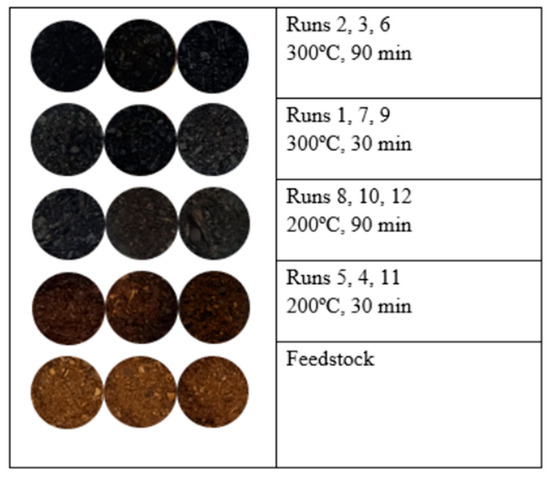
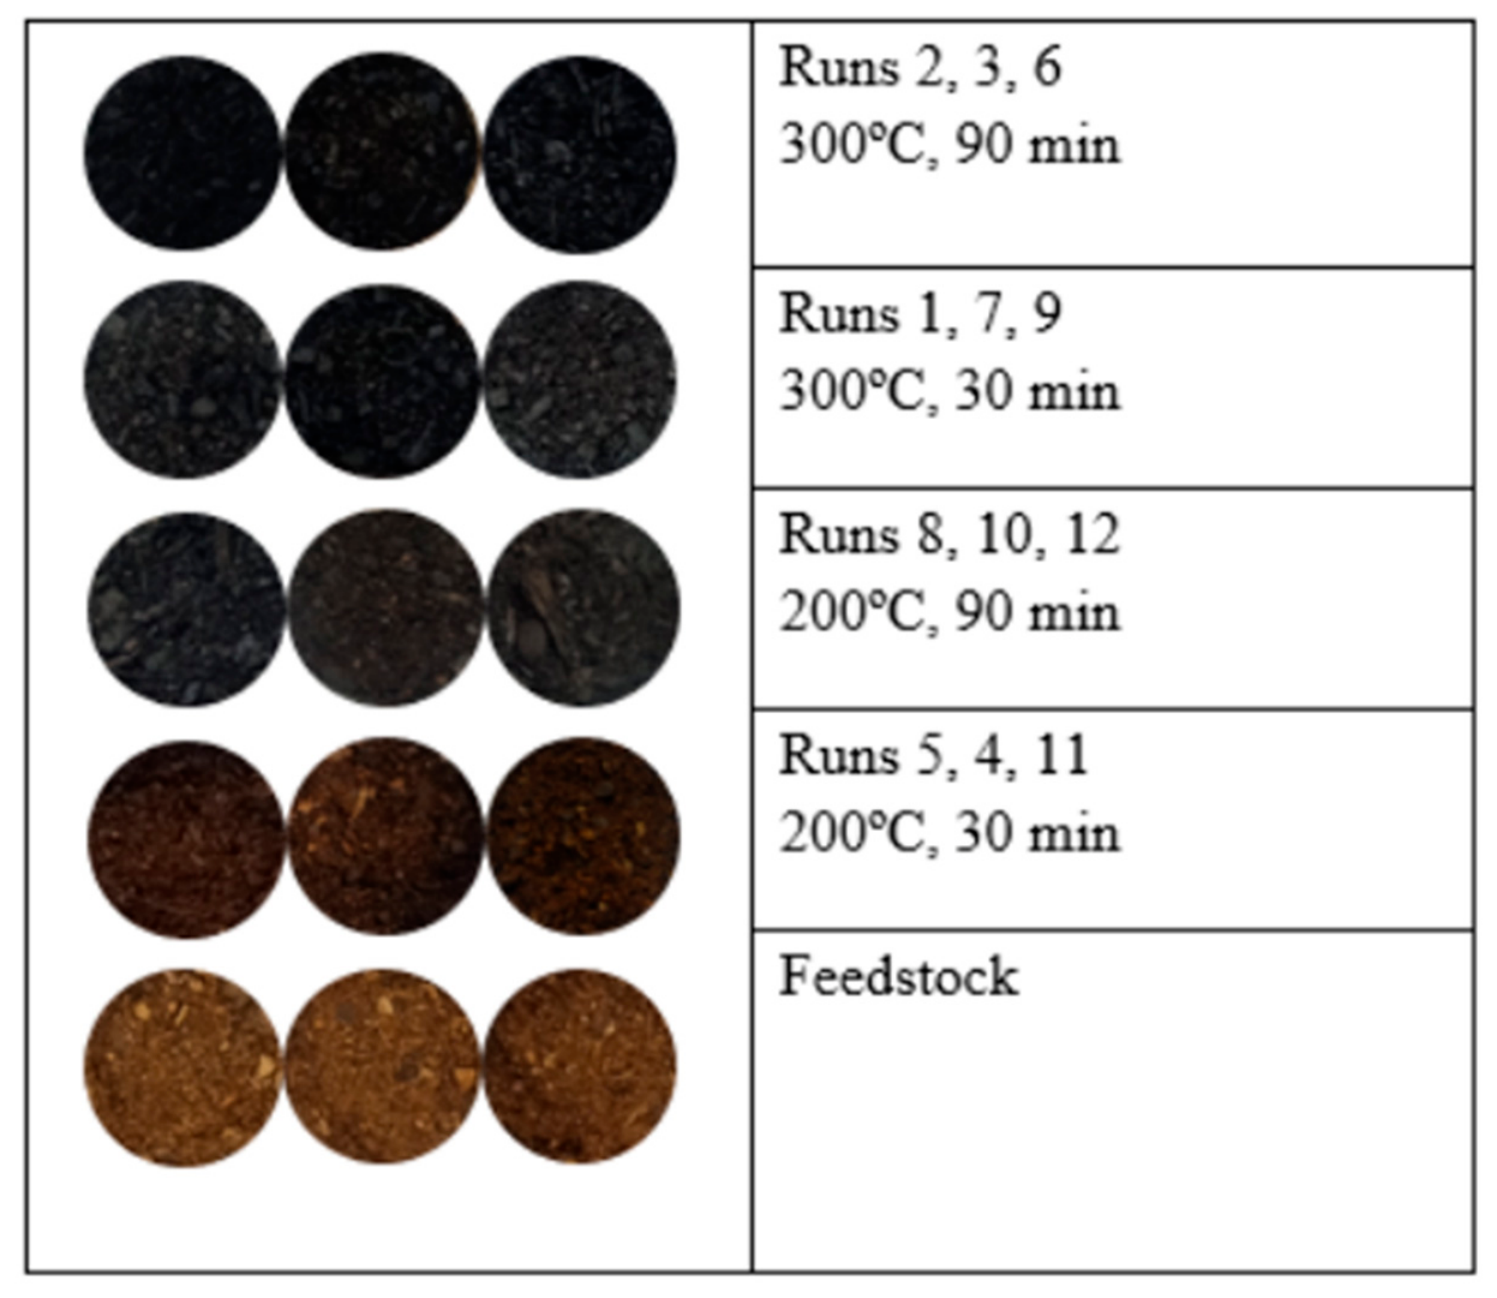
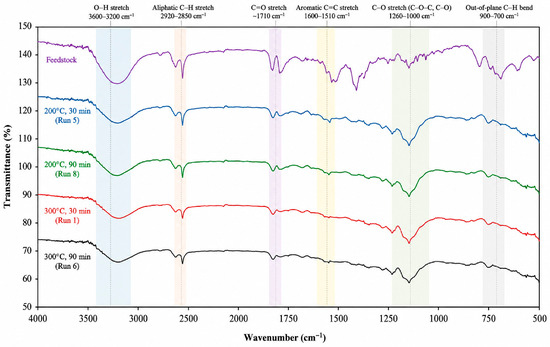
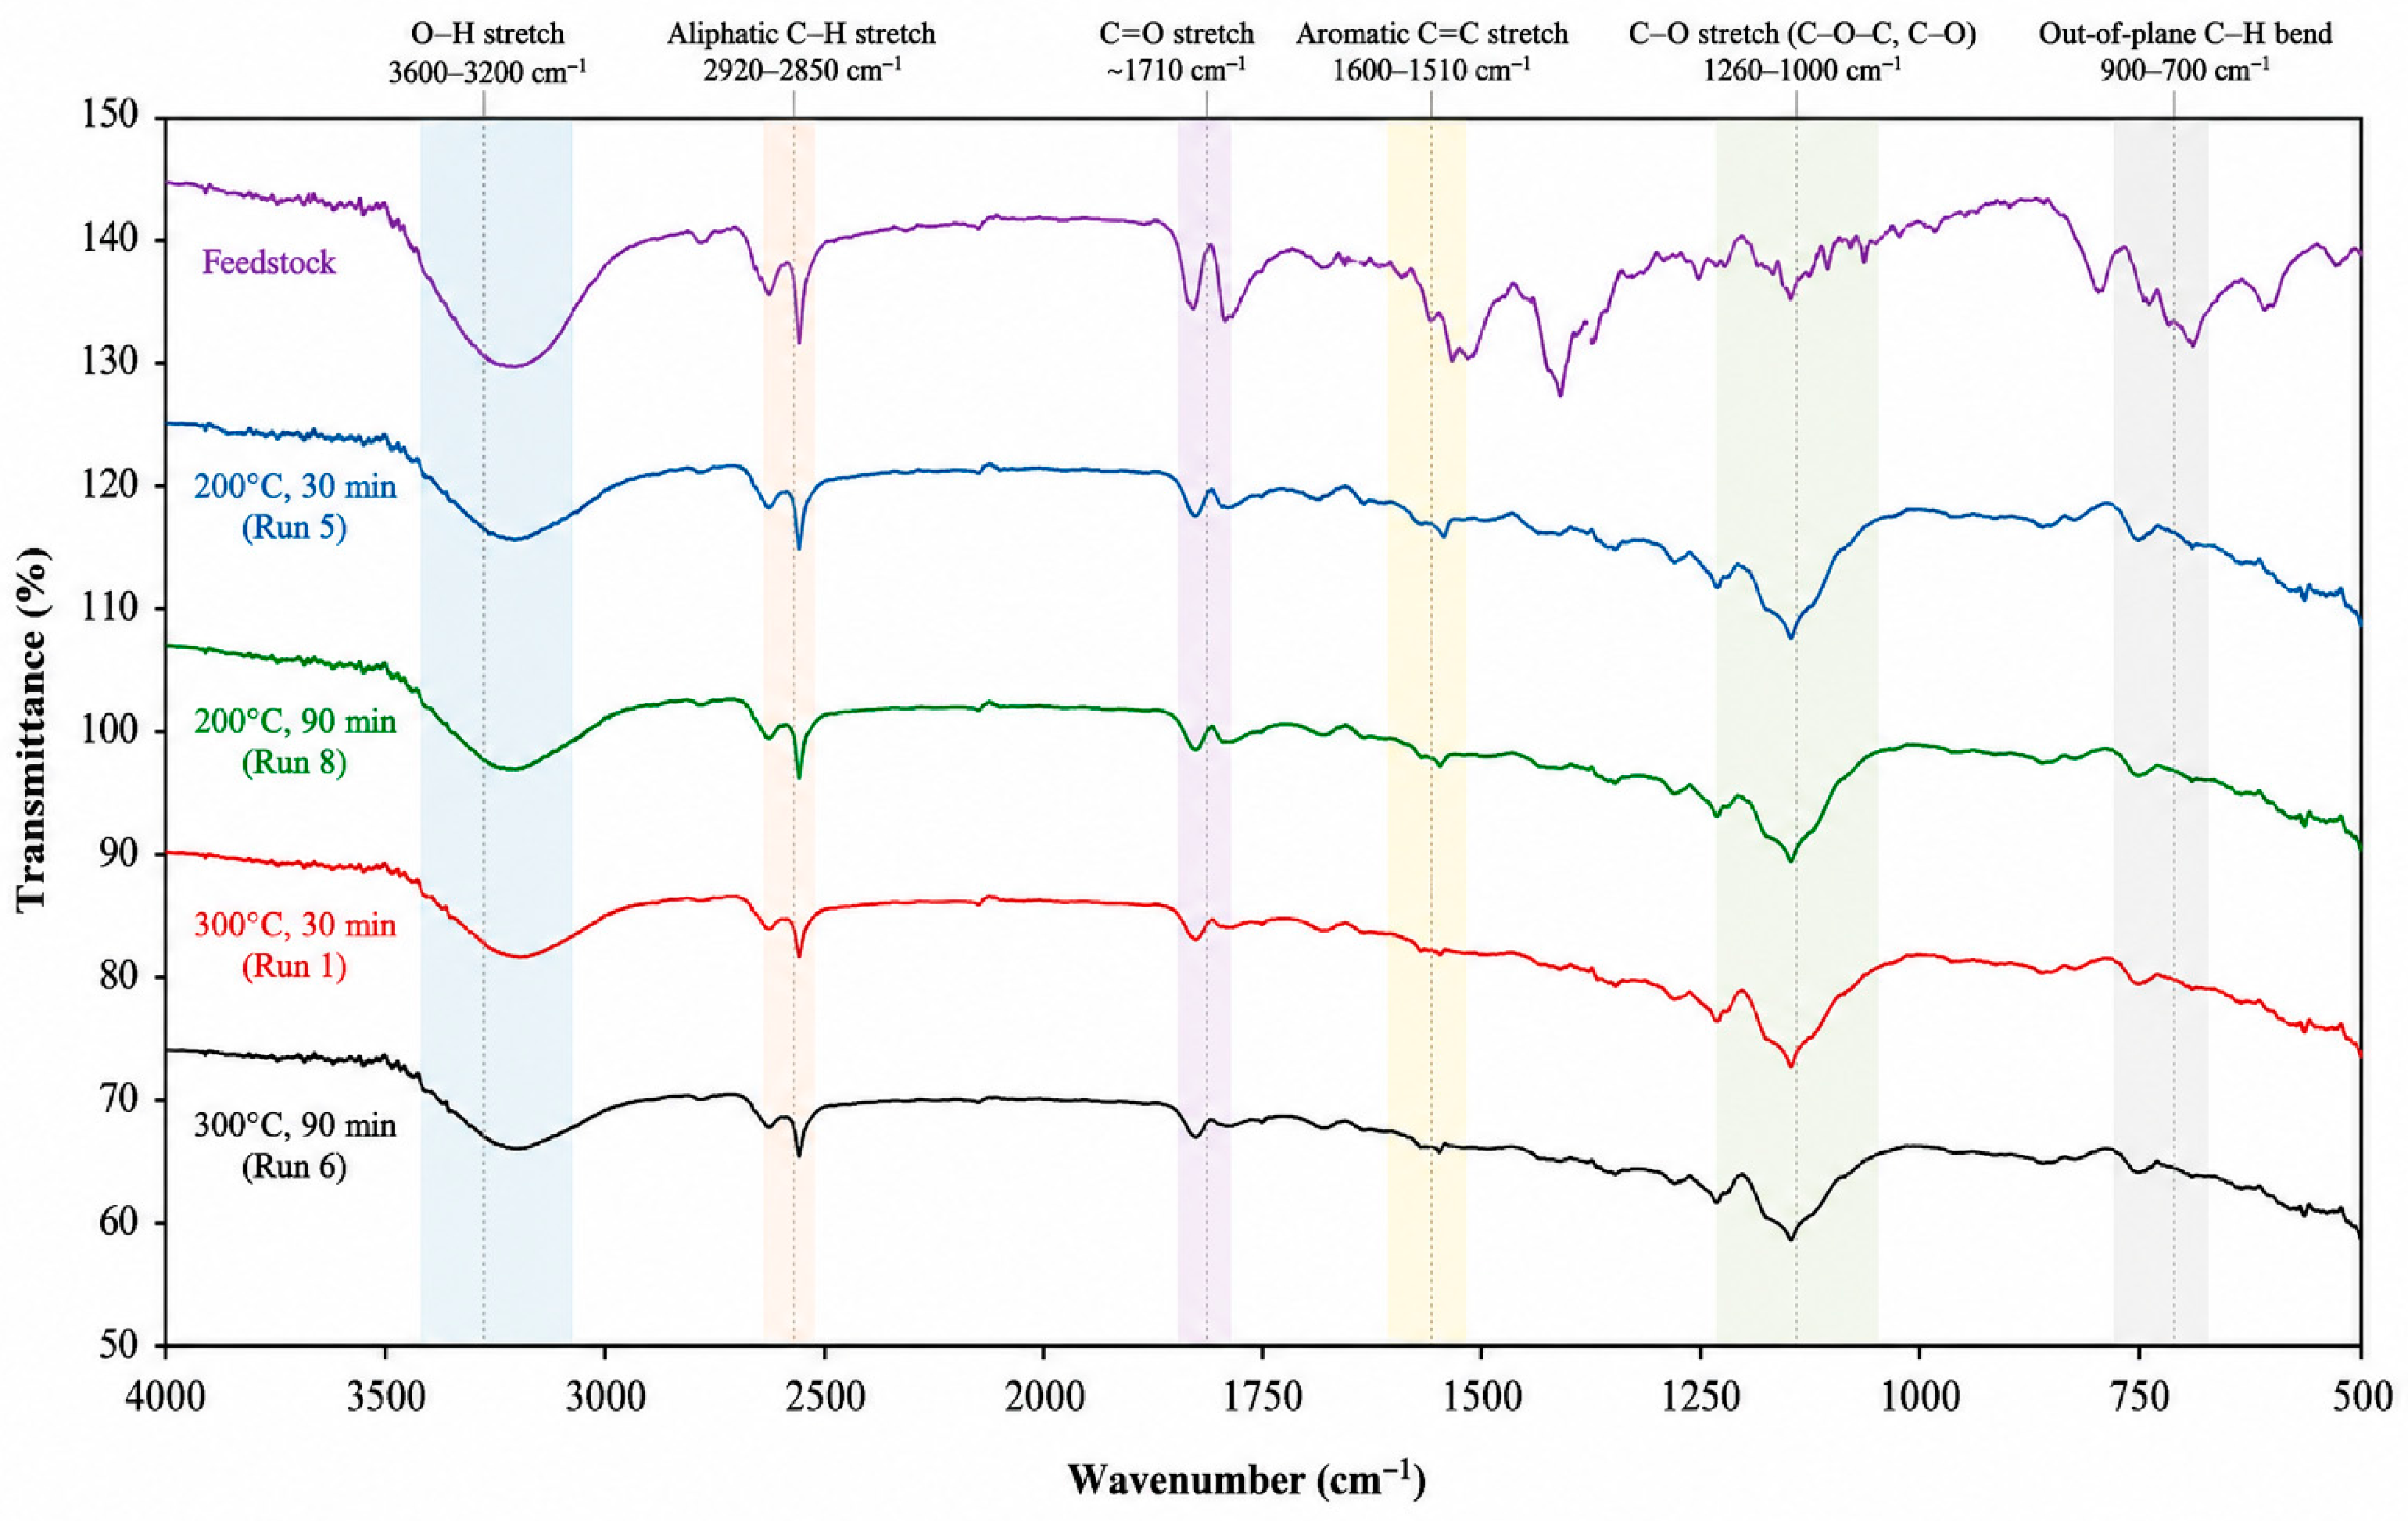
The improvement in fuel quality with increasing torrefaction severity was accompanied by visible and spectroscopic changes in the biomass. Representative photographs of all three replicates under each treatment are presented in Figure 5, while FTIR spectra are presented in Figure 6.
Figure 5.
Representative appearance of the untreated feedstock and the three replicate torrefied solids under each temperature–time condition. Darkening increased with torrefaction severity.
Figure 6.
FTIR spectra of untreated fruit and vegetable residue feedstock and representative torrefied solids produced under different torrefaction temperatures and residence times.
The samples progressed from light brown in the untreated feedstock and 200 °C/30 min treatment to dark brown at 200 °C/90 min and nearly black at 300 °C. The three replicates within each treatment showed the same overall color category, providing qualitative evidence of increasing carbonization while also showing the natural visual heterogeneity of the mixed feedstock.
FTIR spectroscopy further confirmed the structural changes (Figure 6). The untreated biomass exhibited absorption bands associated with hydroxyl (O–H), aliphatic C–H, aromatic C=C, and polysaccharide-related C–O functional groups typical of lignocellulosic biomass containing cellulose, hemicellulose, and lignin [14,15].
As torrefaction severity increased, particularly at 300 °C, the O–H and aliphatic C–H bands became weaker, while the aromatic C=C band near 1600 cm−1 became more pronounced. These changes indicate dehydration, devolatilization, and increasing aromaticity and are consistent with the observed decreases in VCM and increases in fixed carbon and HHV.
3.4. Implications for Renewable Solid Fuel Production
Torrefaction severity governed the trade-off between recovery and upgrading. The 200 °C treatments retained more solid and energy, whereas the 300 °C treatments produced higher HHV, fixed carbon, and fuel ratio. Residence time produced clearer changes at 200 °C; at 300 °C, the additional effect of extending treatment from 30 to 90 min was comparatively small for mass yield and HHV.
The resulting torrefied solids may be considered renewable solid-fuel or co-firing candidates. They should not yet be described as direct coal replacements because ultimate analysis was not performed and nitrogen and sulfur contents, NOx/SOx emissions, ignition behavior, burnout, slagging, and fouling were not evaluated.
Additional experimental limitations include the use of one coconut-shell-rich market-waste batch, an initially nitrogen-purged rather than continuously purged system, the absence of recorded nitrogen flow and purge duration, the absence of residual-oxygen confirmation, and an unrecorded heating rate. Future work should standardize or systematically vary feedstock composition and particle-size distribution and should include ultimate analysis, controlled-atmosphere monitoring, combustion and emissions testing, process scale-up, and techno-economic assessment.
4. Conclusions
This study investigated the influence of torrefaction temperature and residence time on a heterogeneous market-waste-derived solid fuel. Temperature exerted the largest statistical effect on mass yield, HHV, and fuel ratio, while residence time had a smaller but significant main effect. The temperature × time interaction was significant for mass yield but not for HHV or fuel ratio.
At 200 °C/30 min, mass and energy yields were highest (96.05 ± 1.00% and 98.41 ± 0.16%), whereas 300 °C/90 min produced the highest HHV (25.97 ± 0.80 MJ kg−1), fixed carbon (45.50 ± 3.42%), and fuel ratio (1.099 ± 0.142). Visual darkening and FTIR changes corroborate progressive dehydration, devolatilization, and aromatization.
The findings support torrefaction as a pathway for upgrading heterogeneous FVR into a more energy-dense renewable solid-fuel candidate. However, direct coal-substitution suitability cannot be concluded from the present data alone. Ultimate analysis, controlled-atmosphere validation, combustion performance, gaseous emissions, and ash-behavior testing are required before industrial substitution or co-firing ratios can be established.
Author Contributions
Conceptualization, R.B.D.; methodology, C.D.V.N. and R.B.D.; formal analysis, C.D.V.N.; investigation, C.D.V.N.; resources, R.B.D., A.E.D.M., R.B.C. and B.T.M.; data curation, C.D.V.N.; writing—original draft preparation, C.D.V.N.; writing—review and editing, R.B.D., A.E.D.M., R.B.C. and B.T.M.; supervision, R.B.D. All authors have read and agreed to the published version of the manuscript.
Funding
This research was funded by the Department of Science and Technology–Engineering Research and Development for Technology (DOST–ERDT) Scholarship Program.
Institutional Review Board Statement
Not applicable.
Informed Consent Statement
Not applicable.
Data Availability Statement
The data presented in this study are available from the corresponding author upon reasonable request.
Acknowledgments
The authors acknowledge the Department of Chemical Engineering, College of Engineering and Agro-Industrial Technology, University of the Philippines Los Baños, for providing laboratory facilities and technical support. The authors also acknowledge the Standards and Testing Division of the Department of Science and Technology–Industrial Technology Development Institute (DOST–ITDI) for assistance with the proximate and higher heating value analyses. Financial support provided through the Department of Science and Technology–Engineering Research and Development for Technology (DOST–ERDT) Scholarship Program is likewise gratefully acknowledged.
Conflicts of Interest
The authors declare no conflicts of interest. The funders had no role in the design of the study; in the collection, analyses, or interpretation of data; in the writing of the manuscript; or in the decision to publish the results.
References
- International Energy Agency (IEA). CO2 Emissions in 2023; International Energy Agency: Paris, France, 2024. [Google Scholar]
- Department of Energy (DOE). Philippine Power Statistics 2023; Department of Energy: Taguig City, Philippines, 2024. [Google Scholar]
- National Solid Waste Management Commission (NSWMC). National Solid Waste Management Status Report 2008–2018; NSWMC: Quezon City, Philippines, 2020. [Google Scholar]
- Bergman, P.C.A.; Kiel, J.H.A. Torrefaction for Biomass Upgrading. In Proceedings of the 14th European Biomass Conference and Exhibition, Paris, France, 17–21 October 2005. [Google Scholar]
- Chen, W.-H.; Peng, J.; Bi, X.T. A state-of-the-art review of biomass torrefaction, densification and applications. Renew. Sustain. Energy Rev. 2015, 44, 847–866. [Google Scholar] [CrossRef] [Scilit]
- Phanphanich, M.; Mani, S. Impact of torrefaction on the grindability and fuel characteristics of forest biomass. Bioresour. Technol. 2011, 102, 1246–1253. [Google Scholar] [CrossRef] [Scilit] [PubMed]
- Bridgeman, T.G.; Jones, J.M.; Shield, I.; Williams, P.T. Torrefaction of reed canary grass, wheat straw and willow to enhance solid fuel qualities and combustion properties. Fuel 2008, 87, 844–856. [Google Scholar] [CrossRef] [Scilit]
- Shehzad, M.; Asghar, A.; Ramzan, N.; Aslam, U.; Bello, M.M. Impacts of non-oxidative torrefaction conditions on the fuel properties of indigenous biomass (bagasse). Waste Manag. Res. 2020, 38, 1284–1294. [Google Scholar] [CrossRef] [Scilit] [PubMed]
- ASTM D1762-84; Standard Test Method for Chemical Analysis of Wood Charcoal. ASTM International: West Conshohocken, PA, USA.
- ASTM D5865; Standard Test Method for Gross Calorific Value of Coal and Coke. ASTM International: West Conshohocken, PA, USA.
- Montgomery, D.C. Design and Analysis of Experiments, 10th ed.; John Wiley & Sons: Hoboken, NJ, USA, 2019. [Google Scholar]
- ASTM D388-23; Standard Classification of Coals by Rank. ASTM International: West Conshohocken, PA, USA, 2023.
- Wood, G.H., Jr.; Kehn, T.M.; Carter, M.D.; Culbertson, W.C. Coal Resource Classification System of the U.S. Geological Survey. In U.S. Geological Survey Circular 891; U.S. Geological Survey: Reston, VA, USA, 1983. [Google Scholar]
- Pandey, K.K. A study of chemical structure of soft and hardwood and wood polymers by FTIR spectroscopy. J. Appl. Polym. Sci. 1999, 71, 1969–1975. [Google Scholar] [CrossRef] [Scilit]
- Yang, H.; Yan, R.; Chen, H.; Lee, D.H.; Zheng, C. Characteristics of hemicellulose, cellulose and lignin pyrolysis. Fuel 2007, 86, 1781–1788. [Google Scholar] [CrossRef] [Scilit]

Disclaimer/Publisher’s Note: The statements, opinions and data contained in all publications are solely those of the individual author(s) and contributor(s) and not of MDPI and/or the editor(s). MDPI and/or the editor(s) disclaim responsibility for any injury to people or property resulting from any ideas, methods, instructions or products referred to in the content. |
© 2026 by the authors. Licensee MDPI, Basel, Switzerland. This article is an open access article distributed under the terms and conditions of the Creative Commons Attribution (CC BY) license.