


Abstract
An appropriate amount of active stone powder can effectively improve the performance of concrete and reduce the amount of cement. However, the doped clay in stone powder will have an adverse effect on the performance of concrete, and its contents need to be tested and strictly controlled. In this study, we have developed a new test method for evaluating the quality grade of sand powder using hyperspectral imaging. The collected hyperspectral data of stone powder are preprocessed by smoothing filtering and multiple scattering calibration (SG-MSC) to reduce the interference of background information. Competitive adaptive reweighted sampling (CARS) and the successive projections algorithm (SPA) have been used to extract the eigenvalues and display the characteristic band, respectively, and then to construct the eigenvector dataset of the spectral curve. Subsequently, a classification model combining CARS and the Support Vector Machine (SVM) algorithm is trained and applied to the quality grade identification of stone powder. Finally, a comparison has been made between the classification results of the Support Vector Machine (SVM) and K-Nearest Neighbor (KNN) models, which combined CARS and SPA, to construct a better evaluation model. Compared with the results of manual measurement, the proposed method demonstrates a high precision in the quality assessment of stone powder content in the actual production process.
1. Introduction
The global production and consumption of concrete in the construction industry have reached about 1 billion metric tons per year [1]. Natural sand is a crucial ingredient in concrete production, and its demand is increasing due to various factors, including the growing number of construction projects. However, this increased demand, along with the over-exploitation and excessive extraction of natural sand from sources like riverbeds, leading to environmental damage and resource depletion, worsens the situation. Therefore, it is essential to limit the mining of natural sand and to find suitable sustainable alternatives to it [2]. The production of manufactured sand through artificial rock crushing has significantly mitigated this issue, as it replaces natural sand as the fine aggregate in concrete [3]. However, during the manufacturing process of manufactured sand, approximately 5–20% of stone powder, sharing the same mineral composition as the parent rock and with particle sizes less than 75 μm, is generated. This byproduct poses a significant challenge, as it could result in substantial resource wastage and environmental pollution if not effectively utilized [4].
In recent years, spectroscopic technology and data mining technology have been widely applied in various industries [5,6]. In the construction industry, hyperspectral technology is receiving increasing attention due to its non-destructive testing properties. To be specific, Ma [7] studied the acquisition of surface reflectance from mortar samples using hyperspectral technology and predicted the cl- concentration to evaluate the possibility of steel bar rust. Fan et al. [8] built classification models and regression models by collecting surface reflectance data from mortar with different water–cement ratios and curing dates, so as to classify mortar with different water–cement ratios and predict compressive strength. Ghandehari et al. [9] developed a method based on near-infrared spectroscopy for the detection of capillary absorption and evaporation drying of gelled materials. In this paper, a method of measuring the quality grade of stone powder based on hyperspectral vision is proposed.
2. Principle of Hyperspectral System and Classification Method
2.1. Hyperspectral Data Collection
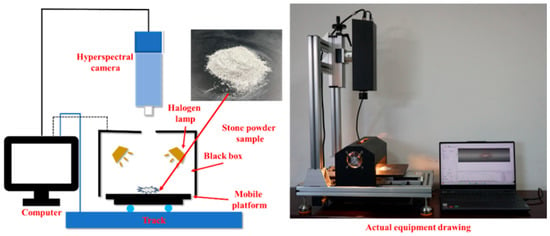
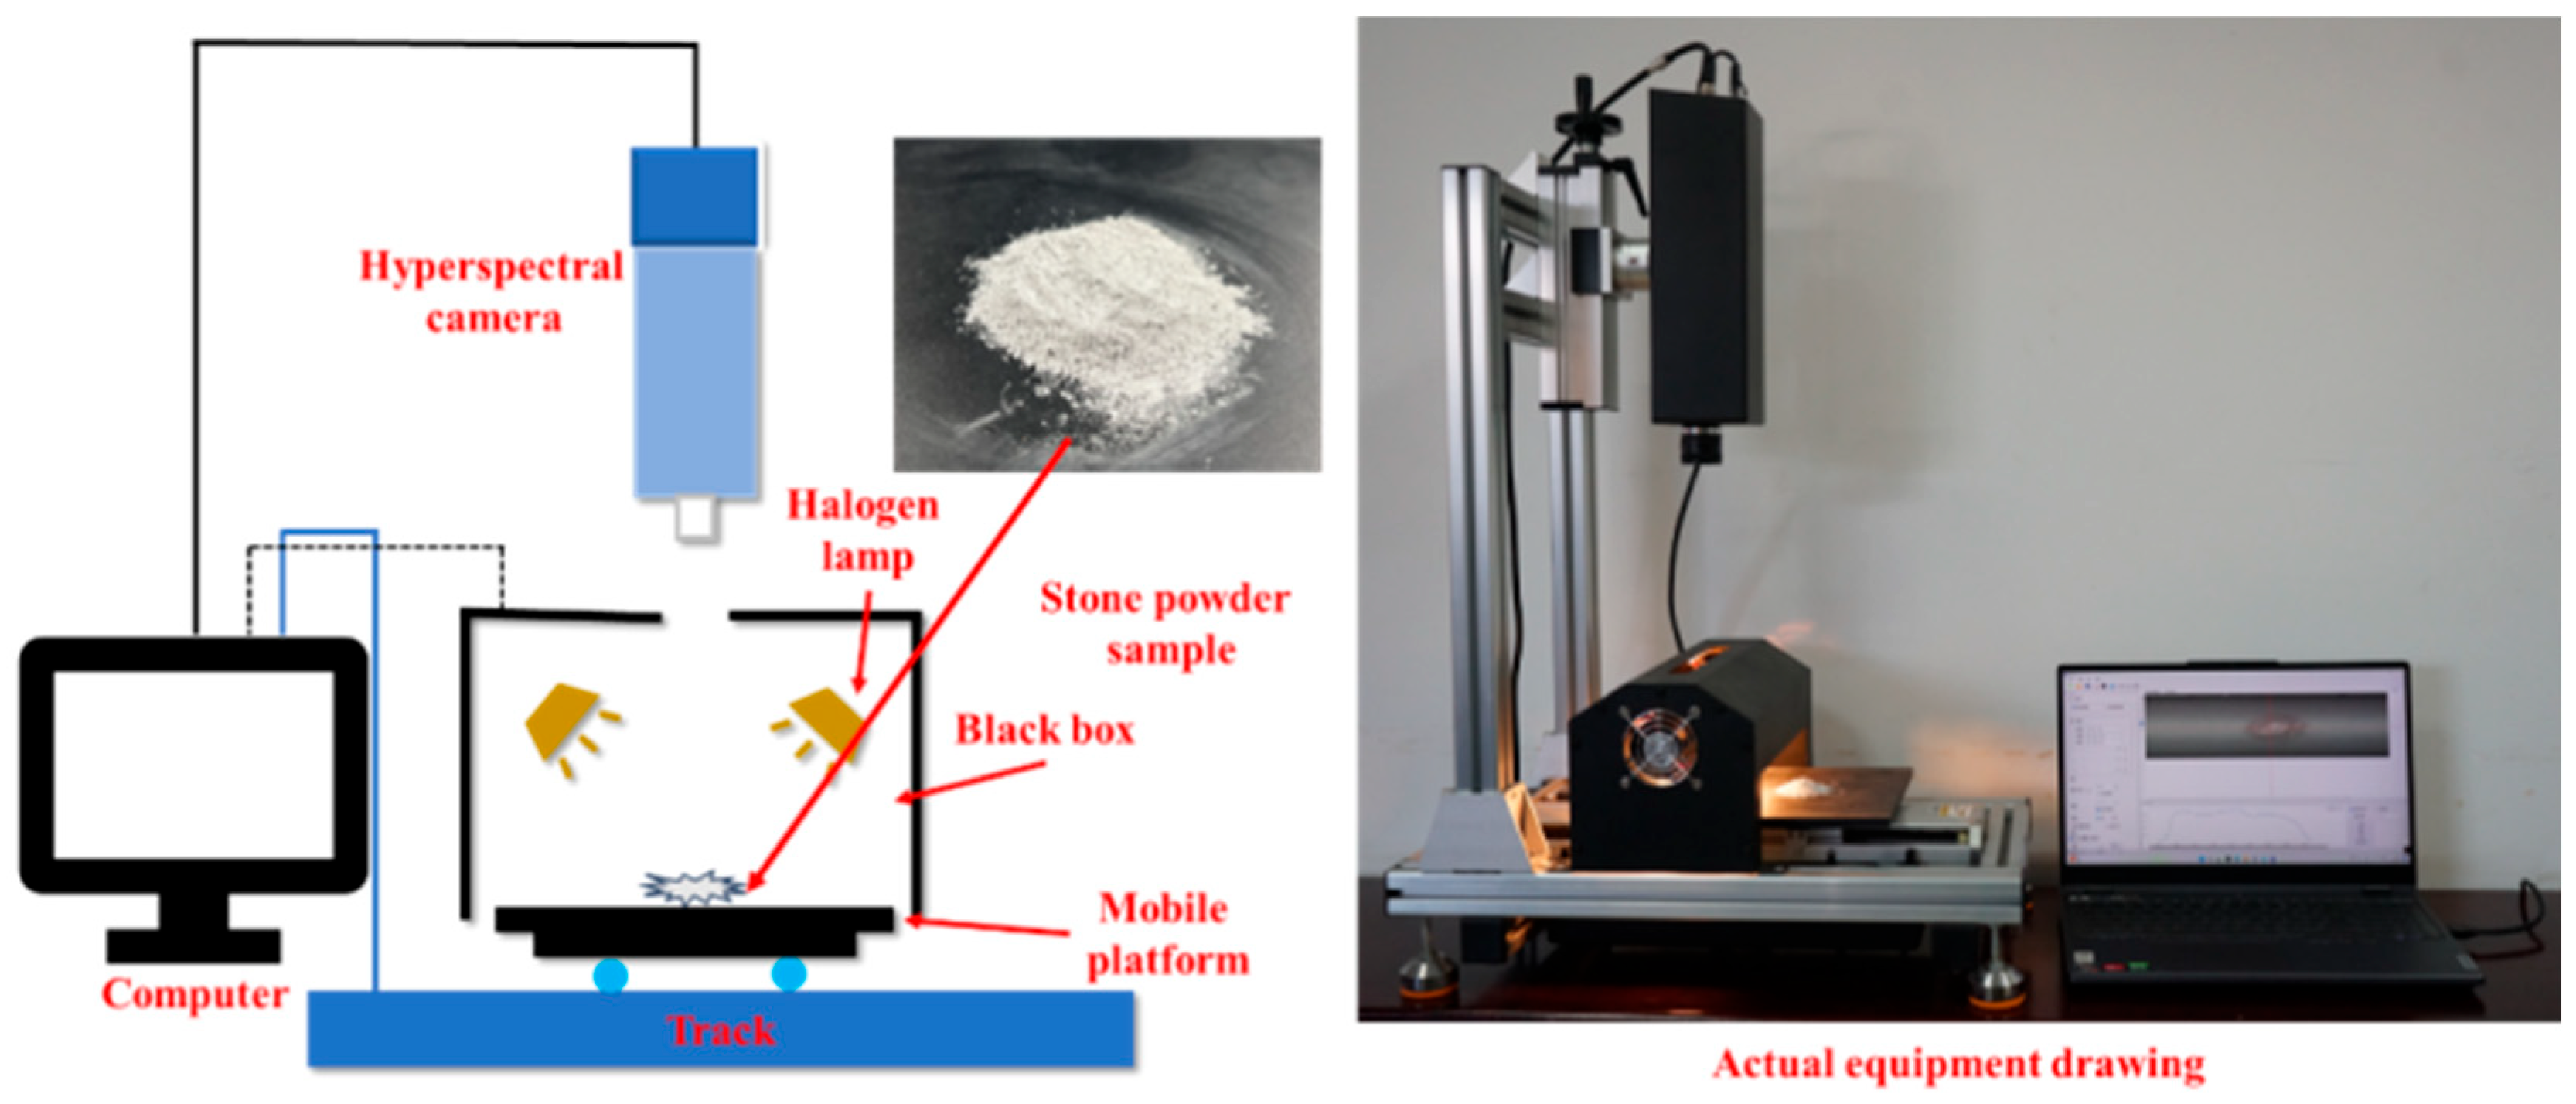
As shown in Figure 1, sample data were collected using the FigSpec (version 1.0.0.10; Hangzhou ColorSpectrum Technology Co., Ltd., Hangzhou, China) Hyperspectral Camera FS-15 purchased from Hangzhou ColorSpectrum Technology Co., Ltd. The spectral range of the camera sensor is 900–1700 nm, with a spectral resolution of approximately 8 nm and a total of 254 bands. The camera was mounted on a mobile platform (ColorSpectrum Technology LD-211). The speed of the platform movement depended on the frame rate of hyperspectral image acquisition, with a distance of 0.25 m set as the optimal object distance. To provide appropriate illumination for the samples and ensure that the working wavelengths primarily covered the near-infrared wavelength range, a halogen lamp (Hangzhou ColorSpectrum Technology Co., Ltd., Hangzhou, China) was used as the light source for illumination.
Figure 1.
Hyperspectral vision system experimental equipment.
2.2. Hyperspectral Data Preprocessing
The stone powder samples, sieved to a particle size smaller than 75 μm, were uniformly spread out on the surface of a black cardboard and kept flat to initiate hyperspectral data collection. Reflectance of the stone powder sample surface was acquired through spectroscopy, and the sample surface was subjected to comparative stoichiometric analysis. Spectral preprocessing methods can effectively mitigate the impact of noise, enhancing the accuracy and robustness of the model. A combined algorithm using Savitzky–Golay smoothing filters [10] and Multivariate Scattering Calibration (MSC) was employed for spectral line preprocessing of hyperspectral images. This combination strengthens spectral band characteristics, enhances comparability between data, and mitigates the computational complexity arising from high reflectance values. Specifically, SG is a filtering method based on time-domain polynomial least squares fitting, which removes noise while preserving signal shape and bandwidth. MSC eliminates spectral differences caused by varying scattering levels, thereby increasing the correlation between spectra and data and effectively reducing spectral variability caused by baseline shifts and scattering levels [11].
2.3. Feature Extraction
Hyperspectral images contain a wealth of information, with each pixel in the image possessing an independent reflectance spectrum, comprising hundreds of spectral bands. There are strong correlations and high redundancy among multiple bands, leading to overlap or duplication. Appropriate feature extraction methods can effectively reduce the dimensionality of hyperspectral data, minimize redundant information in reflectance spectra, and enhance the efficiency and robustness of the model. Competitive adaptive reweighted sampling (CARS) is a feature variable selection method that utilizes Monte Carlo sampling (MC) to randomly sample the stone powder spectral dataset. It integrates Partial Least Squares Regression for modeling analysis and determines the subset with the lowest Root Mean Square Error (RMSE) through cross-validation (CV). The calculation of RMSECV is shown in Equation (1).
where y is the true value, and ycv is the predicted value during cross-validation.
SPA is a projective computation-based method that eliminates collinearity problems between variables [10]. The optimal feature variable selected by the SPA is determined using the minimum RMSE of internal cross-validation.
2.4. Classification Method
A comparison of two different machine learning methods, K-Nearest Neighbors (KNN) and Support Vector Machines (SVMs), was performed in order to construct an optimal classifier for stone powder quality grading.
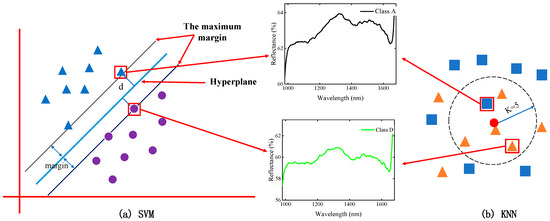
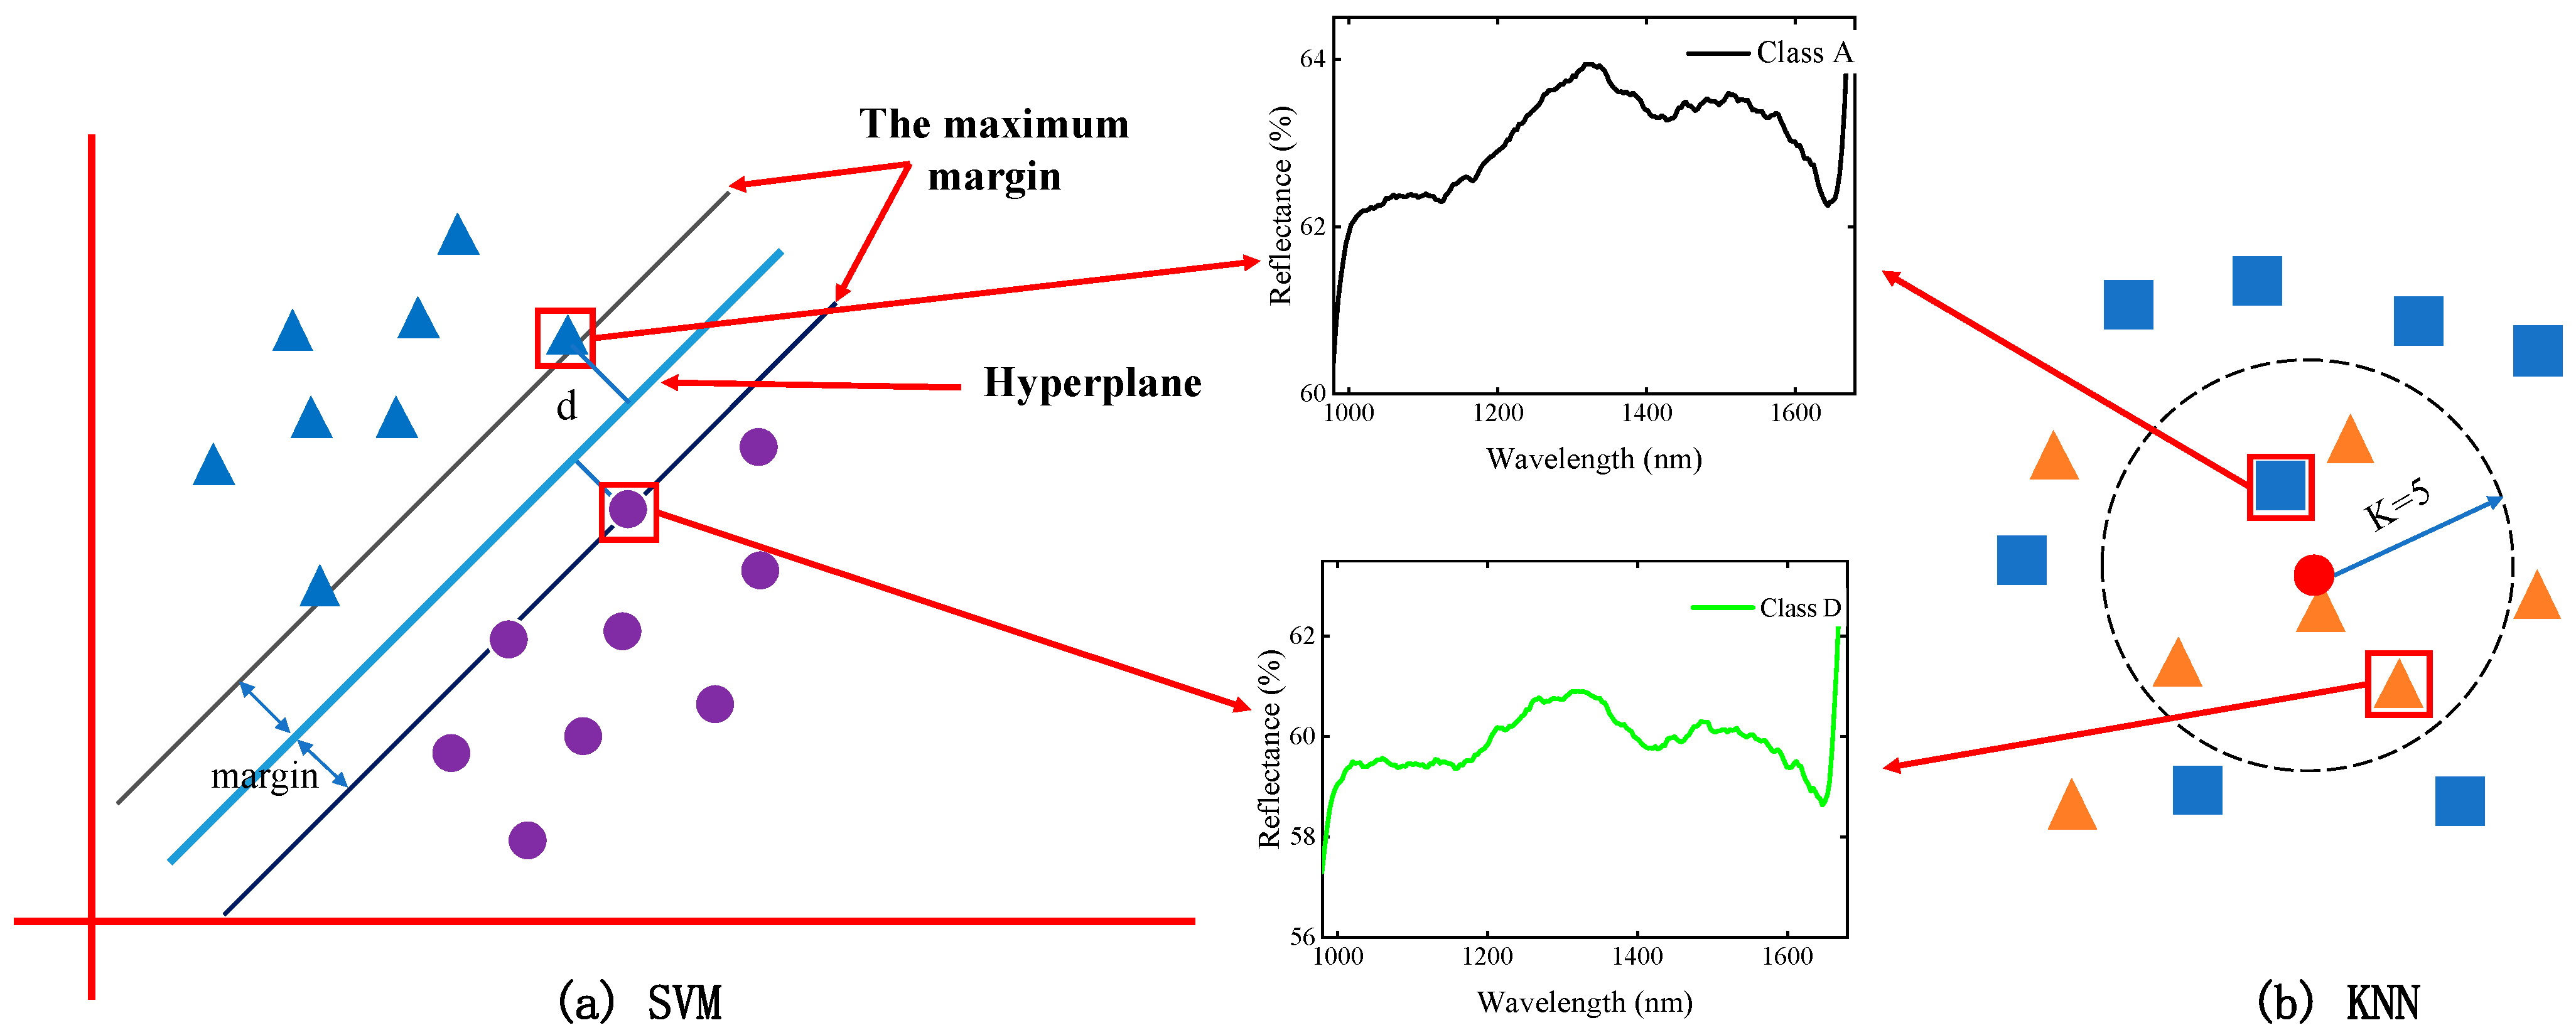
The core idea of the Support Vector Machine (SVM) algorithm is to find a separating hyperplane in the hyperspectral dataset that can correctly classify the grades of stone powder samples and maximize the geometric margin. This hyperplane aims to maximize the distance between the hyperplane and the best samples of different categories, as illustrated in Figure 2 section.
Figure 2.
Classification models.
The K-Nearest Neighbor (KNN) algorithm is a common supervised learning method, typically used for classification and regression tasks. The KNN algorithm classifies or predicts by measuring the distances between different categories of stone powder quality data. For a new sample point, it identifies the K nearest training sample points and predicts the category of the new sample point based on the categories of these K sample points, as illustrated in Figure 2.
In this study, the optimal parameter program automatically determined that the highest classification accuracy was achieved when the parameter K was set to 5.
2.5. Model Evaluation
In this study, we used the overall accuracy (OA), average accuracy (AA) and Kappa coefficient (Kappa) evaluation measures to judge the classification performance. Among them, OA represented the overall accuracy of the classification of stone powder quality grades in the test, AA represented the average accuracy of each quality grade, and Kappa was a statistical measure that provides mutual information between the real and predicted categories of stone powder grades.
3. Experimental Results and Analysis
3.1. Preparation of Stone Powder Sample
A total of 30 stone powder samples were collected from different locations on the limestone sand production line. The sample was placed in a 75-micron square hole sieve, and a vibrating screen (Xinxiang Chaowei Vibration Equipment Co., Ltd., Xinxiang, China) was used to obtain a stone powder sample with a particle size less than 75 microns. Before hyperspectral imaging, it was manually homogenized. The clay content of the stone powder sample was determined according to the test steps outlined in the sand specification for construction. The same sample was divided into three parts, with each part weighing 100 g, and any excess was discarded. The clay content of each sample was analyzed through repeated testing, and the results were averaged.
3.2. Determine the Clay Content by Washing Method
According to the requirements of the sand specification for construction, we placed the obtained stone powder sample with a thickness of less than 75 microns in an oven (Shaoxing Huda Machinery Equipment Co., Ltd., Shaoxing, China) at (105 ± 5). C. This was dried under C until a constant weight was reached, and its ma0 was weighed after cooling.
We poured the stone powder sample into a washing container with a depth greater than 250 mm, injected clean water so that the water surface was about 150 mm higher than the sample surface, used a glass rod to thoroughly mix the solution clockwise, soaked the sample for 2 h, and then washed the stone powder and clay in water by hand. We separated the stone powder from the clay, let it stand for a moment, waited for the stone powder to sink to the bottom, poured out the turbid water on the surface of the sample, and then injected clean water into the container. The above operation was repeated until the water in the container was visibly clear. We poured the cleaned stone powder into a shallow plate and placed it in an oven at (105 ± 5). C. This was dried to constant weight, and its ma1 was weighed to the nearest 0.1 g. The mud content was calculated according to Equation (2) and was accurate to 0.1%:
where Qm is the mud content; Qa0 is the drying mass before the test; and Qa1 is the drying quality after the test.
The above steps were repeated, and finally the clay content values of all stone powder samples were obtained, as shown in Table 1.
Table 1.
Measurement of clay content in stone powder by washing method.
According to the sand specification for construction (GB/T 14684-2022) [12], the quality grade of stone powder can be divided into four groups. Using this method, samples belonging to Class A are considered suitable for concrete with strength classes greater than C60; Class B samples should be used for concrete with strength grade C30-C60 and freezing and impermeability resistance or other requirements; Class C samples should be used for concrete and construction sand with a strength grade less than C30; and Class D samples are considered unsuitable for construction, as shown in Table 2.
Table 2.
Quality grade division of stone powder and sample quantity of each grade.
3.3. Hyperspectral Data Analysis
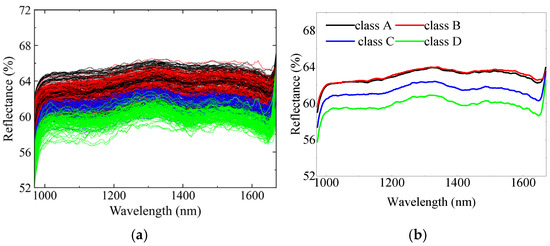
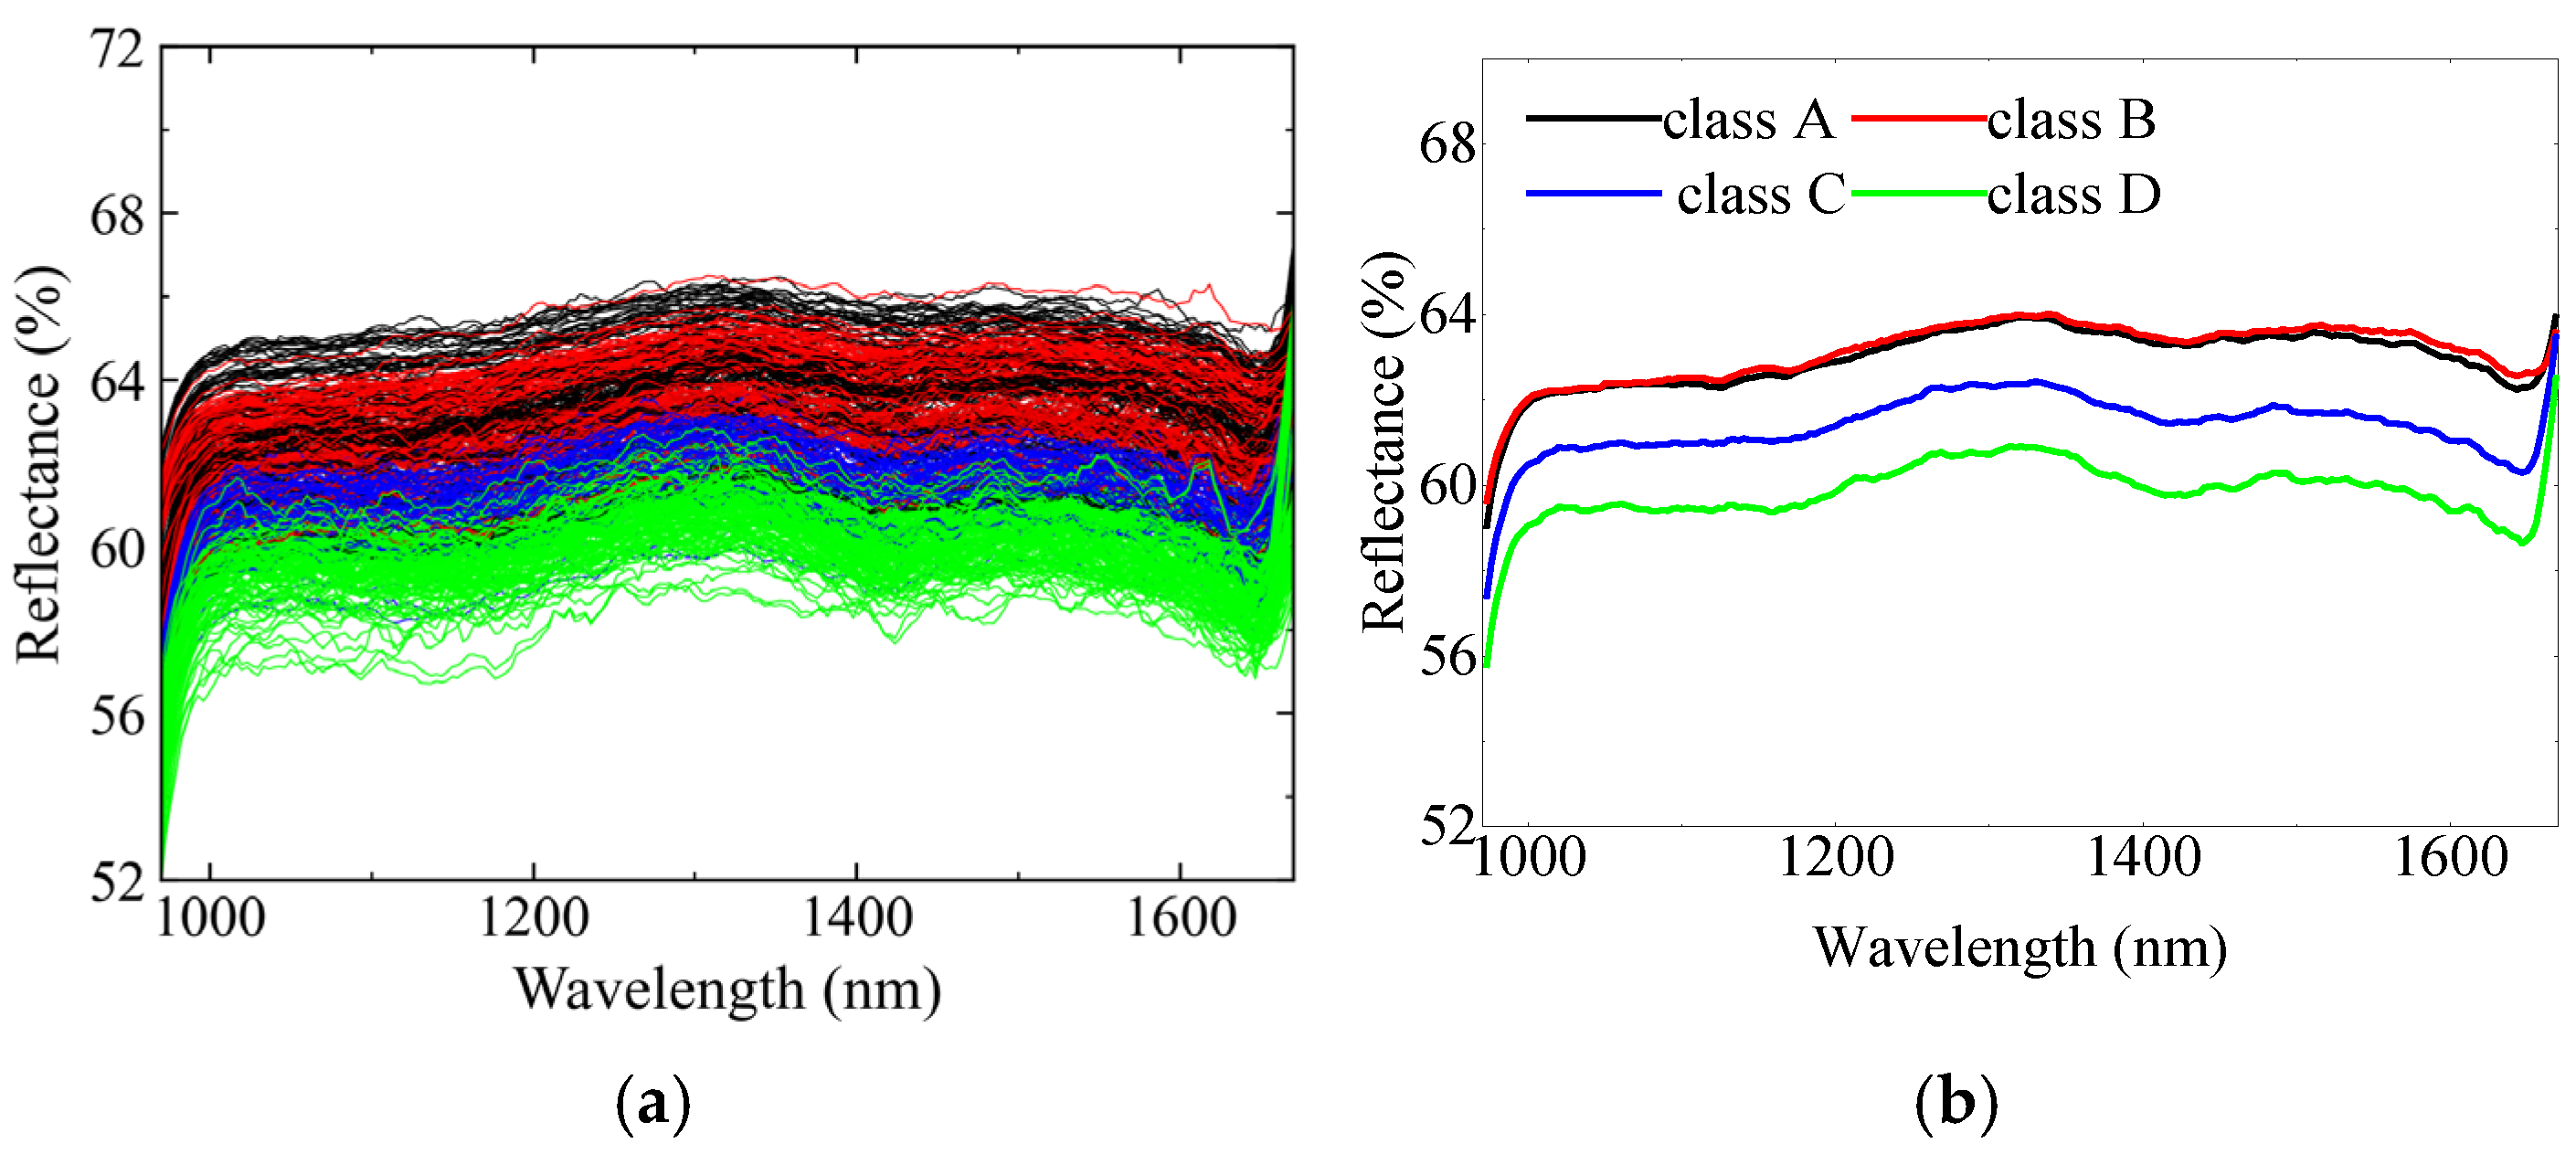
The collected stone powder samples were imaged using the hyperspectral camera, and fifteen spectral data points were collected for each sample, resulting in a total of 300 data points. The original spectral signal curves of 300 samples are shown in Figure 3, and the average spectral data of four quality grades of stone powder samples in the 970–1670 nm wavelength range are shown in Figure 3. The noise fluctuations at the starting point (900–970 nm) and ending point (1670–1700 nm) of the spectral curve are significant, so only data within the 970–1670 nm wavelength range was used as the research object.
Figure 3.
Raw hyperspectral data. (a) Raw hyperspectral data for 300 samples; (b) average hyperspectral data for four grades of stone powder samples.
As shown in Figure 3, the four grades of stone powder samples exhibit the same trend of variation across the entire wavelength range, but there are certain differences in the corresponding absorption peaks and valleys. As the clay content in the sample increases, the total reflectance of the spectrum shows a decreasing trend, while the spectral lines of adjacent grade stone powder samples show significant overlap. It is necessary to preprocess the collected hyperspectral data to reduce the complexity of analysis.
3.4. Hyperspectral Pretreatment
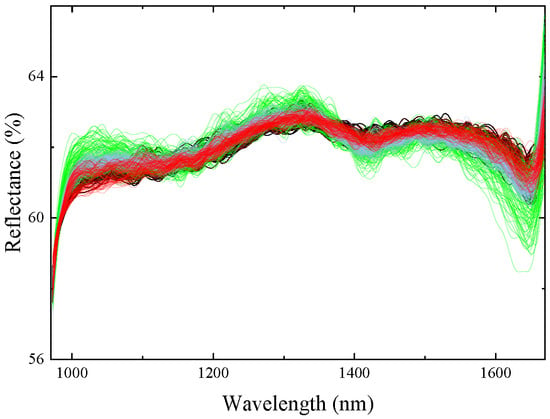
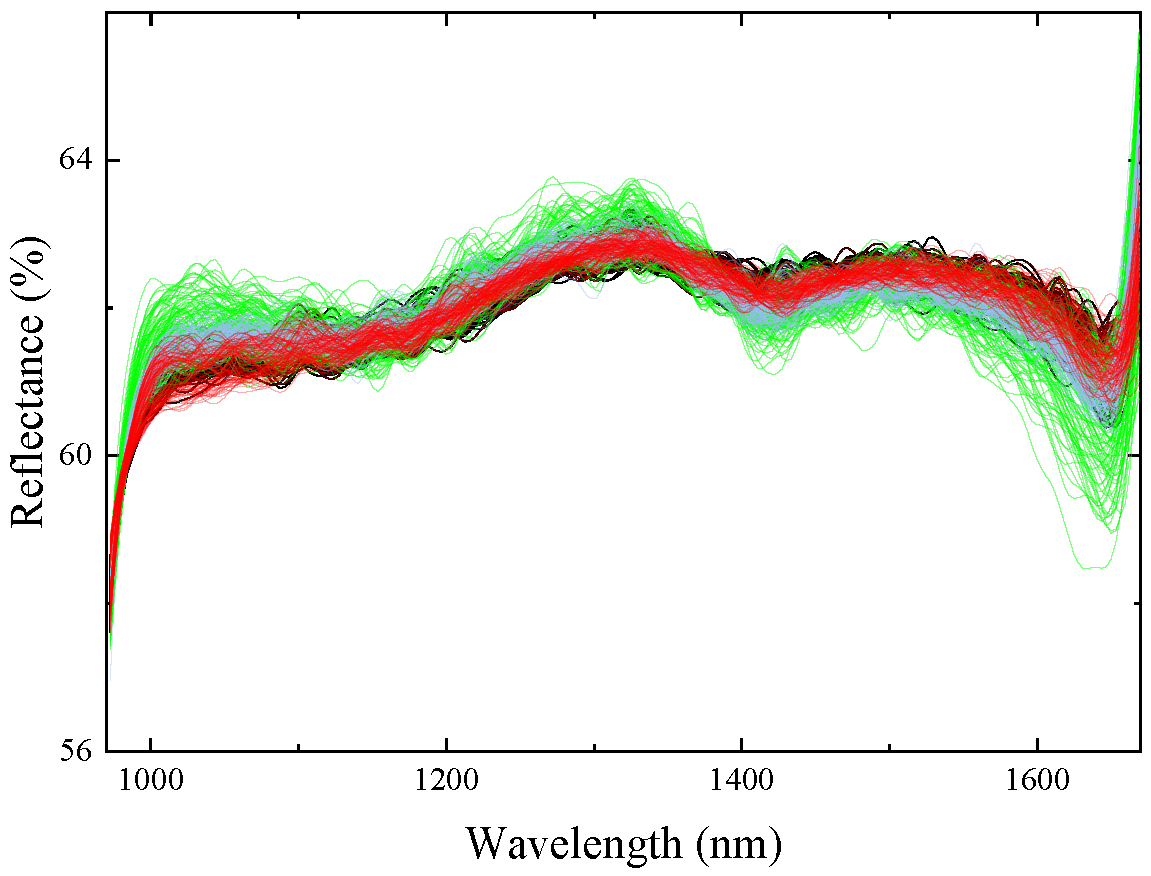
In order to better extract spectral features and reduce the influence of noise, the preprocessing method combined with SG-MSC is adopted to strengthen the spectral band feature points, enhance the comparability between data, avoid the computational complexity caused by high reflectivity values, and accelerate the convergence of training models. When employing the SG algorithm for data preprocessing, a window length of 25 and a polynomial degree of 9 were chosen. The window length signifies the size of the moving window utilized in the Savitzky–Golay (SG) smoothing procedure, while the polynomial degree denotes the order of the polynomial fitting applied to the data points within the window. The spectrum following the smoothing preprocessing is depicted in Figure 4.
Figure 4.
Spectral curve after pretreatment by SG-MSC algorithm. The black, red, blue, and green curves represent Classes A, B, C, and D, respectively.
3.5. Selection of Characteristic Wavelength
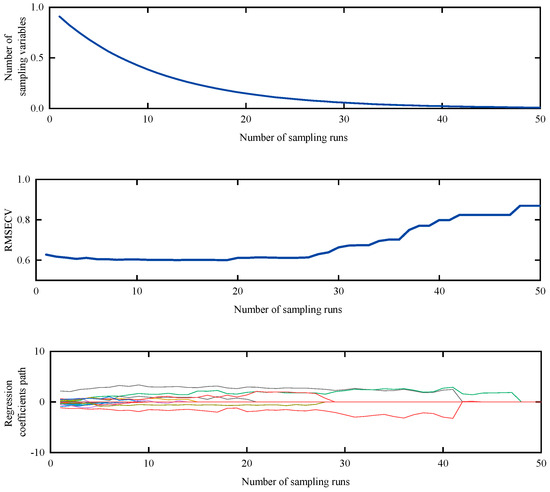
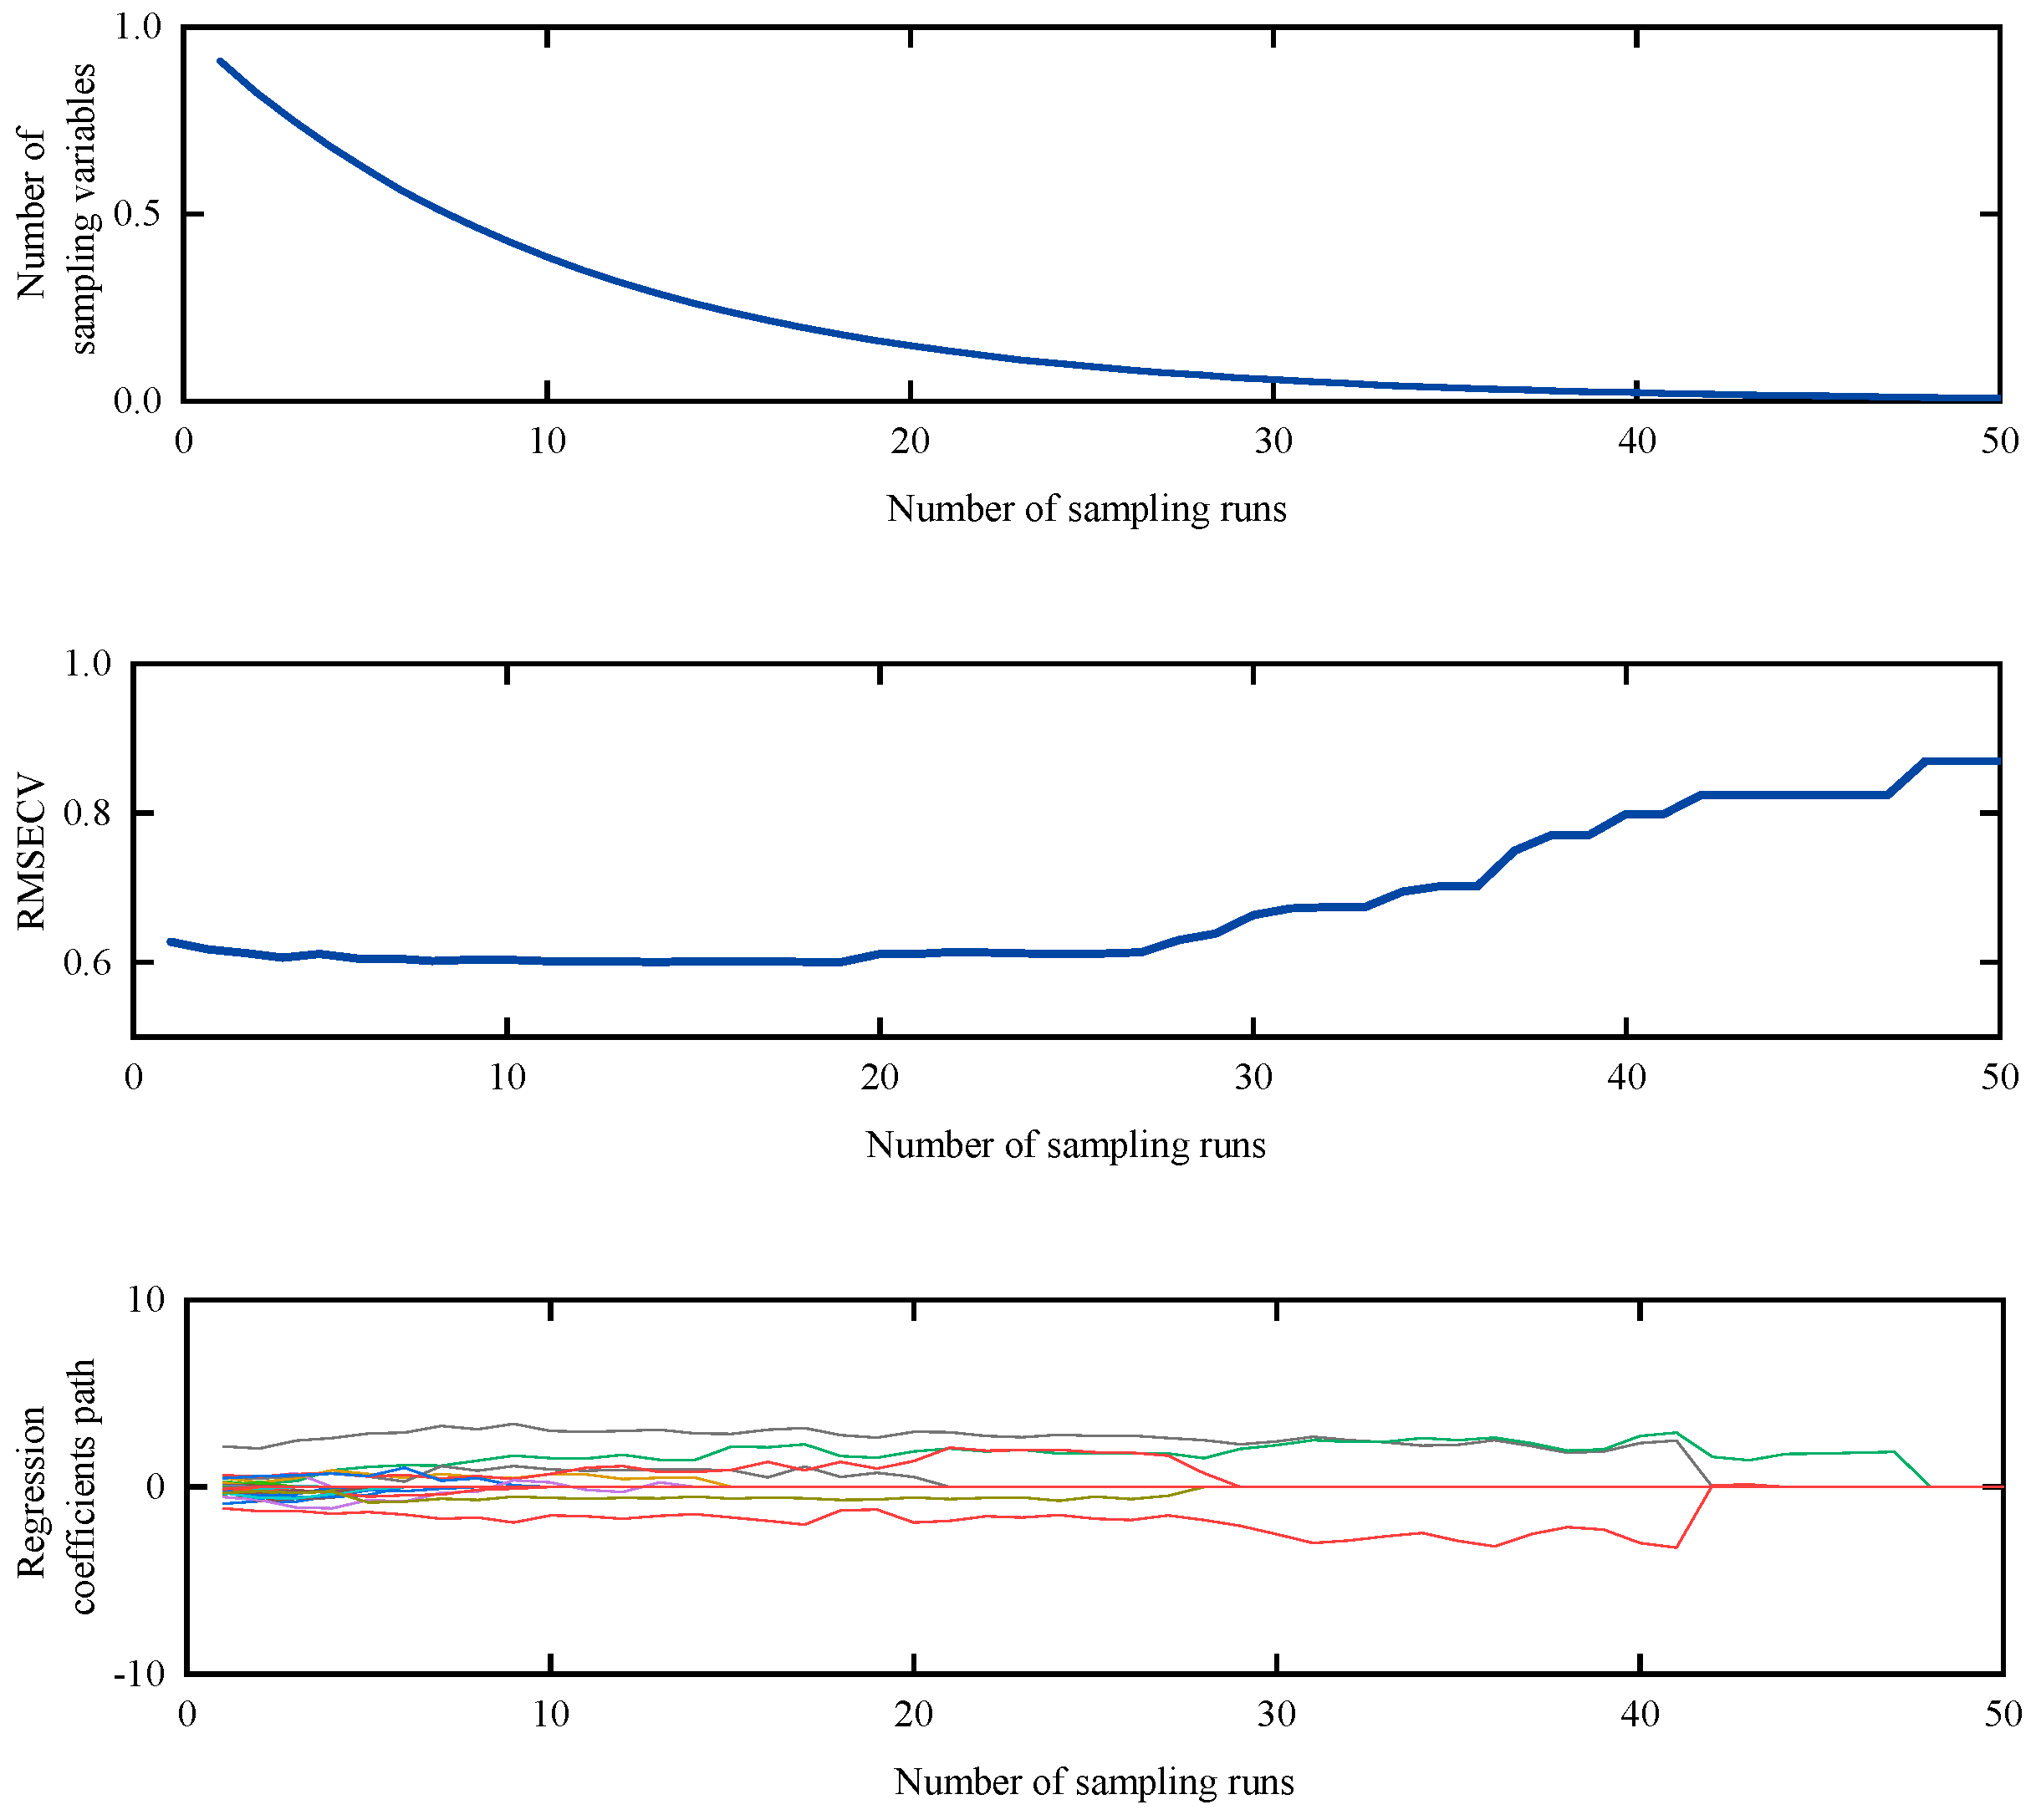
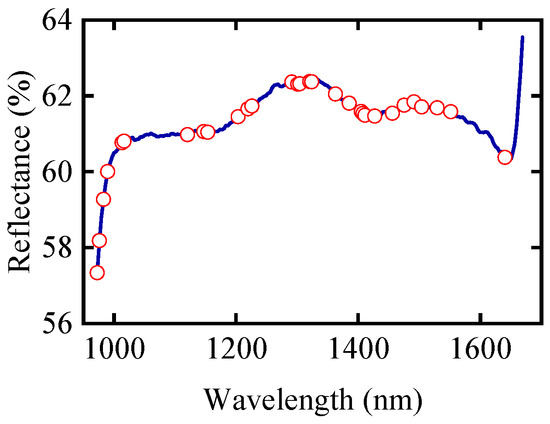
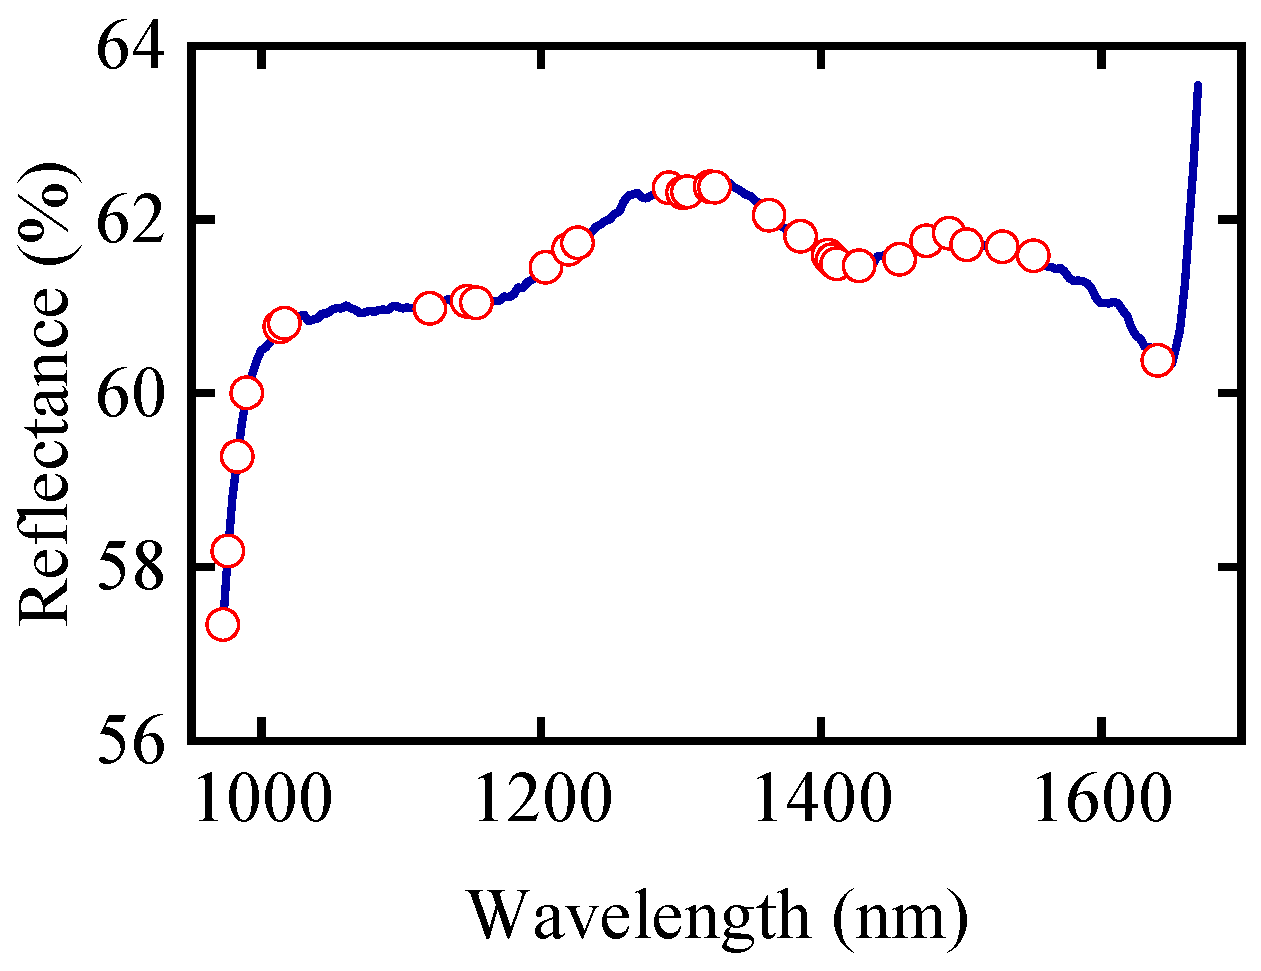
The feature results extracted by the CARS algorithm after hyperspectral data preprocessing are shown in Figure 5. In the application of the CARS algorithm, the parameter configurations are specified as follows: the maximum principal component fraction is defined as 20, the Monte Carlo (MC) sampling frequency is set at 50, and the cross-validation frequency is established at 10. The principal component fraction pertains to the proportion of principal components retained throughout the feature selection process. Meanwhile, the MC sampling frequency refers to the number of iterations conducted during the Monte Carlo sampling procedure, while the cross-validation frequency delineates the frequency of cross-validation iterations employed within the algorithm. From Figure 5, it can be seen that as the number of MC samples increases, the number of sampling variables decreases exponentially. The RMSECV value first decreases and then increases (due to the removal of effective information in the characteristic wavelength, the model performance deteriorates, and the RMSECV value increases). In Figure 6, it can be seen that when the sampling frequency reaches the 14th time, the RMSECV value reaches its minimum value of 0.6005. The CARS algorithm screened out a total of 30 feature wavelengths, accounting for 13.95% of the total number of wavelengths, and the feature wavelength distribution is shown in Figure 7.
Figure 5.
Feature extraction results of CARS algorithm: number of sampling runs and sampling variables. The curves in different colors represent the regression coefficient trajectories of different wavelength variables during the CARS sampling process; the colors are used only to distinguish the variables.
Figure 6.
The distribution of characteristic variables selected by CARS algorithm.
Figure 7.
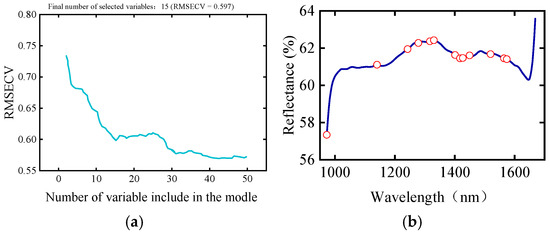
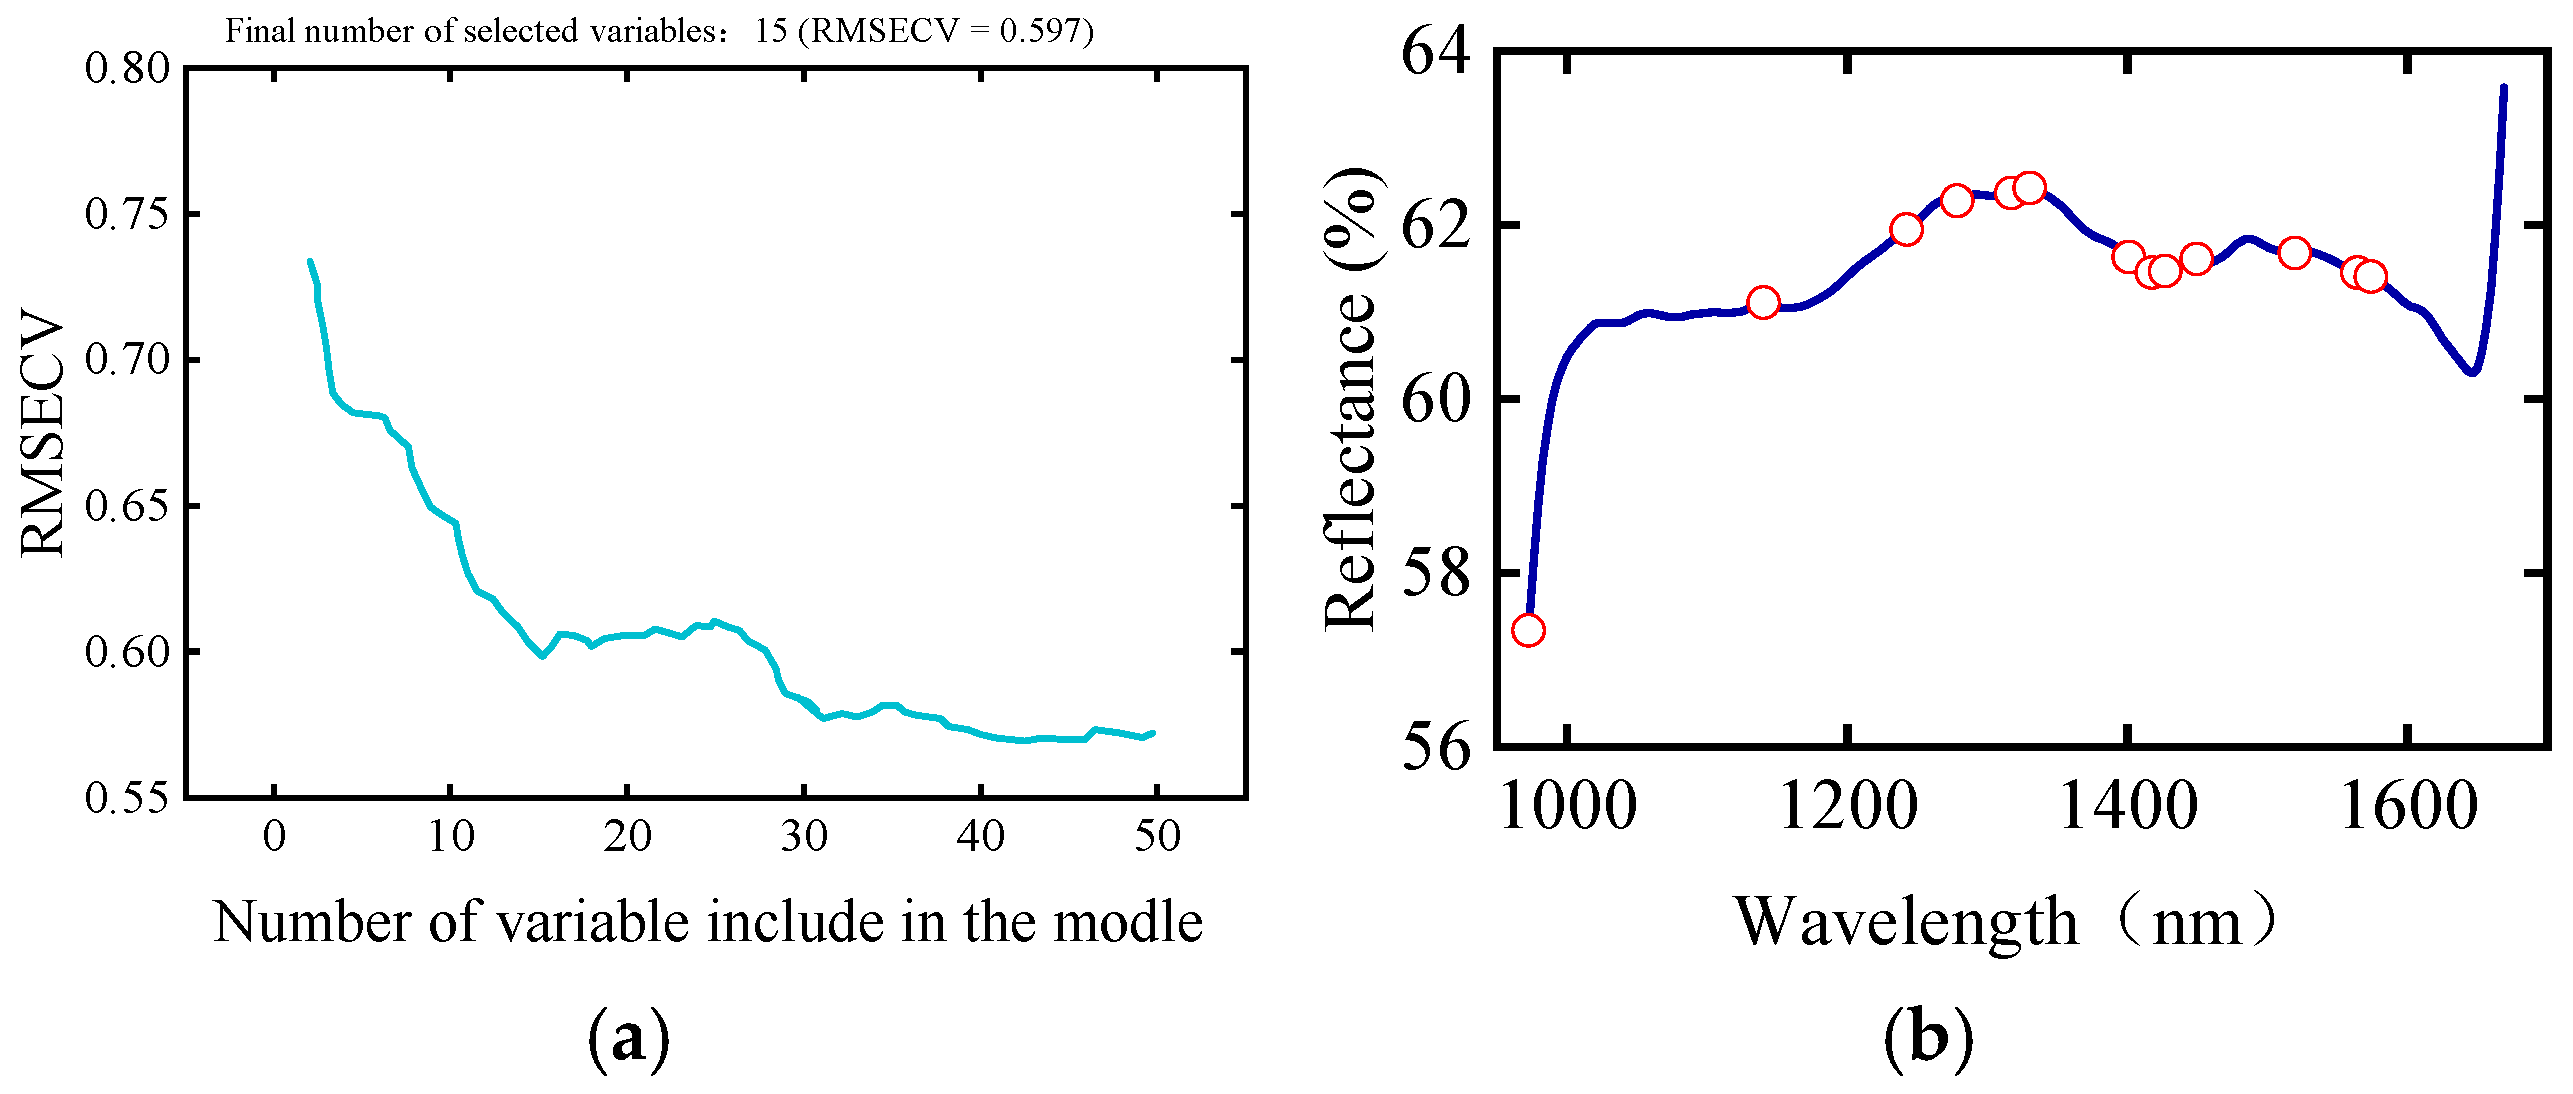
SPA feature extraction results: (a) RMSECV change and (b) distribution of feature wavelength.
The feature extraction results of SPA are shown in Figure 7. From Figure 7, it can be seen that RMSECV reaches its minimum at the 15th iteration, and its value is 0.597. A total of 13 feature wavelengths are screened out by the CARS algorithm, accounting for 6.04% of the total number of wavelengths, and the feature wavelength distribution is shown in Figure 7.
Table 3 shows the wavelengths of different algorithms. The results show that it is difficult to distinguish different stone powder quality grades with several specific wavelengths, and the selected characteristic wavelengths are loaded into the constructed classification model for evaluation and testing.
Table 3.
The feature bands were selected using CARS and SPA, respectively.
3.6. Analysis of Classification Results
KNN and SVM algorithms were used to build a classification model for the training data, and then the classification labels of the test data were predicted. We selected 80% of the stone powder sample data as the training set and 20% of the sample as the verification set. Table 4 shows the classification accuracies of the different algorithms. CARS and SPA did not perform feature extraction, so the accuracy of classification results was improved. However, in terms of computational efficiency, since the feature extraction algorithm compressed the original data and realized data dimensionality reduction, the calculation time of the classification model was greatly reduced. Although SPA extracts fewer feature variables, its overall accuracy is lower than the CARS algorithm. SPA over-compresses data and loses a lot of effective information. The results show that the Kappa coefficient is greater than 0.9 when the CARS algorithm is combined with the SVM classification model [11], which has great potential for the classification of stone powder quality grade.
Table 4.
The classification accuracies of combinations of different algorithms.
4. Conclusions
In this paper, a manufactured sand powder grade test method based on hyperspectral imaging combined with machine learning is proposed. The preprocessing method (SG-MSC) combined with different feature variable selection methods (CARS, SPA) has been proposed to extract the spectral feature information and construct the data feature space for different stone powder quality grades. Datasets representing the quality level of stone powder have been established for training and predicting different classification models (SVM, KNN). The performance results show that the classification model developed by combining CARS and SVM can be successfully applied to the quality classification of stone powder.
The model for classifying stone powder quality grade based on hyperspectral imaging combined with machine learning proposed in this paper provides a basis for determining the actual mechanism of mud powder content in stone powder and has practical significance for the effective utilization of stone powder and the reduction of carbon emissions.
Author Contributions
Conceptualization, Z.Z. and X.P.; methodology, Z.Z. and X.L.; software, X.L.; validation, H.W., H.S. and X.P.; formal analysis, Z.Z.; investigation, Z.Z. and H.W.; resources, H.S. and X.P.; data curation, X.L. and H.W.; writing—original draft preparation, Z.Z.; writing—review and editing, X.L., H.W., H.S. and X.P.; visualization, X.L.; supervision, X.P.; project administration, H.S. and X.P. All authors have read and agreed to the published version of the manuscript.
Funding
This research received no external funding.
Institutional Review Board Statement
Not applicable.
Informed Consent Statement
Not applicable.
Data Availability Statement
The data presented in this study are available from the corresponding author upon reasonable request.
Conflicts of Interest
Authors Zelin Zhang, Xiaoguang Li, Haijun Wu, and Hua Shu were employed by CCCC First Highway Engineering Group No. 10 Engineering Co., Ltd. The remaining author declares that the research was conducted in the absence of any commercial or financial relationships that could be construed as a potential conflict of interest.
References
- Zhu, J.; Shu, X.; Tang, J.; Li, T.; Ran, Q.; Liu, J. Effect of microfines from manufactured sand on yield stress of cement paste. Constr. Build. Mater. 2021, 267, 120987. [Google Scholar] [CrossRef] [Scilit]
- Bendixen, M.; Best, J.; Hackney, C.; Iversen, L.L. Time is running out for sand. Nature 2019, 571, 29–31. [Google Scholar] [CrossRef] [Scilit] [PubMed]
- Rath, S.; Sakai, Y. Evaluation of the water penetration depth in mortar using water indicator and hyperspectral imaging. Constr. Build. Mater. 2023, 380, 131269. [Google Scholar] [CrossRef] [Scilit]
- Chen, G.; Li, S.; Zhao, Y.; Xu, Z.; Luo, X.; Gao, J. Hydration and microstructure evolution of a novel low-carbon concrete containing recycled clay brick powder and ground granulated blast furnace slag. Constr. Build. Mater. 2023, 386, 131596. [Google Scholar] [CrossRef] [Scilit]
- Abbasi, S.; Jannaty, M.H.; Faraj, R.H.; Shahbazpanahi, S.; Mosavi, A. The Effect of Incorporating Silica Stone Waste on the Mechanical Properties of Sustainable Concretes. Materials 2020, 13, 3832. [Google Scholar] [CrossRef] [Scilit] [PubMed]
- Huang, D.; Tian, Y.; Yu, S.; Wen, X.; Chen, S.; Gao, X.; Ren, L.; Zhen, J.; Chen, X. Inversion prediction of COD in wastewater based on hyperspectral technology. J. Clean. Prod. 2023, 385, 135681. [Google Scholar] [CrossRef] [Scilit]
- Ma, P.; Fan, L.; Chen, G. Hyperspectral reflectance for determination of steel rebar corrosion and Cl− concentration. Constr. Build. Mater. 2023, 368, 130506. [Google Scholar] [CrossRef] [Scilit]
- Fan, L.; Fan, M.; Alhaj, A.; Chen, G.; Ma, H. Hyperspectral imaging features for mortar classification and compressive strength assessment. Constr. Build. Mater. 2020, 251, 118935. [Google Scholar] [CrossRef] [Scilit]
- Ghandehari, M.; Vimer, C.S.; Ioannou, I.; Sidelev, A.; Jin, W.; Spellane, P. In-situ measurement of liquid phase moisture in cement mortar. NDT E Int. 2012, 45, 162–168. [Google Scholar] [CrossRef] [Scilit]
- Schafer, R. What Is a Savitzky-Golay Filter? IEEE Signal Process. Mag. 2011, 28, 111–117. [Google Scholar] [CrossRef] [Scilit]
- Meng, Y.; Yuan, W.; Aktilek, E.U.; Zhong, Z.; Wang, Y.; Gao, R.; Su, Z. Fine hyperspectral classification of rice varieties based on self-attention mechanism. Ecol. Inform. 2023, 75, 102035. [Google Scholar] [CrossRef] [Scilit]
- GB/T 14684-2022; Sand for Construction. China Standards Press: Beijing, China, 2022.

Disclaimer/Publisher’s Note: The statements, opinions and data contained in all publications are solely those of the individual author(s) and contributor(s) and not of MDPI and/or the editor(s). MDPI and/or the editor(s) disclaim responsibility for any injury to people or property resulting from any ideas, methods, instructions or products referred to in the content. |
© 2026 by the authors. Licensee MDPI, Basel, Switzerland. This article is an open access article distributed under the terms and conditions of the Creative Commons Attribution (CC BY) license.