


Abstract
In the simulation research of explosion shock waves, generating explosion loads with long-duration characteristics represents a key technical challenge for evaluating far-field damage effects of large-scale explosions. The core issue lies in how to effectively extend the positive pressure duration of shock waves to accurately simulate real explosion scenarios. Based on ANSYS AUTODYN, this study investigates the energy utilization mechanisms in shock tube drivers. The results demonstrate that increasing the driver section volume significantly improves explosion energy utilization efficiency, thereby effectively extending the positive phase duration of shock waves.
1. Introduction
The key load parameters of explosion shock waves include peak overpressure and positive-pressure duration. Direct field explosion tests entail high costs, stringent site requirements, and significant safety risks. Consequently, the development of shock tube technology holds considerable importance for research on weapon effects and engineering protection, as it enables the effective extension of shock wave positive-phase duration through controlled small-scale explosions.
In terms of experiments, Peng et al. [1] utilized a specific device and planar charge technology to simulate long-duration planar waves, with a duration ranging from 85 to 135 ms. On this basis, Yu et al. [2] conducted experiments using planar charge explosion technology in a large-scale closed anti-explosion test facility. The results showed that the peak overpressure of the planar air shock wave increased linearly with the increase in charge quantity. Ren Huiqi et al. [3] discussed the theory of air shock wave load and analyzed the dynamic pressure damage mechanism and ground influencing factors. As a highly efficient device for simulating explosion waves, the shock tube, in response to the limitations of previous research, Xin Kai et al. [4] achieved the extension and precise control of the positive pressure duration of the shock wave in the explosion wave simulation device through the combination of explosive explosion and the pre-charging of air in the driving section. Campbell et al. [5] utilized multiple technical means to obtain a longer-lasting explosion shock wave in the shock tube, with a duration reaching 102 ms. In terms of numerical simulation, Ismail [6] used Fluent to establish a simplified two-dimensional axisymmetric shock tube model, and the results showed that the positive pressure duration increased with the increase in the length of the driver and the expansion length. Shi Yanchao et al. [7] established a long-tube driving section initiation model and provided a shock wave generation scheme with a positive pressure duration of 100 and 200 ms. Liu et al. [8] studied the propagation law of explosion shock waves in high-pressure pipelines and obtained an impact load with a positive pressure duration of approximately 120 ms. Shin et al. [9] elucidated the influence law of energy release rate on shock wave characteristics. Li et al. [10] established an overpressure prediction model for shock waves in corrugated steel-lined tunnels and revealed the attenuation effect of the lining structure. Zhou et al. [11] found that adjusting the length ratio of high-pressure to low-pressure sections can optimize the propagation velocities of incident and reflected shock waves.
Current research largely relies on energy-based regulation strategies to control shock wave parameters. However, the intrinsic influence of the driver section’s volumetric geometry on shock wave propagation dynamics and overall energy utilization remains inadequately characterized, representing a critical gap in the fundamental understanding of shock tube performance optimization.
2. Numerical Calculation Analysis of the Shock Wave Driving Process
2.1. Establishment of the Finite Element Model
To capture the evolution of pressure fields within the pipeline, numerical simulations were conducted using AUTODYN 19.0 to model the generation and propagation of explosion shock waves. The computational domain comprises three distinct components: the ambient air, the pipeline structure, and the explosive charge. A 2D axisymmetric framework was employed in conjunction with an Euler-Lagrange coupling algorithm to handle the fluid–structure interaction. The boundary condition configurations are illustrated in Figure 1.
Figure 1.
Finite Element Model.
The pipe material is selected as steel 4340, and it is described using the Johnson Cook strength model as per reference [7]. The expression of the strength equation for this material is as follows:
The Johnson-Cook constitutive model is employed, with σ defined as a function of ε, T, and p. Model constants: A = 0.792 GPa, B = 0.51 GPa, n = 0.26, C = 0.014, m = 1.03, and melting point Tm = 1793 K.
TNT explosives are formed by filling in the air domain. The air is described using the ideal gas state equation and its specific form is
Thermodynamic behavior of air follows the ideal gas constitutive relation with state variables: initial pressure p, adiabatic exponent γ, density ρ, and specific internal energy E. The assigned parameter magnitudes are detailed in Table 1.
Table 1.
Parameters of Air Material Model.
TNT explosives are described by the JWL equation of state, and the specific form is
In the formula, p1 represents the detonation pressure, V is the relative volume, E is the initial specific internal energy, and A1, B1, R1, R2 and ω are all constants (measured by the cylinder experiment). Additionally, the pressure and energy of C-J also need to be input.
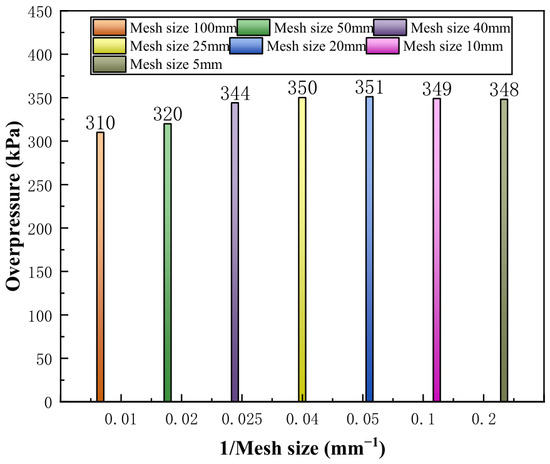
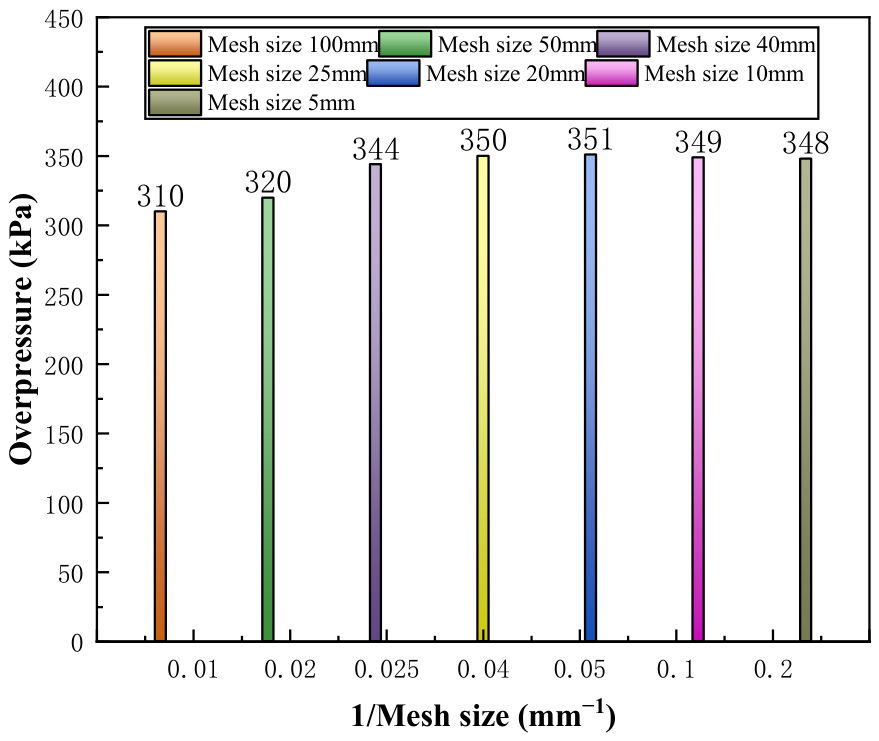
To ensure the accuracy of the calculation, a sensitivity analysis was conducted on the grid size. As shown in Figure 2, the peak of the overpressure remained basically unchanged when the grid size was 25 mm. Therefore, it was determined that this size is sufficient to meet the accuracy requirements of this two-dimensional axisymmetric model.
Figure 2.
Analysis of the Impact of Grid Size.
2.2. The Influence Law of the Volume of the Driving Section on the Duration of Positive Pressure of the Shock Wave
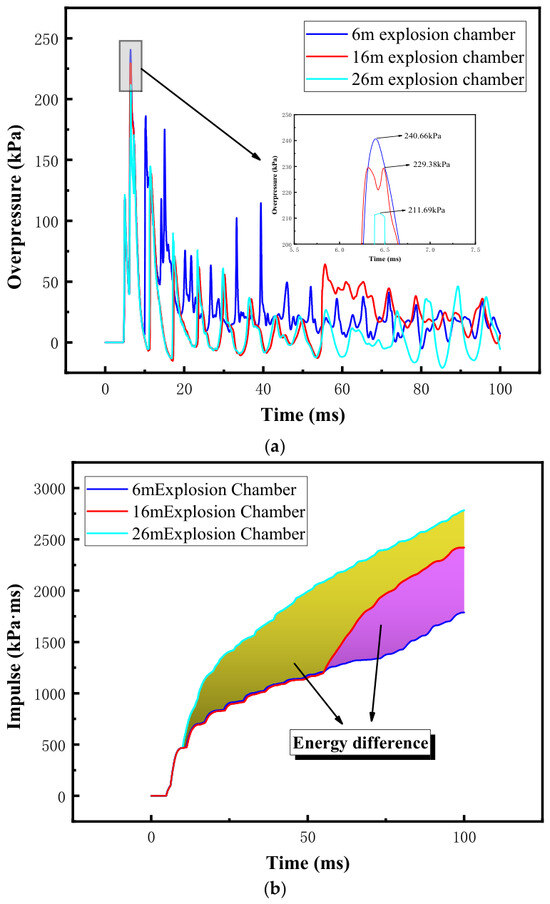
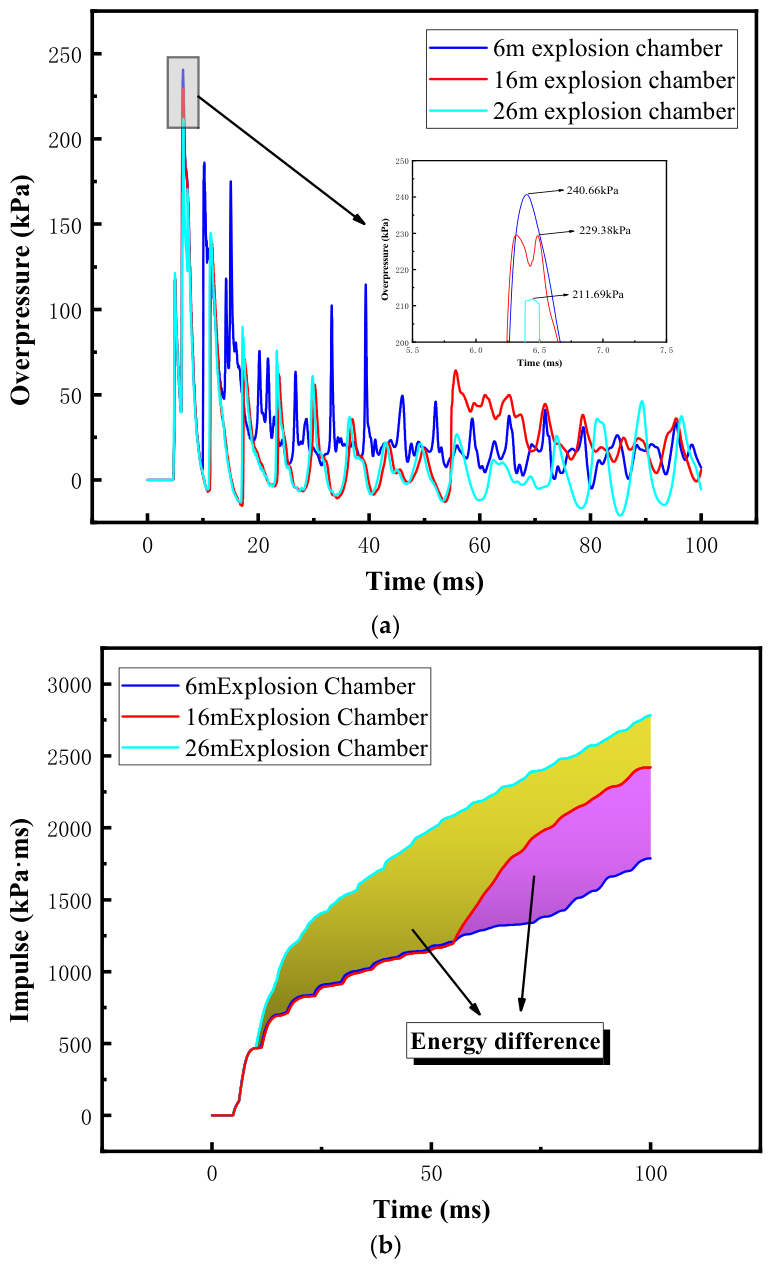
Figure 3 shows a comparison of the parameters of volume shock waves in different driving sections. This study employs numerical simulation to investigate shock wave characteristics in driver sections with a constant diameter of 4 m but varying lengths of 6 m, 16 m, and 26 m. Results demonstrate that, under identical charge conditions, increasing the driver volume reduces the shock wave peak overpressure by a maximum of 7.71%, yet significantly enhances both the impulse and the total energy transferred to the blast wave—with energy variation reaching up to 35.76%. These findings reveal a competitive energy partitioning mechanism between blast energy and structural deformation energy. Optimization of the driver section volume effectively regulates this distribution ratio, minimizing structural energy dissipation and thereby improving the conversion efficiency of explosive energy into air blast wave energy.
Figure 3.
Comparison of shock wave parameters with different blast chamber volumes. (a) Overpressure-time history curve. (b) Impulse time history curve.
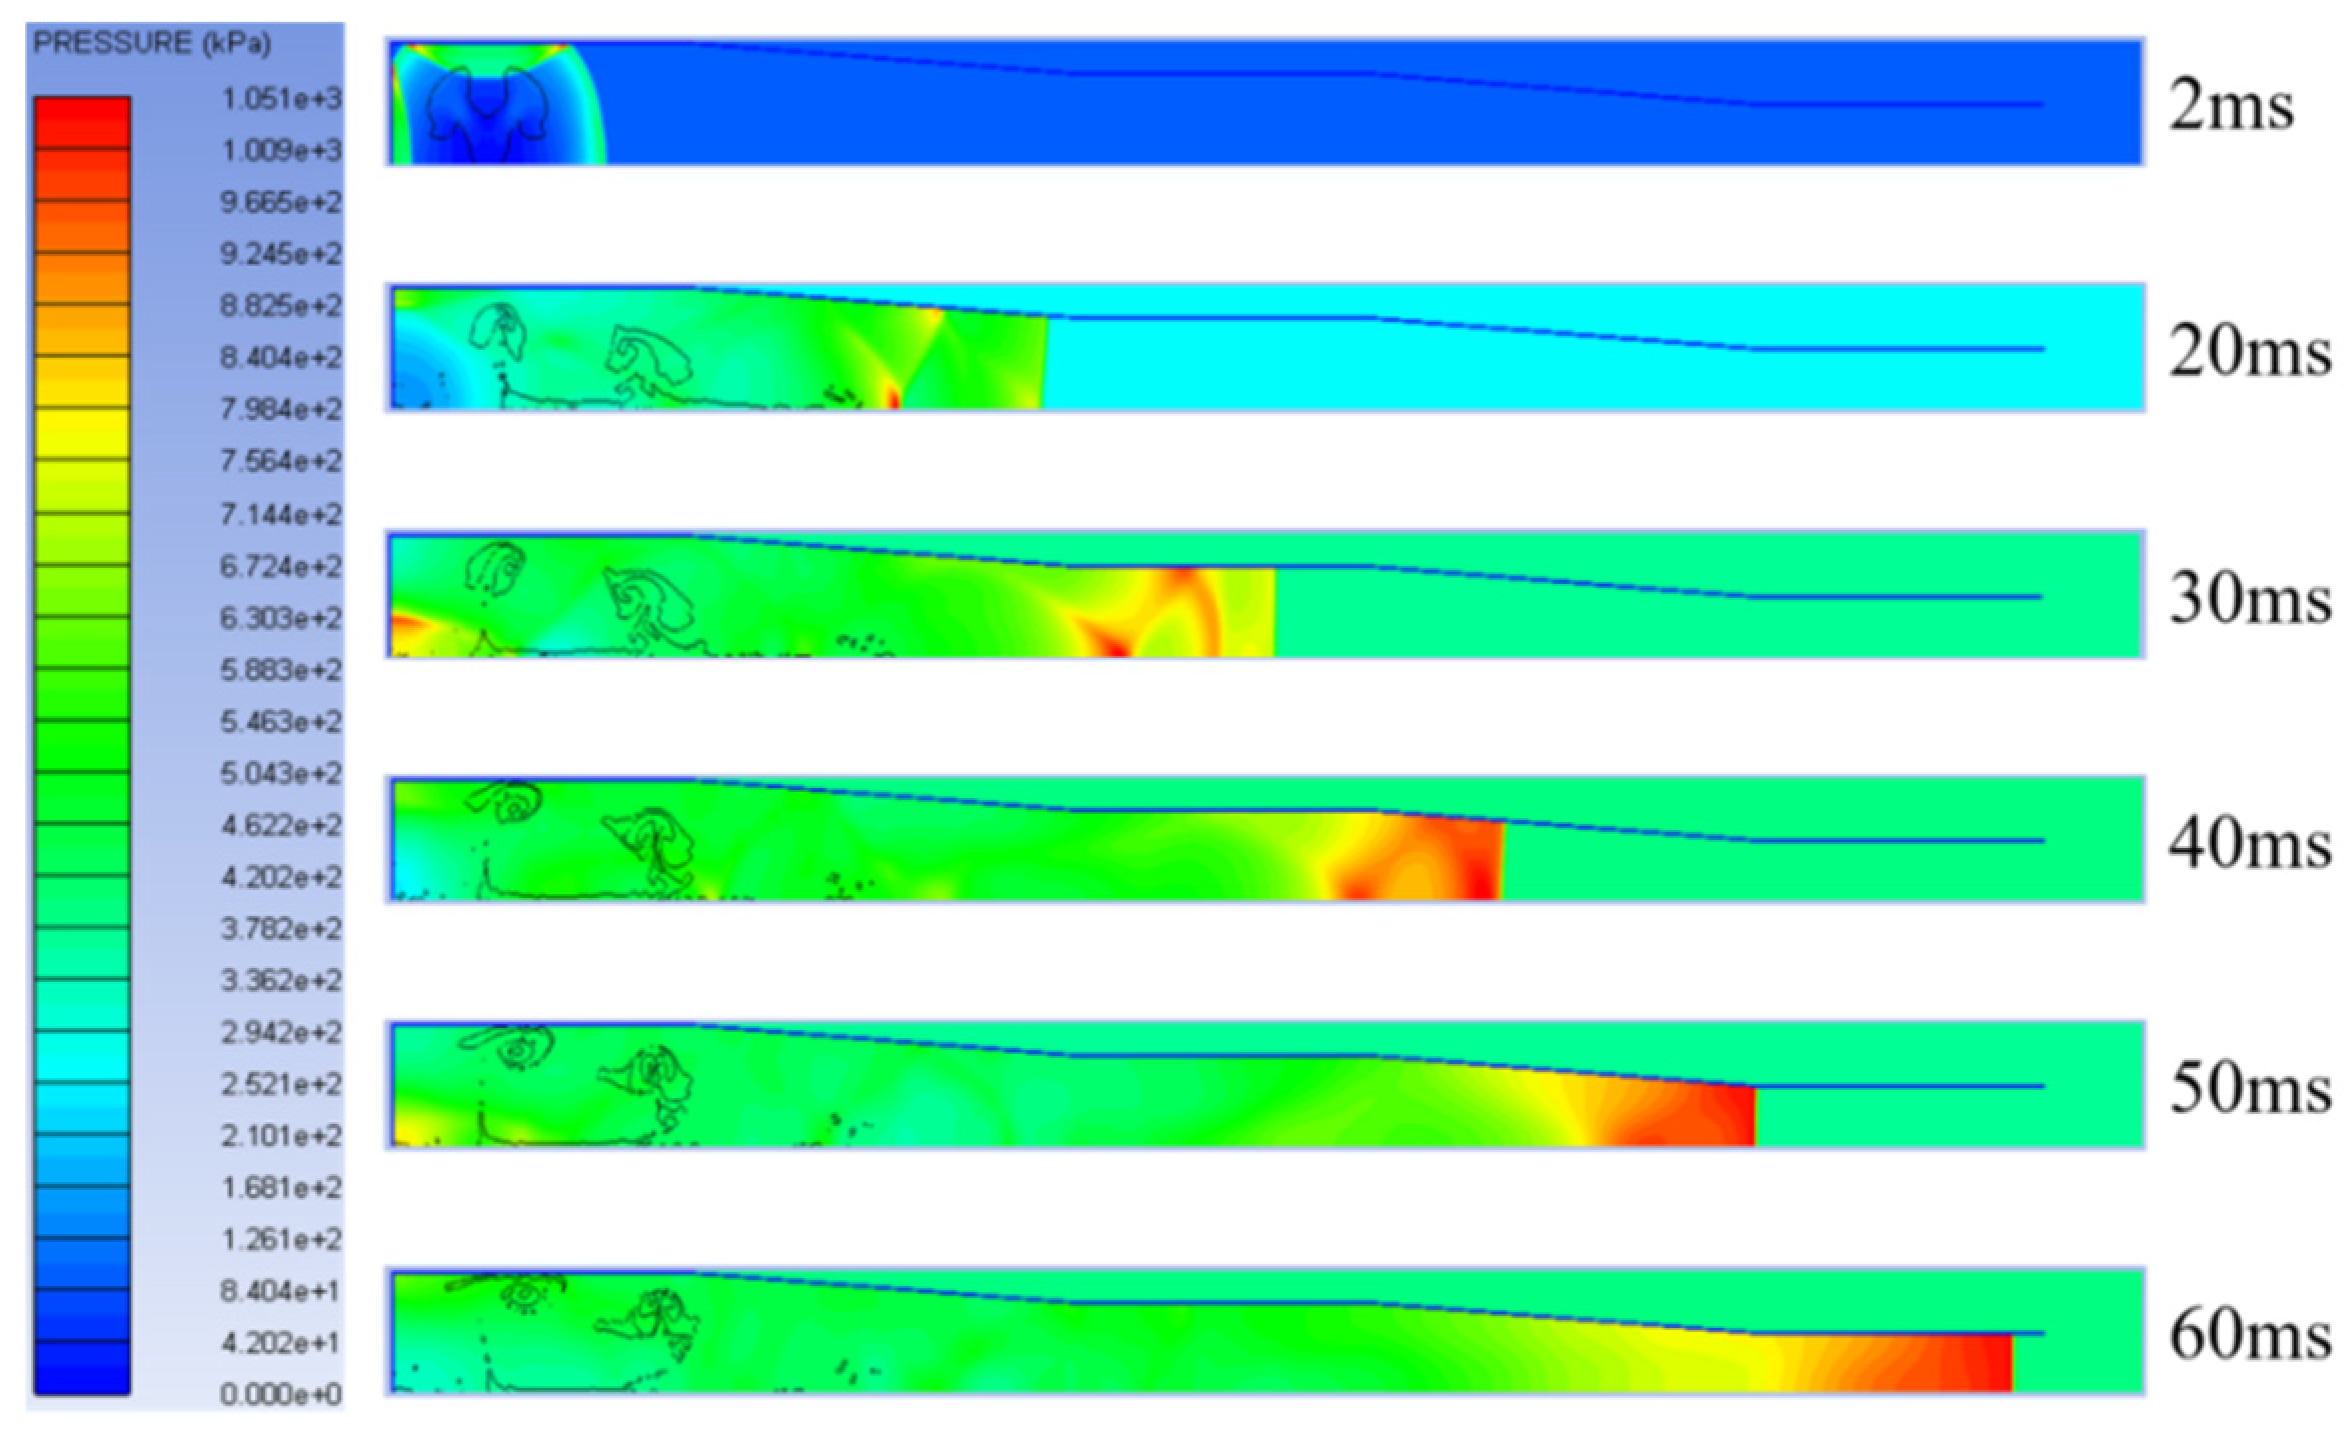
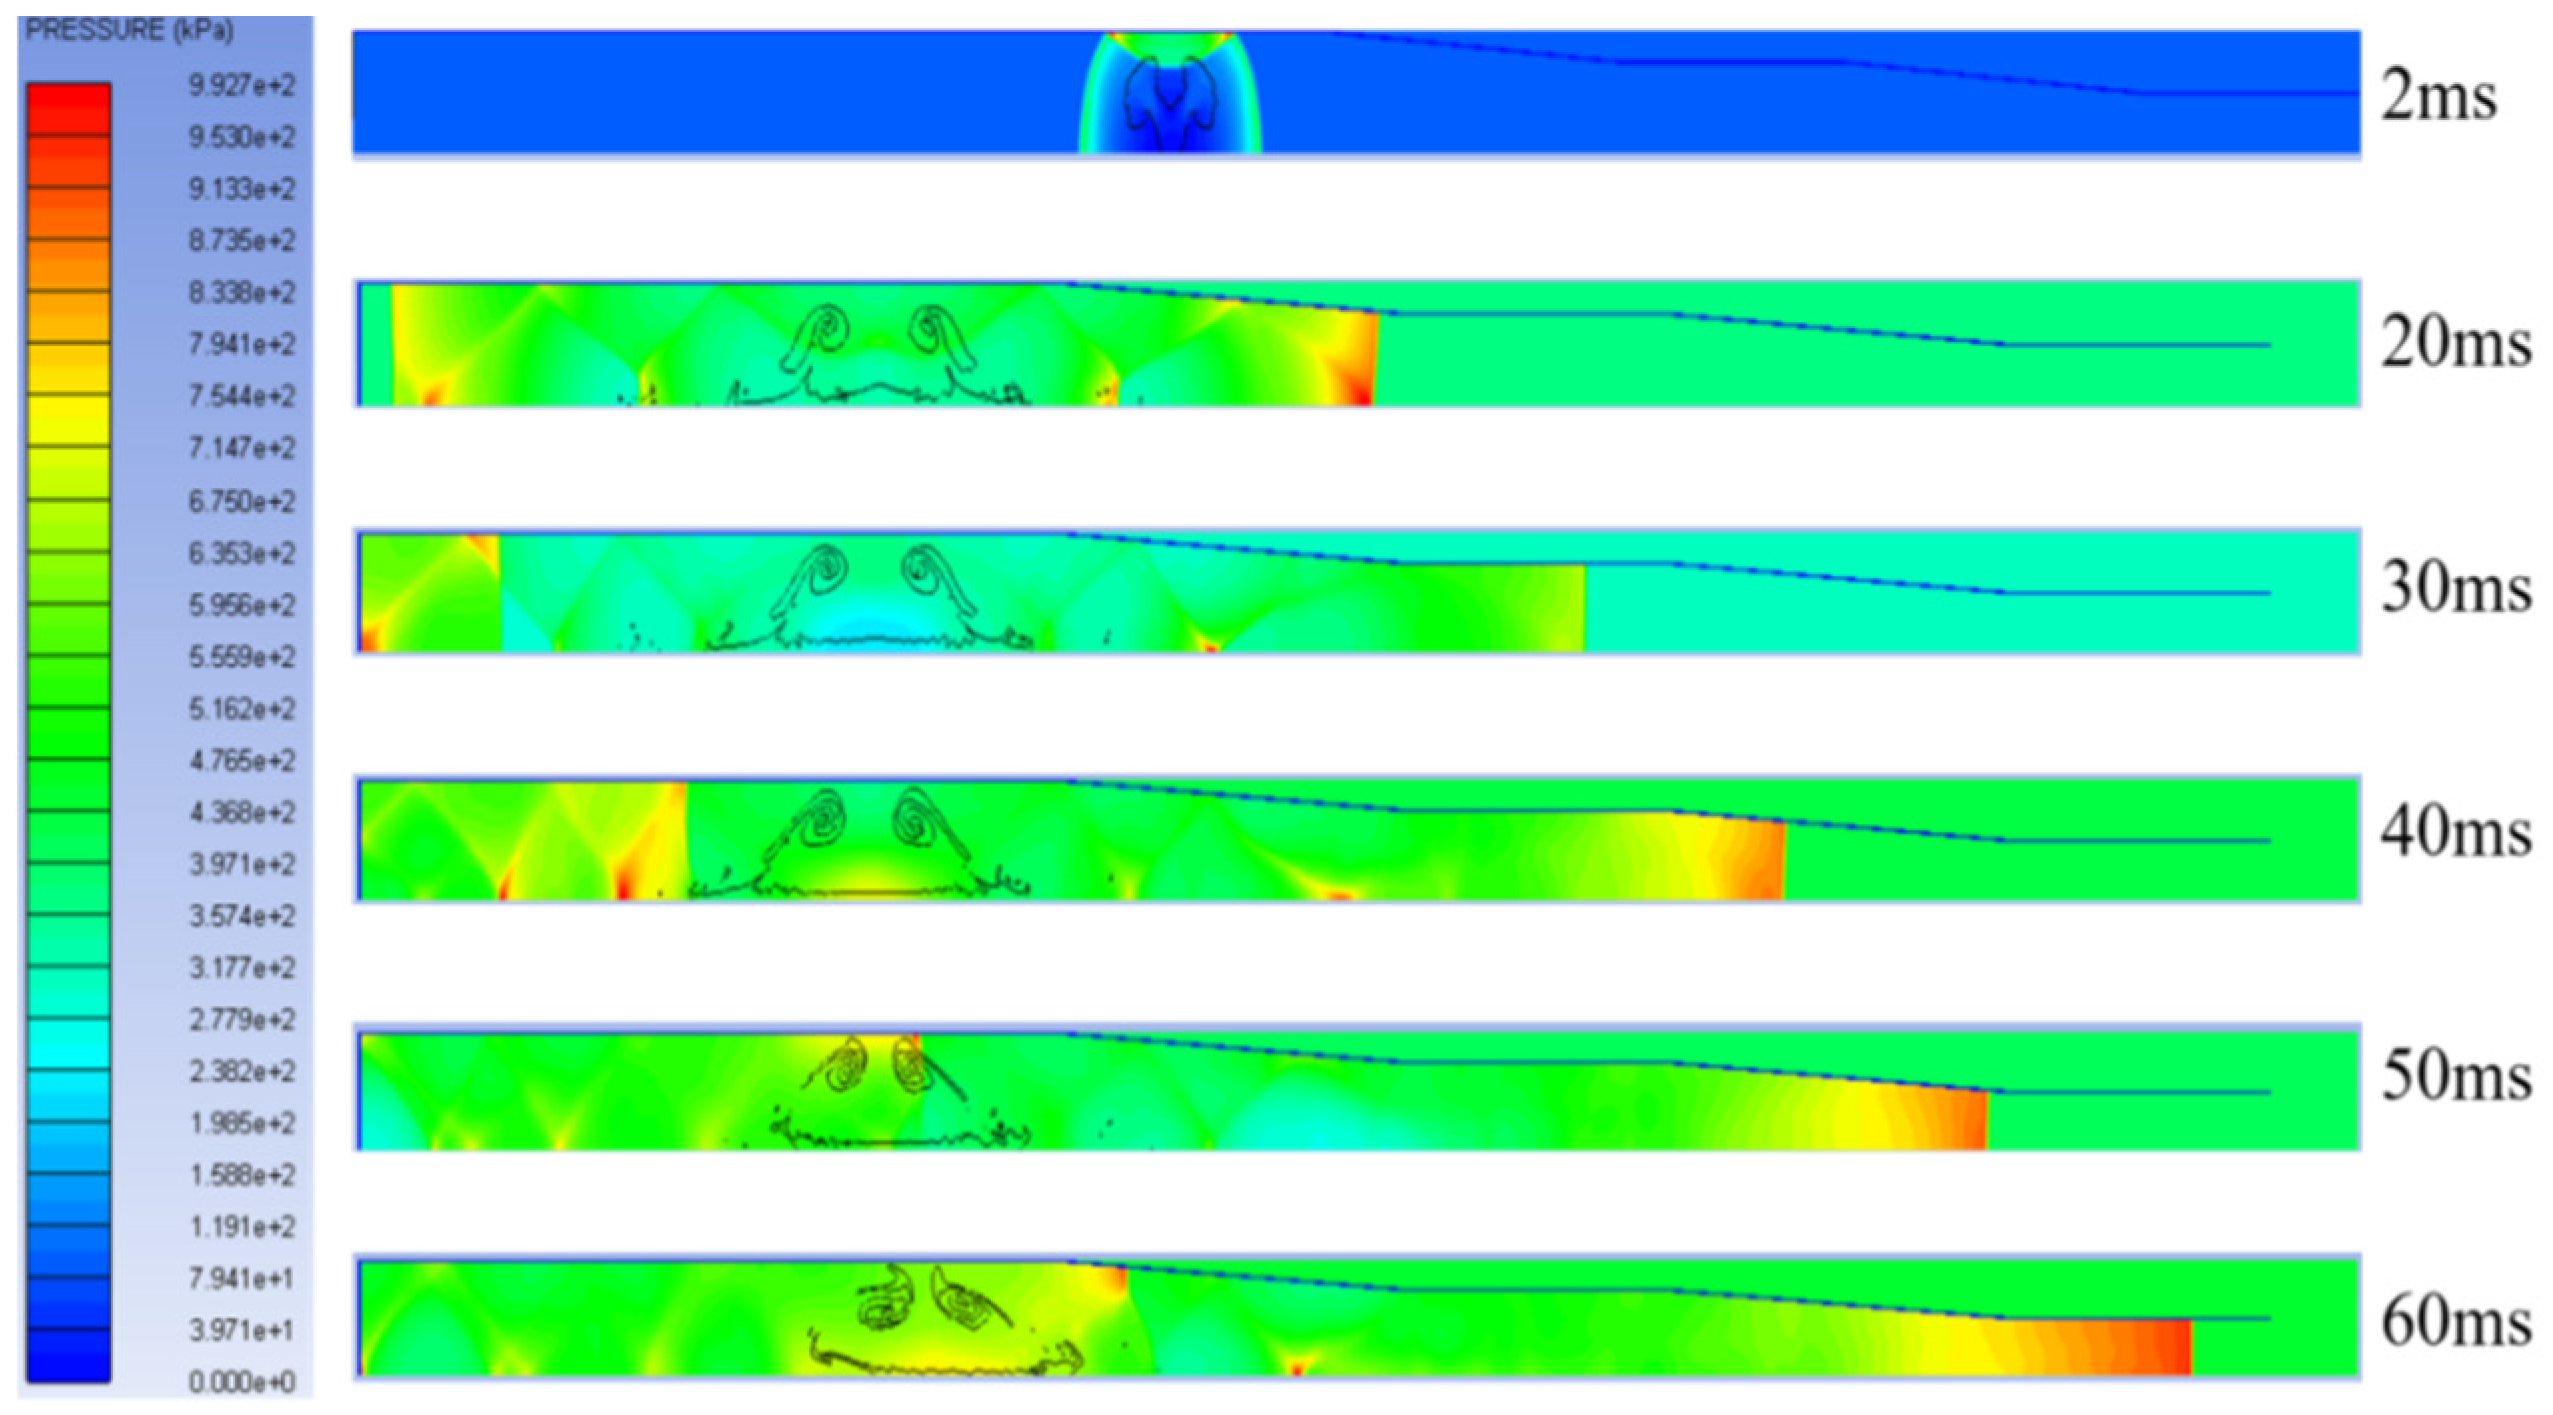
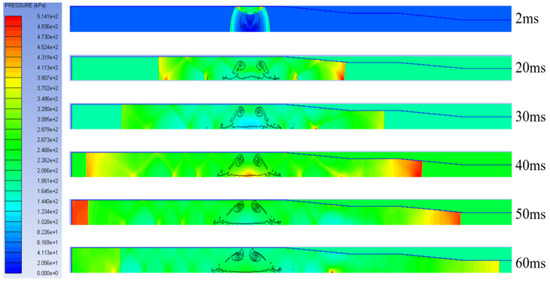
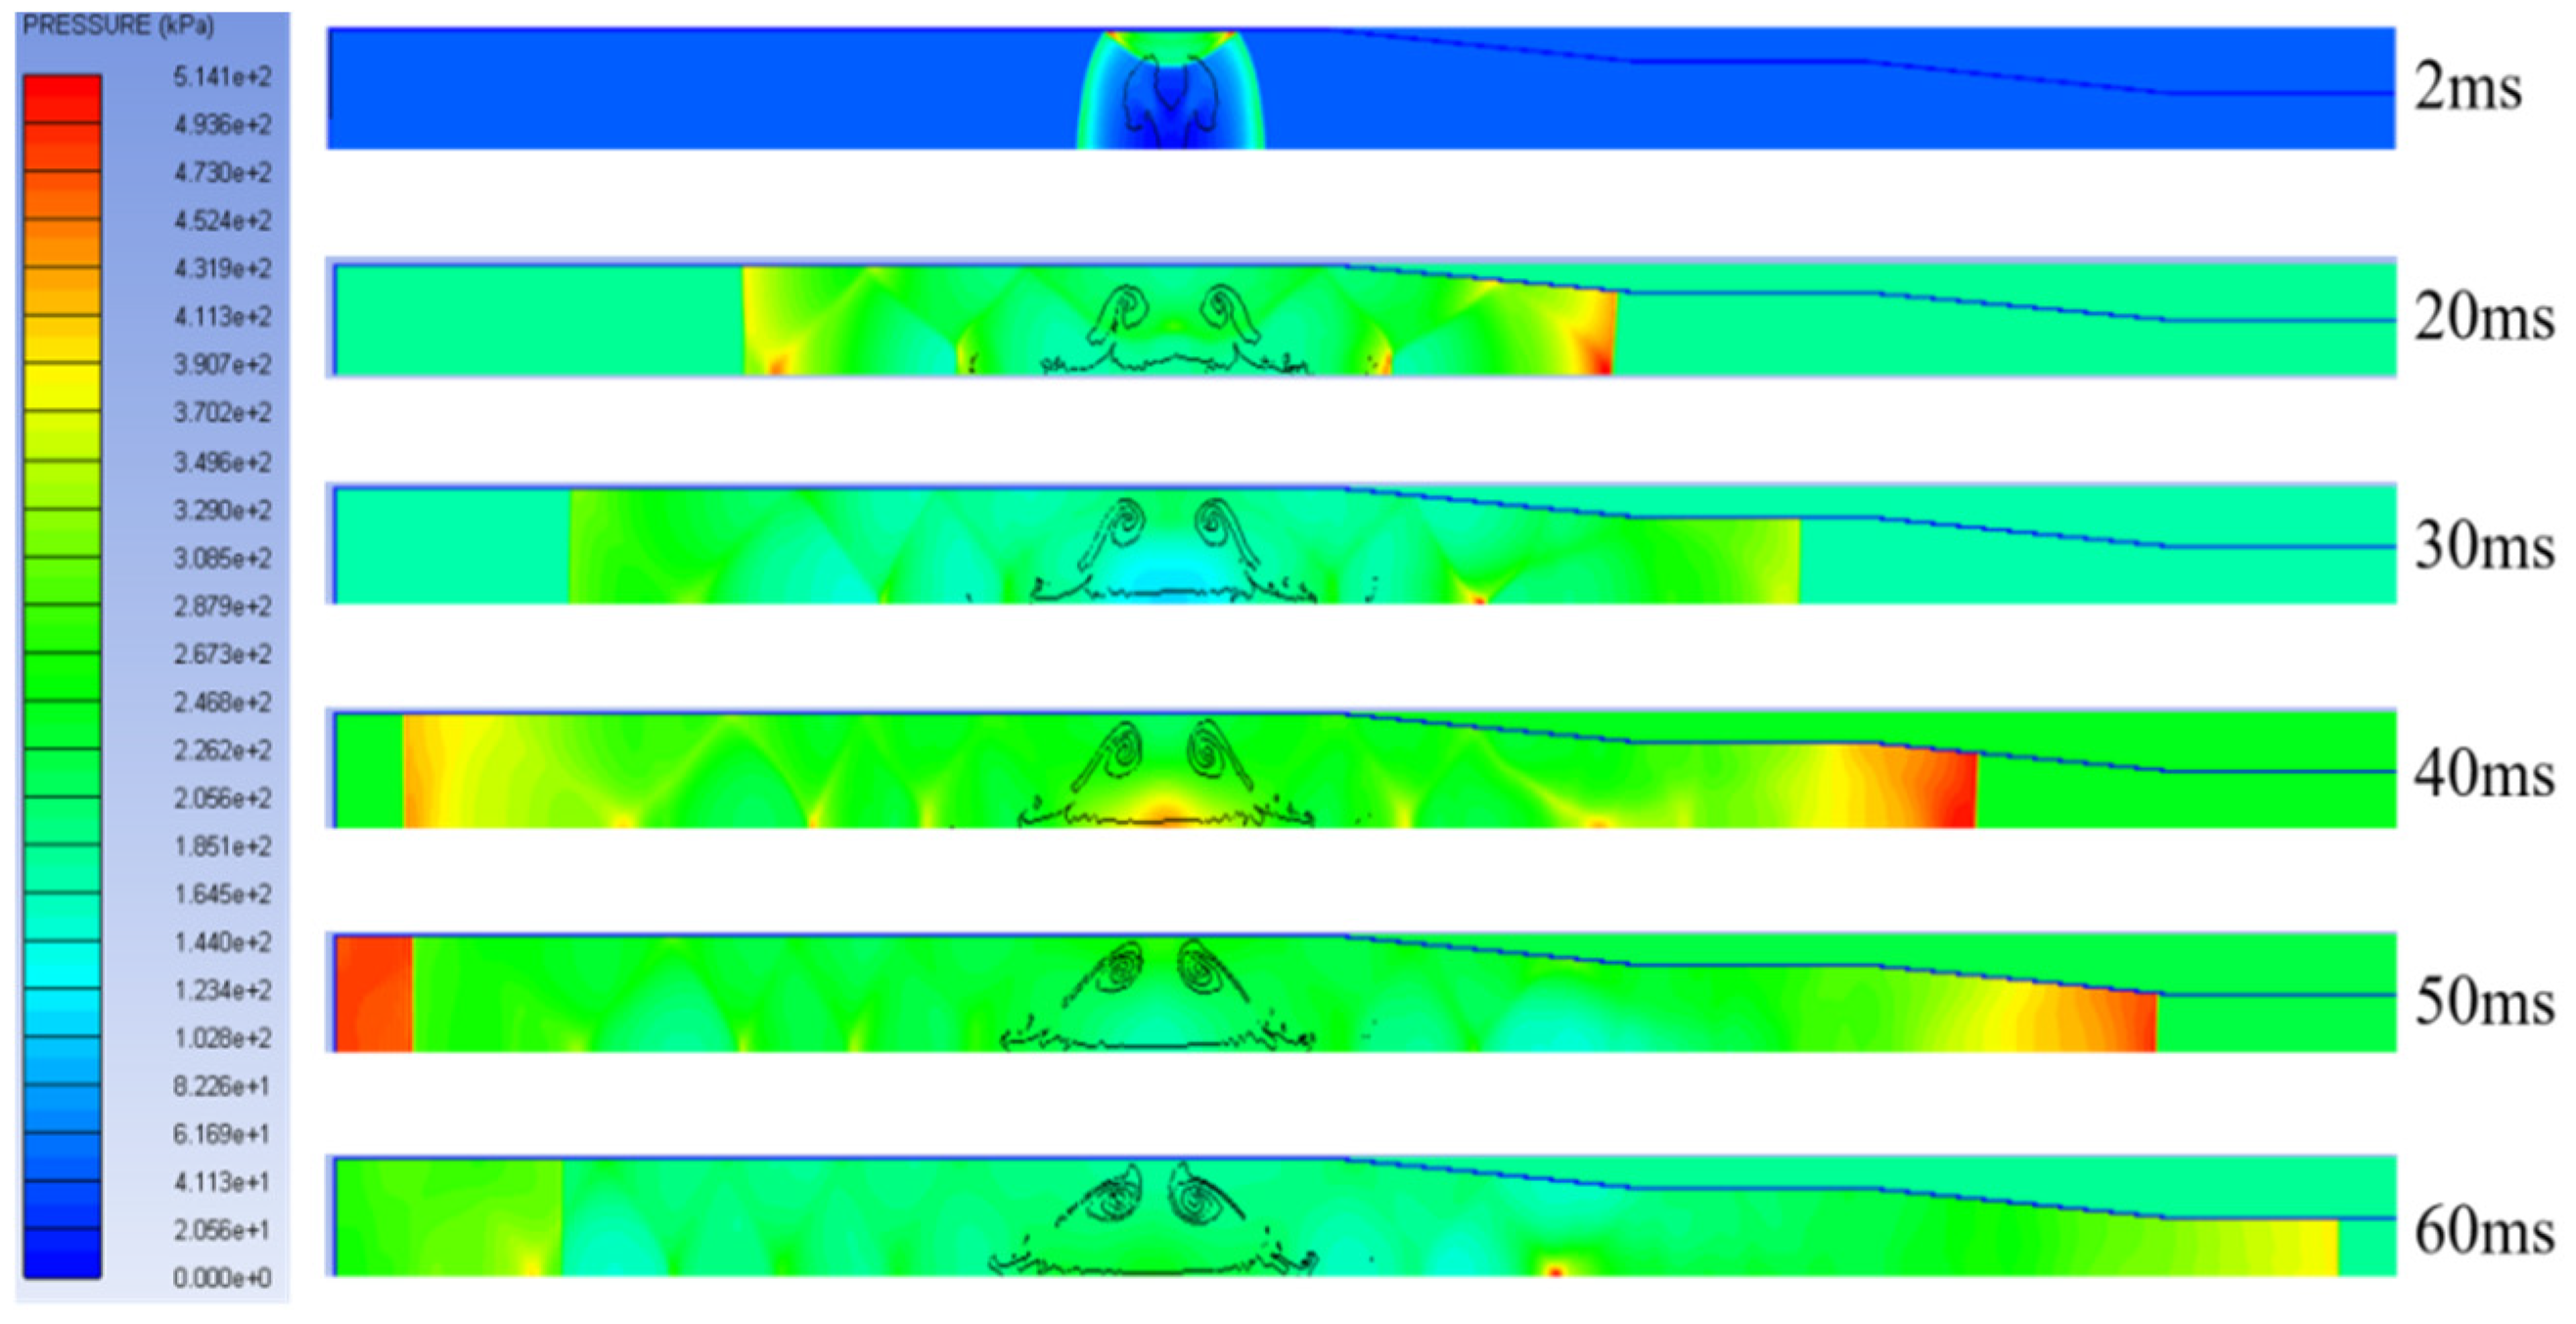
The pressure contour diagrams depicted in Figure 4, Figure 5 and Figure 6 reveal a distinct scale effect governing shock wave generation: reducing the driver section volume yields significantly higher peak overpressures at equivalent temporal instants. This phenomenon arises from the intricate wave dynamics within the confined geometry, where multiple reflections from the inner walls generate a complex flow field characterized by constructive interference between reflected and incident compression waves. As the driver volume increases, the extended propagation path delays the arrival time of reflected waves at the primary shock front, thereby attenuating the wave superposition effect and consequently diminishing the peak overpressure amplitude. While larger driver configurations produce marginally lower peak overpressures, they exhibit superior overall energy utilization efficiency by sustaining the elevated pressure state for an extended duration, thereby delivering greater total impulse despite the reduced peak intensity.
Figure 4.
Cloud diagram of volume pressure in the small blast chamber.
Figure 5.
The volume pressure cloud diagram of the blast chamber.
Figure 6.
The volume and pressure cloud diagram of the large blast chamber.
3. Test Verification
3.1. Test Preparation
This study employed a large-scale shock tube facility featuring a 4 m-diameter driving section to investigate shock wave propagation under high-pressure environments. The explosive driver utilized a linear array of three 3 kg TNT charges (9 kg total mass) positioned 4 m beneath the driving section base, with sequential initiation at 10 ms intervals. Pressure measurements were conducted at four axial locations (9, 26, 40, and 52 m from the base) to capture blast wave characteristics.
3.2. Comparison of Test Results with Simulation Results
3.2.1. Measured Curve of Shock Wave
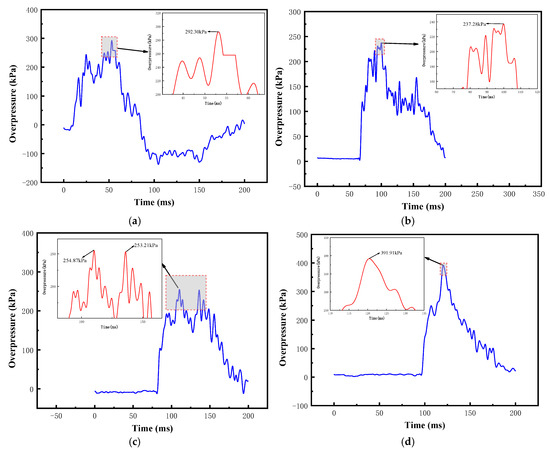
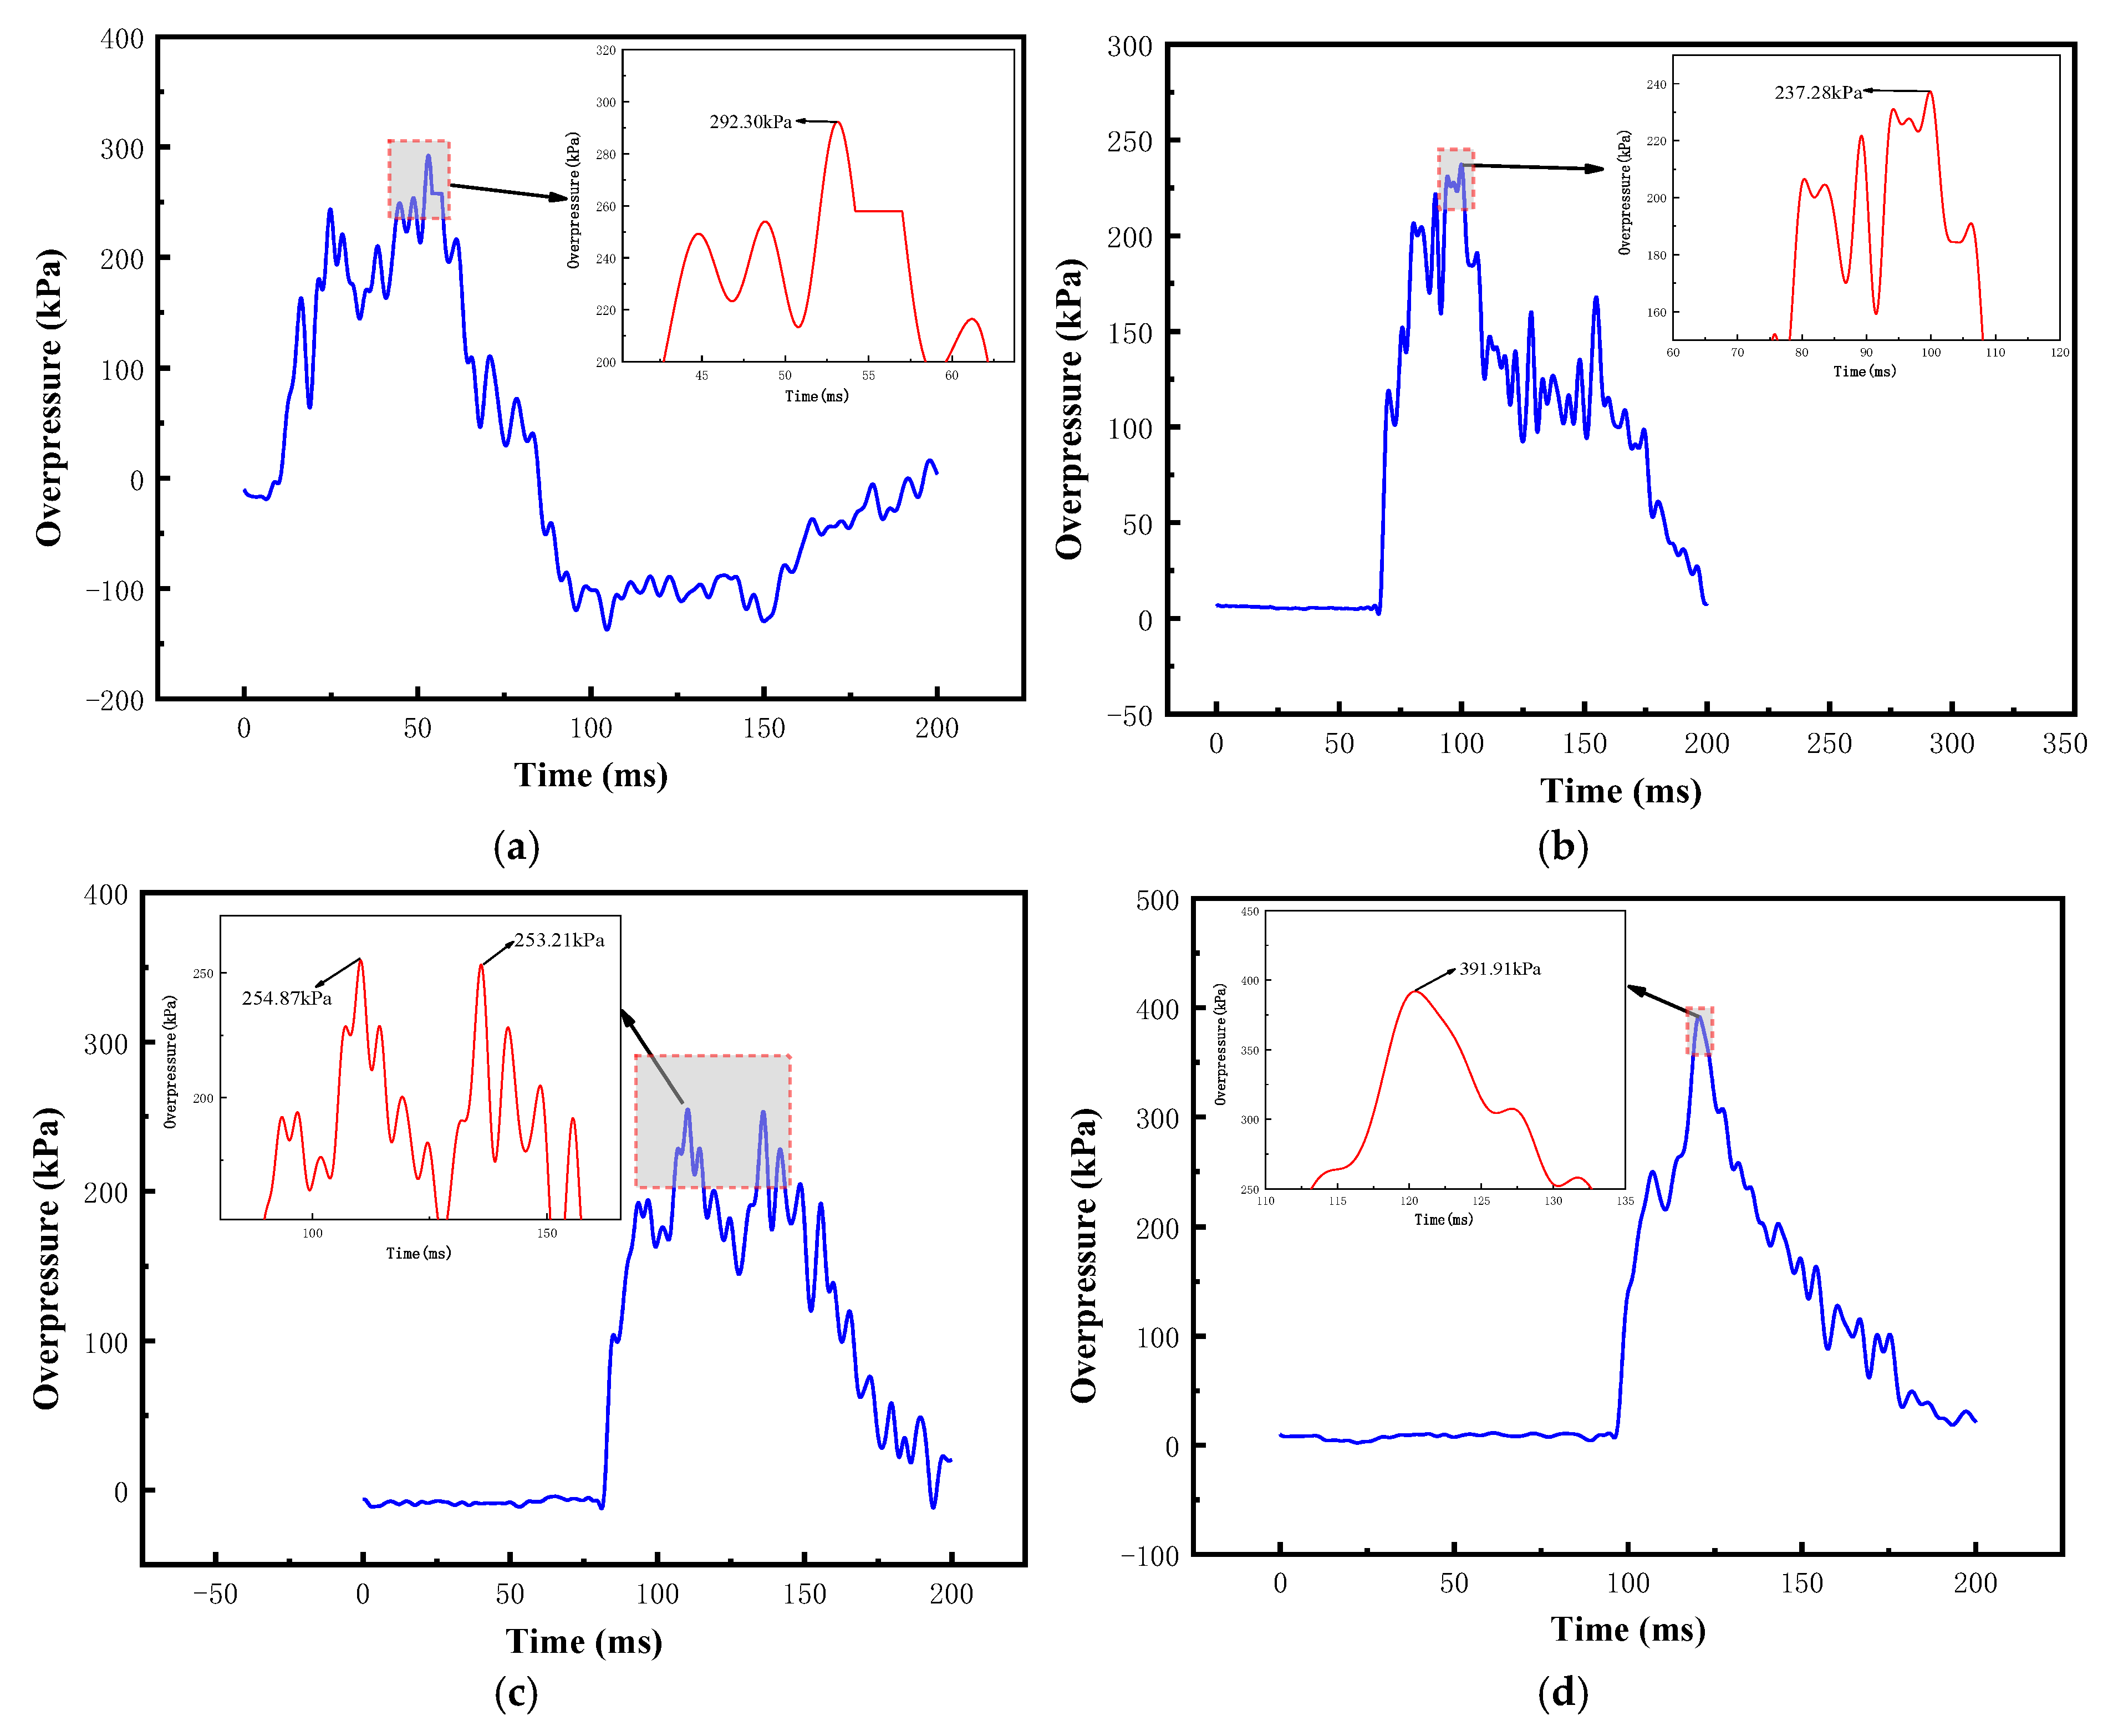
The test results (Figure 7) indicate that following detonation, the explosion products expand rapidly, compressing the surrounding air to generate a shock wave. Oscillations in the pressure signals recorded at each measurement point are observed, attributable to tube wall vibrations. Concurrently, multiple reflections from the wall surface induce a lag in the shock wave peak (resulting from spatial superposition) and produce a sawtooth-like attenuation pattern in the subsequent waveform. Delayed ignition causes the incident and reflected waves to interweave, creating a complex flow field that ultimately leads to slower decay of the overpressure peak and a significantly prolonged positive phase duration compared to free-field conditions.
Figure 7.
Time histories of shock wave overpressure at measurement points under various initial pressure conditions. (a) P1. (b) P2. (c) P3. (d) P4.
3.2.2. Result Comparison
The simulated overpressure peaks are systematically higher than the experimental measurements (Table 2), primarily due to the omission of thermal energy losses in the numerical model. Despite this discrepancy, relative errors remain within 10% and diminish with increasing propagation distance. The overall agreement demonstrates that the finite element model reliably captures shock wave propagation characteristics.
Table 2.
Comparison of Experimental and Numerical Simulation Results.
4. Conclusions
Based on the AUTODYN platform, a numerical model was established to simulate shock wave generation within the driver section. The influence of driver section volume on shock wave overpressure histories was systematically investigated. Experimental validation was conducted to verify the reliability of the numerical predictions. The principal conclusions are summarized as follows: An increased driver section volume provides adequate expansion space for detonation products, thereby delaying the chasing and reflection of the driver-driven section interface. This attenuates the attenuation effects of rarefaction waves on the positive pressure plateau. Consequently, a greater proportion of explosive chemical energy is converted into shock wave mechanical energy and specific impulse, achieving enhanced energy conversion efficiency. This mechanism offers a direct and effective approach for simulating long-duration blast loading scenarios.
Author Contributions
Conceptualization, Methodology, Investigation, Formal Analysis, Data Curation, Writing—Original Draft: F.L., Y.G. (Yonghong Gao), K.X., Y.G. (Yanpeng Guo) and S.L. Supervision, Project Administration, Writing—Review & Editing, Funding Acquisition: C.H. Visualization, Validation, Manuscript Revision: Y.Z. All authors have read and agreed to the published version of the manuscript.
Funding
This work was supported in part by Scientific and Technological Project of Henan Province (262102320201).
Institutional Review Board Statement
Not applicable.
Informed Consent Statement
Not applicable.
Data Availability Statement
The datasets used and analysed during the current study available from the corresponding author on reasonable request.
Conflicts of Interest
The authors declare no conflict of interest.
References
- Peng, Q.; Zhou, D.Y.; Wu, H.; Ma, L.L.; Fang, Q. Experimental and numerical studies on dynamic behaviors of RC slabs under long-duration near-planar explosion loadings. Int. J. Impact Eng. 2022, 160, 104085. [Google Scholar] [CrossRef]
- Yu, S.; Zhang, G.; Wu, H.; Wang, Z.; Yao, J.; Sun, Q.; Wang, M.; He, Y. Experimental study on the elastic-plastic dynamic response of shallow-buried corrugated steel-plain concrete composite structures under long-duration plane blast wave loading. Eng. Struct. 2023, 285, 115986. [Google Scholar] [CrossRef]
- Ren, H.; Huang, K.; Wu, X. Research progress of dynamic pressure damage to ground targets by air shock wave. Prot. Eng. 2021, 43, 1–9. [Google Scholar]
- Xin, K.; Liang, S.; Song, H.; Huang, K.; Zhao, Q.; Cui, C. The key technology for increasing positive duration in a blast wave simulator. Prot. Eng. 2013, 35, 9–13. [Google Scholar]
- Campbell, M.F.; Parise, T.; Tulgestke, A.M.; Spearrin, R.M.; Davidson, D.F.; Hanson, R.K. Strategies for obtaining long constant-pressure test times in shock tubes. Shock. Waves 2015, 25, 651–665. [Google Scholar] [CrossRef]
- Ismail, A.; Ezzeldin, M.; El-Dakhakhni, W.; Tait, M. Blast load simulation using conical shock tube systems. Int. J. Prot. Struct. 2020, 11, 135–158. [Google Scholar] [CrossRef]
- Shi, Y.; Yang, S.; Cui, J.; Yan, P. Method for production of long duration blast wave. J. Civ. Environ. Eng. 2023, 45, 35–43. [Google Scholar] [CrossRef]
- Liu, F.; Huang, C.Y.; Xin, K.; Gao, Y.H.; Yan, M.H.; Zhang, Y.Y.; Zhou, L.Q. Study on the propagation law of explosion shock waves in closed variable-section tube under high-pressure environment. J. Vib. Eng. Technol. 2024, 12, 7249–7264. [Google Scholar] [CrossRef]
- Shin, H.S.; Kim, S.W.; Moon, J.H.; Park, G.K. Numerical Analysis of Blast Behavior for Non-ideal Explosive ANFO in Shock-Tube Test. Int. J. Concr. Struct. Mater. 2024, 18, 31. [Google Scholar] [CrossRef]
- Li, H.; Wu, H.; Wang, Z.; Zhang, G.; Li, J.; Zhou, H.; Wang, M.; He, Y. Experimental and numerical simulation of the propagation law of shock waves in corrugated steel-lined tunnels. Process Saf. Environ. Prot. 2022, 168, 1019–1030. [Google Scholar] [CrossRef]
- Zhou, Y.; Pei, L.; Long, R.; Zhang, Q.; Liu, B.; Ren, J. Study on the evolution characteristics of pressure pulse in shock tube and a method of simulating air explosion shock wave. Acta Armamentarii 2023, 44, 3815. [Google Scholar]



Disclaimer/Publisher’s Note: The statements, opinions and data contained in all publications are solely those of the individual author(s) and contributor(s) and not of MDPI and/or the editor(s). MDPI and/or the editor(s) disclaim responsibility for any injury to people or property resulting from any ideas, methods, instructions or products referred to in the content. |
© 2026 by the authors. Licensee MDPI, Basel, Switzerland. This article is an open access article distributed under the terms and conditions of the Creative Commons Attribution (CC BY) license.