


Abstract
A biomechanical model of the flight phase in the long jump was constructed to analyze the factors influencing performance. Time-series coordinate data of key joints, obtained through AI-based human pose estimation, were incorporated into the model. For Problem 1, vertical velocity and acceleration of the joints were calculated using the dynamic parameter framework, and reference values with adaptive thresholds were applied to precisely identify take-off and landing moments. For Problem 2, joint information was used to derive arm swing amplitude, take-off angle, and joint rate of change as metrics to characterize athletes’ movement patterns and enable comparison before and after training. For Problem 3, physical and kinematic features were integrated, and Random Forest, multiple linear regression, and Recursive Feature Elimination were employed to evaluate key determinants of long jump performance and provide targeted training recommendations. The first two models achieved R2 of 0.9772 and 0.9526, respectively, indicating excellent predictive accuracy. Finally, for Problem 4, the Random Forest and regression models developed in Problem 3 were applied to predict the performance of an athlete following posture optimization training.
1. Introduction
The standing long jump is a classic track and field event. Accurately quantifying athletic performance, analyzing the underlying mechanisms of performance variation, and optimizing training strategies to improve outcomes have been researched in sports biomechanics and athletic training [1]. Advances in AI-based human pose estimation technology have provided new technical tools for the detailed analysis of the standing long jump using markerless motion capture and key joint time-series coordinates [2,3]. However, it is challenging to accurately characterize movement patterns during the flight phase, systematically evaluate the multi-dimensional factors that influence performance, and develop personalized training programs for individual athletes. Therefore, an intelligent analysis model must be developed for the standing long jump, based on AI-derived posture data, which is highly significant for the development of long jump training.
The model developed in this study enables precise identification of key movement junctures, quantification of movement characteristics, in-depth analysis of performance determinants, and prediction of post-training outcomes. To achieve this, four core problems were addressed.
The first problem was the identification of the flight phase and critical motion junctures. A mathematical framework was constructed to characterize postural changes and motion trajectories, incorporating dynamic parameters such as velocity and acceleration. This allowed accurate detection of the two essential junctures: take-off and landing. The second problem was to quantify movement characteristics and evaluate training effectiveness. Based on the identified junctures, the features of arm swing amplitude, take-off angle, and joint rate of change were extracted from joint motion data. These metrics were used as measures of performance and enabled comparison of movement quality before and after training in this study. The third problem involved analyzing the factors influencing performance. By integrating physical fitness parameters, biomechanical indicators, and posture features, the study identified key determinants of standing long jump performance. This analysis established a theoretical foundation for evidence-based training interventions. The fourth problem was personalized performance prediction and training optimization.
Using factor analysis, predictive models were constructed to estimate long jump outcomes following posture optimization, thereby supporting individualized training strategies. The model was used to solve Problems 1–4, demonstrating a comprehensive framework for biomechanical analysis, performance evaluation, and predictive training in the long jump.
2. Biomechanical Model
During the long jump, the hips and shoulders require high stability. Accordingly, the intersection of the lines connecting the left hip, right shoulder, right hip, and left shoulder is used to estimate the body’s center of gravity. Meanwhile, the ankle joint plays a critical role in determining the instants of take-off and landing. Therefore, we extracted positional data from key joints, including the hips, shoulders, and ankles.
The time derivative of positional data was calculated to quantify the rate of vertical movement of the hip and ankle. Positive values indicate upward movement and negative values indicate downward movement. This serves as a key metric for distinguishing between take-off thrust (a sudden increase in velocity) and landing impact (a transition from negative to positive velocity). Based on a video frame rate of 30 frames per second, the time interval was calculated as
The first-order numerical derivatives of position were computed to determine the ankle and hip velocities using the following equations.
Here, poss(t) denotes the position at time t, while hips(t) and ankles(t) represent the y-coordinates of the hip and ankle at t, respectively.
We quantified the movement force intensity by computing the time derivative of the velocity data. Positive values indicate upward acceleration, corresponding to the push-off phase, whereas negative values indicate downward acceleration, corresponding to landing impact. This helps identify sudden changes in motion state at critical instants. The gradient function was again used to compute the acceleration of the hip and ankle. A ground baseline was defined using the median ankle height during the initial phase as the reference for ground position. In addition, the velocity and acceleration thresholds v1 and v2 were determined from the kinematic data of the hip and ankle. These thresholds were obtained by combining the 85th percentile (representing the upper bound of typical motion) and 0.5 times the standard deviation (reflecting the degree of data dispersion).
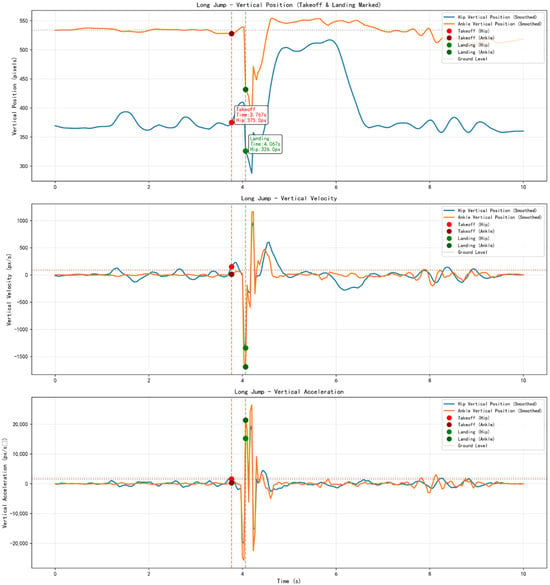
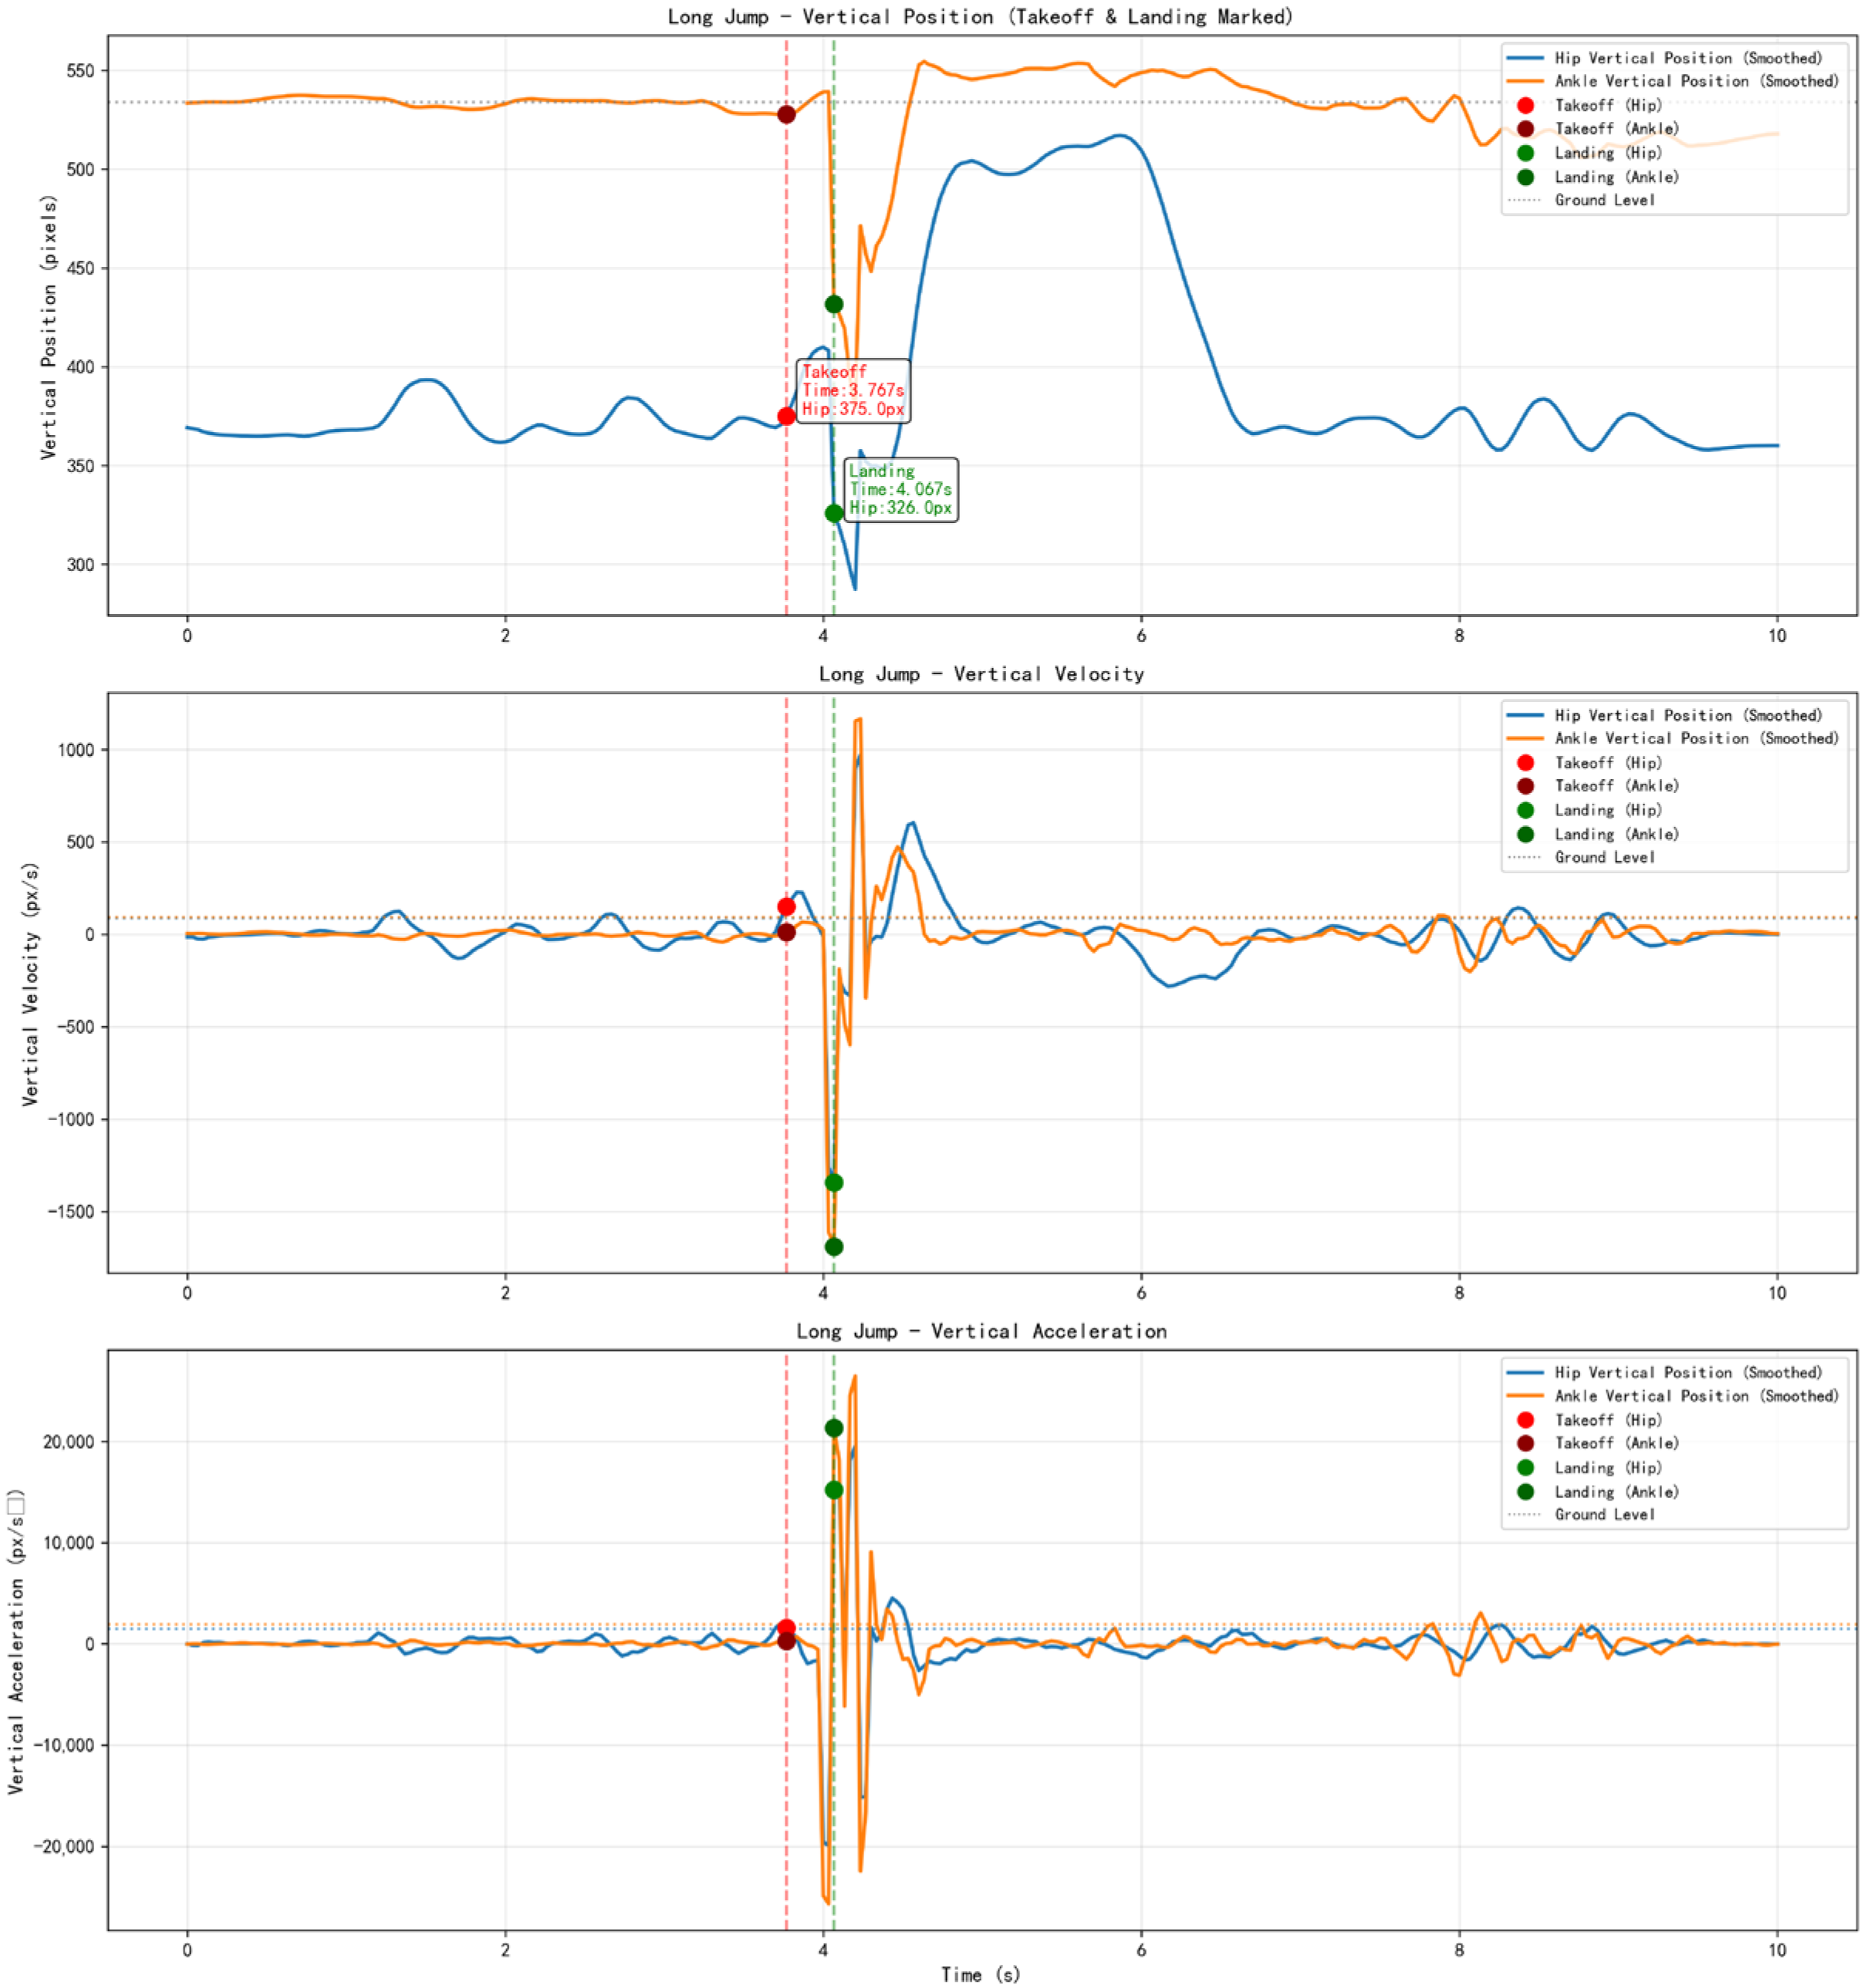
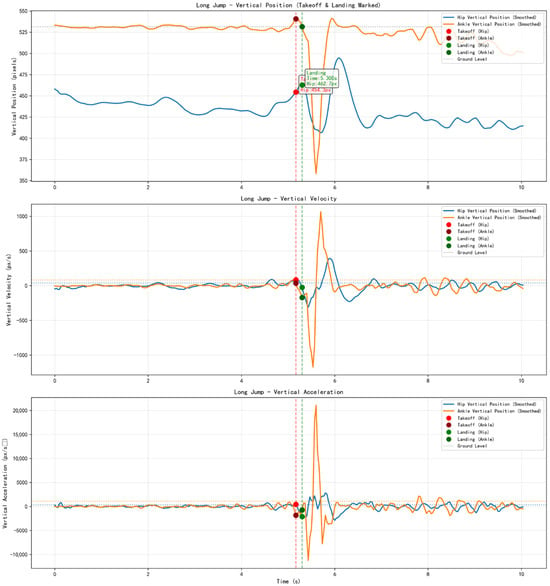
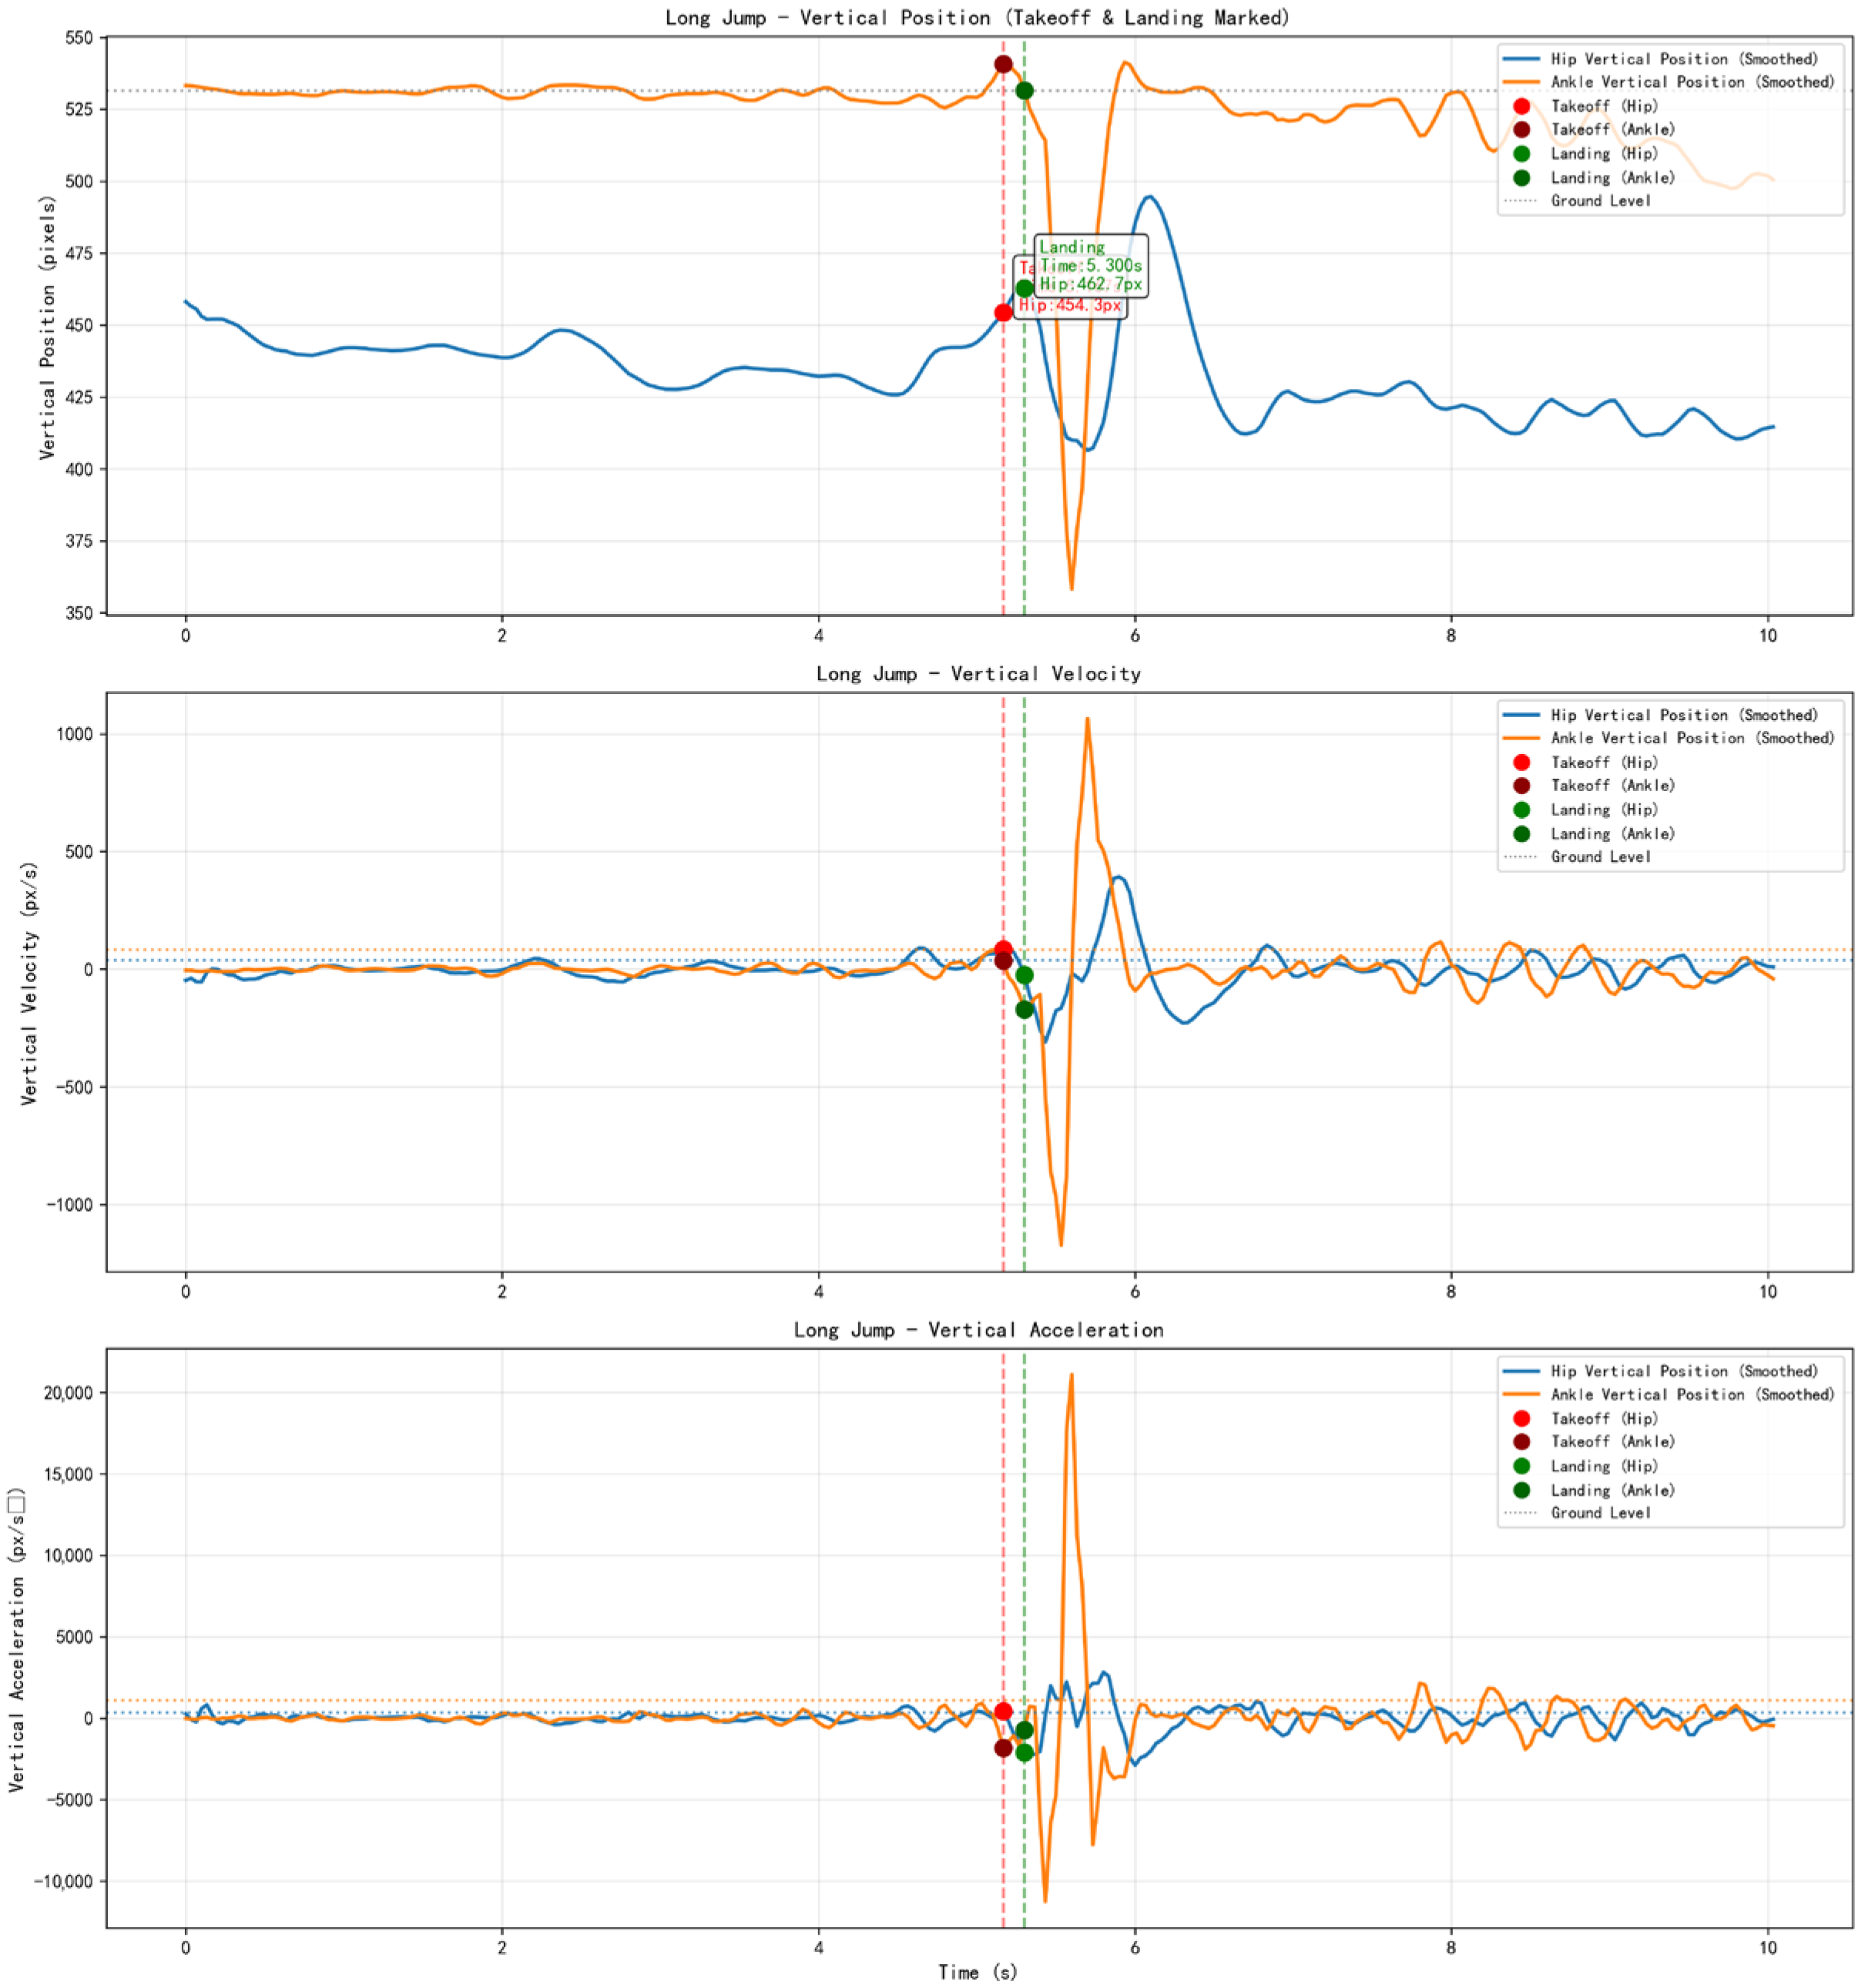
The criteria for identifying the take-off point were defined as follows: a sudden increase in vertical velocity and acceleration exceeding the corresponding thresholds, combined with an ankle height above the ground baseline [4]. A candidate frame was tested to determine if the ankle or the hip satisfied these conditions. The criteria for identifying the landing point were defined as a reversal of velocity from positive to negative at the ankle or hip, accompanied by an ankle height falling below the ground baseline. Using the model, the position, velocity, and acceleration of Athlete 1 and Athlete 2 were calculated. The results were plotted to visualize the dynamic changes in joint kinematics during the flight phase of the long jump (Figure 1 and Figure 2).
Figure 1.
Time histories of position, velocity, and acceleration of athlete 1.
Figure 2.
Time histories of position, velocity, and acceleration of athlete 2.
The take-off and landing instants of Athlete 1 were 3.867 s and 4.067 s, respectively, while those of Athlete 2 were 5.167 and 5.300 s. The corresponding flight durations were 0.200 and 0.133 s. Both values belong to the reasonable range for the standing long jump and conform to general laws of human motion and basic biomechanical principles.
3. Quantification of Long Jump Technique
We defined arm swing amplitude, take-off angle, and joint angle rate of change as key kinematic parameters for evaluating the long jump technique. Swing amplitude and take-off angle were used to determine take-off momentum, whereas the joint angle rate of change was used to determine muscular explosive power. These parameters capture the ranges and velocities of body motion, enabling a quantitative characterization of long jump movement patterns.
3.1. Arm Swing Amplitude
We defined the Euclidean distance from the left wrist to the left shoulder at take-off, and at the moments immediately before and after, as the length of the left arm swing. Similarly, we defined the Euclidean distance from the right wrist to the right shoulder as the length of the right arm swing.
First, key coordinate points were extracted. The left shoulder, right shoulder, left wrist, and right wrist of the athlete were selected as the points defining arm motion. The straight-line distance between two points P1(x1, y1) and P2(x2, y2) on a plane was calculated as
Given that arm swing length is defined as the Euclidean distance between the wrist and shoulder, the arm swing length L is calculated as
The arm swing amplitude for each frame was determined as the average of the left and right arm swing lengths. To obtain stable feature values, arm swing lengths were computed for 20 frames before take-off and 15 frames after take-off. The overall average of these values was then used as the final arm swing amplitude.
3.2. Take-Off Anglee
Since the line connecting the hip and ankle approximates the axis of force generation in the lower limbs and the projection of the center of gravity, and is strongly correlated with the direction of take-off velocity, the take-off angle was defined as the angle between this line and the horizontal plane at the moment of take-off in this study. In other words, it represents the inclination of the lower-limb force axis relative to the horizontal. To ensure accuracy, four anatomical nodes were selected: the left hip, right hip, left ankle, and right ankle. To eliminate unilateral offset errors, the midpoints of the symmetrical pairs were calculated and used as feature points: the hip midpoint (Hx,Hy), and the ankle midpoint (Ax,Ay).
Given the coordinates of (Hx,Hy) and the ankle midpoint (Ax,Ay) at the moment corresponding to the take-off frame, then, the takeoff angle is
3.3. Joint Angle Rate of Change
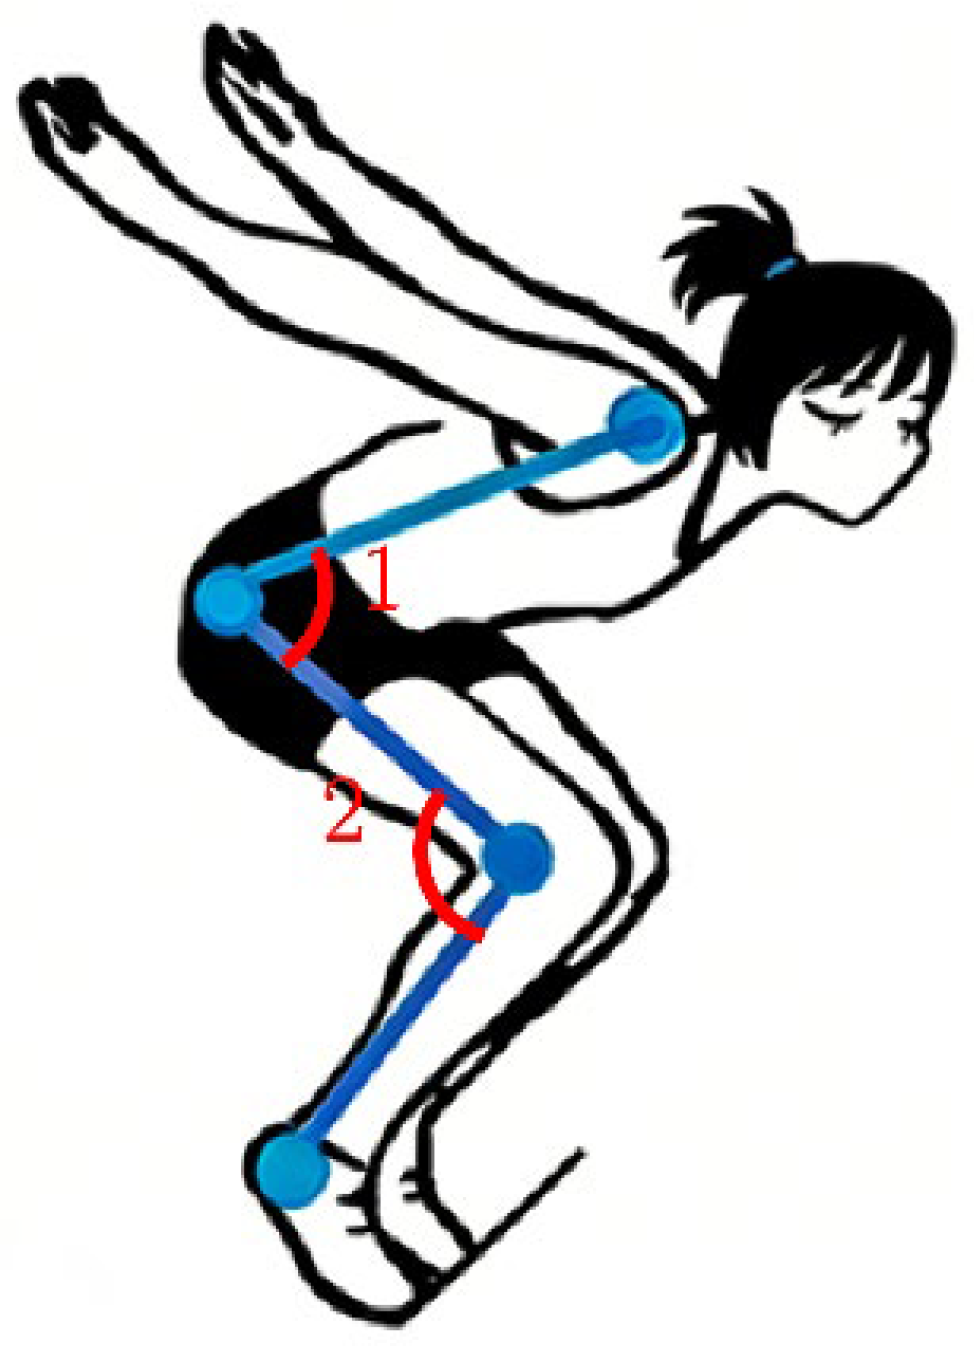
The knee angle is defined as the angle formed by the hip–knee–ankle linkage immediately before and after take-off. Similarly, the hip angle is defined as the angle formed by the shoulder–hip–knee linkage at the same instant. The rate of change is obtained by computing the time difference in joint angles.
First, key coordinate data were extracted for four major joints: shoulder, hip, knee, and ankle. Joint angles were calculated across three consecutive frames (current, previous, and the frame before that). The angular differences between adjacent frames were then computed to reflect the magnitude of angular variation. The average of the absolute values of these two differences was used to represent the joint rate for the current frame. In the analysis, the knee and hip joint rates were averaged to form the final combined feature.
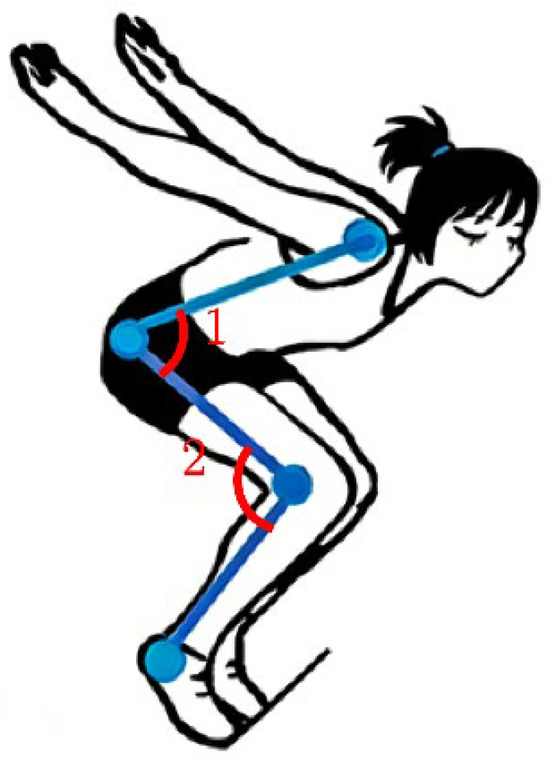
Similarly, during data processing, joint rates were calculated frame-by-frame for the 20 frames before and the 15 frames after take-off to obtain more stable feature values, and their average is ultimately taken to determine the joint angle change rate. Angle 1 represents the hip joint angle and Angle 2 represents the knee joint angle (Figure 3).
Figure 3.
Schematic diagram of take-off.
Angle calculation was conducted using vector dot products and inverse trigonometric functions. The relevant mathematical formulas are as follows. Given three points A(x1,y1), B(x2,y2) (the joint centre) and C(x3,y3), the angle θ is calculated as
For the vectors BA = (x1 − x2, y1 − y2) and BC = (x3 − x2, y3 − y2), the dot product is defined as
Let the angles of three consecutive frames be , and . Then, the change in angle between the first two frames is defined as
The change in angle between the last two frames is defined as
Table 1 presents the arm swing amplitude, take-off angle, and joint angle rate of change for Athletes 3–10 before training, while Table 2 shows the corresponding post-training results following posture adjustment.
Table 1.
Pre-training kinematic parameters of athletes 3–10 during long jump.
Table 2.
Post-training kinematic parameters of athletes 3–10 during long jump.
Overall, the athletes’ arm swing amplitude showed a significant improvement following training, with an average increase of 13.53%. Slight improvements were also observed in take-off angle and joint angle rate of change, indicating that the technical adjustments have begun to take effect. Although the magnitude of improvement varied across athletes, the overall training outcome was positive. With further personalized adjustment and consolidation, their movement form and technique are expected to become more stable and standardized.
4. Factors Affecting Long Jump Performance
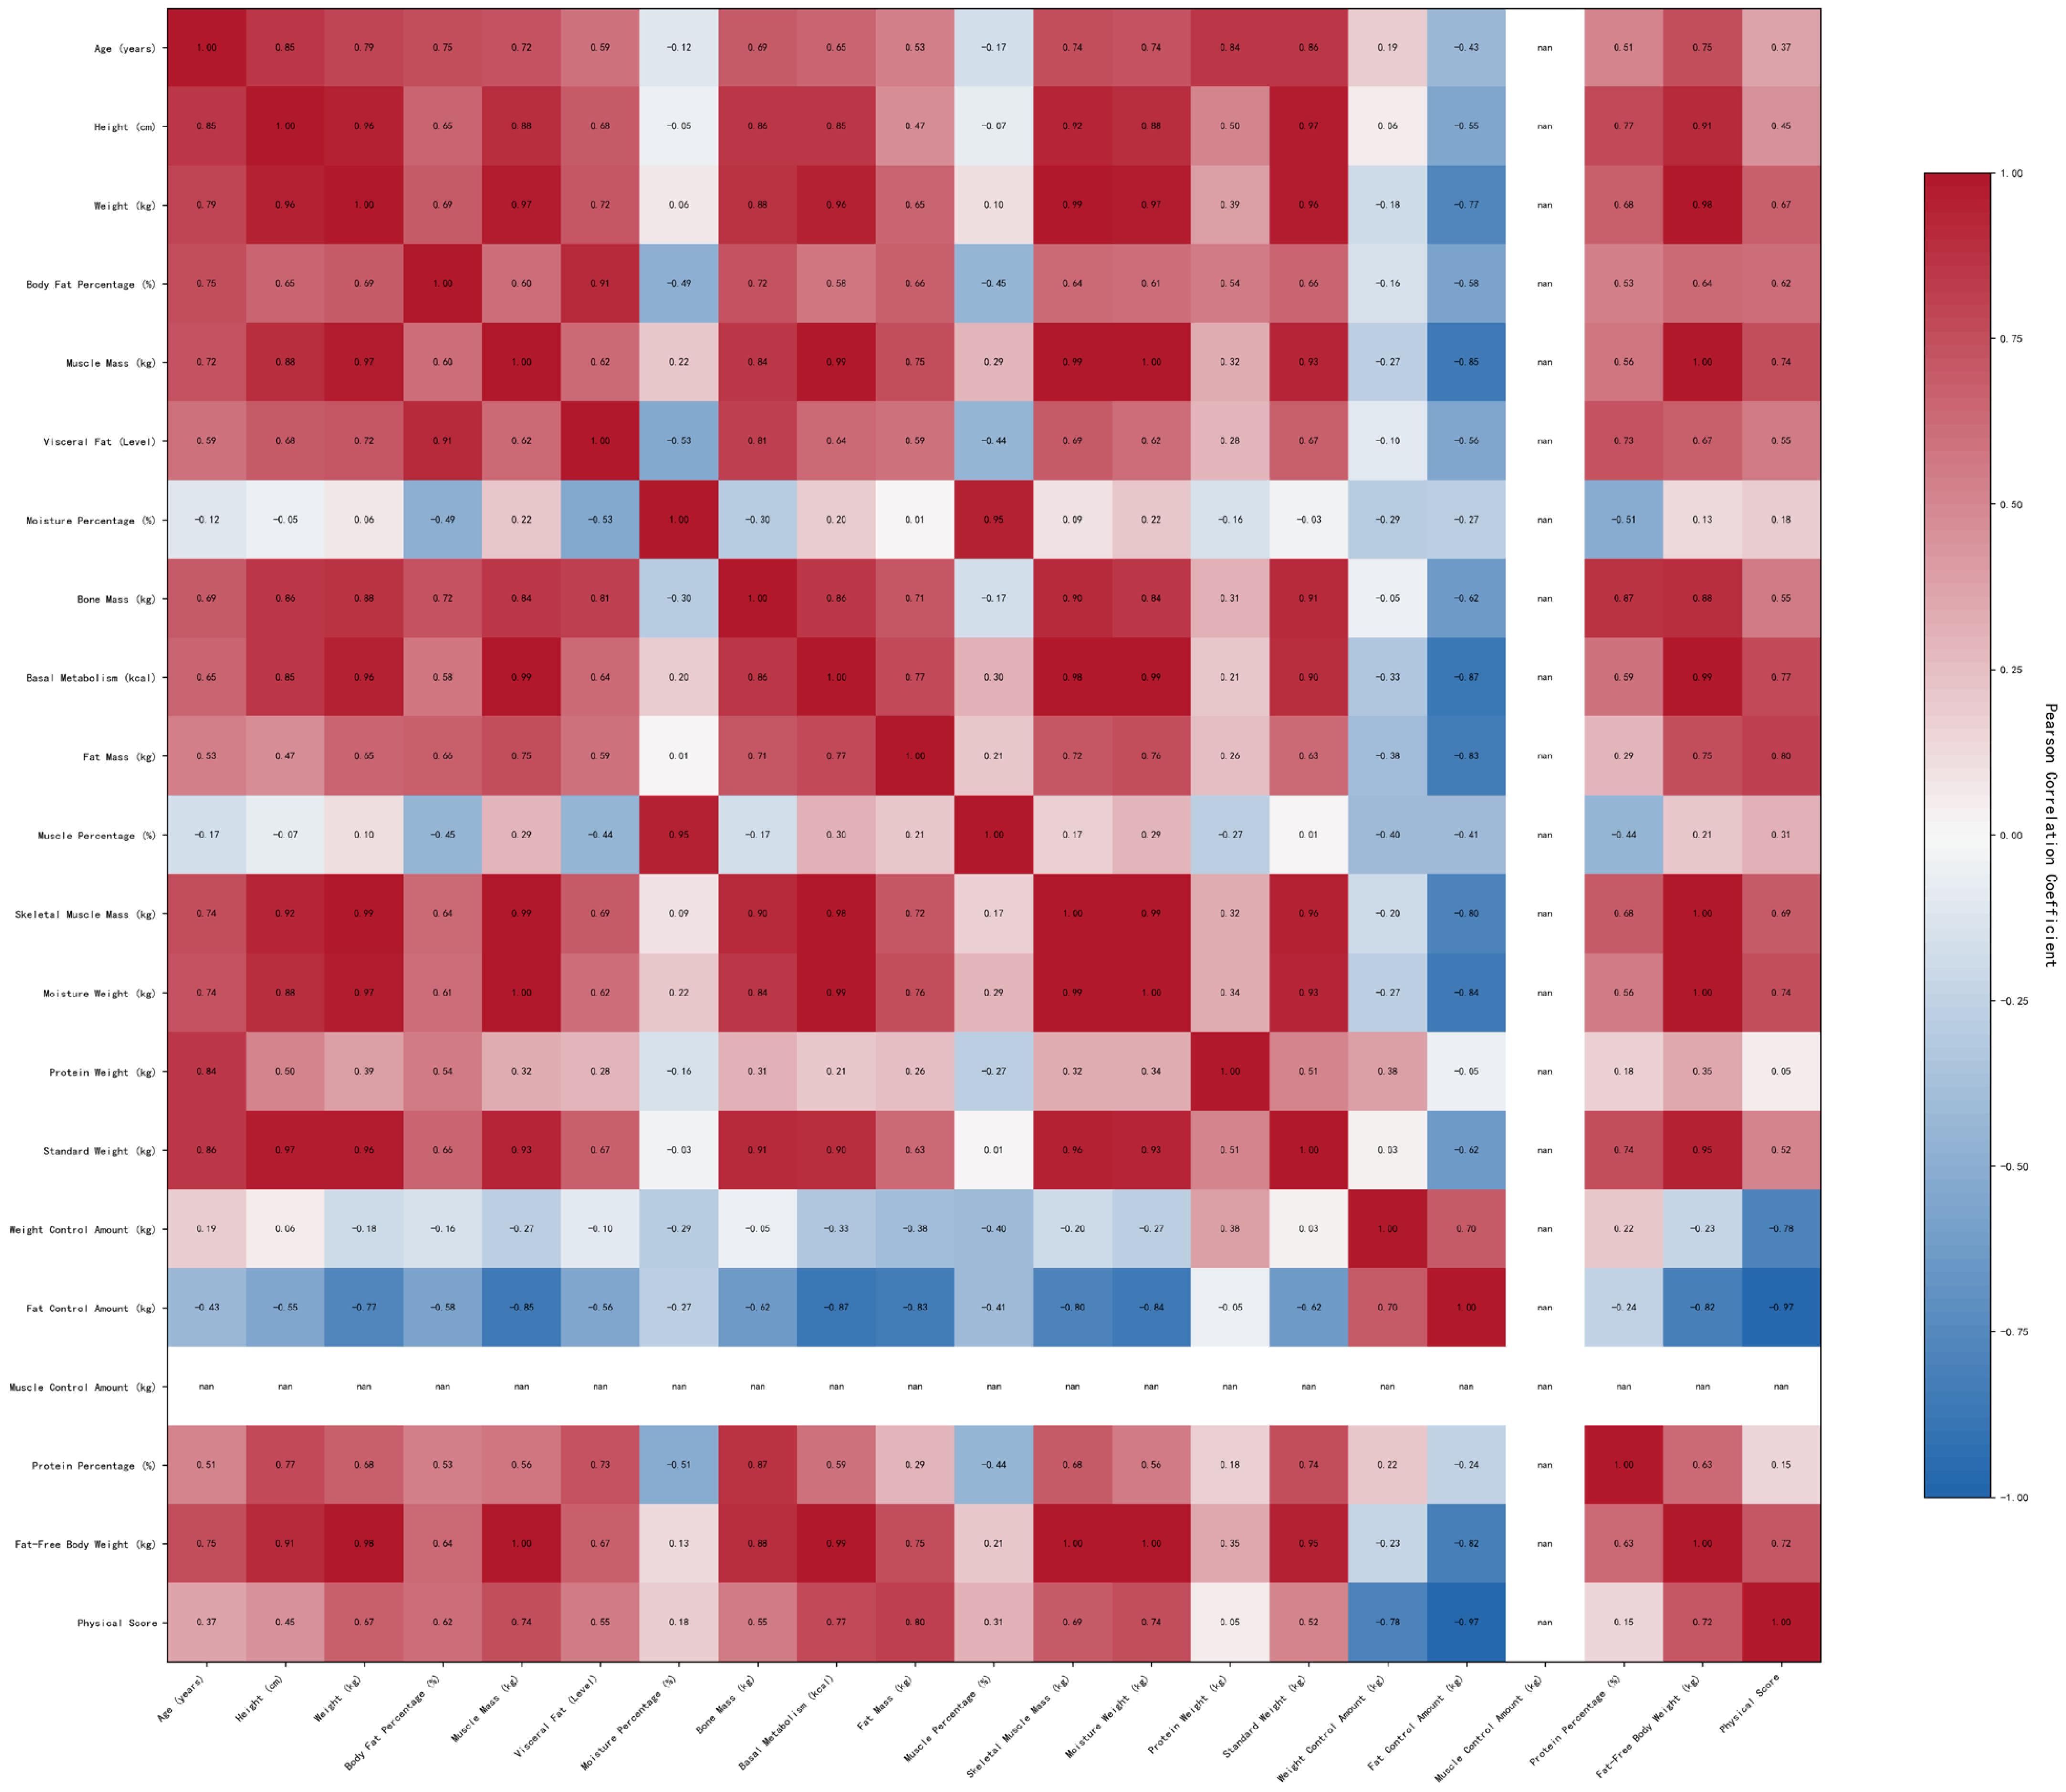
To eliminate interference from redundant information among regression analysis indicators, we first performed a Pearson correlation analysis on the 24 physical fitness indicators.
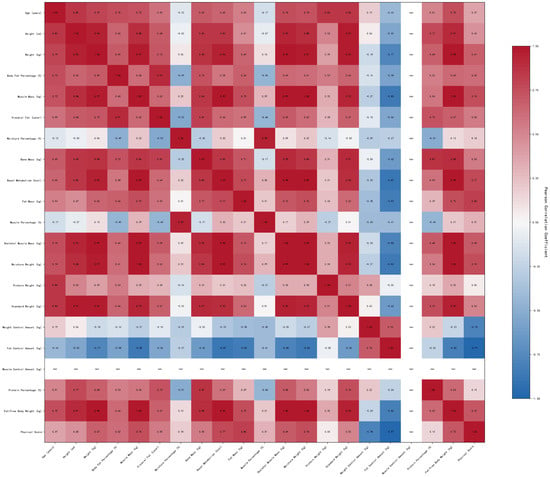
A heatmap was drawn to show the Pearson correlation coefficients of the athletes’ physical metrics (Figure 4). The results revealed multicollinearity among the metrics. Fifty pairs of metrics had correlation coefficients greater than 0.8, twenty-nine pairs exceeded 0.9, and some core metrics (such as skeletal muscle mass, lean body mass, and basal metabolic rate) had correlation coefficients approaching 1.00. This indicates a high degree of information overlap.
Figure 4.
The heatmap of athletes’ physical metrics and their correlation coefficients.
To mitigate multicollinearity, we selected mutually independent indicators from the 24 physical metrics for subsequent feature importance ranking. Standing long jump performance depends on lower-limb explosive power and full-body coordinated force production. Muscle mass provides the basis for force generation and directly determines force output level. Body fat percentage reflects excess physical burden and affects movement efficiency and flight performance. Body weight is related to the gravitational force that must be overcome during take-off and directly influences acceleration and take-off velocity. Body height affects take-off angle, aerial posture, and final jump distance through limb proportions. In addition, physiological differences arising from sex and age significantly impact strength, speed, and athletic performance [5].
These indicators are used to explain the determinants of long jump performance from multiple perspectives, including force potential, body composition, mechanical load, body morphology, and physiological characteristics. Therefore, combined with kinesiological principles, muscle mass percentage, body fat percentage, body weight, height, sex, and age were ultimately selected as the six indicators for analysis.
Given the small sample size, multiple feature dimensions, and coexisting linear and nonlinear relationships in the analysis of standing long jump determinants, we adopted three methods to ensure a comprehensive evaluation: Random Forest regression [6], multiple linear regression [7] (using standardized coefficients), and linear regression-based recursive feature elimination (RFE) [8]. This approach ensures the reliability, comprehensiveness, and interpretability of the analytical results. In the linear modelling dimension, standardised linear regression is used to quantify the linear influence of features. The core formula is as follows.
Here, represents the standardised features (with a mean of 0 and a standard deviation of 1), and denotes the standardised regression coefficient. The absolute value represents the strength of the linear influence of feature on long jump performance, eliminating dimensional differences and enabling cross-metric comparisons. In this study, the model’s coefficient of determination, R2, was found to be 0.9526, confirming the significance of the linear relationship.
In the non-linear modelling dimension, Random Forest regression was employed to capture the complex interactive relationships among features. Feature importance was calculated based on the average decrease in node impurity (Gini coefficient or mean squared error).
Here, represents the number of decision trees and denotes the reduction in node impurity attributed to the j-th feature in the t-th tree. This method is robust to outliers and does not require feature standardisation. In this study, the model achieved an R2 value of 0.9772, demonstrating its excellent fitting performance.
In the feature selection stage, RFE was used to iteratively identify core variables. First, a linear regression model was trained on the current feature set to compute the absolute weight of each feature. The feature with the smallest weight was then removed, and the process was repeated until only one feature remained. The order of feature removal (, where denotes the last retained and most important feature, was used as the importance ranking. This approach effectively reduces feature redundancy and improves result stability.
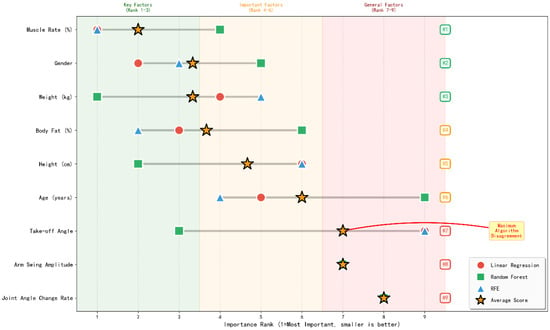
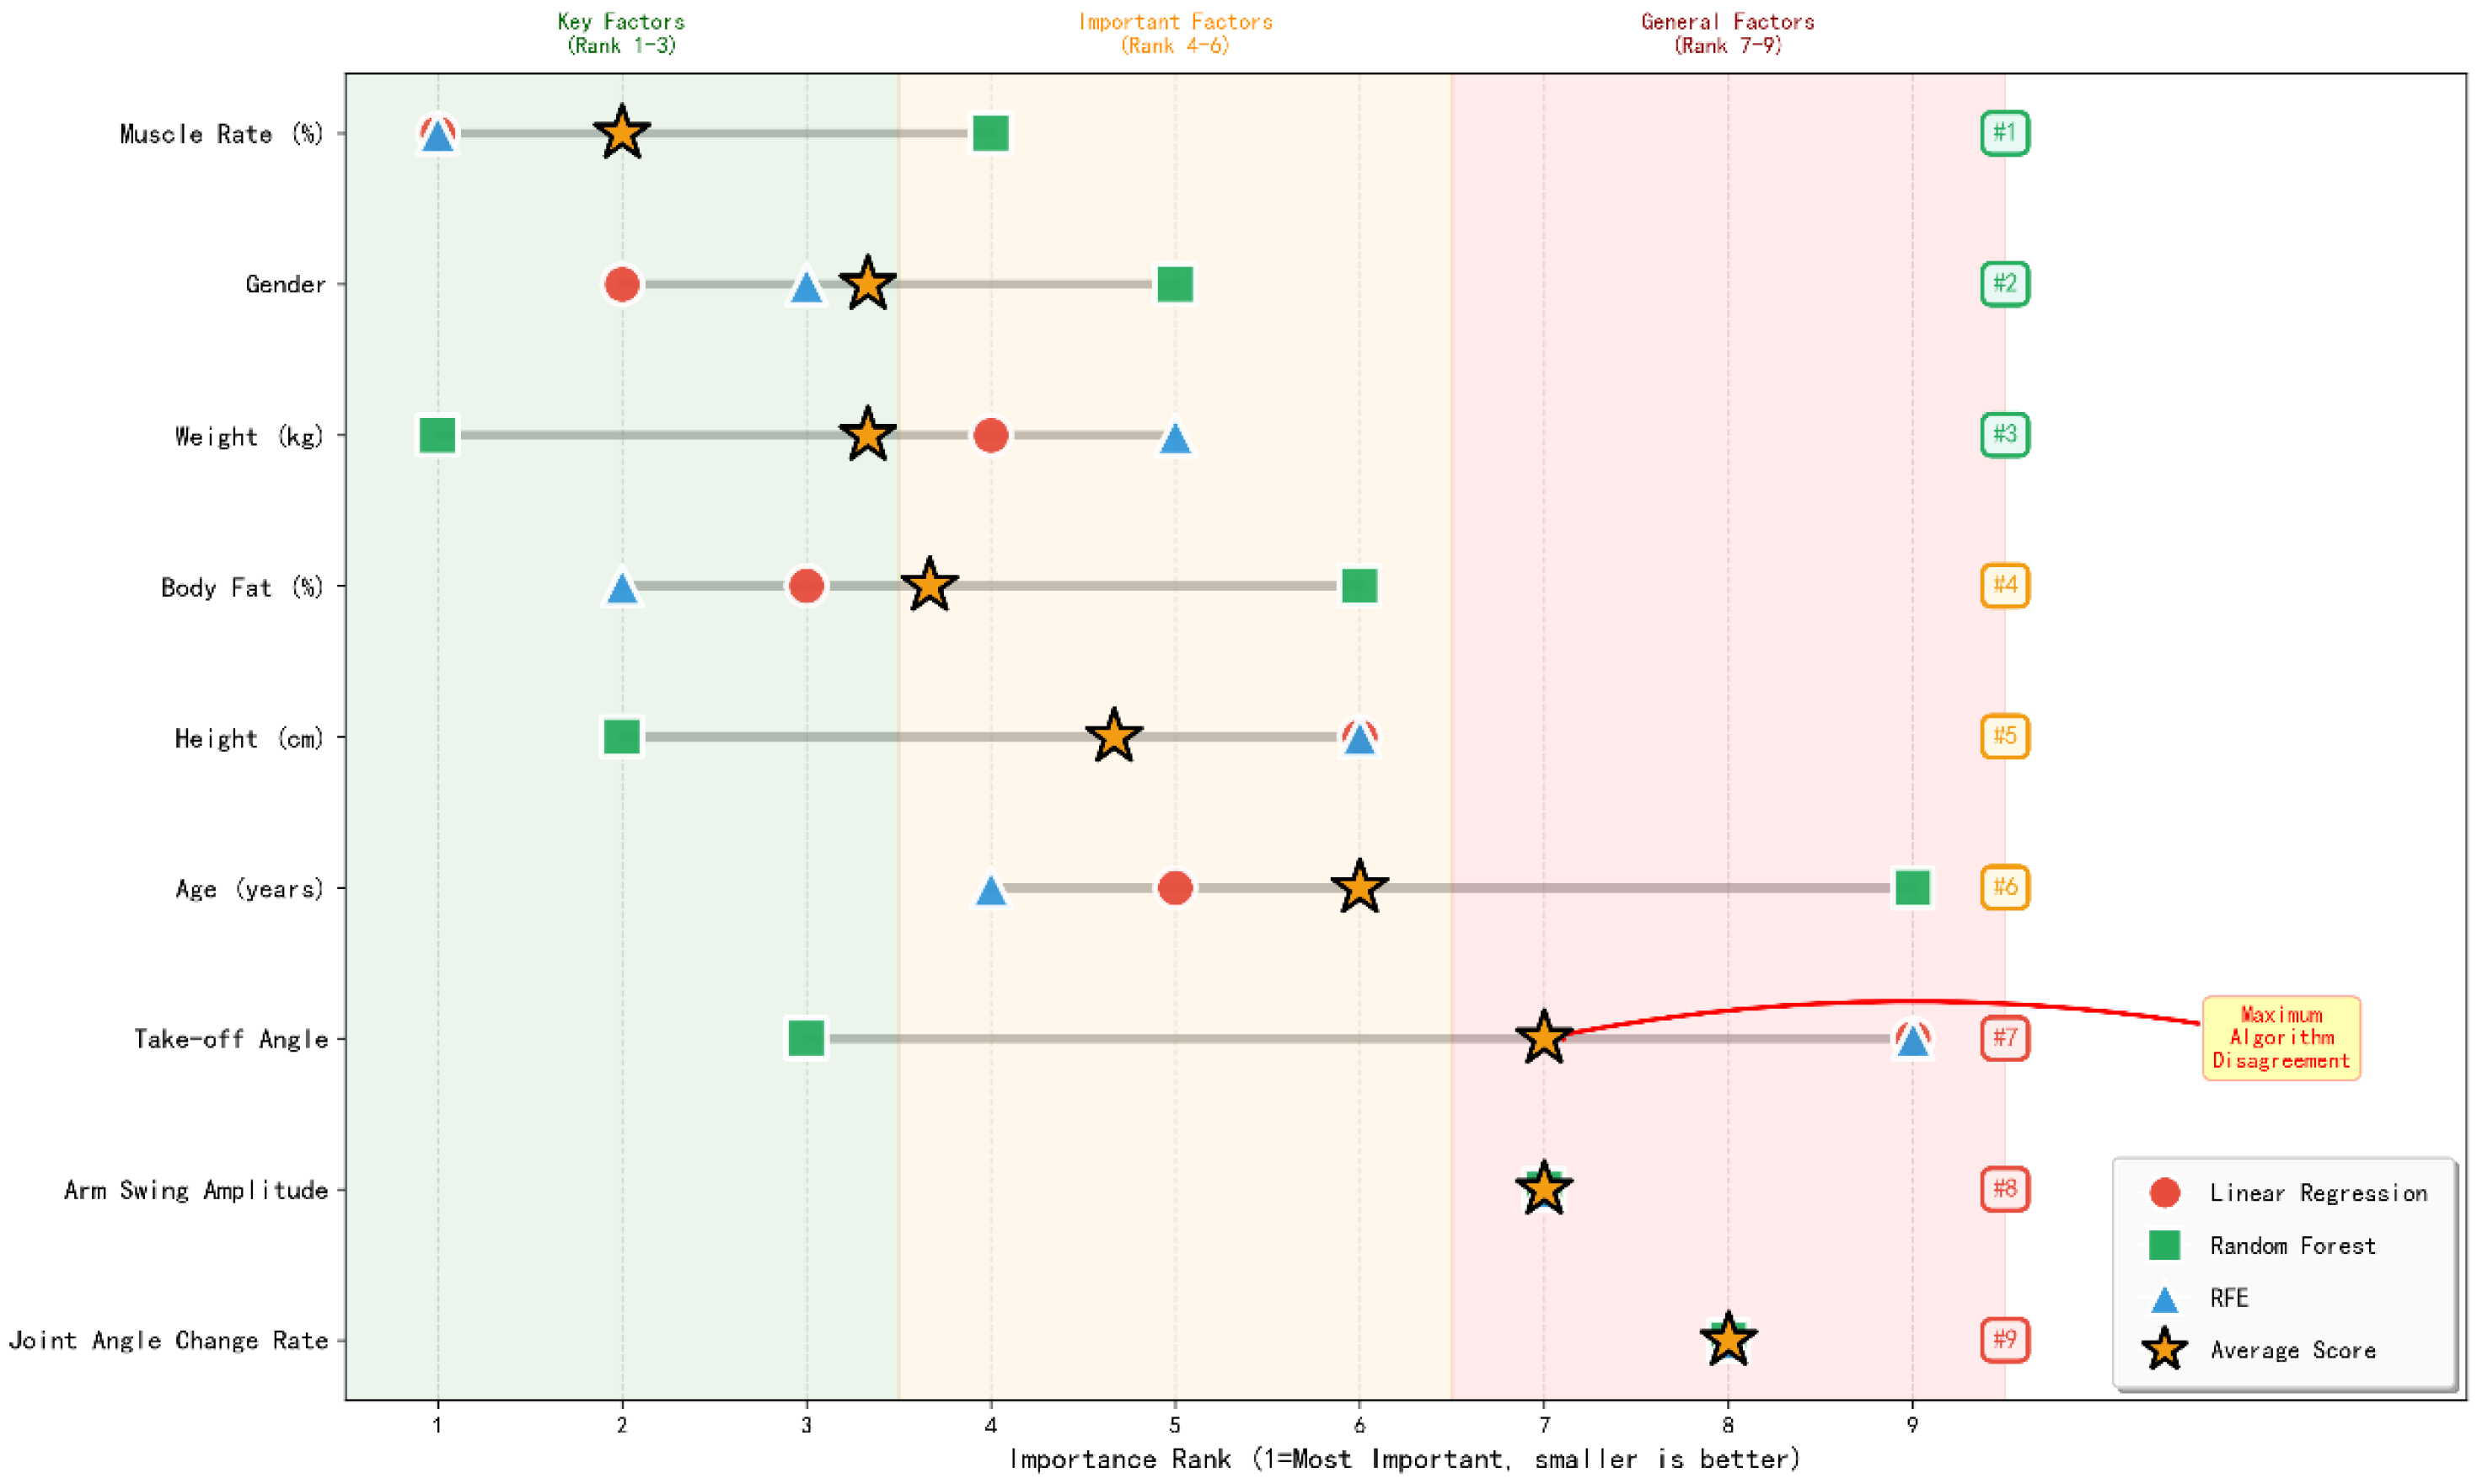
Three methods were used to rank the importance of nine indicators, comprising six physical factors and three postural-technical factors (Figure 5). In the ranking, muscle mass was found to be the most important core influencing factor, with an average rank of 1. This was followed by gender and weight, which affected long jump performance (Ranks 1–3). Body fat, height, and age affected factors (Ranks 4–6), while take-off angle, arm swing amplitude, and joint angle change rate were also influencing factors (Ranks 7–9).
Figure 5.
Importance Ranking of Nine Indicators by Three Methods.
Regarding methodological consistency, the factors showed consistent evaluations across all three methods. Muscle mass was ranked first in RFE and linear regression and fourth in the random forest model, showing the best overall performance. Sex and body weight were ranked within the top four in all three methods, confirming their stable effects on standing long jump performance. However, several indicators exhibited divergent evaluations across methods. For instance, take-off angle was ranked third in random forest, suggesting relatively high importance from a nonlinear perspective, but was ranked ninth in linear regression and RFE, representing the most pronounced methodological discrepancy. This implies a complex nonlinear relationship between take-off angle and long jump performance, which warrants further investigation combined with biomechanical principles.
Meanwhile, among the three technical indicators examined in this study, take-off angle was the most critical and influential, followed by arm swing amplitude and joint angle rate of change. Therefore, in training programs, the refinement of the take-off angle must be focused on to ensure a stable and accurate take-off. Combined with increasing arm swing amplitude and optimizing joint angular velocity, this strategy can effectively improve standing long jump performance.
5. Prediction of Standing Long Jump Performance
Finally, we analyzed the video footage of Athlete 11 along with his various physiological metrics to predict his standing long jump performance. First, we extracted time-series data of key points from the video to calculate the athlete’s arm swing amplitude, take-off angle, and joint angle rate of change (Table 3).
Table 3.
Post-training kinematic parameters of athlete 11 during long jump.
Based on the average improvements in the three postural parameters observed in Athletes 3–10 before and after training, we estimated the post-training postural parameters of Athlete 11 as follows (Table 4).
Table 4.
Pre-training kinematic parameters of athlete 11 during long jump.
Using the Random Forest and multiple linear regression models developed in Problem 3, we predicted that Athlete 11’s standing long jump distance after technical adjustments would reach 1.20 m. This outcome demonstrates that targeted technique training can yield measurable improvements in performance within a relatively short timeframe.
6. Conclusions
We developed a flight mechanics model for the standing long jump using AI-driven human pose estimation. The model presented high accuracy and practical validity in both movement analysis and performance prediction. A systematic investigation was conducted around four core issues, providing precise methodological support and a solid theoretical foundation for scientific training in the long jump.
First, kinematic parameter calculations combined with adaptive thresholding enabled accurate identification of take-off and landing moments, yielding stable and reliable results. Second, indicators, including arm swing amplitude, take-off angle, and rate of change in joint angles, were extracted to quantify movement characteristics and evaluate training outcomes. The results confirmed that posture optimization significantly enhances technical performance. Third, to address multicollinearity among physical indicators, six metrics (muscle mass percentage, body fat percentage, weight, height, gender, and age) were analyzed using Random Forest regression, linear regression, and RFE. The Random Forest and linear regression models achieved R2 values of 0.9772 and 0.9526, respectively, demonstrating excellent predictive accuracy. Muscle mass percentage emerged as the primary determinant of performance, with gender, body weight, and take-off angle also exerting significant influence. Finally, these models were applied to predict post-training performance, confirming that standardized posture training can effectively improve standing long jump outcomes.
The sample size needs to be expanded to include participants of diverse ages, sexes, and athletic levels to enhance generalizability. By incorporating additional kinematic measurement devices and field data, model accuracy can be enhanced to strengthen take-off and landing detection. Moreover, the nonlinear relationships between indicators such as take-off angle and jump performance need to be determined to refine feature selection and modeling strategies [9]. By integrating personalized training scenarios, predictive capacity can be improved for more targeted and practical recommendations. Further research with such considerations enhances the real-world applicability and training value of the developed model.
Author Contributions
Conceptualization, X.L. and T.S.; methodology, W.Z. and J.Z.; software, W.Z. and X.L.; validation, J.Z.; data curation, T.S. and X.L.; writing—original draft preparation, X.L.; writing—review and editing, X.L.; visualization, X.L.; supervision, X.L.; project administration, X.L.; funding acquisition, X.L. All authors have read and agreed to the published version of the manuscript.
Funding
This research was supported by the Fundamental Research Funds for Beijing Municipal Universities. Project number: 2025G017-KXQ.
Institutional Review Board Statement
Not applicable.
Informed Consent Statement
Not applicable.
Data Availability Statement
The data used in this paper is derived from the topic of the National Undergraduate Mathematical Contest in Modeling, and the official download URL is as follows: http://www.mcm.edu.cn/ (accessed on 2 December 2025).
Conflicts of Interest
The authors declare no conflict of interest.
References
- Gong, X.; Geng, X.; Nie, G.; Wang, T.; Zhang, J.; You, J. Normative Evaluation Method of Long Jump Action Based on Human Pose Estimation. IEEE Access 2023, 11, 125452–125459. [Google Scholar] [CrossRef] [Scilit]
- Gan, Q.; Nguyen, S.M.; El-Yacoubi, M.A.; Fenaux, E.; Clémençon, S. Human Pose Estimation Based Biomechanical Feature Extraction for Long Jumps. In 2024 16th International Conference on Human System Interaction (HSI); IEEE: New York, NY, USA, 2024; pp. 1–6. [Google Scholar]
- De Lazzari, B.; Mascia, G.; Vannozzi, G.; Camomilla, V. Estimating the Standing Long Jump Length from Smartphone Inertial Sensors through Machine Learning Algorithms. Bioengineering 2023, 10, 546. [Google Scholar] [CrossRef] [Scilit] [PubMed]
- Huang, S.; Chen, Z.; Zhang, Y. An Algorithm for Standing Long Jump Distance Measurement Based on Improved YOLOv11 and Lightweight Pose Estimation. In 2025 4th International Symposium on Computer Applications and Information Technology (ISCAIT); IEEE: New York, NY, USA, 2025; pp. 914–918. [Google Scholar]
- Gabryś, I.; Żarów, R. Dynamics of Changes in Standing Broad Jump among Girls and Boys Aged 8 to 18, as well as Women and Men aged 32–34 and 50–52 (Based on Longitudinal Studies). Asian J. Basic Sci. Res. 2026, 8, 1–13. [Google Scholar] [CrossRef] [Scilit]
- Gan, Q.; Clémençon, S.; El-Yacoubi, M.A.; Nguyen, S.M.; Fenaux, E.; Jelassi, O. Feature Impact Analysis on Top Long-Jump Performances with Quantile Random Forest and Explainable AI Techniques. arXiv 2025, arXiv:2508.09810. [Google Scholar] [CrossRef] [Scilit]
- Uzomba, G.C.; Fuchs, P.X.; Cortis, C.; Fusco, A. Sex Differences and the Relationship Between Athlete Anthropometrics and Long Jump Performance at National Elite Level. J. Funct. Morphol. Kinesiol. 2025, 10, 78. [Google Scholar] [CrossRef] [Scilit] [PubMed]
- Bulut, O.; Tan, B.; Mazzullo, E.; Syed, A. Benchmarking Variants of Recursive Feature Elimination: Insights from Predictive Tasks in Education and Healthcare. Information 2025, 16, 476. [Google Scholar] [CrossRef] [Scilit]
- Wakai, M.; Linthorne, N.P. Optimum Take-Off Angle in the Standing Long Jump. Hum. Mov. Sci. 2005, 24, 81–96. [Google Scholar] [CrossRef] [Scilit] [PubMed]

Disclaimer/Publisher’s Note: The statements, opinions and data contained in all publications are solely those of the individual author(s) and contributor(s) and not of MDPI and/or the editor(s). MDPI and/or the editor(s) disclaim responsibility for any injury to people or property resulting from any ideas, methods, instructions or products referred to in the content. |
© 2026 by the authors. Licensee MDPI, Basel, Switzerland. This article is an open access article distributed under the terms and conditions of the Creative Commons Attribution (CC BY) license.