


Abstract
Personal Protective Equipment (PPE) compliance is critical in powerline and renewable energy construction projects, yet non-adherence remains common and difficult to monitor manually. This paper presents an automated PPE detection system using an Artificial Intelligence based object detection model applied to actual site overhead drone imagery. The aim was to identify key non-compliance categories such as the non-use of hardhats, reflective vests, long pants, T-shirts and long sleeve shirts. A custom dataset was developed from aerial and ground footage and enhanced through standard annotation and augmentation techniques. Model performance was evaluated using mAP, precision, recall, and confidence-based metrics, demonstrating reliable detection across most PPE classes despite environmental and distance-related challenges. The study shows the potential of AI-assisted, drone-based monitoring to enhance safety oversight on powerline and renewable energy construction sites. It further outlines future work to improve dataset diversity, resolution, and real-time deployment.
1. Introduction
Personal Protective Equipment (PPE) constitutes a critical risk mitigation layer in powerline construction, renewable energy installations, and related electrical infrastructure projects. Workers in these environments face severe hazards, including electrical contact, falling objects, work-at-height incidents, extreme thermal conditions, dehydration, and encounters with hazardous fauna. Standard risk assessments mandate comprehensive PPE, hardhats, high-visibility vests, long-sleeved garments, and long trousers, to reduce fatal and non-fatal injuries [1].
Despite regulations and training, PPE non-compliance remains a global challenge, with adherence rarely exceeding 60% even on regulated sites [2]. Causes include physical discomfort, thermal stress, limited hazard awareness, poor fit and fatigue, which substantially increase the risk of serious injury in high-risk electrical environments. Traditional compliance monitoring relies on manual inspections, which are limited by human availability, subjective judgment, and intermittent coverage, particularly across large, distributed sites such as transmission corridors, solar farms, and wind installations.
Automated, vision-based monitoring systems have emerged to provide continuous, objective oversight. Advances in deep learning, especially convolutional neural networks (CNNs) like the YOLO (You Only Look Once) family, enable real-time detection of PPE with favorable accuracy–latency trade-offs. Prior research demonstrates YOLO’s effectiveness for detecting individual PPE items under controlled or ground-based conditions, though studies are often constrained to limited PPE classes, static viewpoints, or datasets that inadequately represent complex construction sites.
Unmanned aerial vehicles (UAVs, or drones) now offer high-resolution coverage of large and elevated areas, facilitating safe inspection of towers, overhead conductors, and solar arrays. Integrating drone imagery with Artificial Intelligence (AI)-driven object detection offers a promising approach to automated PPE compliance, though aerial perspectives introduce challenges, including small object representation, motion blur, occlusions, variable lighting, and scale variation due to altitude.
This paper presents an AI-based PPE detection framework tailored to powerline and renewable energy sites, employing a custom-trained YOLOv11-Large model to identify regulatory-relevant non-compliance, including missing hardhats, reflective vests, long sleeves, long trousers, and prohibited clothing such as T-shirts or shorts. A bespoke dataset combining drone footage, Pan-Tilt-Zoom (PTZ) cameras, and handheld devices, augmented to address class imbalance, supports model evaluation using the mean Average Precision (mAP), precision, recall, Intersection over Union (IoU), and confidence-based metrics. Particular attention is given to aerial failure modes, distance-induced resolution loss, and environmental variability.
The study’s contributions are systemic and empirical rather than architectural:
- Operationally grounded PPE detection under aerial viewpoints: Evaluation on real-world drone imagery from active construction sites addresses extreme scale variation, partial occlusion, altitude-dependent resolution loss, and harsh illumination.
- Regulation aware multi-class PPE compliance modelling: Broader, regulation-aligned detection includes hardhats, reflective vests, protective clothing, and partial compliance scenarios, enhancing real-world applicability.
- Empirical assessment of high-capacity small-object detection: YOLOv11-Large performance is systematically analyzed for aerial PPE detection, class imbalance, and distance-induced failures.
- Failure-mode and deployment-oriented analysis: False positives, negatives, and confidence-dependent behavior are linked to altitude, lighting, occlusion, and camera resolution, informing real-time deployment decisions.
Collectively, these contributions advance understanding of AI-driven PPE detection in operational, safety-critical construction contexts, bridging the gap between controlled studies and real-world deployment in high-risk electrical infrastructure projects.
2. Previous Research
Recent advances in deep learning have significantly accelerated the adoption of automated visual monitoring systems for occupational safety, particularly in the detection of Personal Protective Equipment (PPE) within construction and industrial environments. Among the various object detection frameworks proposed over the past decade, the YOLO family of models has emerged as a dominant approach due to its unified detection architecture, real-time inference capability, and favorable balance between accuracy and computational efficiency.
A comprehensive evaluation of earlier YOLO-based PPE detection systems is presented in [3], where YOLOv3, YOLOv4, and YOLOv5 architectures were assessed for safety hazard detection in construction environments. The study demonstrated a clear progression in detection accuracy across successive YOLO generations, with YOLOv5x achieving the highest mean Average Precision (mAP) of 92.44%, followed by YOLOv4 at 90.64% and YOLOv3 at 85.78%. These results confirmed the suitability of YOLO-based detectors for real-time PPE monitoring and highlighted the impact of deeper feature extraction layers and improved training strategies on detection performance.
However, the scope of the work in [3] was primarily limited to the detection of a narrow set of PPE-related objects, namely hardhats and human heads. While this focus enabled high accuracy, it does not fully capture the complexity of real-world PPE compliance requirements, where partial compliance and multiple categories of non-compliance must be simultaneously identified. Moreover, the dataset employed in [3] consisted of approximately 5000 images drawn largely from publicly available sources, which, while beneficial for benchmarking, may not adequately represent the visual variability encountered on active construction sites, particularly in outdoor electrical infrastructure environments.
The authors of [3] further enhanced detection performance through targeted image preprocessing techniques, including gamma correction via power-law transformation and resolution scaling. These steps improved visual clarity and contributed to robust model performance under varying illumination conditions. Nevertheless, the reliance on ground-based imagery and relatively controlled viewpoints limits the direct applicability of the reported results to aerial monitoring scenarios, where object scale, perspective distortion, and occlusion present additional challenges.
More recent developments in YOLO architectures are examined in [4] which introduced an anchor-free YOLOv8-based convolutional neural network for PPE detection. The anchor-free formulation reduced model complexity and improved training efficiency while maintaining strong detection accuracy. The reported precision–confidence performance of 0.95 indicates effective classification of PPE and safety-related objects, underscoring the benefits of architectural simplification and improved usability through modern training interfaces.
Despite these advances, the study in [4], similar to much of the existing PPE detection literature, primarily evaluated performance under close-range or ground-level camera perspectives. Such configurations differ substantially from drone-based inspection scenarios, where PPE items often occupy a very small fraction of the image and are subject to altitude-dependent resolution loss, motion-induced blur, and harsh lighting variations. Furthermore, many existing studies do not explicitly address dataset imbalance or the scarcity of non-compliance examples, which are common challenges in real operational environments where safety rules are generally enforced.
In contrast to the aforementioned studies, the present work focuses on PPE detection within powerline and renewable energy construction contexts using aerial imagery captured from drones operating over active sites. While leveraging the foundational strengths of YOLO-based detectors demonstrated in [3,4], this study extends prior research by addressing a broader set of PPE compliance categories and by evaluating detector performance under realistic aerial viewpoints and environmental constraints. This emphasis on operational conditions complements existing literature and provides additional insight into the practical deployment of AI-based PPE monitoring systems in large-scale electrical infrastructure projects.
3. Investigation Methodology
Due to the limited availability of certain PPE categories, such as T-shirts and shorts, the training dataset was compiled using imagery captured with an off-the-shelf pan-tilt-zoom (PTZ) camera, a cellphone camera, and a drone camera. To supplement site-specific data, additional images were sourced from online datasets available through an AI pre- and post-processing tool. All collected footage and images were imported into this tool for preprocessing and annotation. The initial dataset consisted of 2962 images and was expanded to 7430 images through data augmentation. The footage included workers climbing structures, installing conductors, working on solar panels adjacent to distribution lines, and handling equipment. Environmental variability was naturally introduced through differences in time of day, weather conditions, and viewing angles, providing representative background characteristics.
Image annotation was performed using a non-commercial, open-format tool capable of generating YOLO-compatible bounding-box labels. All images were manually annotated by trained personnel according to a predefined class schema, including no hardhat, no safety vest, long sleeves without reflective vests, T-shirts, and shorts. A quality-control step verified consistency in bounding boxes, class definitions, and annotation boundaries, particularly in response to the small-object challenges inherent in aerial imagery. Each PPE class was assigned a distinct color to ensure clear visual differentiation.
To mitigate class imbalance, standard data augmentation techniques were applied, including 90° rotations (clockwise and counter-clockwise), horizontal and vertical flipping, bounding-box rotations between −16° and +16°, and shear transformations of ±10° in both horizontal and vertical directions. Additional augmentations included brightness adjustments between −15% and +15% and the introduction of noise affecting up to 0.1% of image pixels. These transformations simulate real-world variations in drone viewing angles, lighting conditions, motion-induced blur, dust, and camera-induced image degradation, thereby improving model robustness during inference. Collectively, these augmentations reduce overfitting, enhance generalization, and improve detection performance in operational environments.
The YOLOv11-Large configuration was selected for its enhanced feature extraction depth and suitability for detecting small PPE objects from elevated viewpoints. Model training was conducted on a Dell PowerEdge T430 server over 100 epochs using an input image size of 640 × 640 pixels, a learning rate of 0.01, a batch size of 16, an auto-selected optimizer, and a weight decay of 0.0005. Although training at a higher resolution of 1280 × 1280 pixels could improve long-range PPE detection, it would significantly increase computational and storage requirements and is therefore reserved for a subsequent phase of the study. No confidence threshold was applied during this training stage, and additional parameter tuning is planned to further enhance model performance.
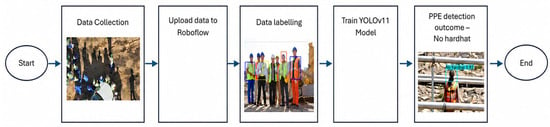
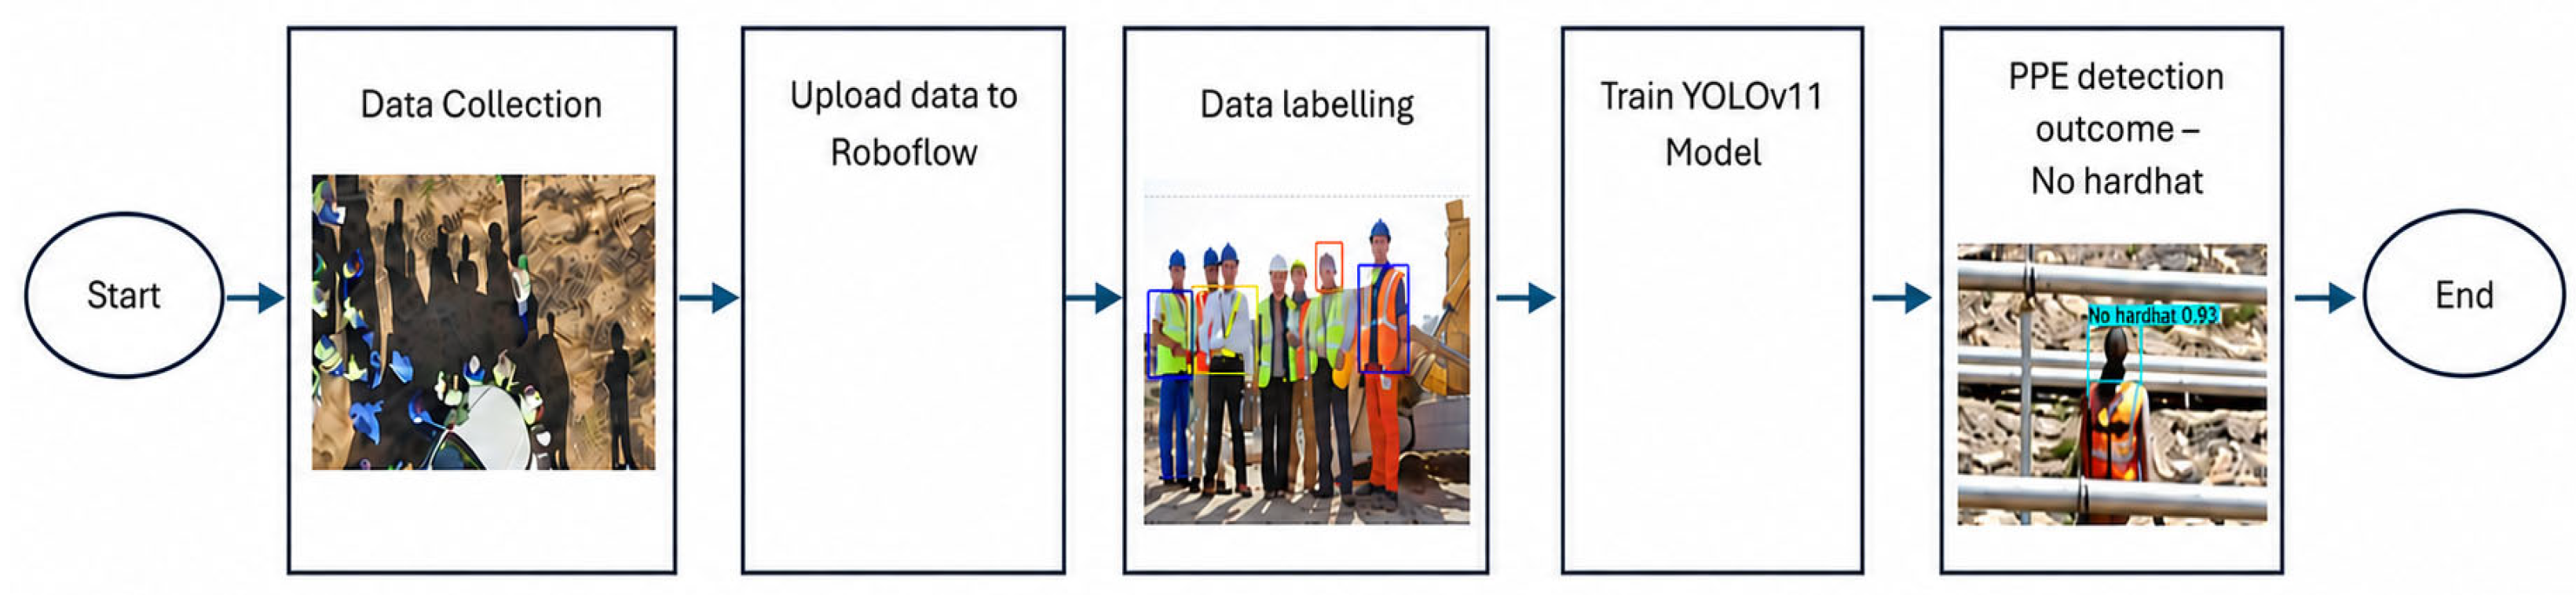
Figure 1 illustrates the overall PPE Detection Architecture System. The process begins with data collection followed by uploading the data into AI pre- and post-processing tool. Afterwards, the dataset is trained using the YOLOv11l model, and the final detection results are generated during inference. Proper file naming is required for successful inference.
Figure 1.
PPE Detection Architecture System.
Model Performance Analysis
To evaluate the performance of the YOLOv11 model for PPE detection, mAP metric was employed. mAP is a widely used evaluation metric in object detection that assesses the model’s ability to both accurately localize and correctly classify PPE items within images.
The evaluation is based on precision and recall, which are defined as follows:
Precision = True Positives (TP)/(True Positives + False Positives)
Precision measures the proportion of correctly detected PPE items among all detections. True Positives (TP) represent the number of correctly detected PPE instances, while False Positives (FP) refer to instances where the model incorrectly detects PPE when none is present.
Recall = True Positives (TP)/(True Positives + False Negatives)
Recall, also known as the true positive rate or sensitivity, measures the model’s ability to detect all relevant PPE instances. False Negatives (FN) are the number of actual PPE instances that the model fails to detect. True Negatives (TN) represent instances where the model correctly predicts the absence of PPE.
The mAP score is computed by averaging the precision values across different recall levels and across all PPE classes, providing an overall measure of the model’s detection performance.
In addition to precision and recall, IoU is used to determine whether a predicted bounding box is considered a correct detection. IoU measures the degree of overlap between the predicted bounding box and the ground truth bounding box and is defined as:
IoU = Area of Overlap/Area of Union
A detection is classified as a True Positive if the IoU between the predicted and ground truth bounding boxes exceeds a predefined threshold usually 0.5. Otherwise, it is considered a False Positive. This ensures that the model is not only detecting PPE items but also localizing them accurately. These evaluation metrics are crucial for understanding the model’s detection capability, as well as identifying its strengths and limitations. Such insights are essential for guiding improvements in overall model performance. Achieving high detection accuracy depends not only on the model architecture, but also on the quality and correctness of the entire development pipeline. This includes careful data collection, accurate image annotation, and the appropriate selection of training parameters. Errors or inconsistencies at any of these stages can negatively impact the final performance, highlighting the importance of a well-structured and reliable training process.
In this study, the PPE detection model was trained on a custom dataset with a 90% training, 7% validation, and 3% test split. While this division allowed initial model development, it is not optimal for robust evaluation or efficient training. In future stages, a more balanced split, such as 70% for training, 20% for validation, and 10% for testing, will be adopted. This distribution ensures that a sufficient portion of the data is reserved for validation and testing, which is critical for assessing the model’s generalization, preventing overfitting, and accurately measuring performance on unseen data.
It is also important to ensure that the dataset is balanced, so that no class is over-represented or under-represented. An imbalanced distribution can negatively impact the model’s performance, leading to biased predictions and reduced accuracy for underrepresented classes.
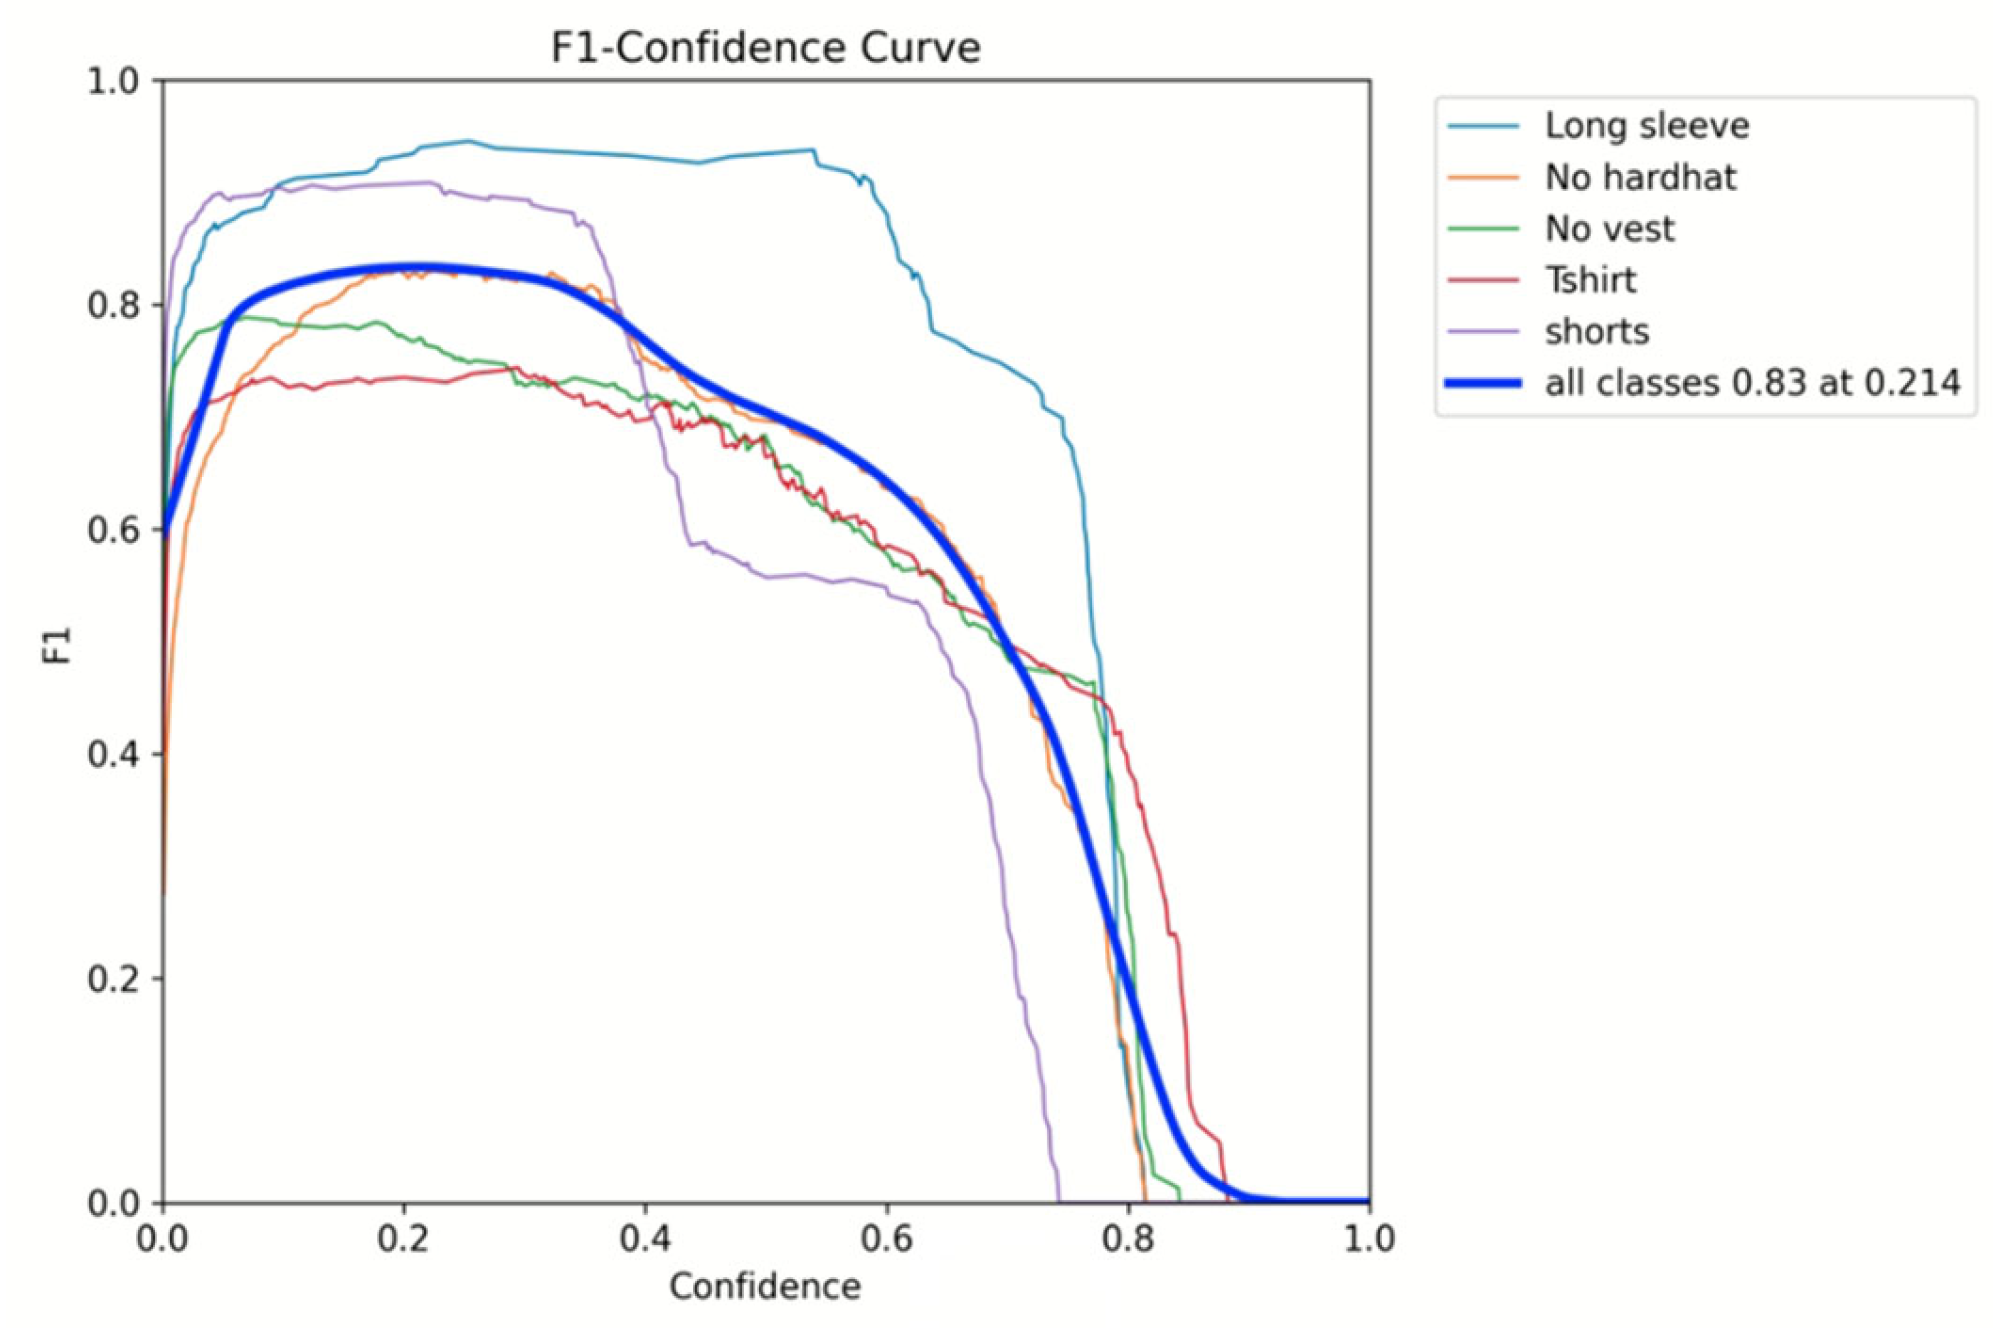
Another important metric for evaluating the model’s performance is the F1–confidence curve. This metric helps identify the optimal confidence threshold by balancing false positives and false negatives to achieve the best overall detection performance. By analyzing this curve, an appropriate threshold can be selected that maximizes the F1-score, ensuring an effective trade-off between precision and recall.
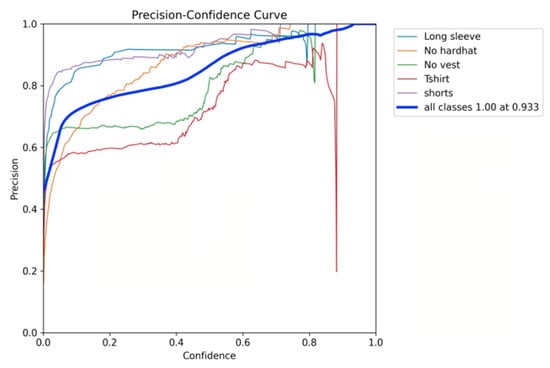
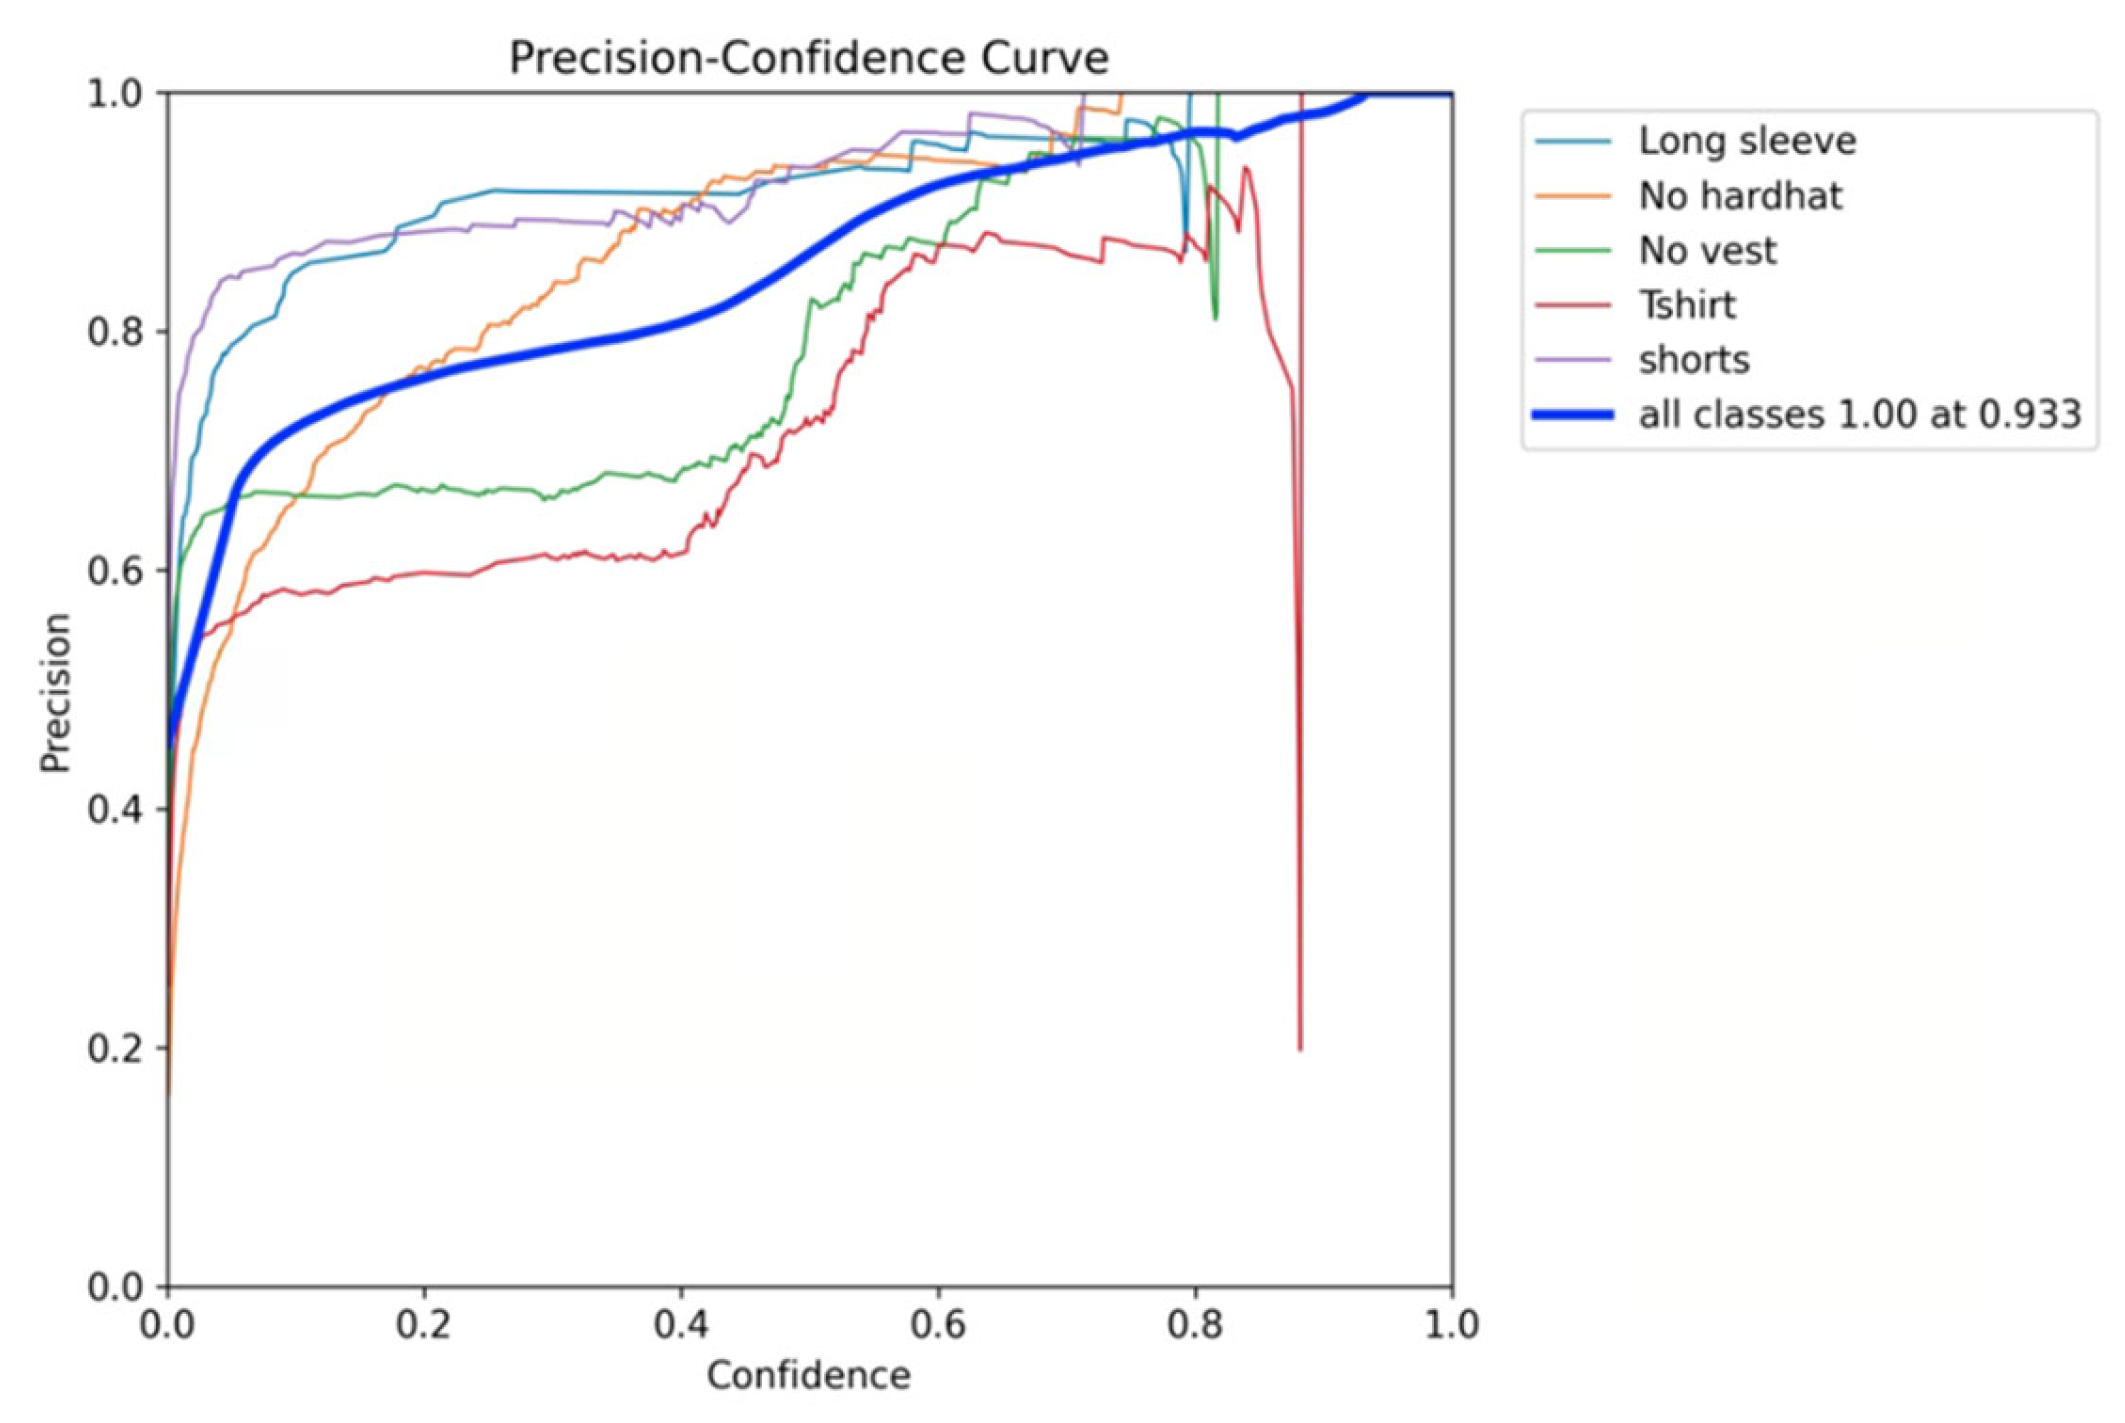
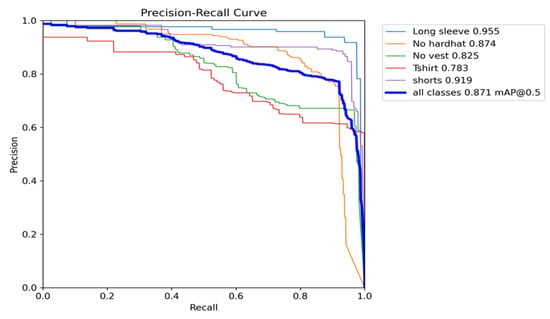
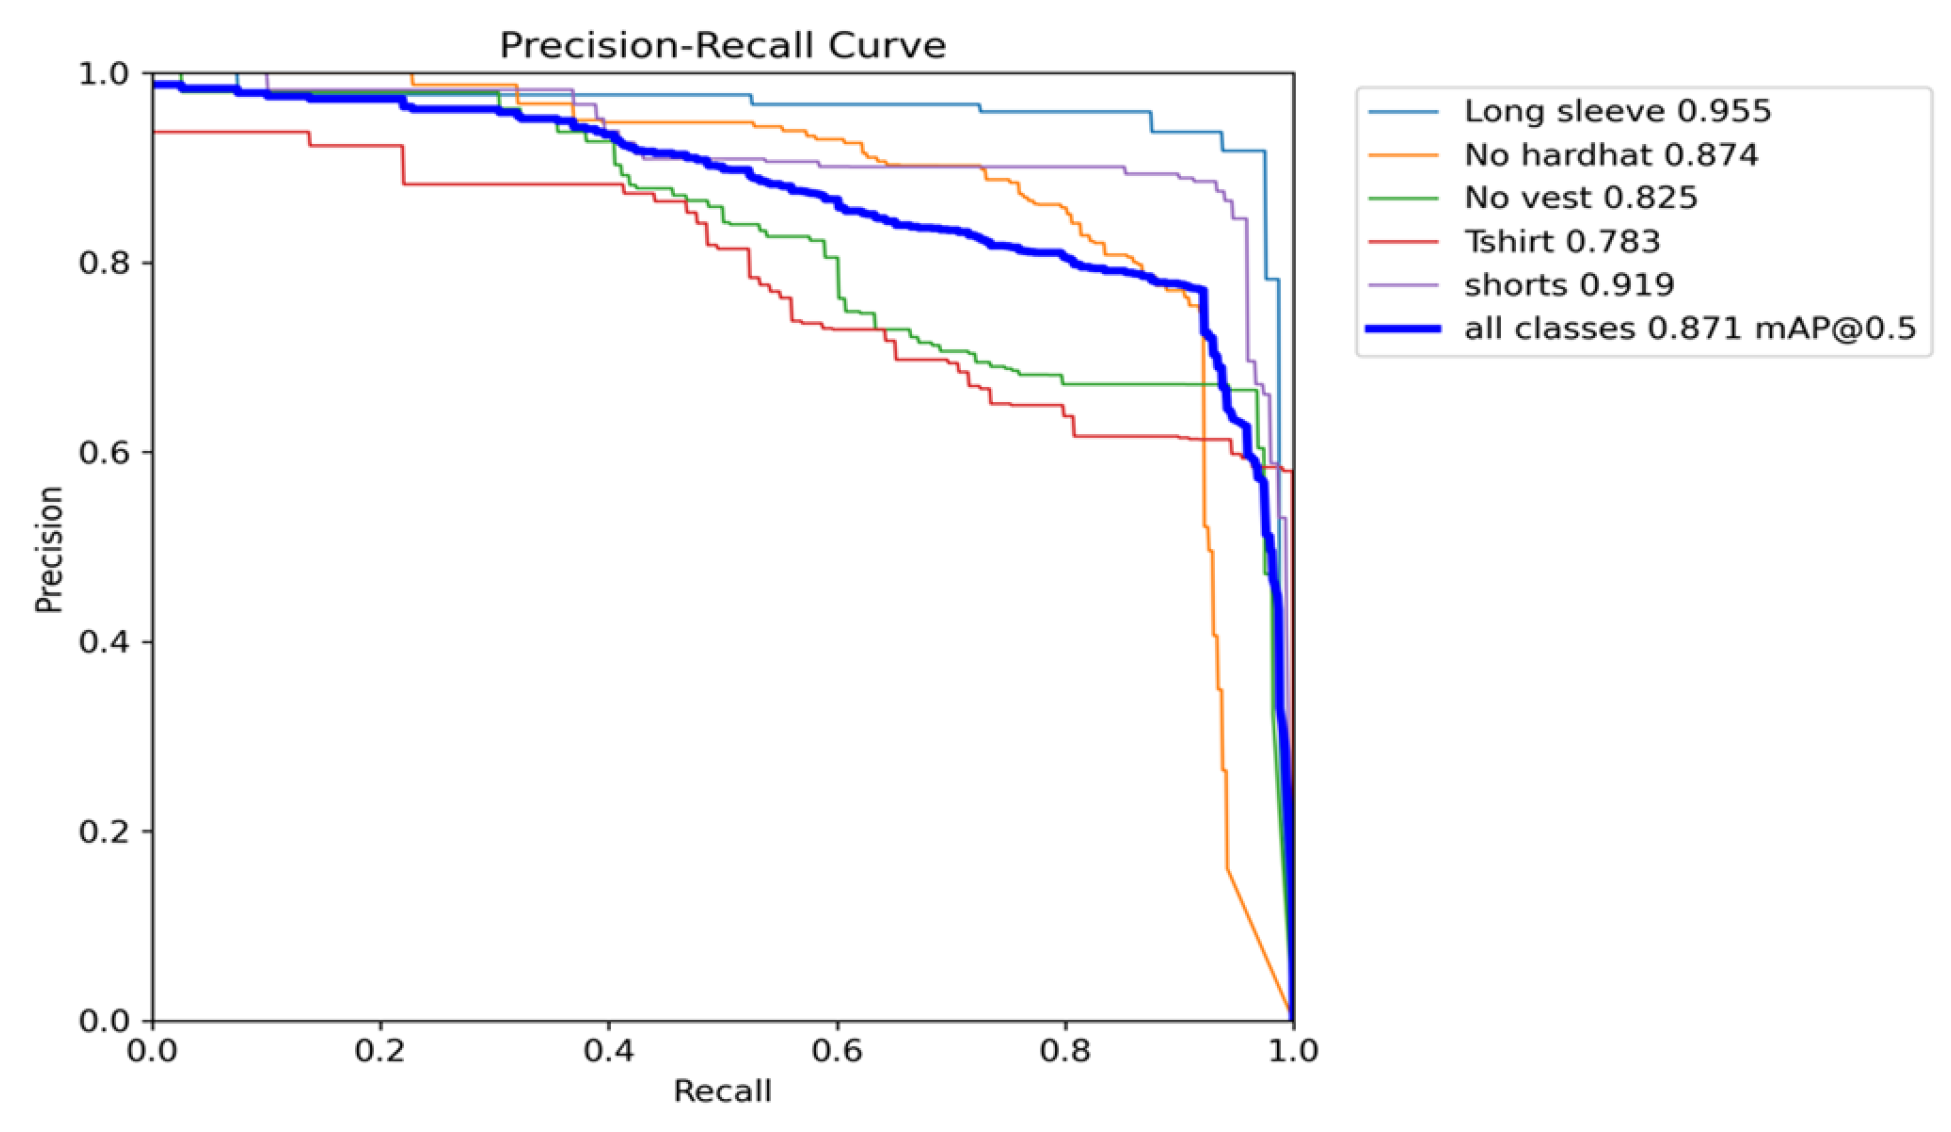
The precision–confidence curve illustrates how the model’s precision varies across different confidence thresholds, assisting in the selection of a cutoff that balances detection accuracy with the number of retained predictions. The precision–recall (PR) curve is a widely used performance evaluation tool in object detection that depicts the relationship between precision and recall across varying confidence thresholds, thereby highlighting the trade-off between false positives and false negatives.
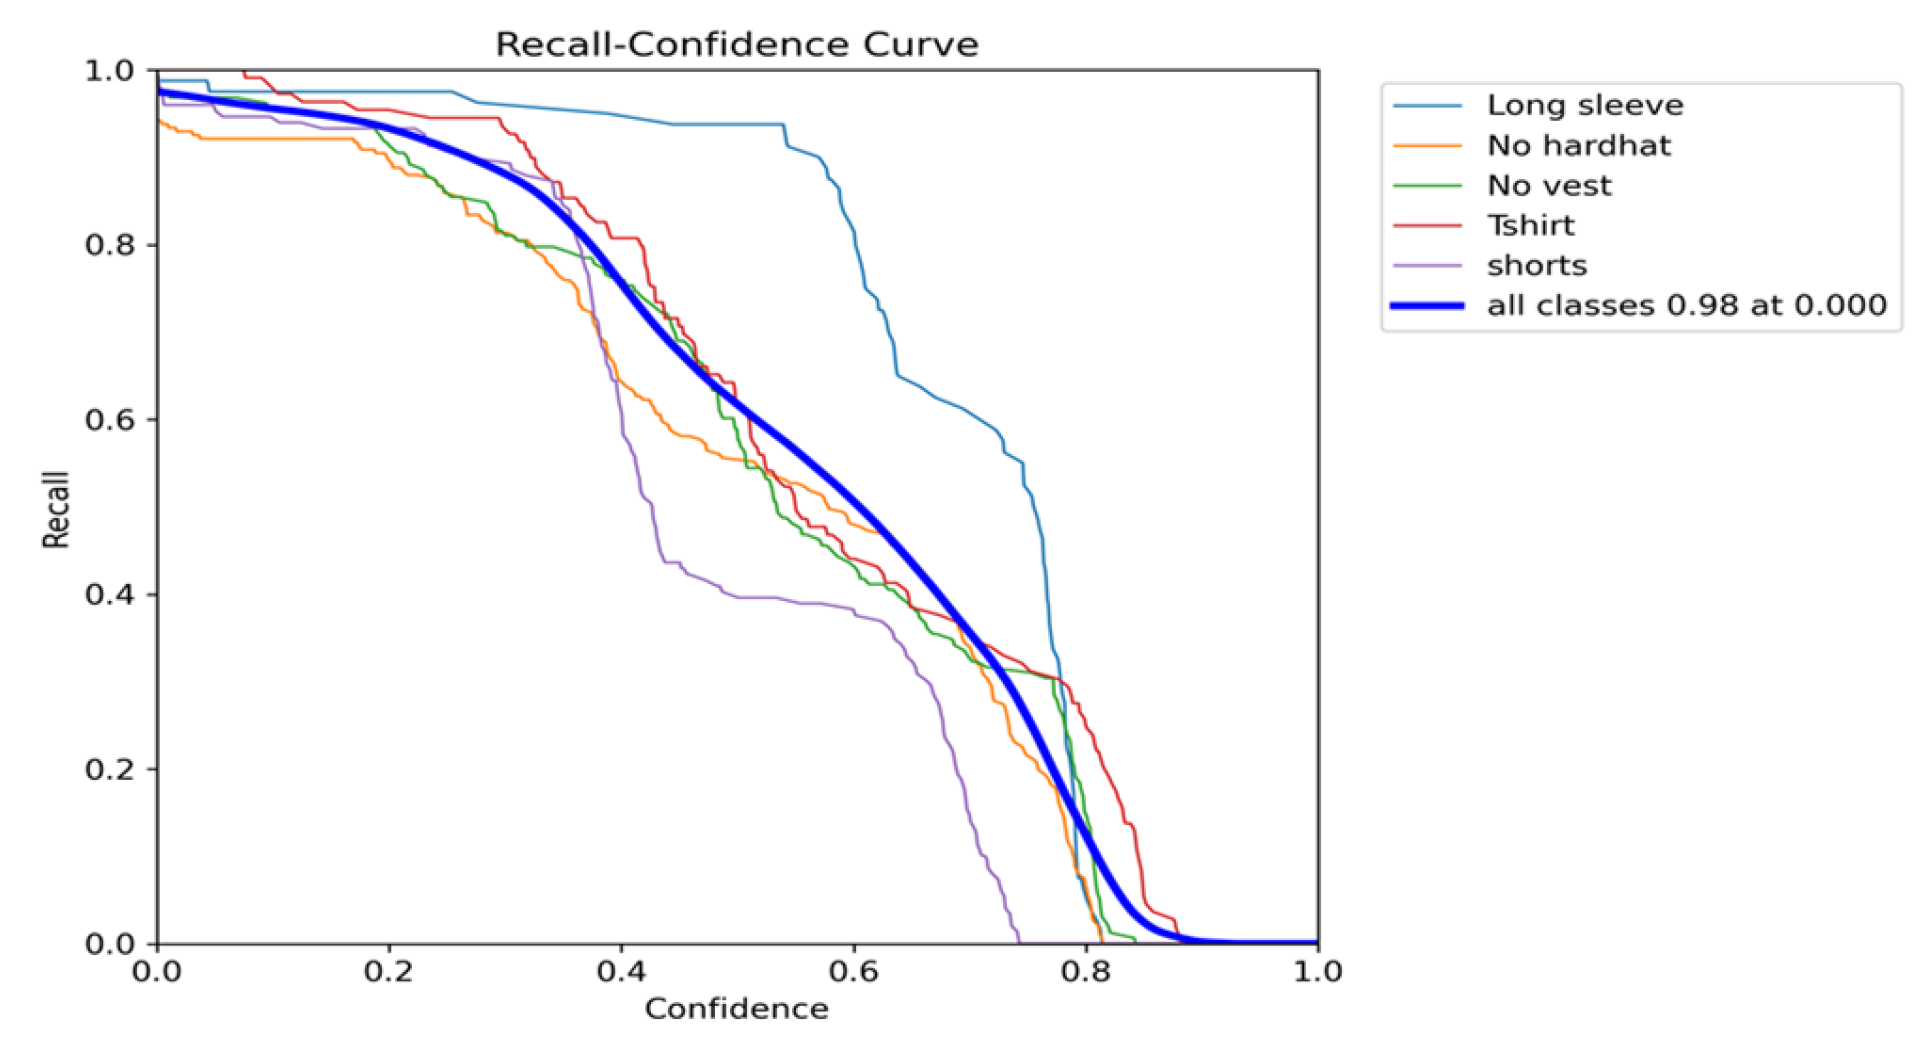
In addition, the recall–confidence curve shows how the model’s recall changes as the confidence threshold is adjusted. It is particularly useful for assessing how many true objects are successfully detected at different confidence levels and for understanding the sensitivity of the model to confidence-based filtering.
4. Results and Discussion
The YOLOv11-based PPE detection system demonstrated strong overall performance, particularly for long sleeves, no hardhat, and shorts, while reduced accuracy for no vest and T-shirt classes was primarily driven by dataset imbalance and limited non-compliance samples. Error analysis revealed that detection reliability is strongly influenced by aerial imaging constraints, including object scale, occlusion, lighting conditions, and image resolution. From an engineering perspective, while drone-based monitoring offers substantial coverage and efficiency, reliable deployment depends on appropriate sensor selection, stabilization, and computational infrastructure. The identified methodological and data-related limitations highlight areas for targeted improvement in future system iterations.
Table 1 summarizes the key performance outcomes of the proposed YOLOv11-based PPE detection system, together with the primary failure modes, engineering considerations, and methodological limitations identified during evaluation. The table consolidates quantitative detection metrics with qualitative deployment insights to provide a concise overview of model behavior under real-world aerial monitoring conditions.
Table 1.
Summary of Model Performance, Failure Modes, and Deployment Considerations.
Table 2 presents a comparison of the different YOLO models previously used for testing. All models were trained using an image size of 640 and 100 epochs. However, unlike YOLOv11l, no augmentation techniques were applied to the other models. During testing, the YOLOv8n model processed a non-compliant on-site video recorded at 15 fps.
Table 2.
Comparison of Different Algorithm Models.
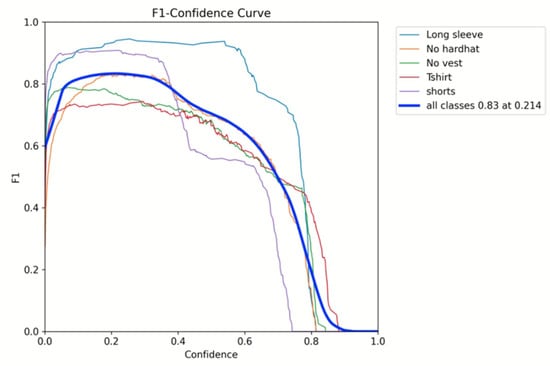
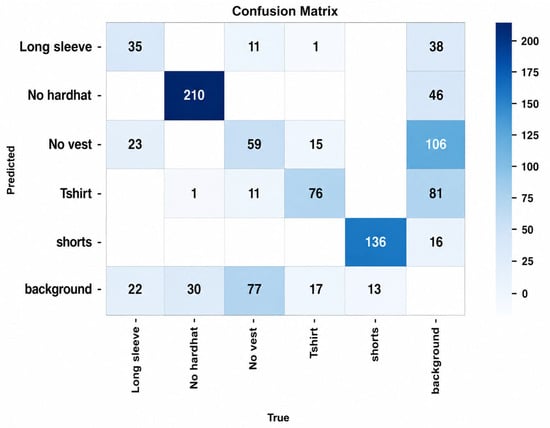
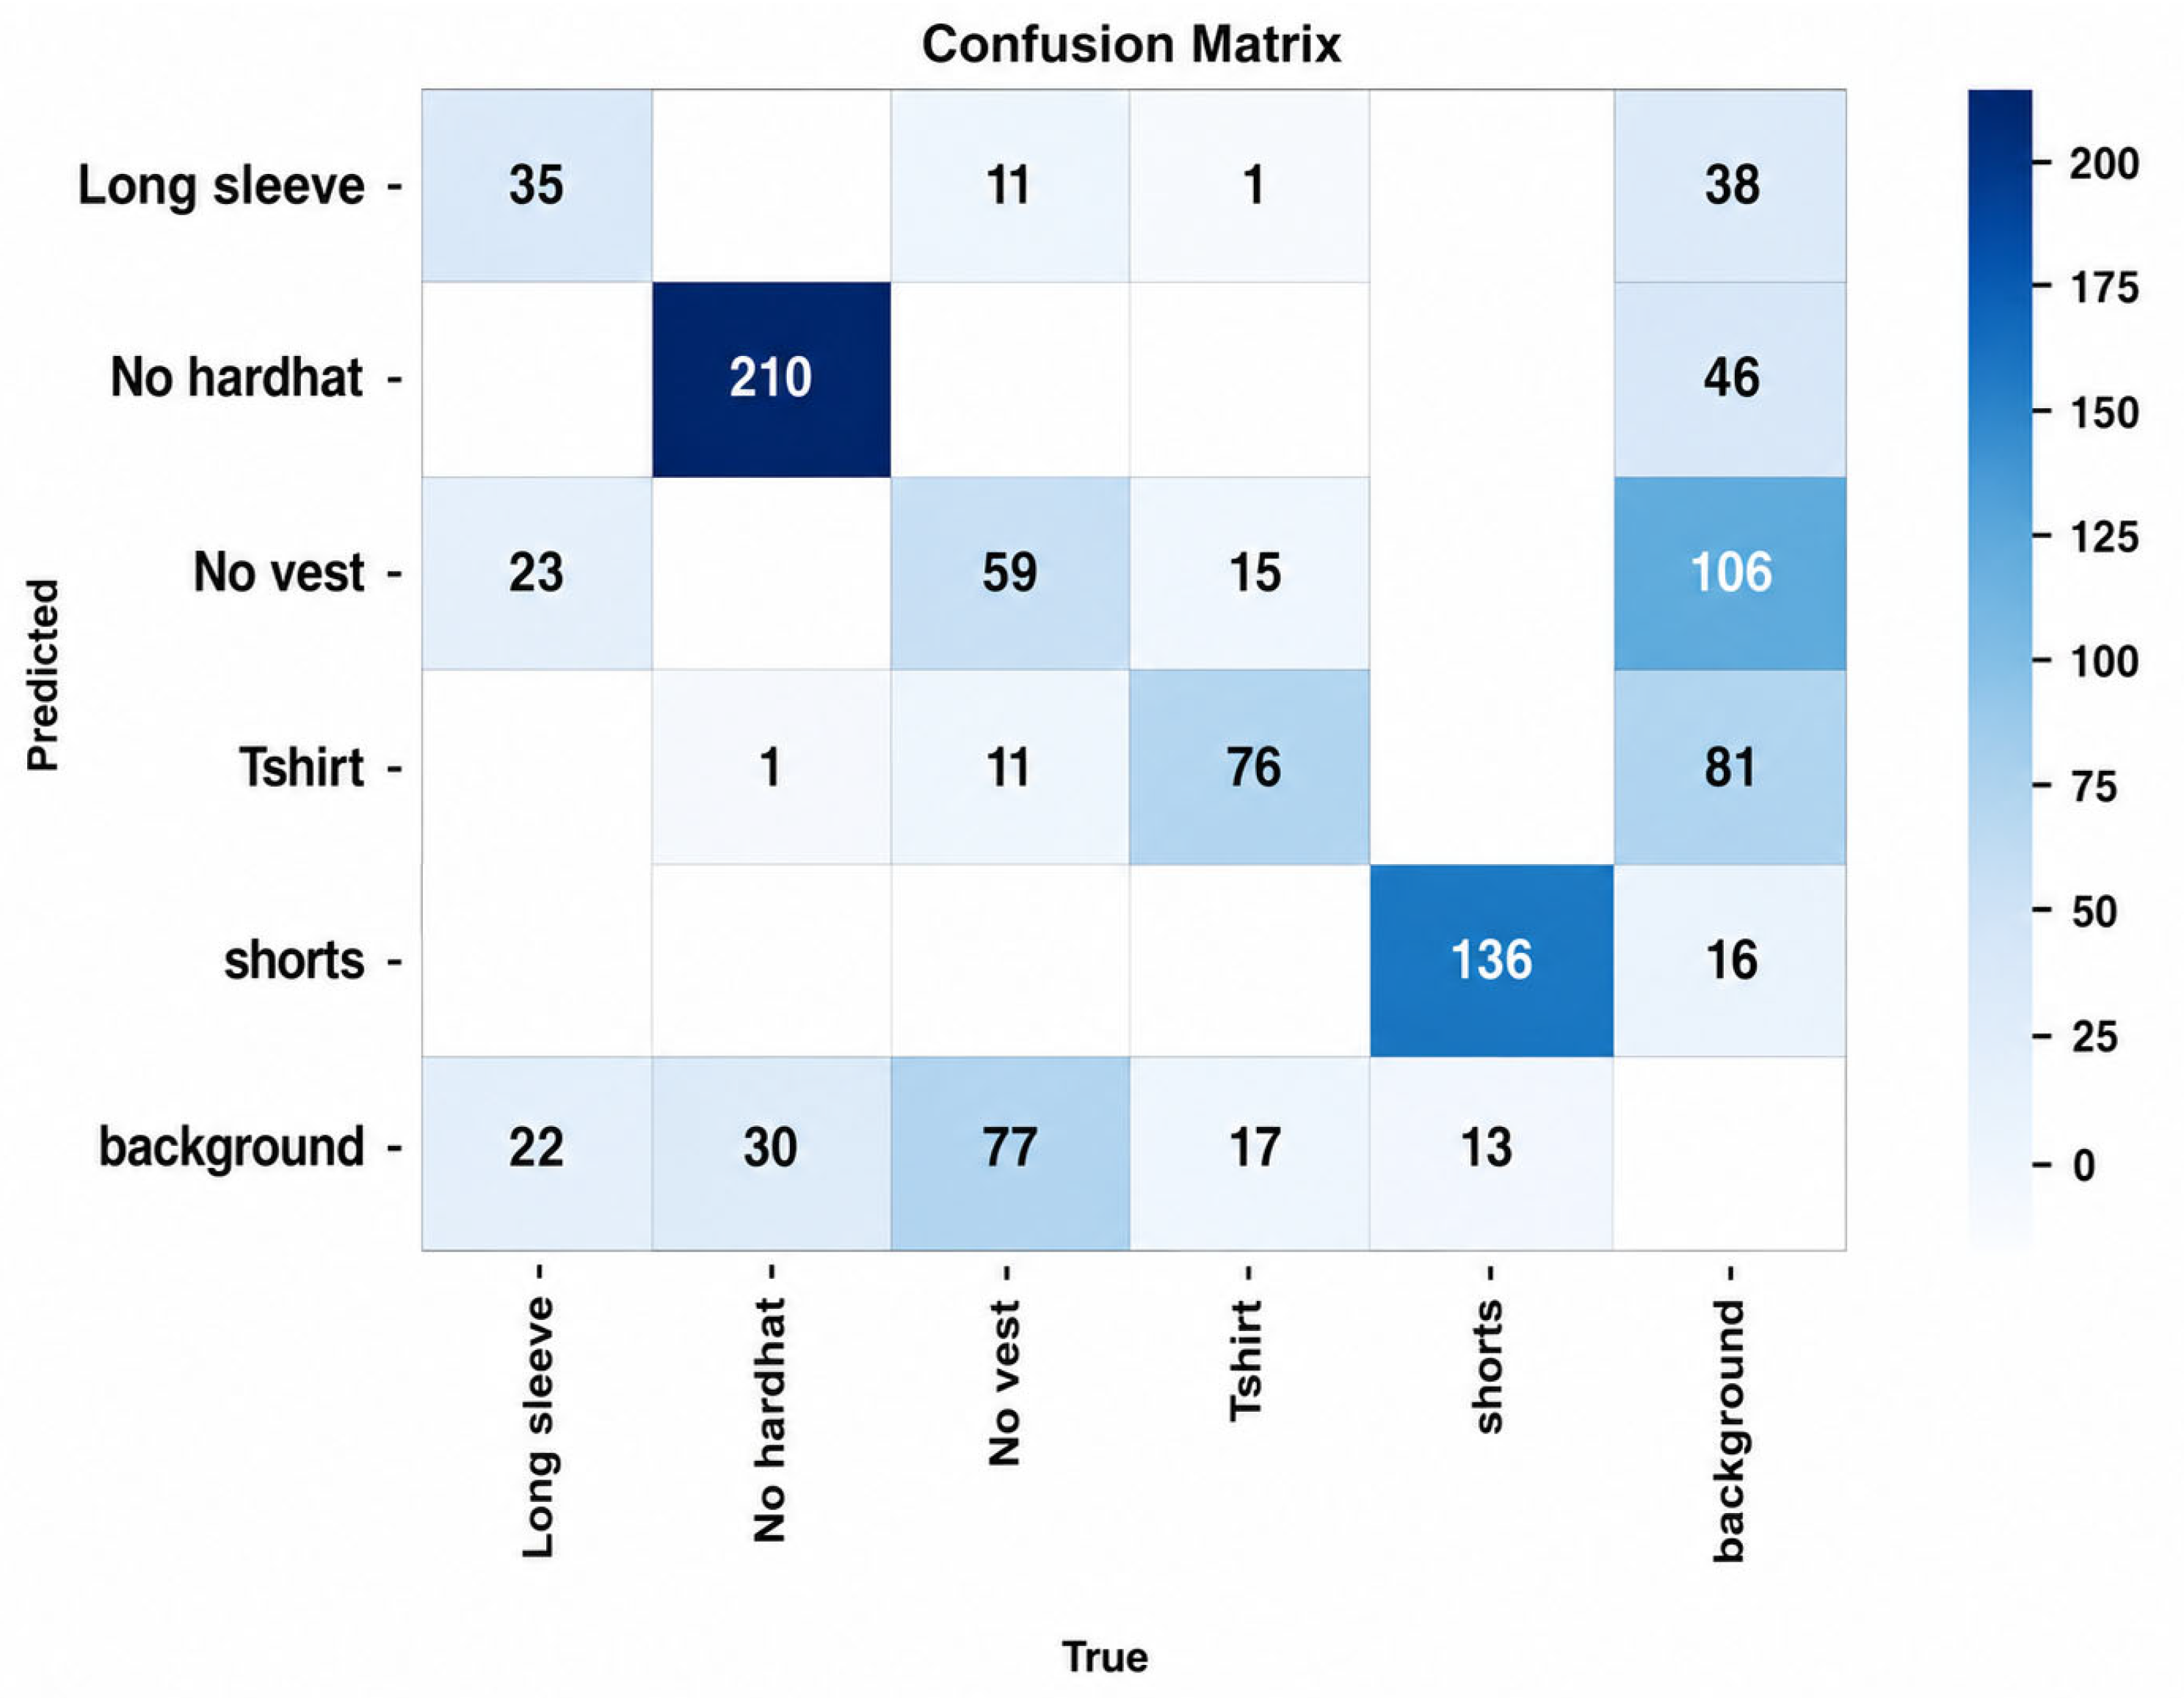
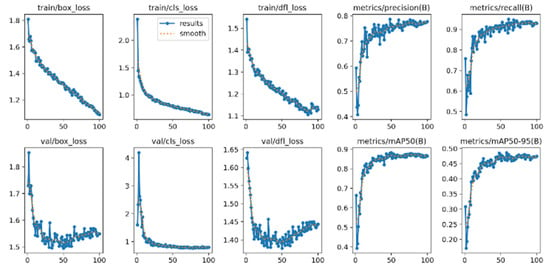
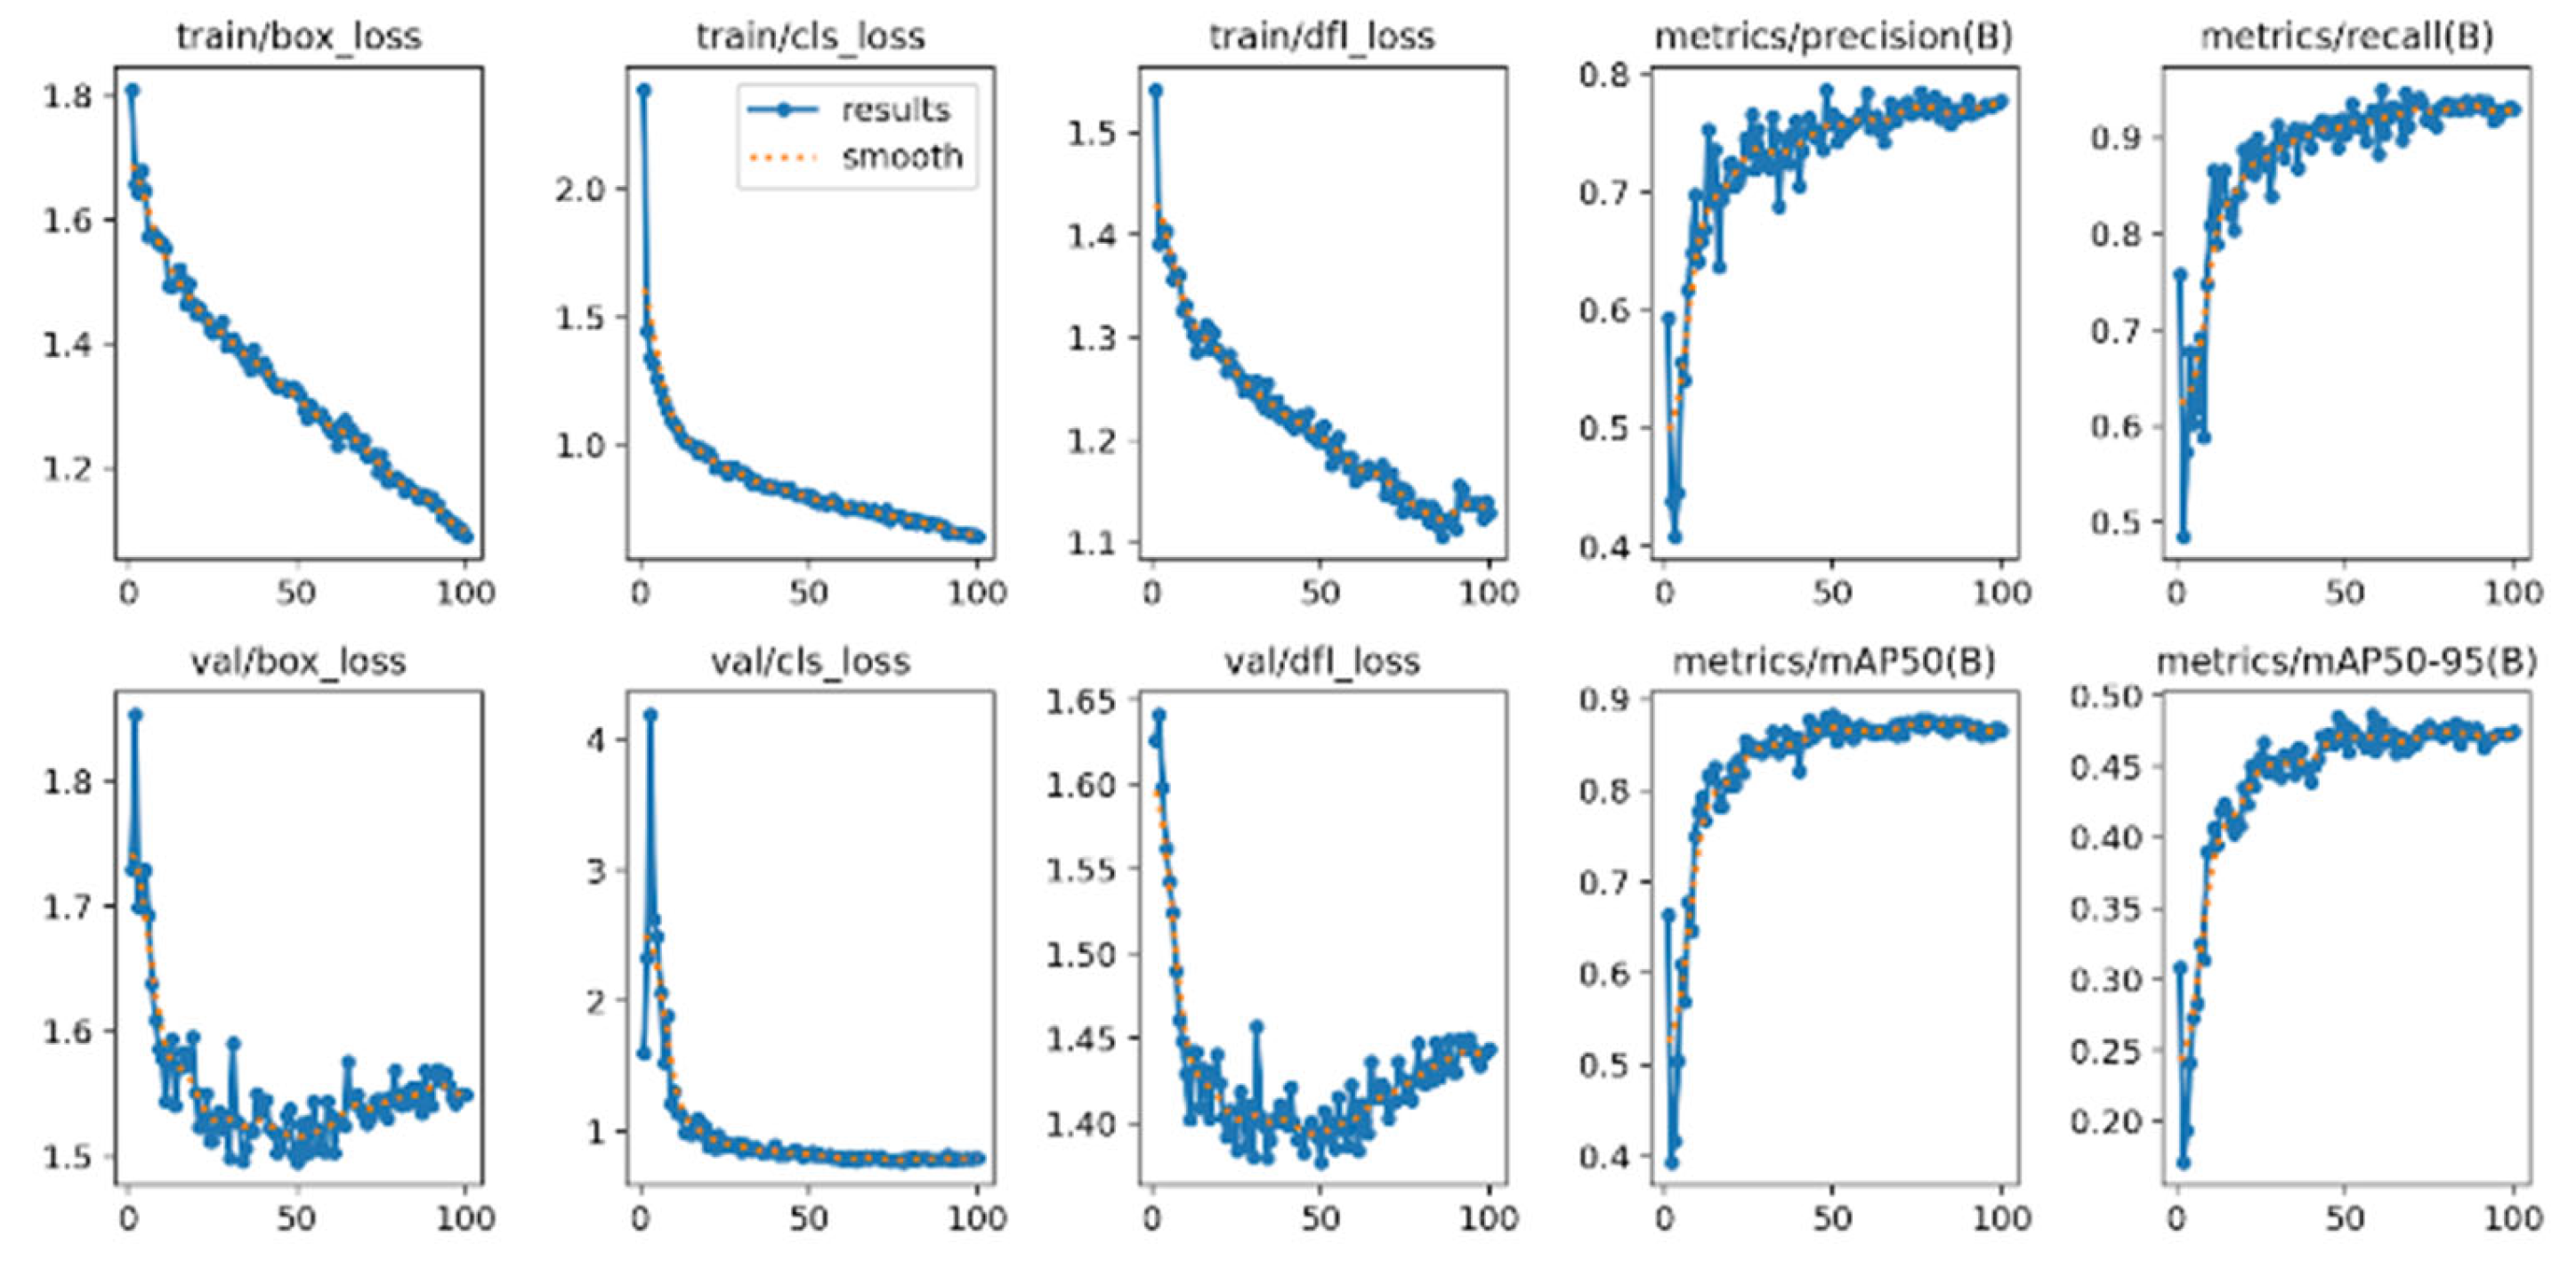
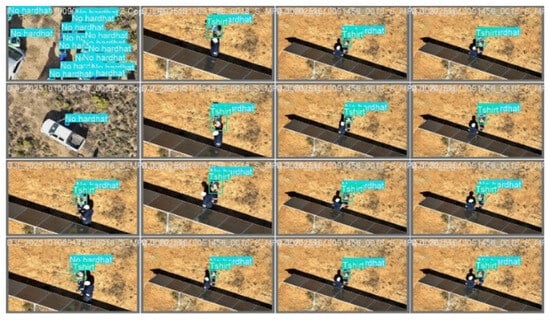
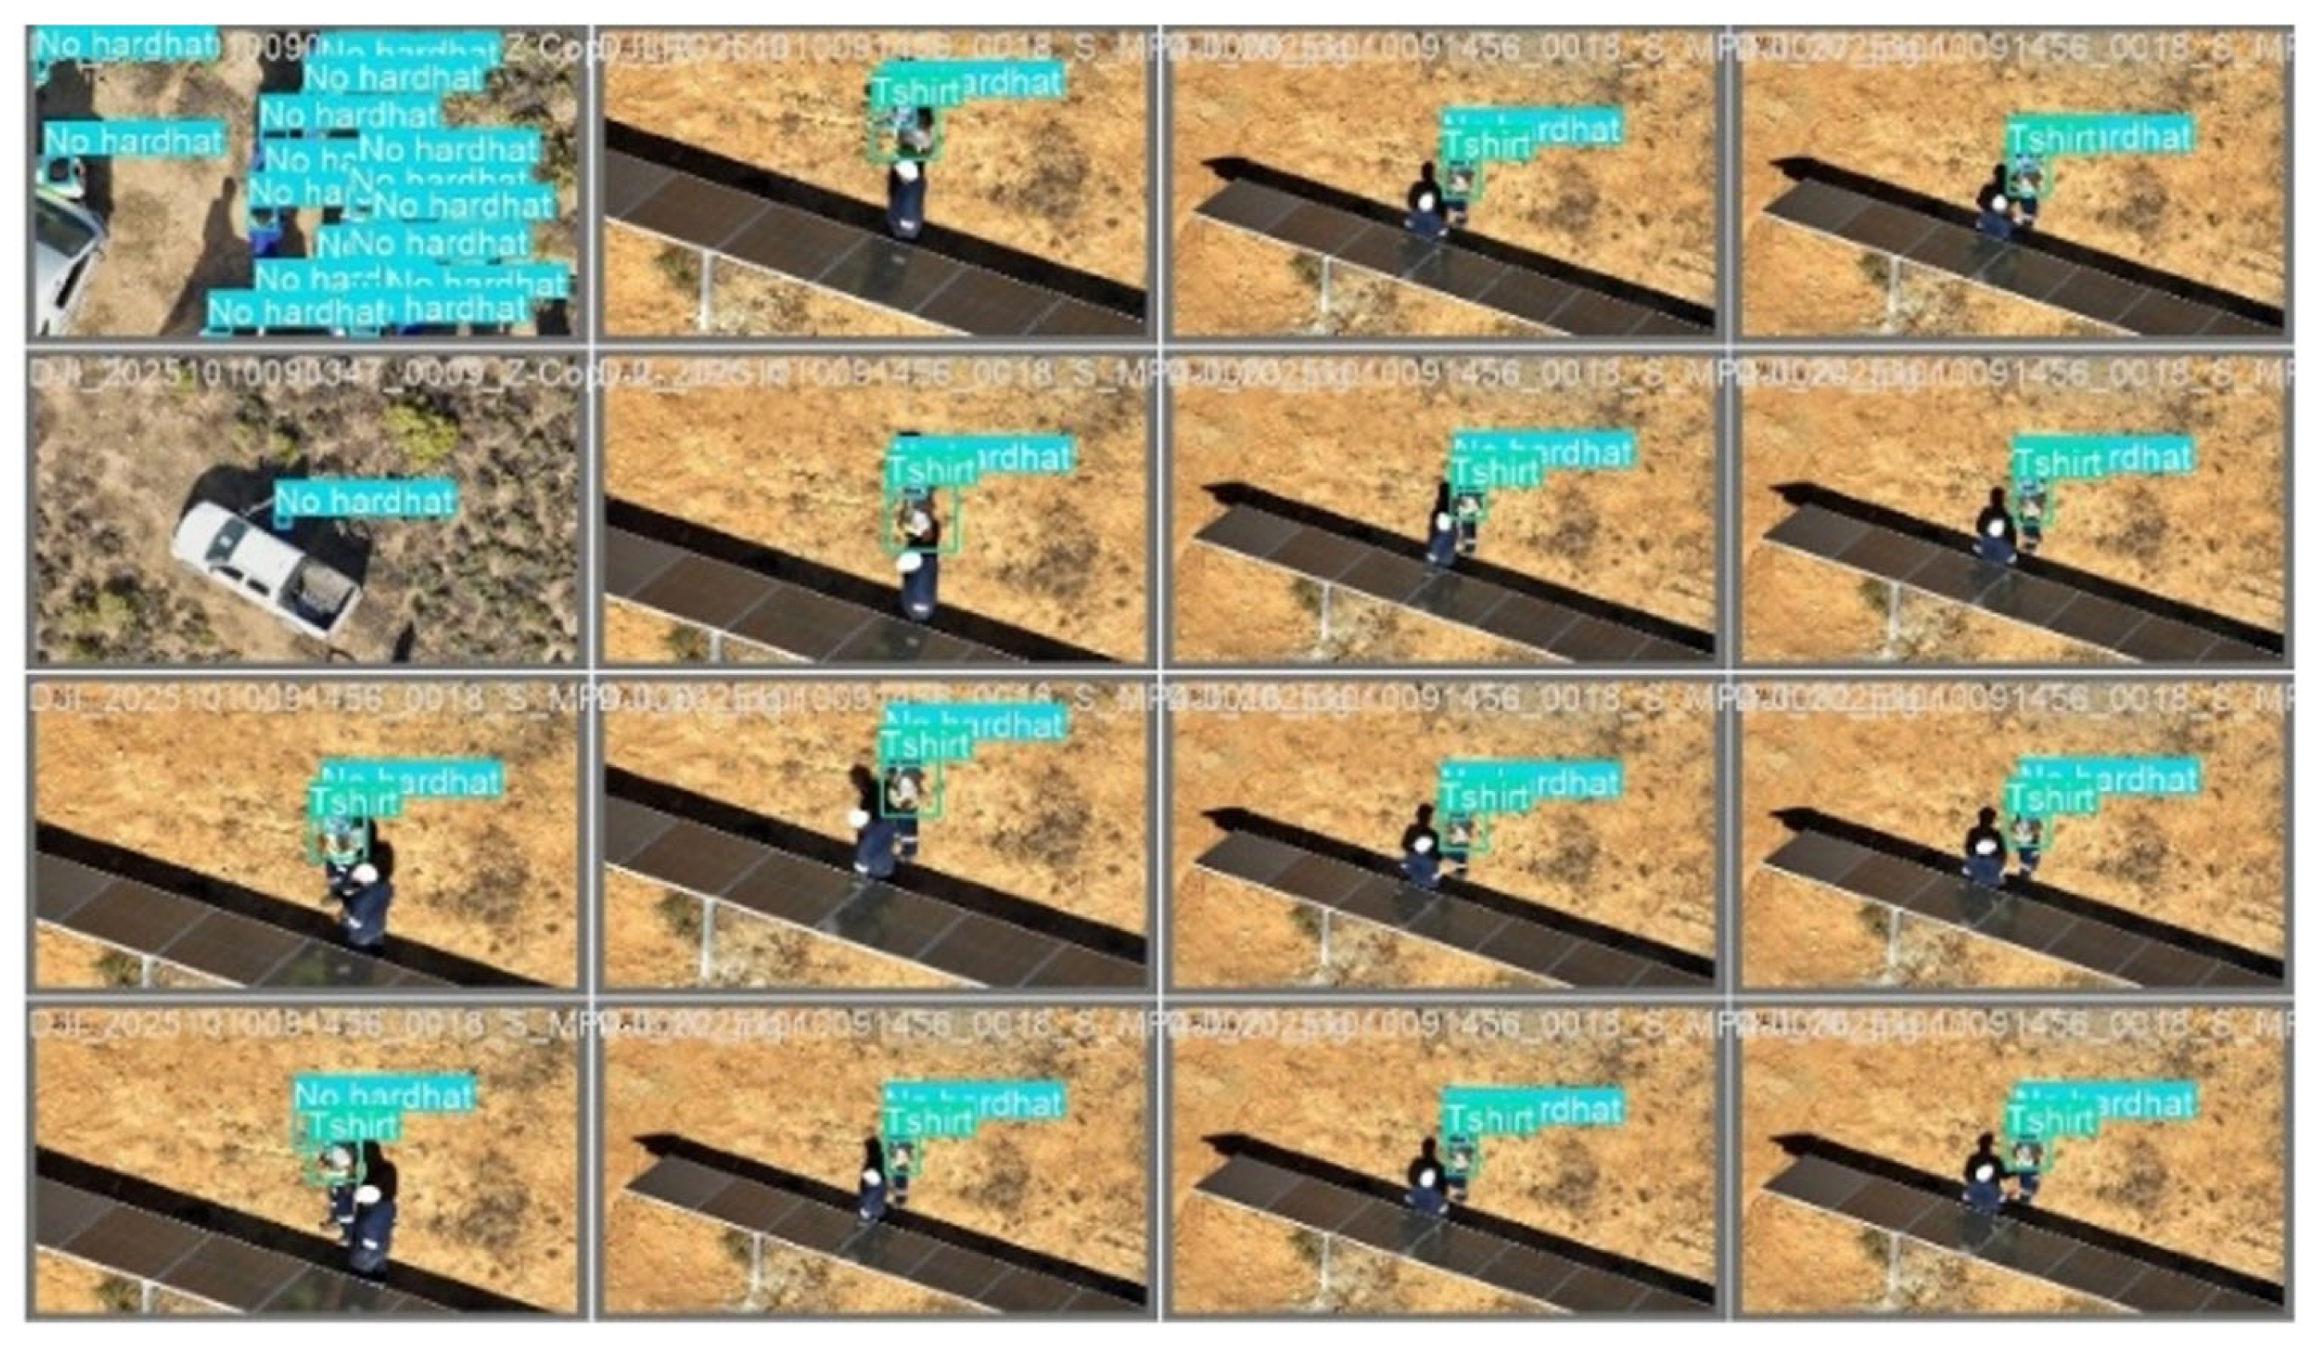
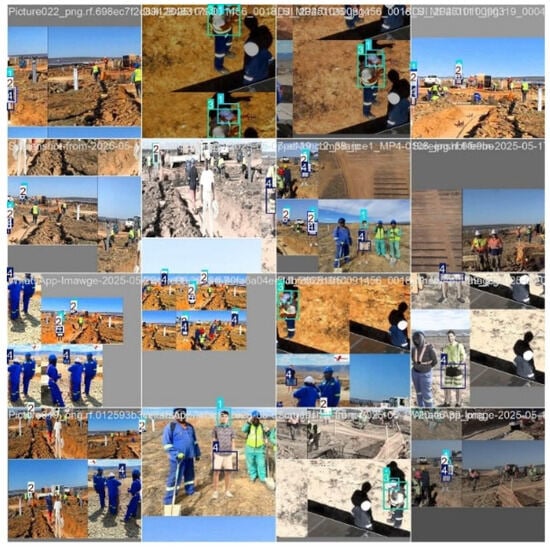
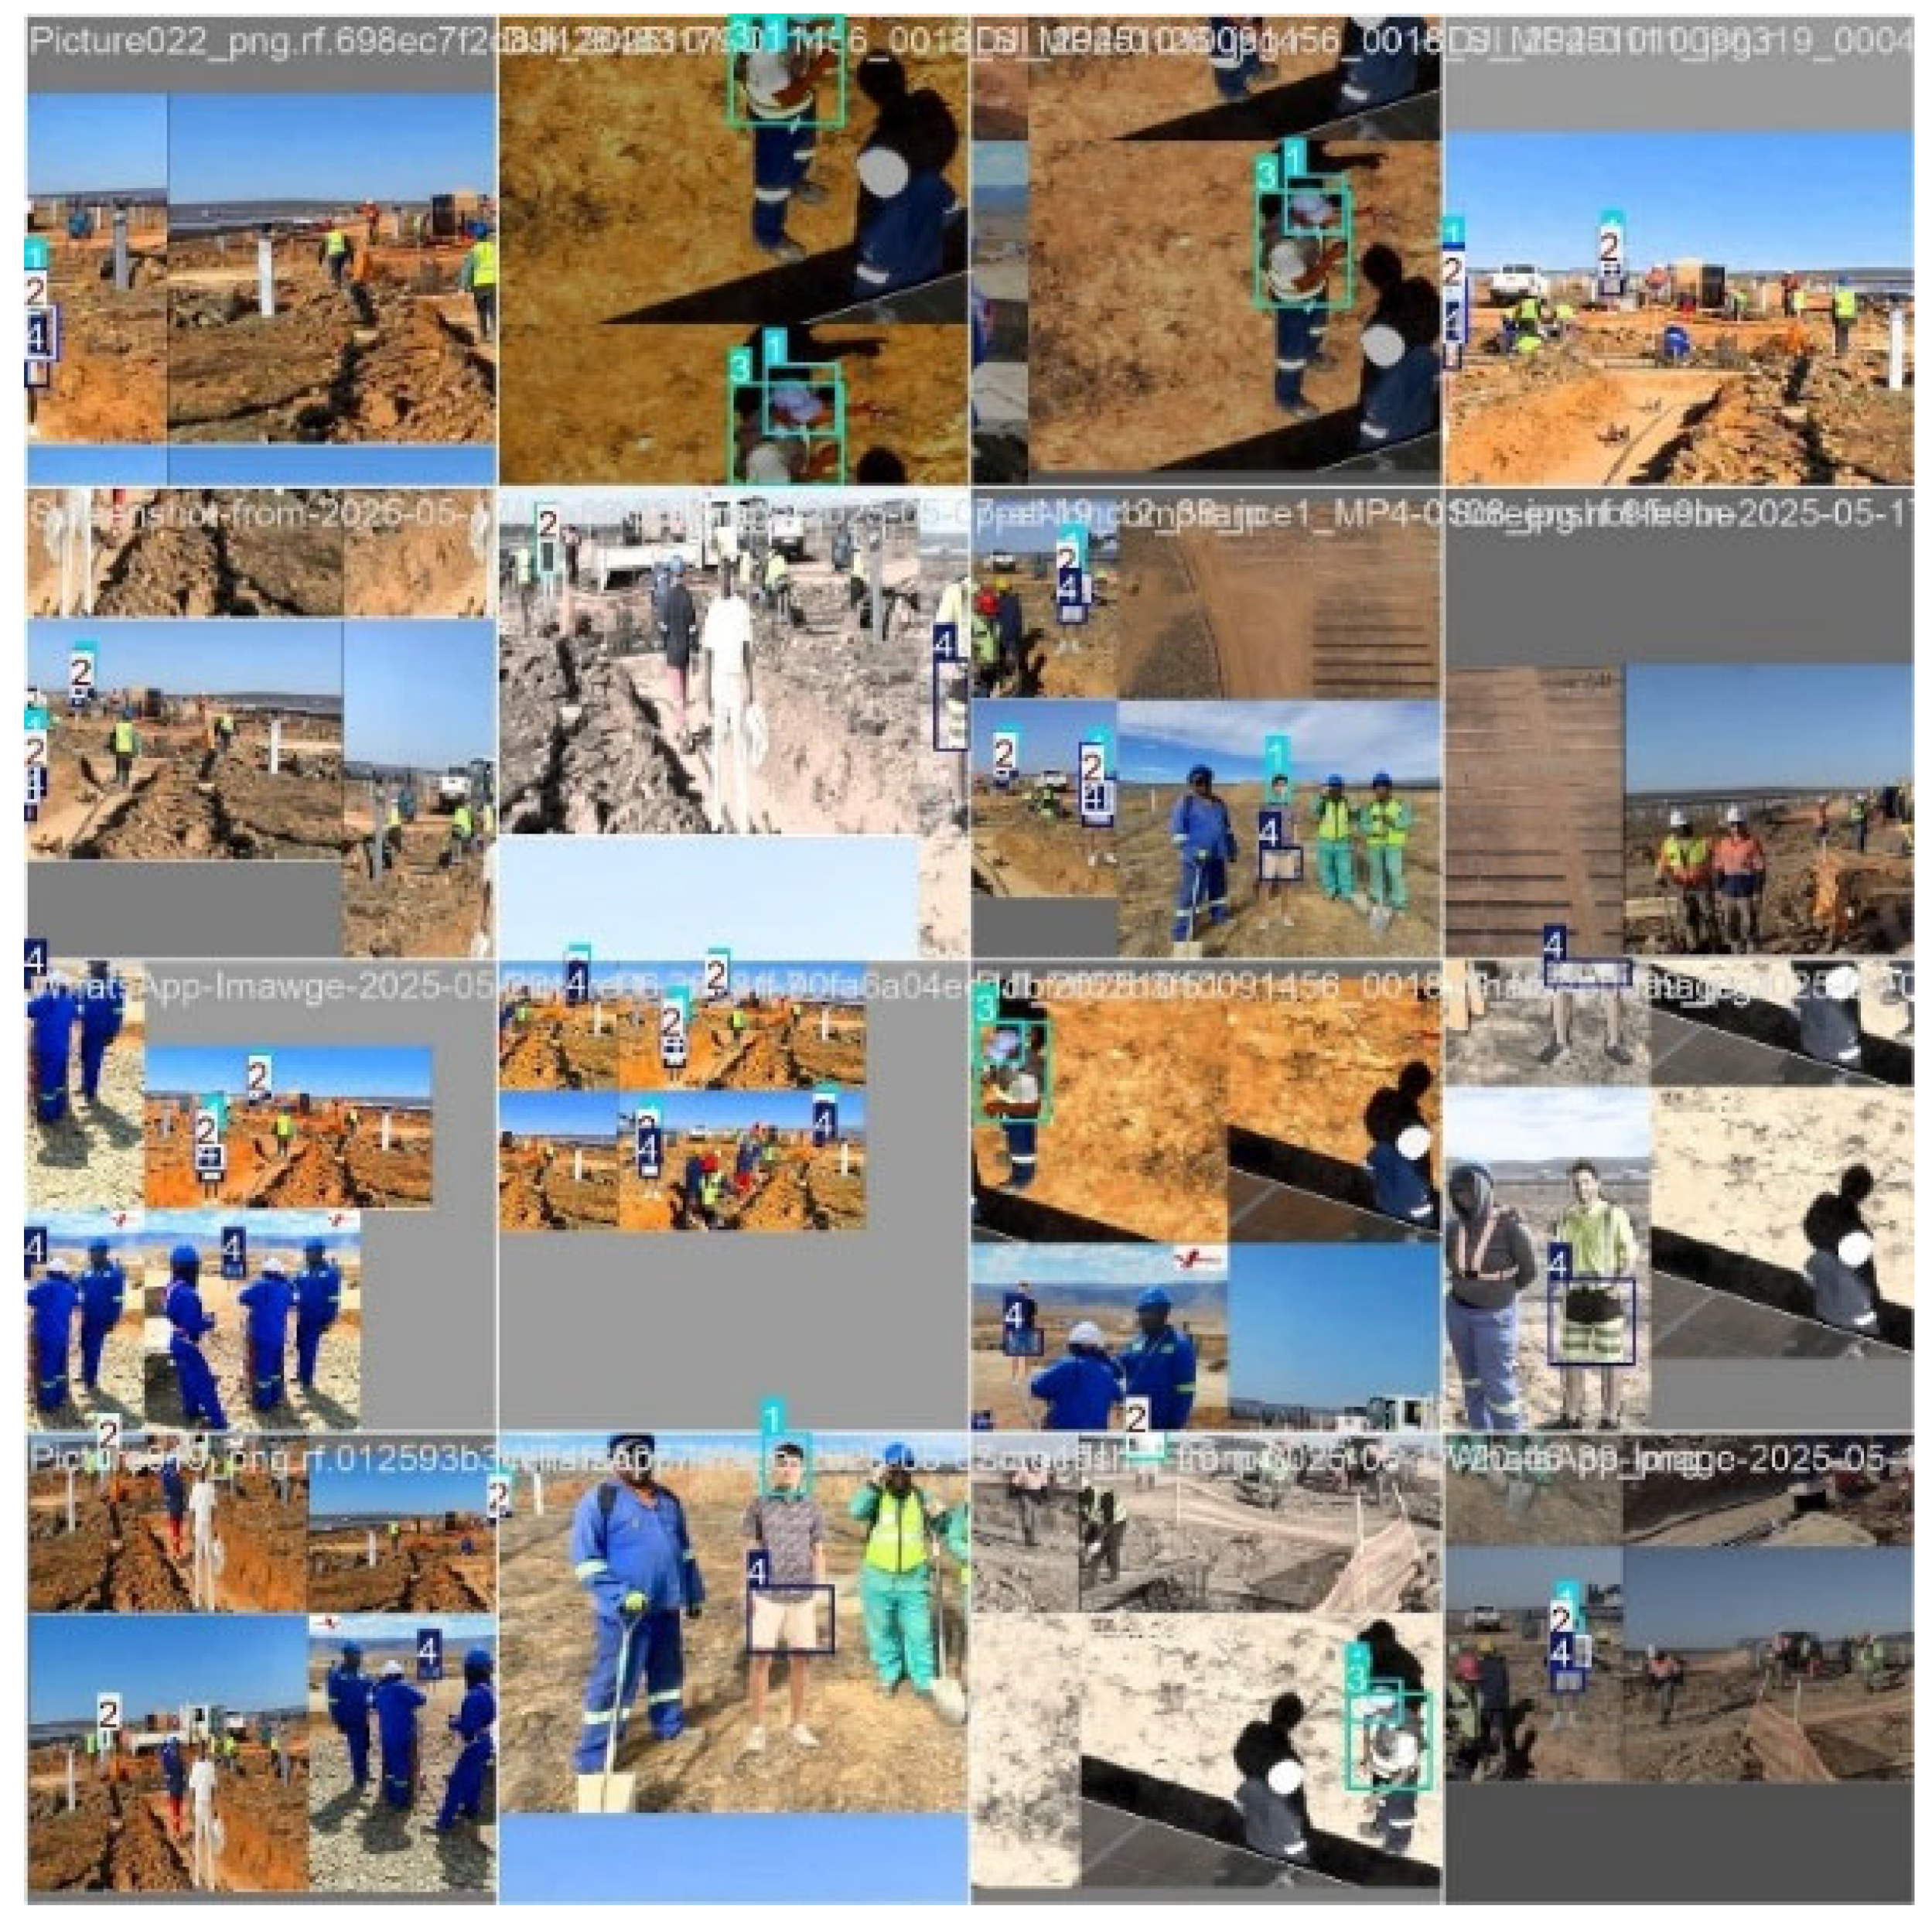
Figure 2 shows that the overall F1-score reaches a maximum value of 0.83 at a confidence threshold of 0.214. This threshold represents the optimal balance between precision and recall, making it the most suitable operating point for deployment. Figure 3 presents the confusion matrix which evaluates the model’s classification performance across different classes. The model performs well in detecting no hardhat and shorts, as indicated by the high number of correct predictions along the diagonal. However, there is a confusion between the no vest class and the background. There is 77 no vest classes that was incorrectly predicated as background. This means that additional training data or further model tuning is needed to improve detection performance for the no vest class. Figure 4 displays the training and validation curves of the YOLOV11l model. The results show a consistent decrease in training loss over the epoch with validation loss closely following the training trend. Both precision and recall remain high. These patterns indicate stable learning and good object localization performance which means that the mode generalizes well without significant overfitting. Figure 5 illustrates the visual inference results produced by the YOLOv11l model. These outputs demonstrate the model’s ability to detect and localize PPE items in real-world images. Figure 6 shows the validation batch visualization from the trained model. Multiple images are displayed simultaneously with both ground truth and predicated annotations. This visualization is used to verify data quality and assess the model’s behavior during training. Such validation helps improve generalization and reduce the risk of overfitting. Figure 7 indicates that precision reaches 1.00 (100%) at a confidence threshold of 0.933. This means that when the threshold is set to 0.933, all predicted detections are correct. However, this means high precision is achieved at the cost of reduced recall.
Figure 2.
F1–Confidence Curve 0.83%.
Figure 3.
Confusion Matrix.
Figure 4.
Training and validation curves of Yolov11 Model.
Figure 5.
Training Batch Outcome.
Figure 6.
Validation Batch Outcome.
Figure 7.
Precision–Confidence Curve @ 0.93%.
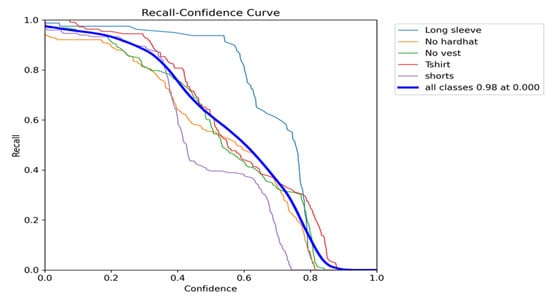
Figure 8 presents the Precision recall curve, which shows that the model achieved a mean average precision mAP @0.5 of 0.871 (87.1%). This indicates strong detection performance as predications are considered correct when the Intersection over Union (IoU) threshold is 0.5. The mAP value represents the average detection performance across all classes. Lastly, Figure 9 presents the recall–confidence curves, demonstrating the model’s sensitivity to different confidence thresholds. The model achieves a high recall (0.98) at a threshold of 0.0. As the confidence threshold increases, recall decreases steadily.
Figure 8.
Precision–Recall Curve @ 0.87%.
Figure 9.
Recall–Confidence Curve @ 0.98%.
When this video was uploaded into the AI pre- and post-processing tool, it generated over 700 images from the same footage. As a result, the model effectively memorized the frames instead of learning different variations. When running inference on the same video, YOLOv8n detects PPE with hundred percent accuracy, but its performance drops significantly when tested on different videos.
YOLOv12n and YOLOv12l performed well for close-range detection but struggled to identify PPE at longer distances. This is a limitation for the project, especially because drone footage often includes far-range views. These models also produced many false positives, incorrectly identifying objects such as trees, rocks, and vehicles as no hardhat or T-shirt. Although YOLOv11n was faster than YOLOv11l, it also generated a high number of false positives, reducing its reliability.
5. Conclusions and Recommendations
This study highlights the critical role of personal protective equipment (PPE) in powerline construction, where workers are routinely exposed to severe hazards such as electrical contact, falling objects, and environmental risks. The results demonstrate that AI-based PPE detection provides a reliable and proactive mechanism for enhancing on-site safety through continuous and automated compliance monitoring.
The proposed system, based on the YOLOv11-Large detector, exhibits strong performance for small-object PPE detection from aerial viewpoints and consistently outperforms earlier YOLO variants, including YOLOv3, YOLOv4, and YOLOv5, particularly on custom PPE datasets. Its favorable balance between detection accuracy and inference speed makes it well-suited for automated safety monitoring applications. While higher-capacity variants could further improve performance, they would impose additional computational costs that must be carefully managed in operational deployments.
High-resolution drone imagery contributed significantly to detection effectiveness by enabling improved spatial representation of PPE items. Nevertheless, several limitations were identified, including the limited availability of non-compliance samples, constraints on training at higher image resolutions due to computational resources, and reliance on external tools for model optimization. These limitations will be addressed in future work through dataset expansion, increased computational capacity, and methodological refinement.
The findings further highlight that effective deployment of AI-driven PPE monitoring systems depends not only on detector selection but also on the robustness of the entire development pipeline, encompassing data collection, dataset balancing, accurate annotation, model training, and rigorous performance evaluation. When systematically implemented, such systems have the potential to substantially reduce occupational injuries, strengthen regulatory compliance, and foster a stronger safety culture. Ultimately, intelligent PPE monitoring represents a key step toward safer, more efficient, and more sustainable powerline construction operations.
This work may further be applied to the following areas:
- Traffic management within the construction zone;
- Monitoring of the movement and locations of heavy mobile plants such as articulated trucks, excavators, cranes, etc., on hill or gravel terrain;
- Improve the positioning of safety workers;
- Working at heights;
- Movement around open trenches, etc.;
- Posture of workers carrying out repetitive or specialized tasks.
Author Contributions
Conceptualization, I.M., N.P. and R.V.; methodology, N.P., I.M. and C.G.; software, I.M. and S.A.; validation, I.M., N.P., S.M. and S.A.; formal analysis and investigation, I.M., N.P. and S.M.; writing—review and editing, I.M., N.P., S.M., S.A., R.V. and C.G.; IT development, E.P. All authors have read and agreed to the published version of the manuscript.
Funding
This research received no external funding.
Informed Consent Statement
Informed consent was obtained from all subjects involved in the study.
Data Availability Statement
The data used generated during the preparation of this report shall, be made available upon request.
Conflicts of Interest
Authors Isabelle Makembe, Riaz Vajeth, Nishanth Parus, Steve Apps, Emeil Pillay and Siyabonga Mchunu were employed by the company Rhythm Power Solutions. The remaining authors declare that the research was conducted in the absence of any commercial or financial relationships that could be construed as a potential conflict of interest.
Abbreviations
The following abbreviations are used in this manuscript:
| PPE | Personal Protective Equipment |
| CNNs | Convolutional Neural Networks |
| YOLO | You Only Look Once |
| AI | Artificial Intelligence |
| UAVs | Unmanned Aerial Vehicles |
| mAP | Mean Average Precision |
References
- Mthembu, A. Baseline Risk Assessment; eThekwini Municipality: Durban, South Africa, 2022; pp. 5–23. [Google Scholar]
- Sehsah, R.; El-Gilany, A.H.; Ibrahim, A.M. Personal Protective Equipment (PPE) Use and Its Relation to Accidents among Construction Workers. Med. Lav. 2020, 111, 285. [Google Scholar] [CrossRef] [Scilit] [PubMed]
- Nazli, N.A.N.M.; Sabri, N.; Aminuddin, R.; Ibrahim, S.; Yusof, S.; Nasir, S.D.N.M. A real-time system for detecting personal protective equipment compliance using deep learning model YOLOv5. Procedia Comput. Sci. 2024, 245, 647–656. [Google Scholar] [CrossRef] [Scilit]
- Wang, H. Detection of Personal Protective Equipment (PPE) Using an Anchor Free-Convolutional Neural Network. Int. J. Adv. Comput. Sci. Appl. 2024, 15, 366–374. [Google Scholar] [CrossRef] [Scilit]

Disclaimer/Publisher’s Note: The statements, opinions and data contained in all publications are solely those of the individual author(s) and contributor(s) and not of MDPI and/or the editor(s). MDPI and/or the editor(s) disclaim responsibility for any injury to people or property resulting from any ideas, methods, instructions or products referred to in the content. |
© 2026 by the authors. Licensee MDPI, Basel, Switzerland. This article is an open access article distributed under the terms and conditions of the Creative Commons Attribution (CC BY) license.