1. Introduction
While the use of liquid hydrogen (LH
2) as a fuel has a long history in the space industry and applications in the trucking, maritime, and rail sectors have recently been demonstrated [
1,
2,
3], the requirements for an LH
2 fuel quantity indication system (FQIS) that meets the standards of the commercial aviation sector remain unmatched. Space applications that utilize large quantities of LH
2, typically use discrete resistive temperature devices (RTDs) positioned at fixed intervals for fill level measurements, resulting in a low-resolution measurement profile [
4].
Stationary LH
2 dewars often use differential pressure transducers or gravimetric load cells, which yield reliable data under quasi-static conditions. However, the accelerations and sloshing inherent in mobile applications introduce significant hydrostatic noise and mechanical interference, rendering these techniques insufficient for high-precision gauging in the transport sector [
5]. However, differential pressure transducers remain the most used LH
2 gauging method in the industry [
6].
In the automotive sector, capacitive probes have been used for gauging LH
2 fill levels [
7]. These sensors are also used in current aircraft FQIS which makes them a promising candidate for hydrogen FQIS; however, a comprehensive analysis is required to investigate probe structural stability, signal attenuation, and the complexities introduced by low dielectric contrast over the extended sensor lengths.
The certification frameworks governing aviation-grade LH
2 systems, specifically
ISO/AWI 19888-1 (Hydrogen Technologies—Aerial Vehicles—Part 1: Liquid Hydrogen Fuel Storage System) [
8] and
SAE AS6679 (Functional and Installation Recommendations for Aircraft Liquid Hydrogen Storage and Distribution Systems) [
9], are currently in the developmental phase and have yet to be formally ratified. In the meantime, established automotive standards, such as
ISO 13984 (Liquid hydrogen—Land vehicle fueling system interfaces) [
10] and
ISO 13985 (Liquid hydrogen—Land vehicle fuel tanks), serve as foundational references for the storage and handling of LH
2. Furthermore, to meet the fill level measurement accuracy requirement stipulated in
ARINC 611-1 (Guidance for the Design and Installation of Fuel Quantity Systems) [
11] with the specific tank geometries presented in the DLH25 hydrogen aircraft concept [
12] necessitates a fuel level sensor resolution of
[
13].
The most comprehensive evaluation of different LH
2 fill-level sensors for hydrogen aircraft that the authors could find remains in a study published in
Advances in Cryogenic Engineering [
14]. This study investigated six distinct sensor types, differential pressure, capacitance, buoyant force, gravimetric load cells, and radiation, and rated their suitability for aerospace applications. However the study dates back to the early 1960s and while the physics have not changed, the developments in electronics and computers allow for much more sophisticated sensor designs, rendering its comparative analysis somewhat antiquated in the context of advances in technology.
The most comprehensive comparative experimental study on LH
2 tank instrumentation was done as part of NASA’s Project
SHIIVER [
15] in 2020, where LH
2 fill-level sensors—specifically capacitance probes, silicon diodes, and a Radio Frequency Mass Gauge (RFMG) were experimentally investigated. The results demonstrated that a scaled-up capacitance probe of
in length can be operated successfully for LH
2 gauging. Furthermore, silicon diodes provided precise discrete indications of the wet-to-dry transition, while the RFMG demonstrated a measurement accuracy of
full-scale fill level. While the focus of the
SHIIVER project was aimed towards LH
2 space applications, the findings are relevant for LH
2 aircraft FQIS design considerations.
In this work, five distinct sensor concepts adopted from established literature and prior engineering practice were assessed by experimentally investigating their performance using LN2 as a cryogenic substitute for LH2. The objective was not only to reproduce the findings of prior studies, but also to verify whether experimental results align with analytical predictions regarding sensitivity, and to examine whether cryogenic temperatures adversely affect electronic performance and material fatigue resulting from the use of components with mismatched thermal expansion coefficients. While most prior experiments relied on boil-off to slowly vary the fill level, this study used a linear actuator in combination with a transparent cryostat to enable precise submersion of the sensors over multiple cycles.
2. Testbed Setup
For this work,
was used as a cryogenic substitute for
because it offers mitigated safety risks and lower operational complexity while still exhibiting similar thermophysical properties, as shown in
Table 1. However, it must be noted that using
allows only limited transferability to
. Therefore, it should be understood as an initial validation of the analytical models and sensor designs, which ultimately require verification through testing with
.
At the center of the experimental setup, a transparent cryostat is integrated with a vertical linear actuator, providing a positioning accuracy of
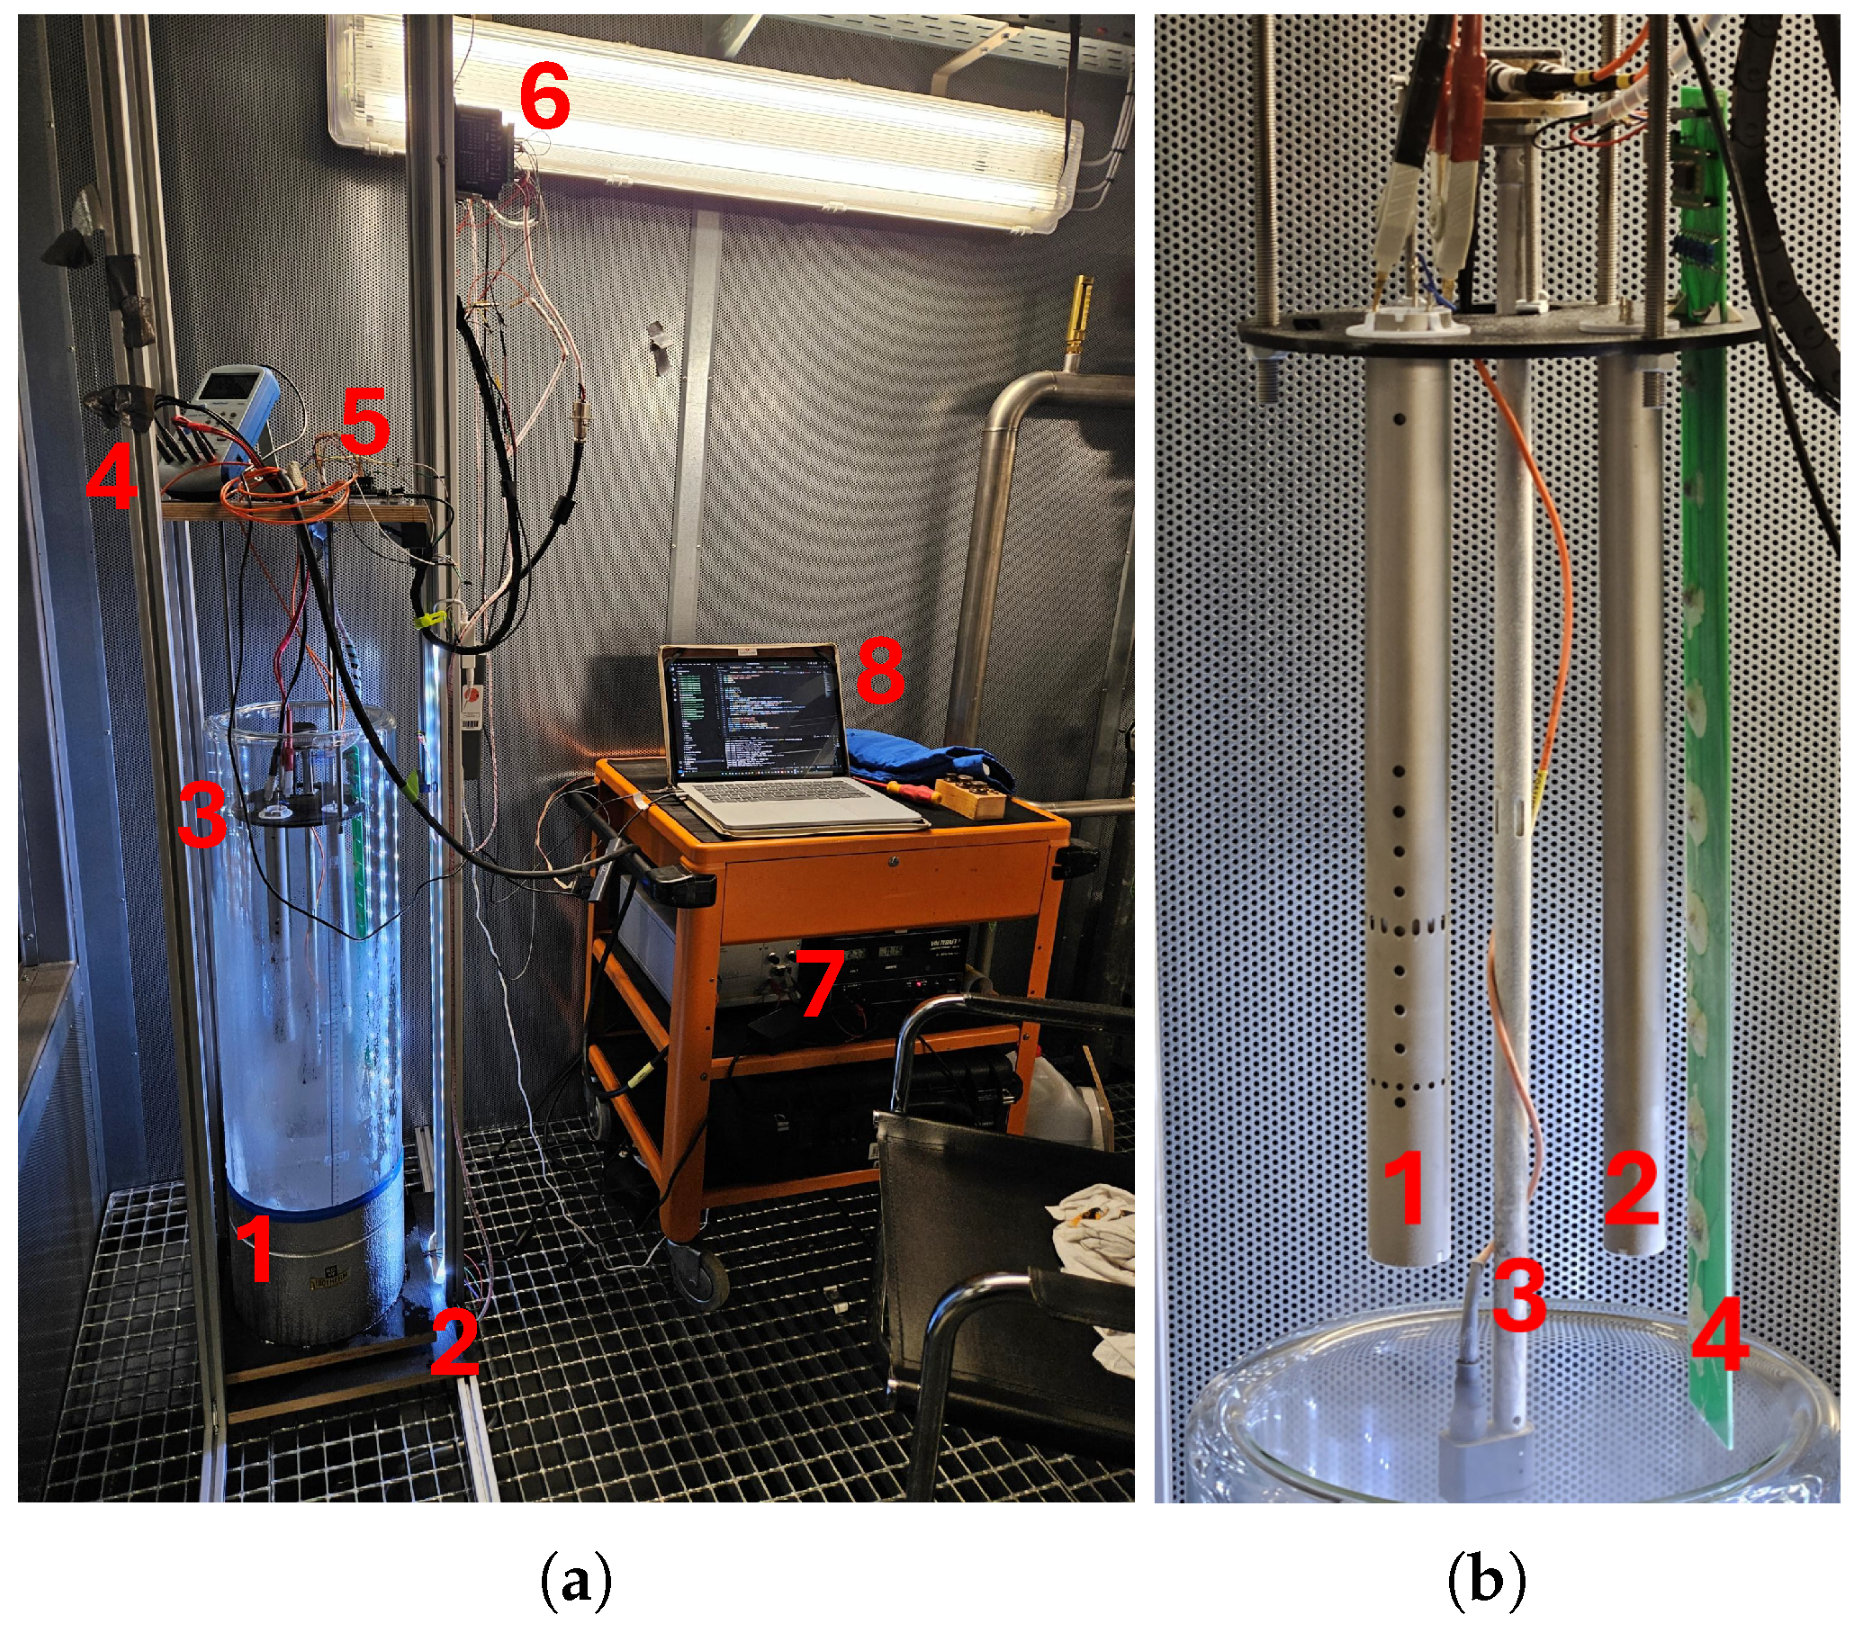
. This configuration not only enables precise sensor submersion, automated cycling, and data acquisition at varying speeds but also allows for direct observation of the sensors during the submersion process. In addition to manually reading the fill level from a ruler, load cells are utilized to monitor the liquid level and boil-off rate.
Figure 1a shows the complete testbed setup.
Figure 1b shows a close-up of the sensor platform with the attached probes. A stray field capacitance probe was tested in an individual setup.
3. Capacitance Probes
Capacitive probes measure the fill level in a tank by detecting changes in capacitance, which is proportional to the dielectric constant of the medium between the probe’s electrodes. Since the liquid and gaseous phases of a medium exhibit different dielectric constants, the fill level can be derived directly. However, the dielectric constant of an element is highly dependent on its density; therefore, this gauging method is only accurate if the pressure and density distribution within the tank is known.
Regarding hydrogen, the difference in permittivity between gaseous and liquid hydrogen (
at
,
,
at
,
) [
16] is approximately five times smaller than that between kerosene (
) and air (
). This results in reduced sensitivity if the same sensor layout is applied.
One limiting factor regarding accuracy is the electronics used to measure the capacitance. In this setup, the
PeakTech® P 2170 LCR-/ESR-Meter [
21] was used at a measurement frequency of
, which provides a specified accuracy of
relative to the measured capacitance plus
over the measurement range. For the interface, Kelvin terminals were used in combination with electromagnetically shielded cables.
3.1. Cylindrical Probes
Various sensor capacitance sensor layouts can be facilitated; however a commonly used design contains two conductive cylinders as the electrodes, for which Equation (
1), as follows, can be used to calculate the expected sensitivity. In this formulation,
denotes the capacitance as a function of the liquid level
h,
is the vacuum permittivity, and
and
represent the inner and outer radii of the cylindrical electrodes, respectively. The relative permittivities of the gas and liquid are denoted by
and
, while
H represents the total sensor height.
To increase the sensitivity of a capacitance probe, several design modifications can be considered: enlarging the diameters of the cylindrical electrodes, reducing the gap between them, or introducing additional cylinders to form a multi-cylinder configuration. However, requirements regarding the minimum permissible gaps must be observed, both to avoid capillary effects and to prevent electrical arcing. Furthermore, due to spatial constraints, increasing the electrode diameters is not always feasible. Formula (
2) shows the sensitivity of a multi-cylinder capacitance probe where every second cylinder is electrically wired in parallel with a total number of
i cylinders.
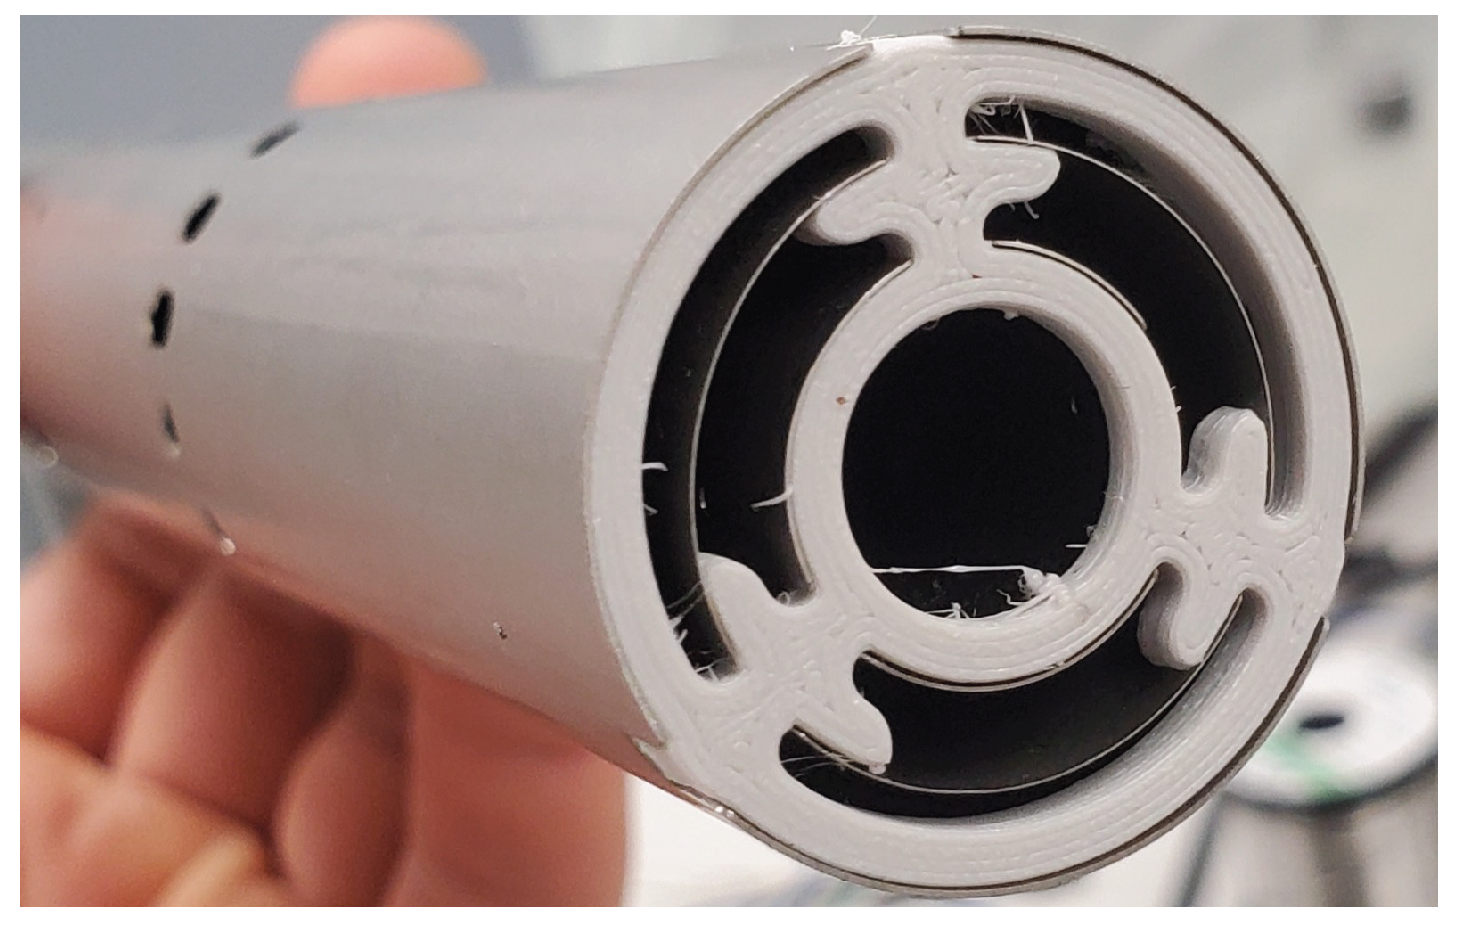
In this experiment, two-cylinder and three-cylinder probe configurations were investigated. The sensors consist of stainless steel cylinders equipped with 3D-printed PETG spacers at the top and bottom, as shown in
Figure 2. The top spacer features integrated mountings for conductive pins to facilitate the attachment of LCR meter clamps. Each sensor has a length of
. The diameters for the configurations are
and
, with an additional
cylinder utilized for the three-cylinder setup. The wall thicknesses of the cylinders range from
to
.
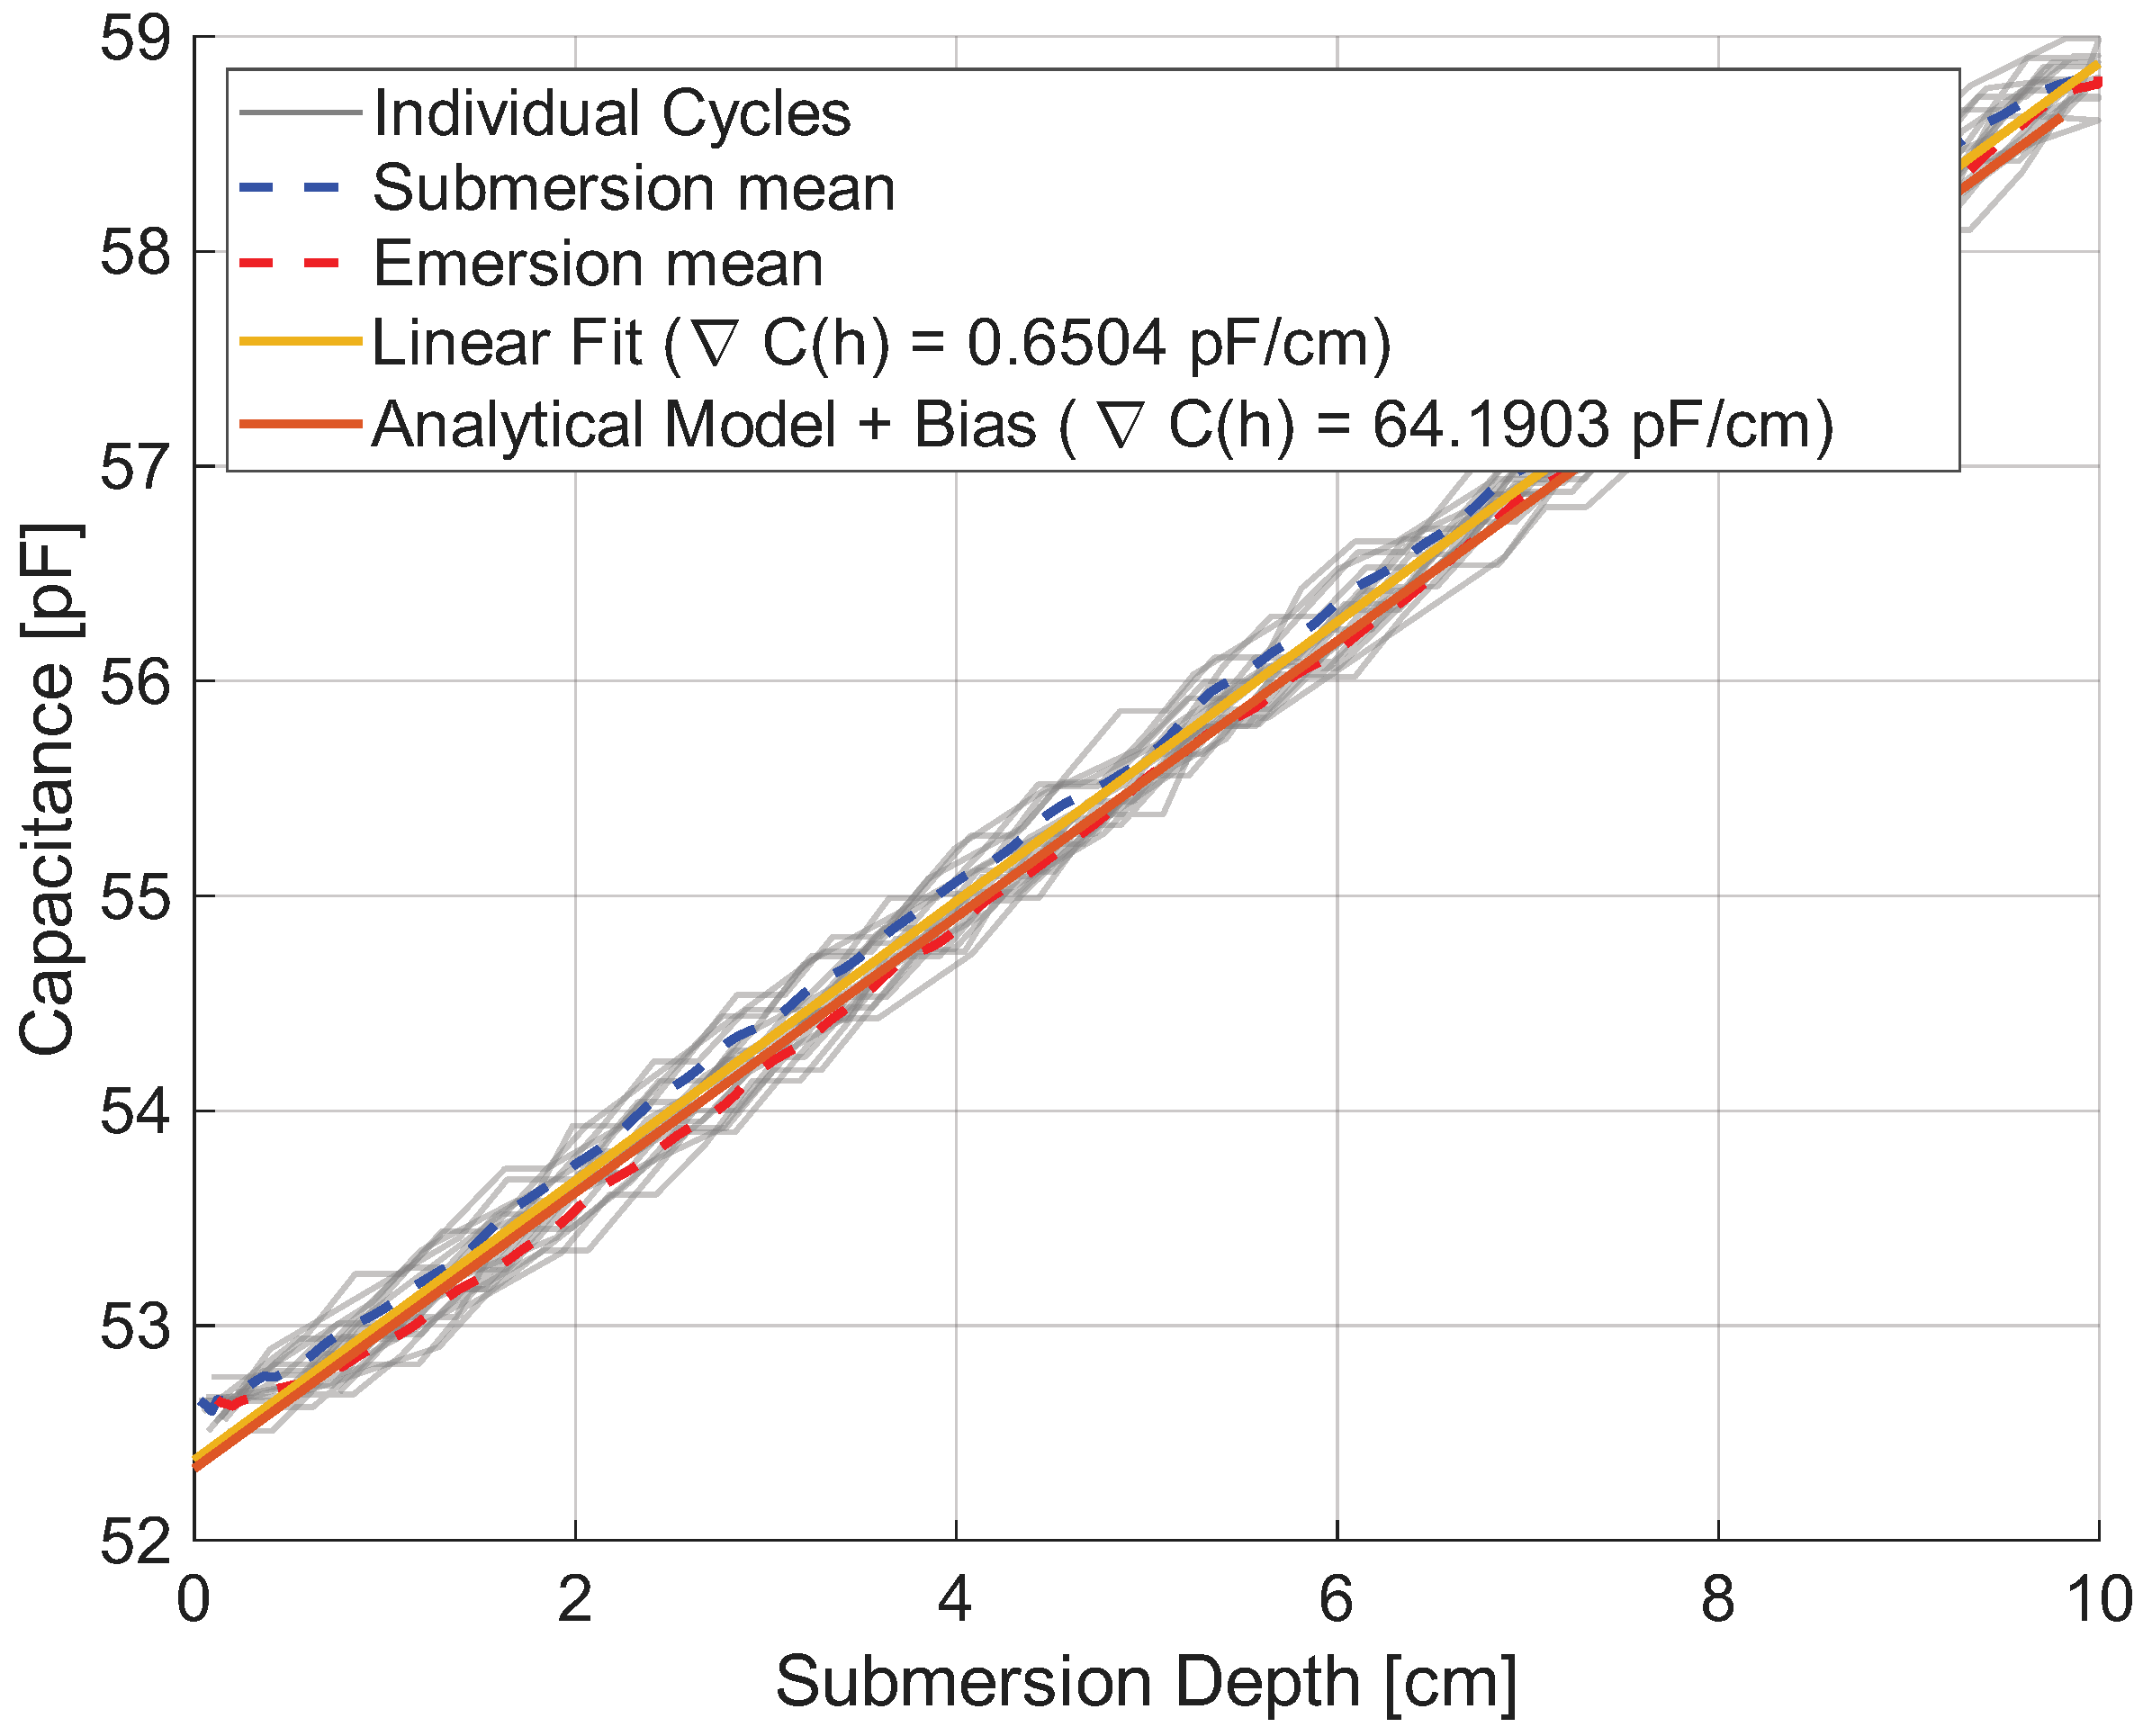
The probes were submerged in LN
2 for 20 cycles at a constant velocity of
, with a
dwell time at the maximum and minimum positions. As shown in
Figure 3, the experimental measurements align closely with the predicted capacitance variations calculated using Equation (
1). Furthermore,
Table 2 details the achievable accuracies based on the standard deviation of the measured signal.
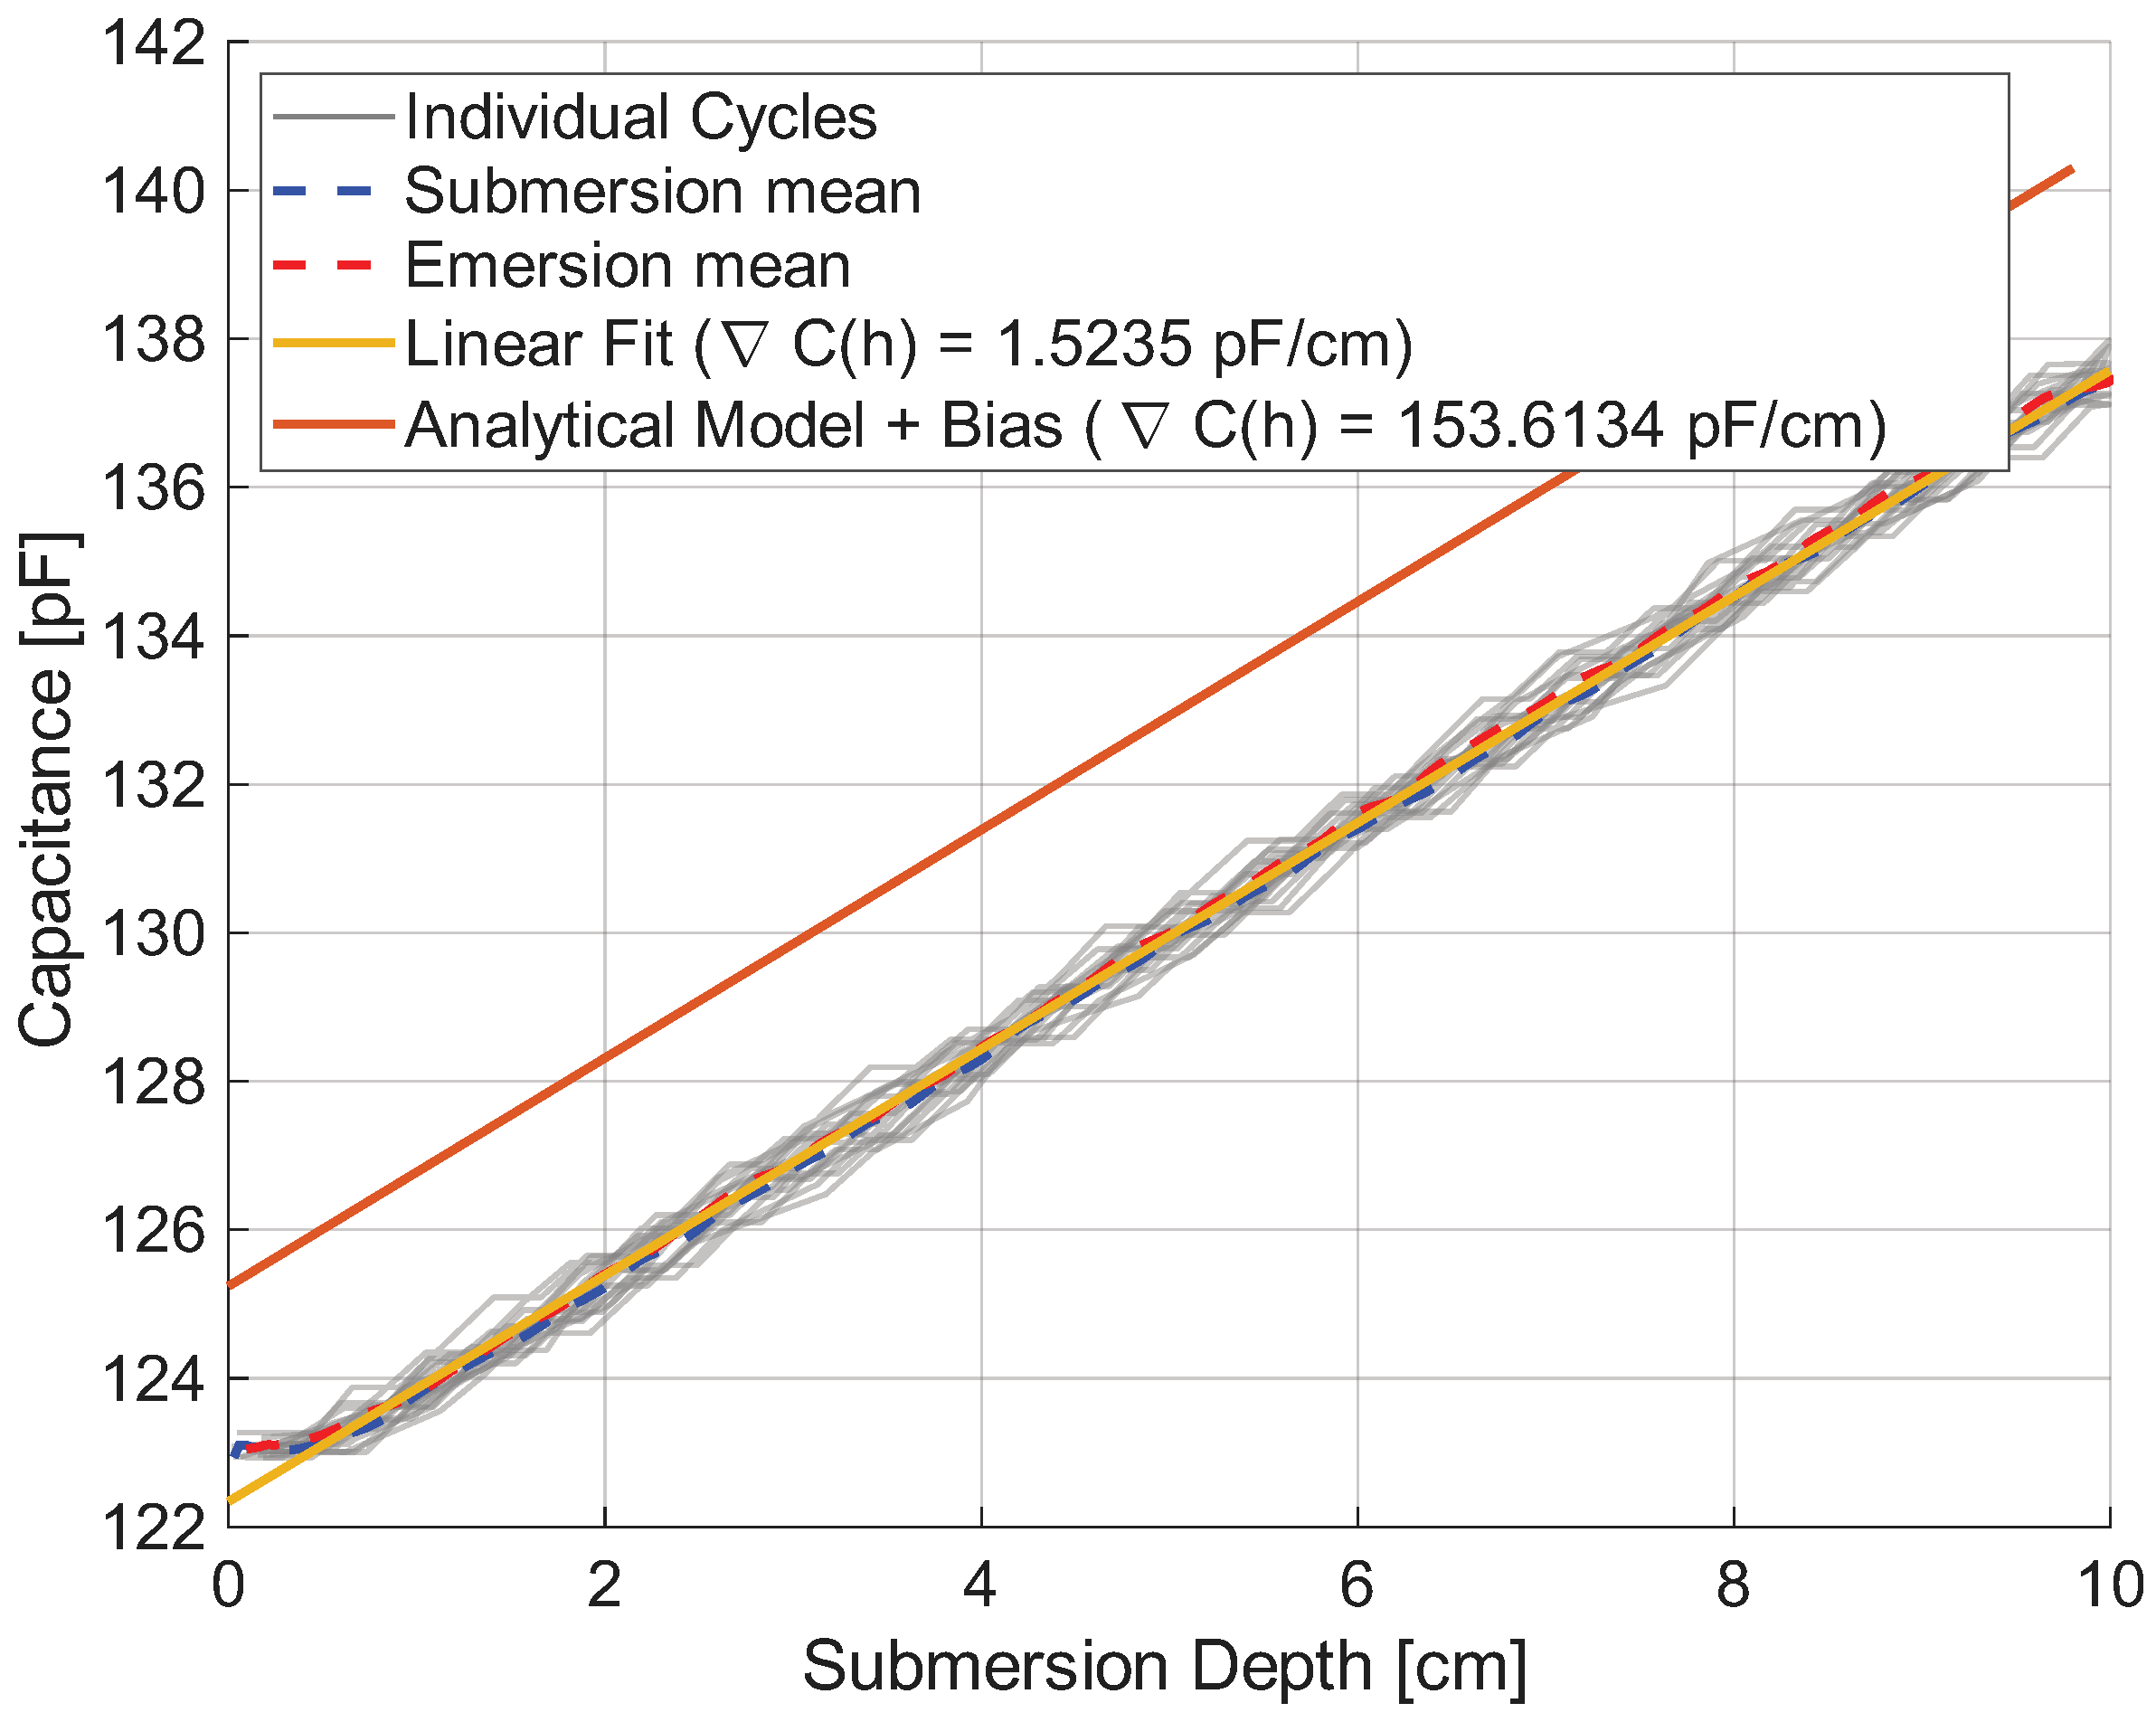
Similarly, the sensitivity predictions derived from Equation (
2) remain valid for the 3-cylinder capacitor, as demonstrated in
Figure 4. However, a static offset is observed, which is most likely attributed to parasitic capacitance originating from the uninsulated cables used to connect the outer and inner cylinders. This offset can be readily calibrated; therefore, it does not adversely impact the overall sensitivity of the system.
It is observed that the capacitance does not increase immediately upon submersion. This delay is likely attributable to the design of the bottom spacer, as shown in
Figure 2, which prevents the presence of liquid between the two outer cylinders where the space is placed.
3.2. Fringing Field Sensor
Electrical fringing field sensors measure changes in the permittivity, primarily within the electric field above the electrodes rather than between them. One benefit is that these sensors allow for more flexible configurations than cylindrical sensors; in some cases, measurement through thin walls is also possible, enabling a non-invasive sensor design. However, for future lightweight
aircraft tanks, external measurement is not feasible as the composite walls are conductive and thus prevent electric field penetration [
22]. Furthermore, by using multiple electrodes, one can gain information not only about the fill level but also about the liquid distribution within a tank. This method is known as electrical capacitance tomography (ECT) [
23].
The sensitivity of a fringing field sensor with a pair of straight parallel electrodes can be estimated using Equation (
3) [
22]. This formula approximates the electrical fringing field by considering only the elliptic part of the field, where
represents the geometric capacitance factor. Here,
w denotes the electrode width and
a represents the half the width of the gap between the electrodes. It can be observed that the sensitivity is governed primarily by the geometric ratio of electrode width to electrode spacing. Increasing the electrode width or decreasing the gap therefore improves sensitivity because it increases this ratio. However, the absolute dimensions control the electric-field penetration depth normal to the electrodes: scaling either width or gap down reduces the penetration depth. Consequently, for a sensor with a fixed overall area, the sensitivity can be further increased by implementing multiple electrode pairs; however, this also leads to a reduced penetration depth.
The expected capacitance for varying fill levels can be calculated analogously to Equations (
1) and (
2), as shown in Equation (
4). As (
3) only denotes the expected change in and not the absolute capacitance, the offset value
, that needs to be experimentally determined, must be added to Equation (
4).
A fringing field sensor was designed featuring a
wide central electrode and two
wide outer electrodes, separated by a
gap. The electrodes are mirrored on the backside of the sensor, which can be utilized either to increase sensitivity or to serve as shield electrodes. The sensor has a total length of
and was submerged to a depth of
.
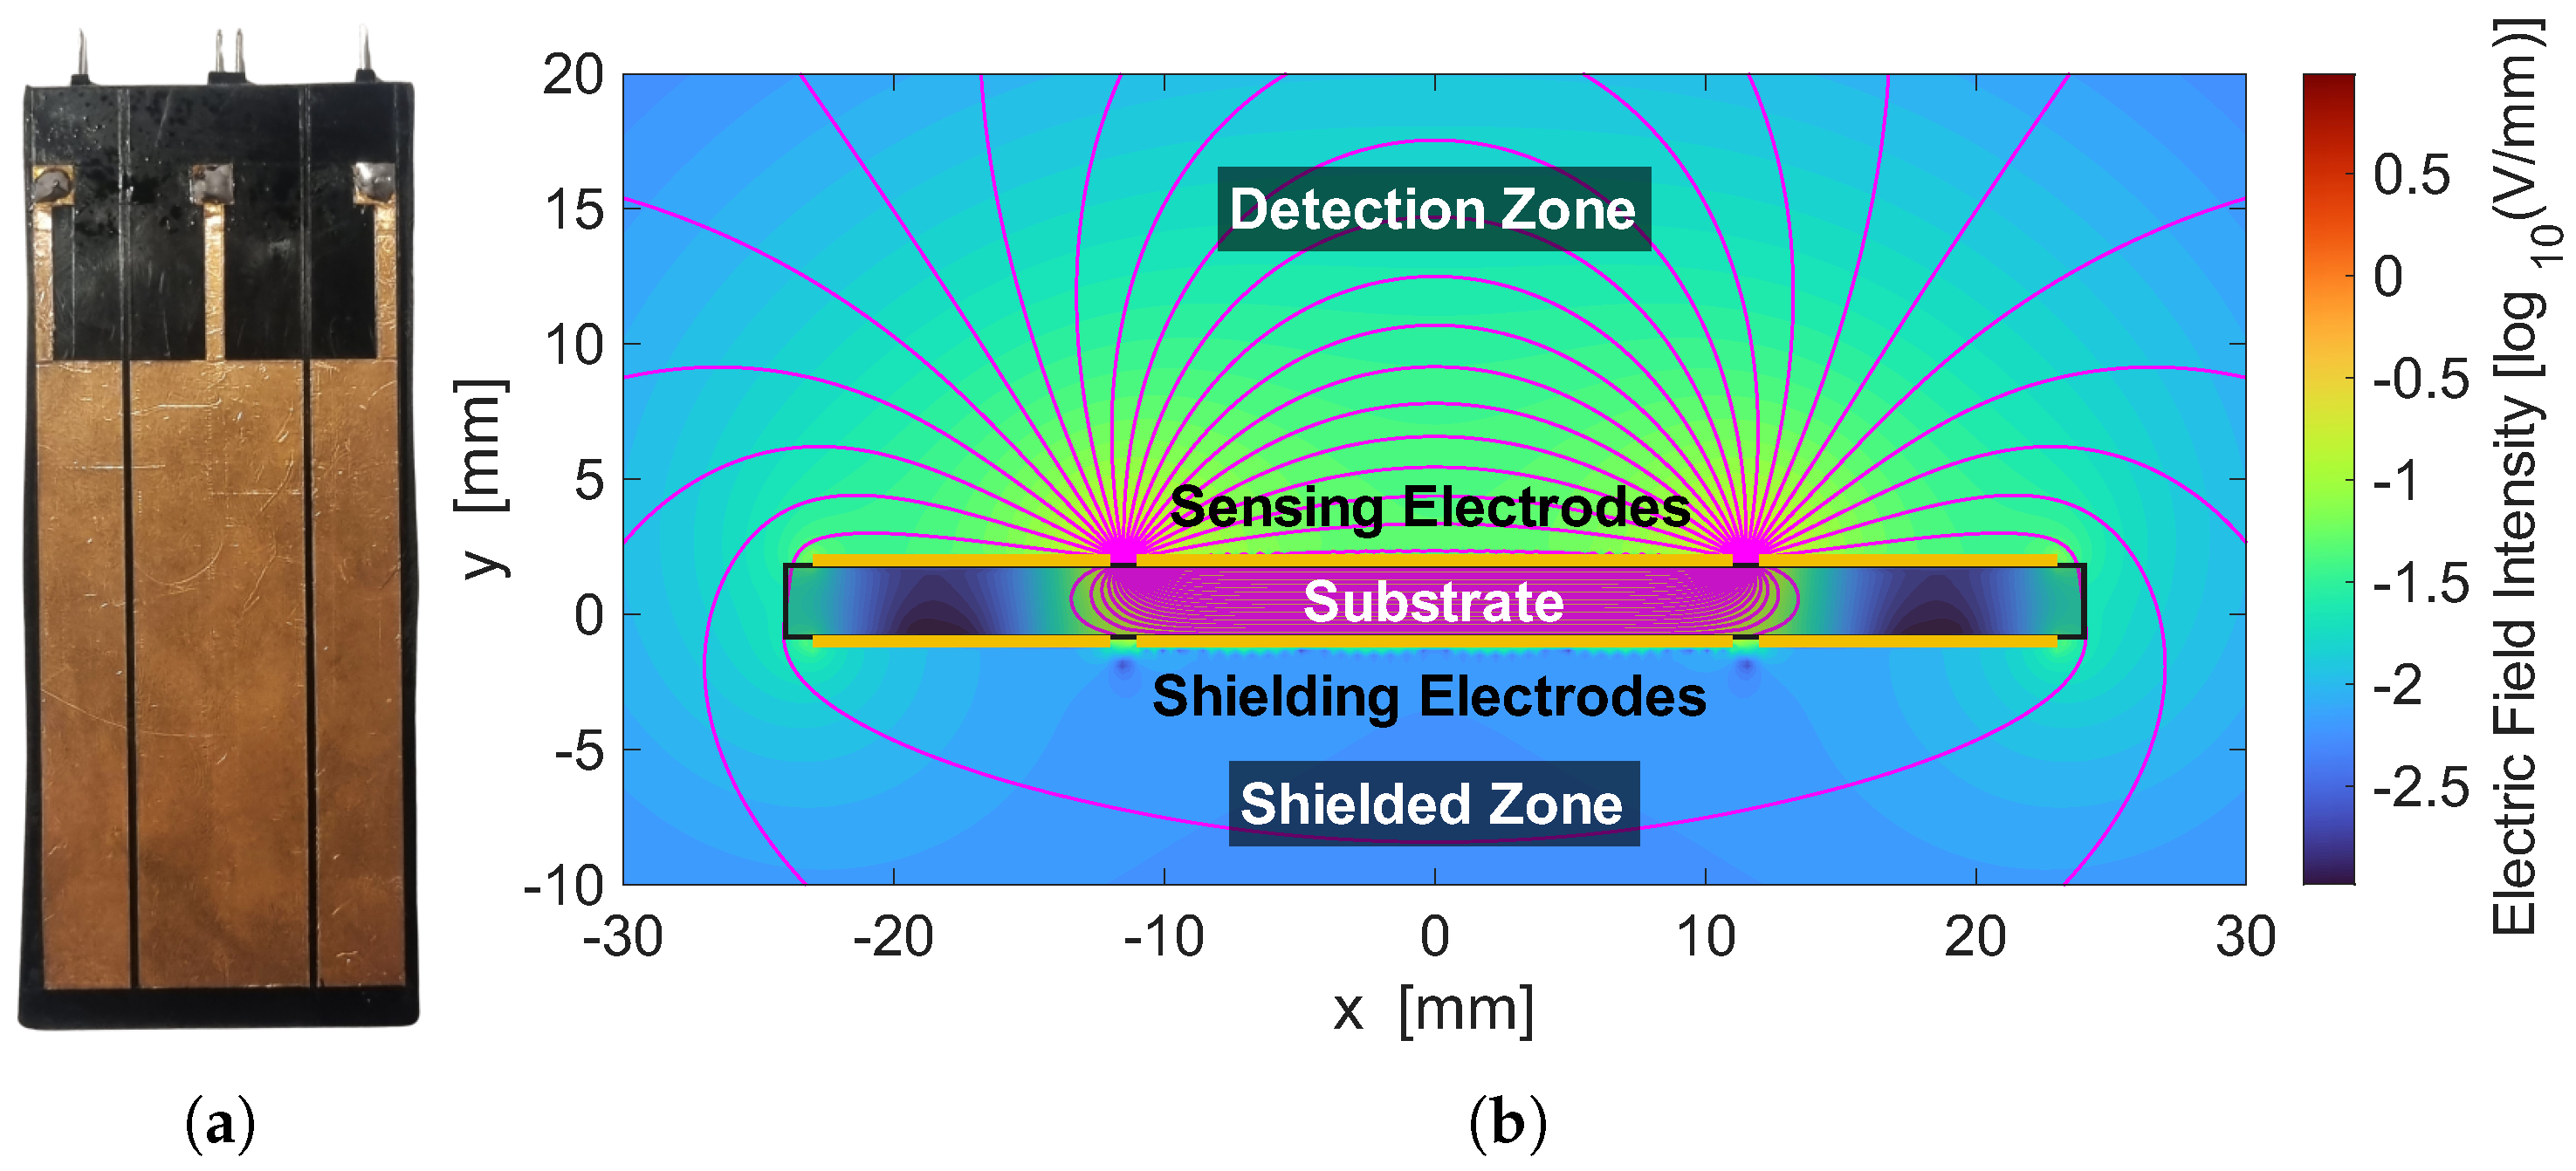
Figure 5a shows the fringing field sensor.
Figure 5b illustrates the working principle. Setting the outer sensing and shielding electrodes to the same potential reduces backside sensitivity, thereby minimizing the impact of environmental noise. For this schematic the central sensing electrode was set to 1 V while other electrodes were set to 0 V.
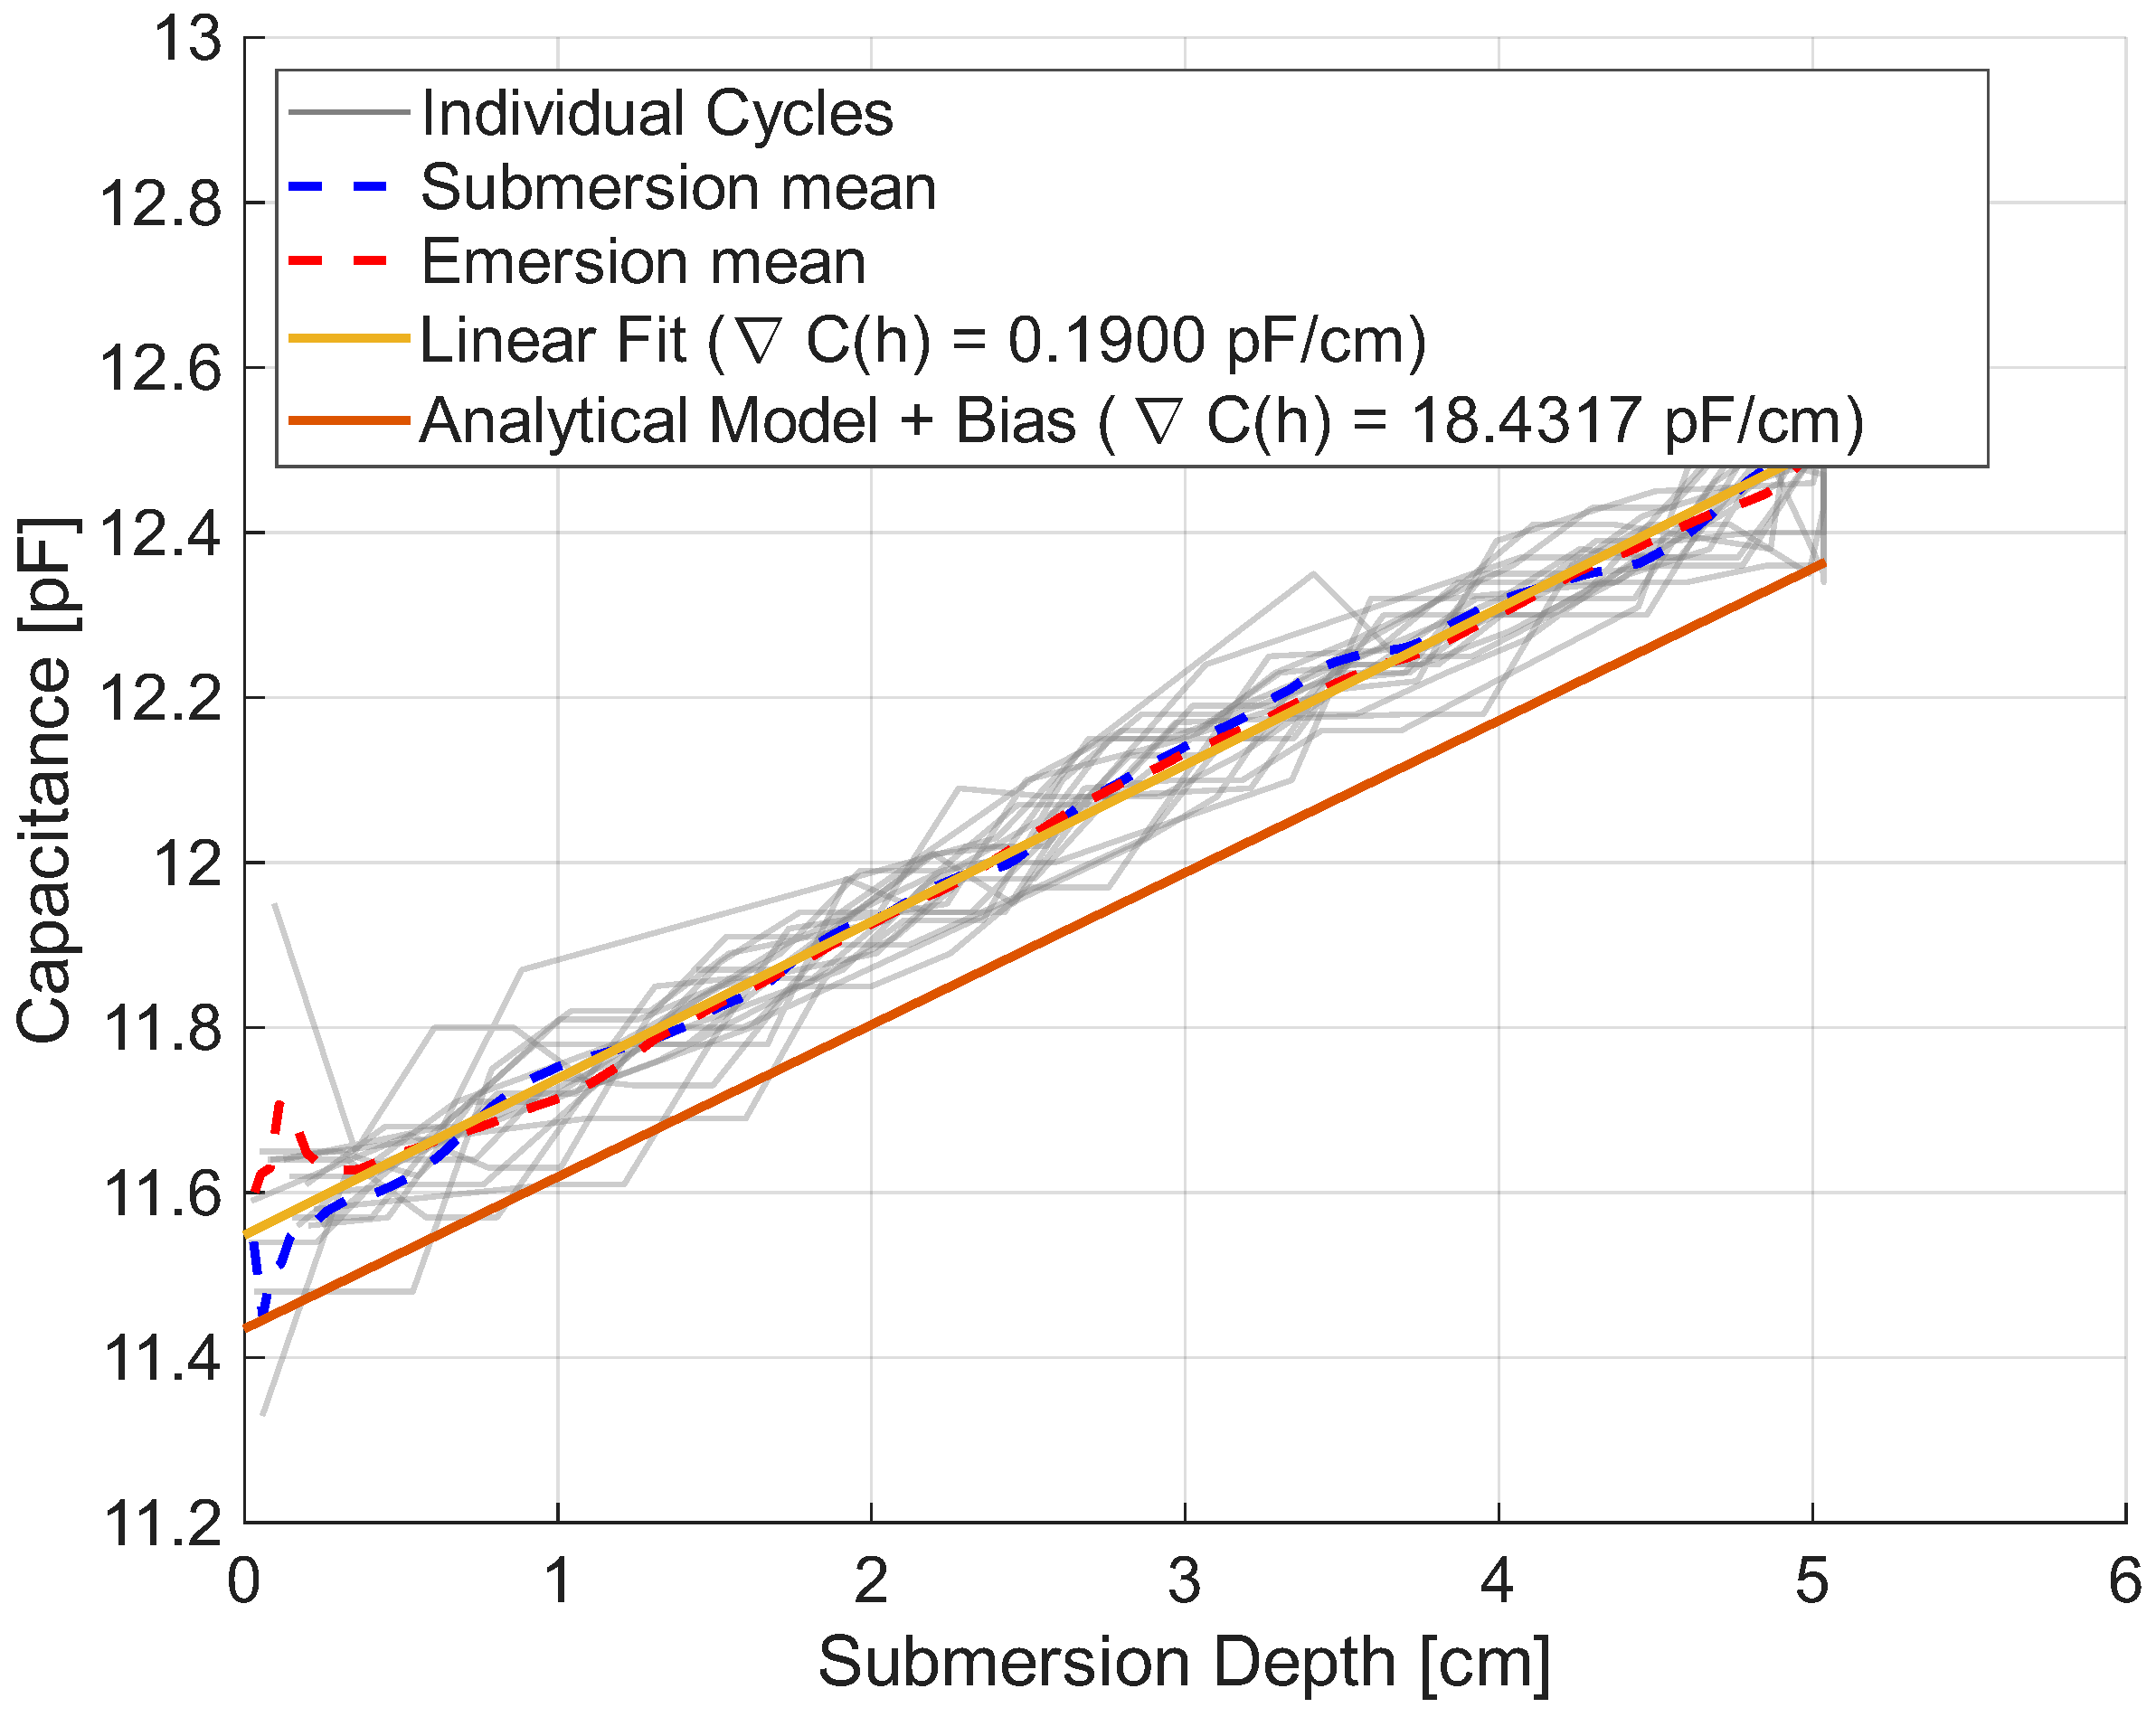
Figure 6 shows that while the fringing field sensor is less sensitive than the cylindrical probes, the fill level can still be clearly observed. Furthermore, the analytical Equation (
3) was able to predict the sensitivity well; however, the static offset was relatively large. In
Figure 6, the analytical plot was shifted upwards by
to fit the figure without decreasing the resolution. Additionally, the standard deviation was significantly larger than that of the cylindrical probes, as shown in
Table 2.
Possible methods to optimize the fringing field sensor include using more complex geometries, such as an interdigital “comb” structure with multiple fingers, which will be implemented in a future iteration.
3.3. Evaluation and Comparison of Capacitance Sensors
To evaluate and compare the performance of the presented capacitive probe designs, the global root mean square deviation (
) is computed using Equation (
5). Here,
M represents the number of measurement cycles,
N is the number of sample points per cycle, and
is the expected capacitance at the submersion depth index
i. The reference value
is determined by applying a constant bias correction to the analytical model, ensuring that the theoretical capacitance matches the mean experimental sensor reading at zero submersion depth (
). This baseline adjustment accounts for the initial calibration of the sensor, while the evaluated sensitivity relies strictly on the underlying physics of the analytical model.
The signal-to-noise ratio (
) can be calculated by deviding the global average signal reading
by the
as a measure of signal noise as shown in to Equation (
7).
The total fill level resolution (
) can then be calculated using the
, the accuracy of the measurement equipment (
) which in this case is
relative to the measured capacitance plus
[
21] and the sensitivity of the sensor
, expressed in
, as shown in Equation (
8). To calculate the relative accuracy of the measurement equipment, the maximal expected capacitance
for each sensor was used.
Table 2 shows that all sensor designs satisfy the requirement of a resolution better than
, at least for
. The expected sensitivity for operation in
is calculated for the 3-cylinder probe using Equation (
2), and a resolution of
is achieved, assuming an equivalent
and equipment resolution. However it must be stated that the assumption of an equivalent
for hydrogen is not verified and needs further investigation.
It can be observed that while the 3-cylinder probe exhibits a
increase in sensitivity, as shown in Equation (
9), the noise levels are also increased. This results in only a marginally better
and fill level resolution. These findings suggest that the noise is likely not caused by the measurement equipment, but rather by actual fluctuations in the liquid, such as bubbles caused by boiling.
The fringing field sensor has a significantly lower
than the cylindrical probes, which was to be expected. However, the measurement’s overall accuracy remains satisfactory.
4. Resistive Temperature Device
Resistive Temperature Devices (RTDs) can be used to track the liquid–gas interface by introducing a small heat pulse and subsequently measuring the rate at which the temperature returns to equilibrium. Passive RTDs that are not heated externally can also be used for fill level detection with cryogenic liquids; however, as the liquid and gas near the interface are at nearly the same temperature, this method lacks precision. Nevertheless, RTDs are commonly used as discrete fill-level sensors in many cryogenic applications, including space missions [
4]. According to the literature, the heating pulse typically requires approximately
of electrical power to clearly identify if the RTD is submerged or not [
24].
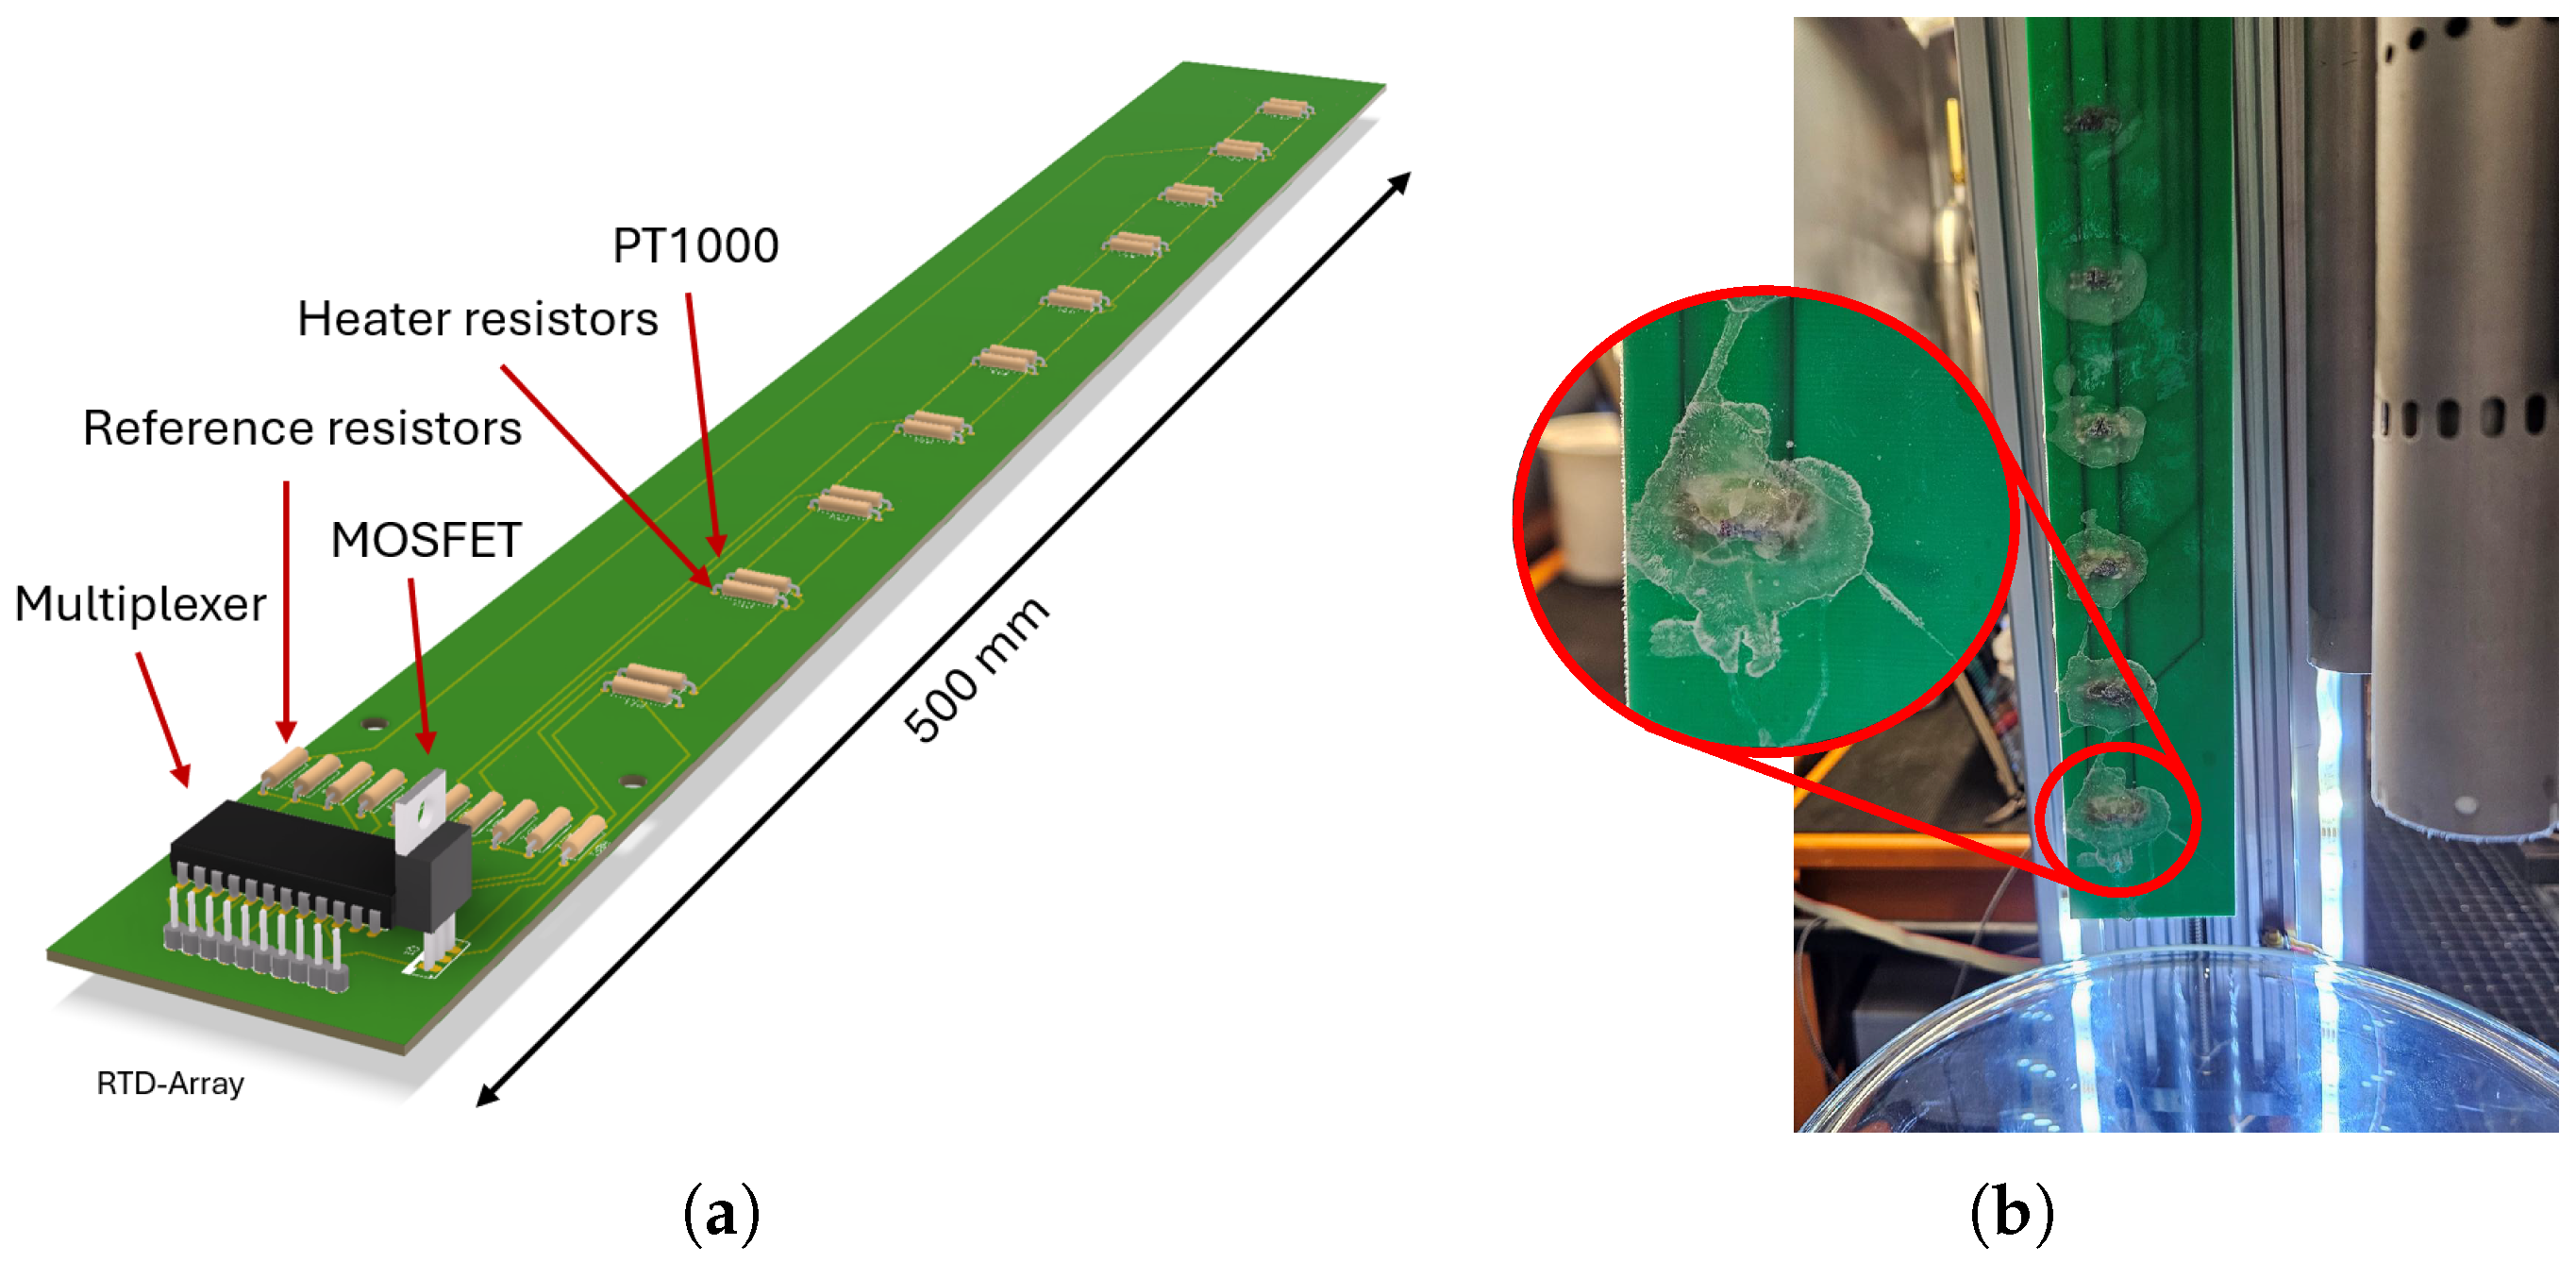
For this work, a RTD rake was designed, facilitating a PCB as shown in
Figure 7a, utilizing ten PT-1000 elements [
25]. Next to each PT-1000 a
resistor serving as a heating element is placed. A MOSFET is employed to provide the resistors with a voltage of
during the heating phase, resulting in a heating power of
per element.
The sensor/heater pairs were covered with thermally conductive paste and subsequently encapsulated in epoxy to hermetically seal the exposed conductive parts.
Figure 7b shows the RTD probe after
submersion. While some cracks in the epoxy can be observed, the performance of the RTDs was not negatively affected. Furthermore, the PCB showed no signs of fatigue at the material interfaces between the conductive paths and the substrate.
Due to a common ground line shared by the heating elements and the PT-1000 sensors, a parasitic voltage drop of
was observed in the sensor voltage supply line during active heating phases. This systematic error was compensated during post-processing to ensure data integrity. The conversion of raw digital counts to voltage values is performed according to Equation (
10), utilizing an analog-to-digital converter resolution (
) of 1024 and a nominal supply voltage (
) of
.
Using the voltage divider, Equation (
11), the actual resistance of the PT-1000 elements were calculated, where
represents the reference resistors with
.
The temperature
T is calculated based on the resistance
R using the Callendar–Van Dusen Equation (
12), where the numerical values for
A,
B and
C originate from the IEC 60751 [
26] international standard.
Since Equation (
12) cannot be solved analytically for
T, a Newton–Raphson scheme is employed. The iterative update rule is defined as:
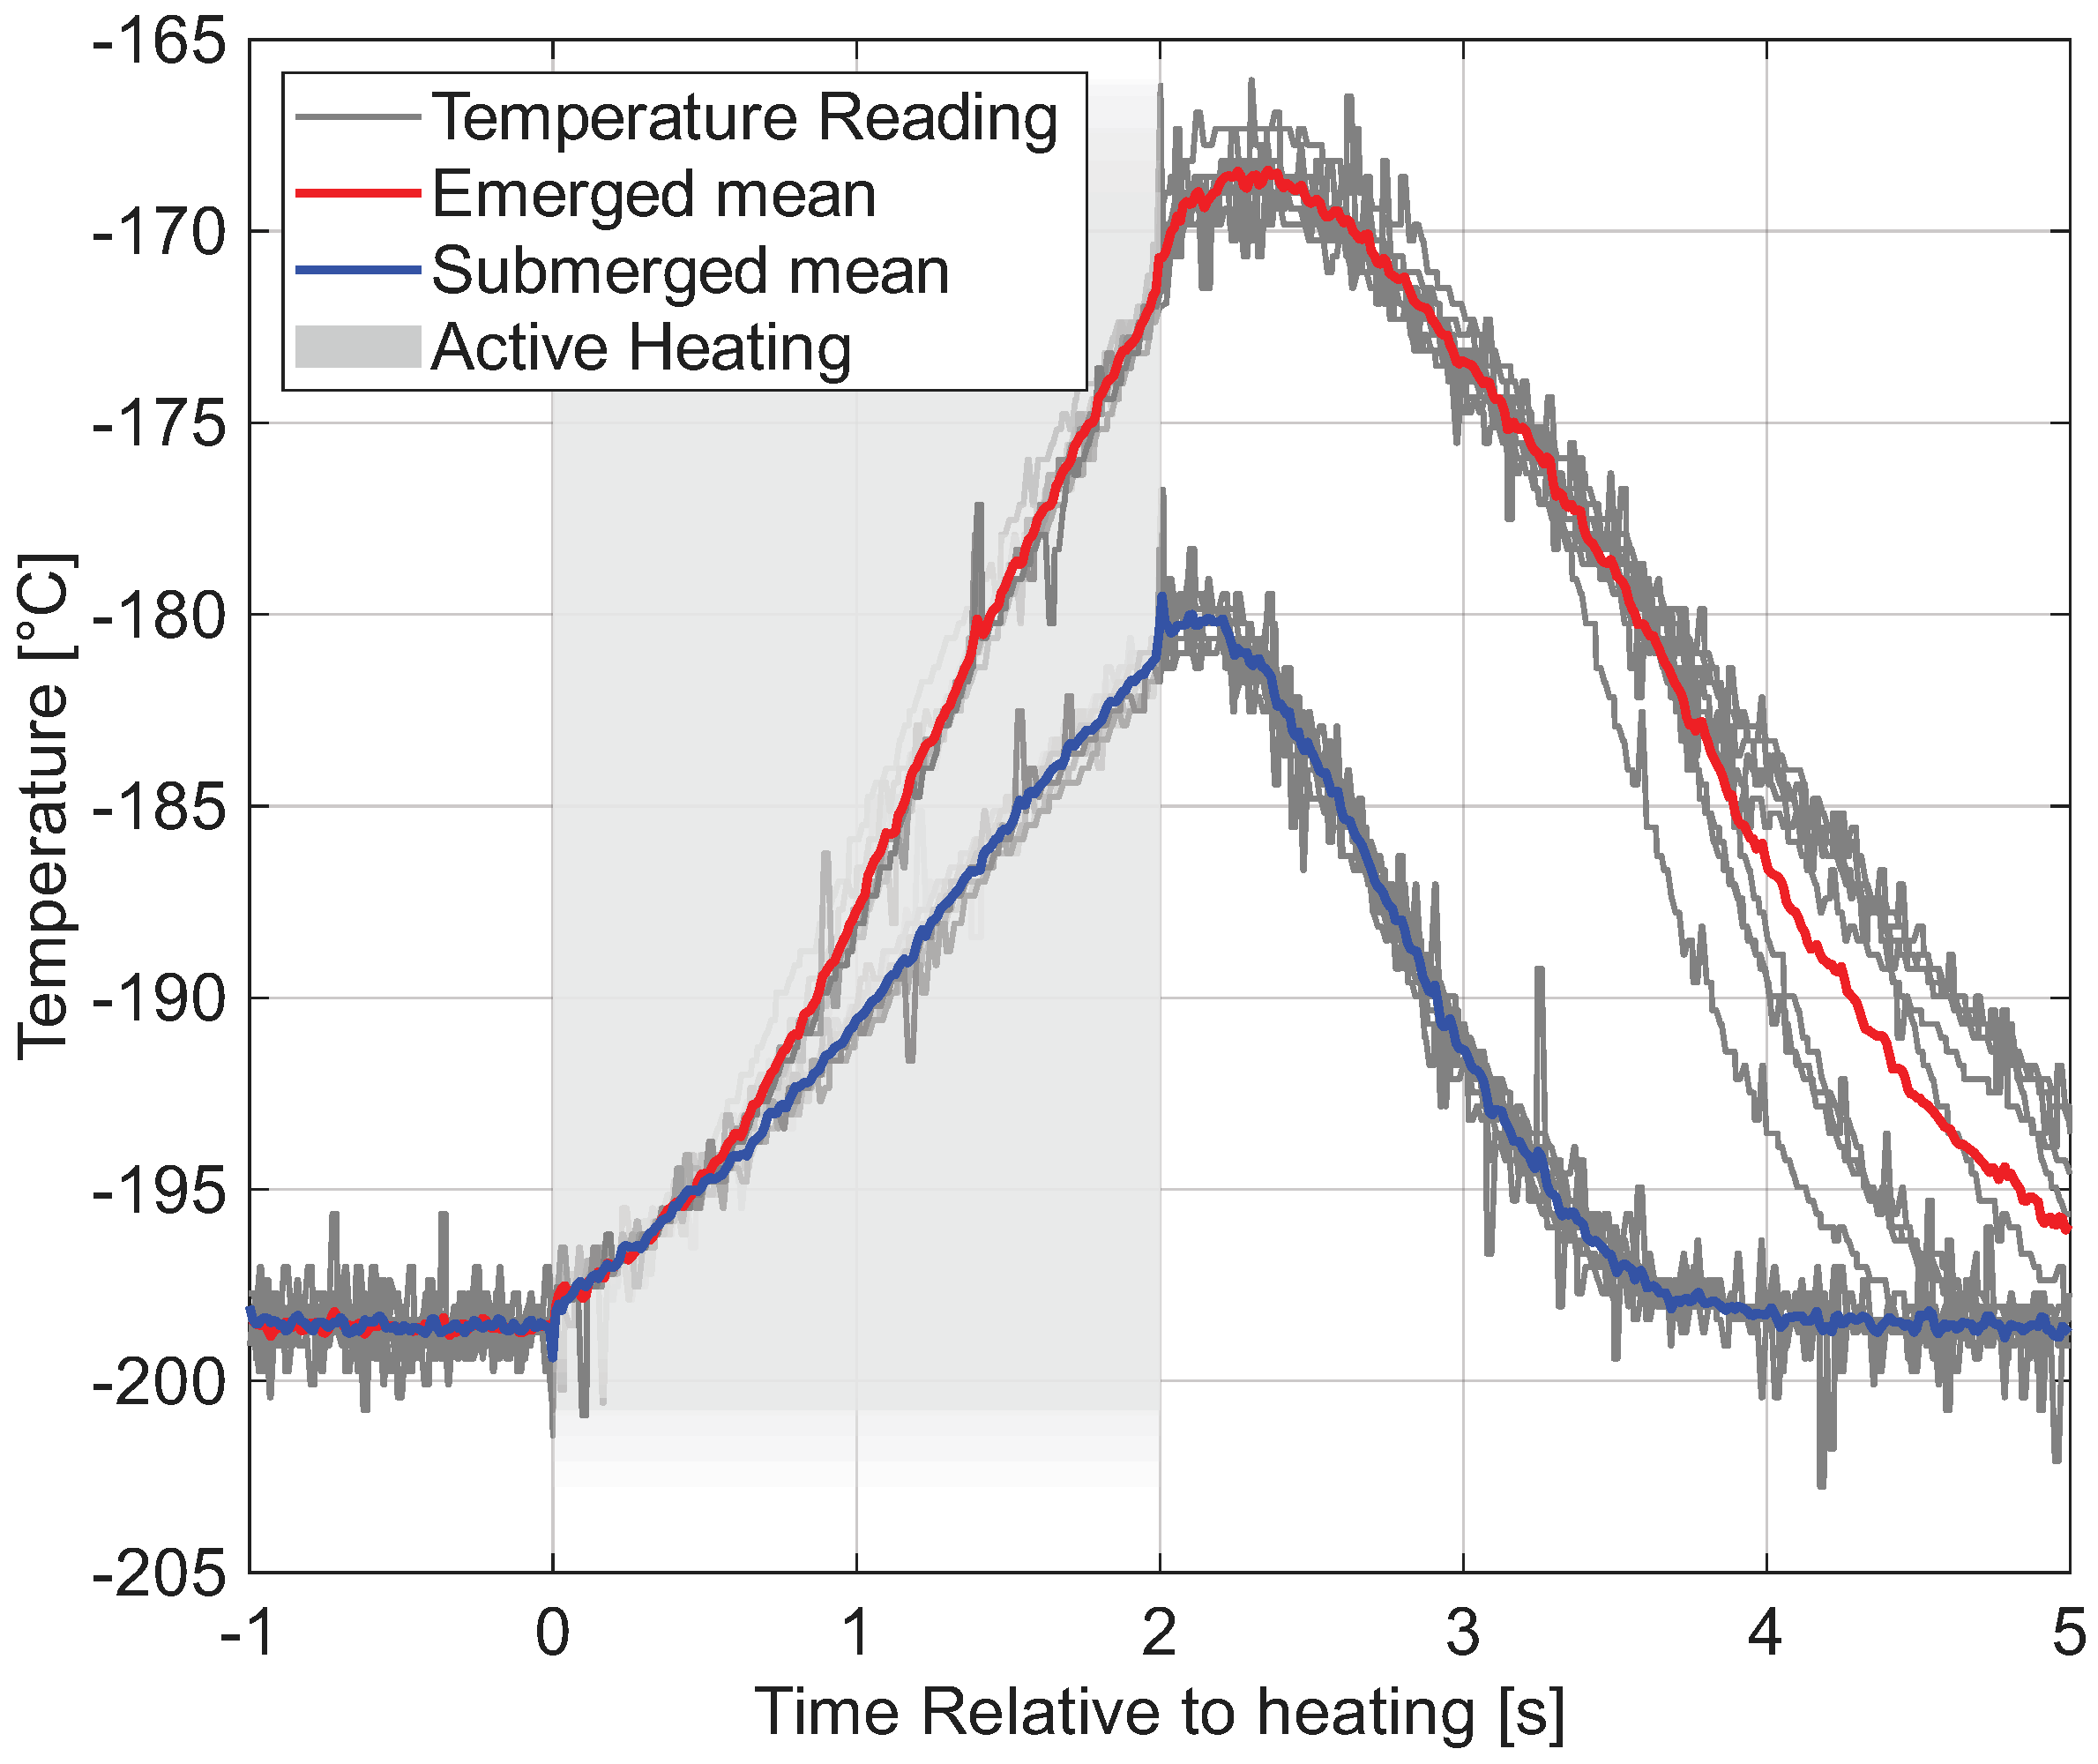
Figure 8 illustrates the temperature response of a single PT-1000 element subjected to 20 cycles of submersion in
followed by withdrawal to a height of
above the liquid surface. No additional calibration was performed; the use of standard coefficients in Equation (
12) resulted in a 2 °C offset, as the measured temperature in
was −198 °C rather than the expected −196 °C. This could have been compensated for by performing a multi-point calibration; however, as the focus of this work is tracking the liquid–gas interface rather than accurate temperature measurement, this has been neglected.
A thermal pulse of was applied to each sensor for a duration of . It was observed that the state of submersion can be clearly distinguished within of heating, negating the need to analyze cooling rates to identify the gas–liquid interface. However, this distinction may become less pronounced at lower heating powers, which needs further investigation. Additionally, the temperature readings during the cooldown phase exhibit greater variance when the sensor is emerged compared to when it is submerged. This deviation may be attributed to residual liquid adhering to the sensor surface upon emersion or splashing from the boiling liquid surface.
5. Optical Absorption Level Sensor
A variety of optical sensor designs can be used to detect the liquid–gas interface of cryogenic liquids. A common method involves the use of Fiber Bragg Gratings (FBG), which utilize laser light reflected by periodic gratings within an optical fiber. A single fiber can contain hundreds of gratings, each with a unique spectral signature that shifts as the fiber expands or contracts in response to temperature changes. This enables discrete, high-resolution measurements of strain and temperature [
27]. Similar to the RTD probe, the FBG sensor requires active heating to distinguish between phases at the interface. In this work, an optical sensor based on the principle of absorption is investigated.
The optical absorption sensor consists of a laser interferometer that emits laser pulses at wavelengths of and , respectively. These pulses are guided through optical fibers to the probe, where they are redirected by a prism to propagate freely through a hollow steel cylinder. The pulses are then collected by a second prism and fed back through a fiber into the interferometer. A change in the optical absorption properties of the medium present within the cylinder leads to a measurable change in the amplitude of the returning signal.
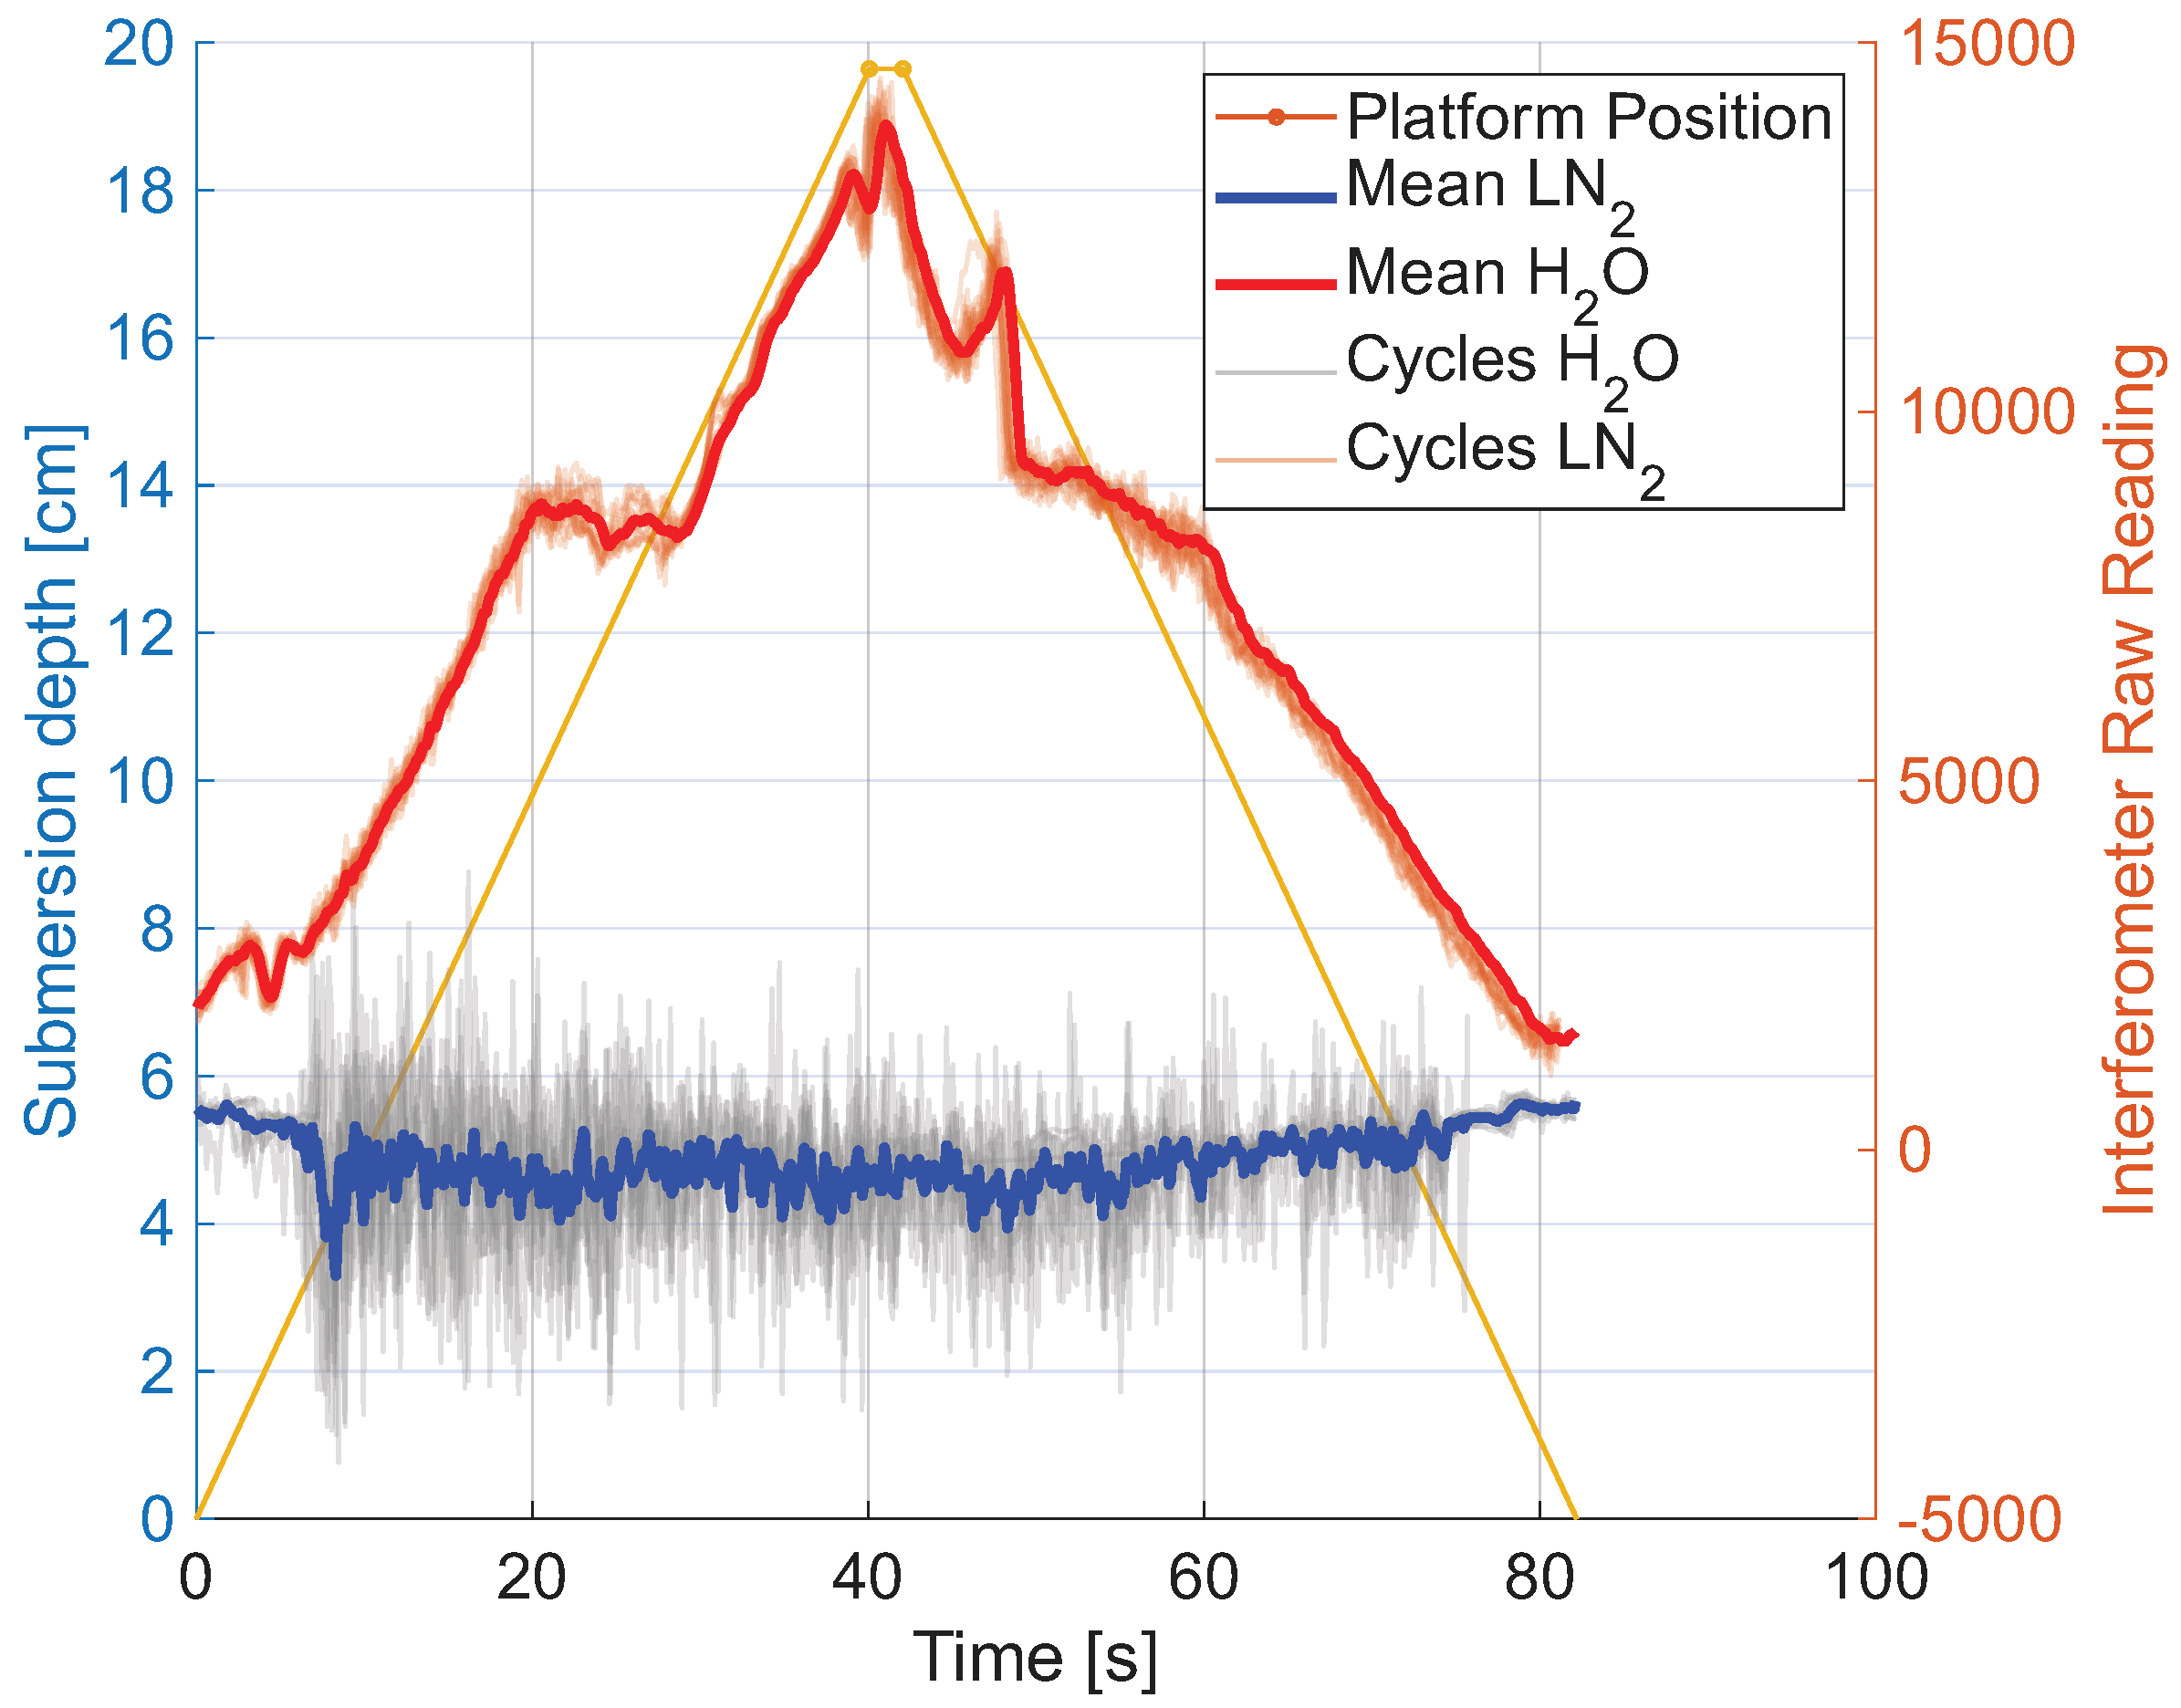
This sensor was originally designed for gauging kerosene rather than cryogenic media. While prior tests demonstrated the sensor’s ability to reliably detect water fill levels, experiments with LN2 revealed no significant correlation between the measured signal and the submersion depth. This is to be expected as although both water and LN2 are transparent in the visible spectrum, water becomes opaque in the near-infrared (NIR) spectrum where the sensor operates, whereas nitrogen remains transparent. Besides molecular absorption, other phenomena like micro-boiling in the liquid phase could theoretically increase the refractive scattering, allowing for a correlating signal reading and submersion depth; however, no significant correlation could be observed.
Figure 9 illustrates the raw sensor readings over 20 submersion cycles in both water and LN
2. The abrupt jumps in signal intensity observed between
and
submersion depth during the water tests are attributed to capillary effects within the cylinder; these were steadily reproduced across all 20 cycles.
Alternative wavelengths, particularly towards the ultraviolet range, may be required to utilize this method for LN
2 sensing [
28]. Furthermore, it was observed that the relatively large thermal mass of the steel cylinder, compared to capacitive probes, induced vigorous boiling upon submersion. Subsequent testing confirmed the sensor’s continued functionality with water, indicating that no permanent damage occurred during cryogenic exposure.
6. Conclusions and Outlook
In this work, a testbed for cryogenic liquid level gauging was developed, utilizing a transparent cryostat and a vertical linear actuator with an vertical positioning accuracy of . Various capacitive sensor designs were evaluated, demonstrating that they can reliably monitor LN2 levels with characteristics closely matching analytical predictions. While a 3-cylinder coaxial capacitor demonstrated an increase in sensitivity compared to the 2-cylinder configuration, it only demonstrated an increase in the . The observed variance in measurements was primarily attributed to physical fluctuations in liquid distribution rather than the resolution limits of the capacitance measurement electronics. Effectively, the addition of the third cylinder improved the fill-level resolution by only , resulting in a resolution of . In most applications, this marginal gain does not justify the increased mechanical complexity and weight of the sensor. Furthermore, achieving a measurement accuracy better than is unlikely to provide practical benefits due to capillary effects and the inherent boiling of the cryogenic liquid. Furthermore, no challenges regarding differential thermal contraction were observed at the material interfaces between the PETG spacers and the steel cylinders.
An electrical fringing field sensor was tested in LN2, demonstrating a fill-level resolution of . Future iterations could incorporate an interdigitated comb design with multiple electrode fingers to enhance sensitivity. Fringing field sensors offer expanded design possibilities compared to traditional coaxial probes.
Additionally, a RTD rake was designed and evaluated. The results demonstrate that PT-1000 elements, paired with resistors as heating elements, can reliably detect the liquid–gas interface in LN2 within of a thermal pulse. The PCB substrate showed no signs of material fatigue or cracking. All integrated electronics, including the multiplexer and MOSFET, remained fully functional even when the probe was submerged to a depth where the control circuitry was only centimeters above the cryogenic liquid surface. Tests with an optical absorption sensor that operates with wavelengths of and demonstrated that while it stayed structural and functional intact, it is not suitable to gauge LN2 or LH2 as both liquids do not exhibit a strong electromagnetic absorption coefficient in the near infrared field.
Future research should prioritize testing with LH2 to confirm that the performance characteristics observed in this study remain valid under actual hydrogen conditions. Specifically, the predicted resolution of the 3-cylinder capacitive probe, predicted at for LH2 gauging, necessitates experimental validation. Assuming the predicted accuracy is correct, the required accuracy of would still not be met and a improved sensor design or enhanced measurement electronics are needed.
Furthermore, the development and evaluation of an optimized interdigitated fringing field sensor is recommended to enhance sensitivity. The viability of standard PT-1000 elements, which typically lack certification for operation below −200 °C, should be investigated to determine their suitability as fill-level sensors in LH2.
Enhanced thermal coupling between the heating elements and the PT-1000 elements could significantly reduce the heating power required for accurate level detection. Finally, a critical milestone for flight qualification will involve subjecting the sensors to vibration and mechanical shock profiles while maintaining cryogenic operating temperatures to assess structural and functional integrity.
Author Contributions
A.J.O.W.: Writing—original draft, Visualization, Investigation, Validation, Software, Methodology, Formal analysis, Data curation, Conceptualization. Y.P.: Writing—review & editing, Investigation. K.K.: Writing—review & editing, Resources, Supervision, Project administration, Methodology, Funding acquisition, Conceptualization. All authors have read and agreed to the published version of the manuscript.
Funding
This research was funded by the Federal Ministry for Economic Affairs and Energy.
Data Availability Statement
The data presented in this study are available on request from the corresponding author due to privacy restrictions.
Acknowledgments
The authors would like to thank project partner AUTOFLUG for providing the capacitive and optical sensors. Furthermore, the authors wish to thank their colleagues from various research institutes and industry for the valuable and engaging discussions regarding the challenges of LH2 gauging.
Conflicts of Interest
The authors declare no conflicts of interest.
Abbreviations
The following abbreviations are used in this manuscript:
| ADC | Analog-to-Digital Converter |
| ARINC | Aeronautical Radio, Incorporated |
| ECT | Electrical Capacitance Tomography |
| FBG | Fiber Bragg Grating |
| FQIS | Fuel Quantity Indication System |
| GH2 | Gaseous Hydrogen |
| ISO | International Organization for Standardization |
| LCR | Inductance-Capacitance-Resistance |
| LH2 | Liquid Hydrogen |
| LN2 | Liquid Nitrogen |
| MOSFET | Metal-Oxide-Semiconductor Field-Effect Transistor |
| NASA | National Aeronautics and Space Administration |
| NIR | Near-Infrared |
| PCB | Printed Circuit Board |
| PETG | Polyethylene Terephthalate Glycol |
| RFMG | Radio Frequency Mass Gauge |
| RMSD | Root Mean Square Deviation |
| RTD | Resistive Temperature Device |
| SAE | Society of Automotive Engineers |
| SNR | Signal-to-Noise Ratio |
References
- Pizzutilo, E.; Acher, T.; Reuter, B.; Will, C.; Schäfer, S. Subcooled Liquid Hydrogen Technology for Heavy-Duty Trucks. World Electr. Veh. J. 2024, 15, 22. [Google Scholar] [CrossRef]
- Ustolin, F.; Campari, A.; Taccani, R. An Extensive Review of Liquid Hydrogen in Transportation with Focus on the Maritime Sector. J. Mar. Sci. Eng. 2022, 10, 1222. [Google Scholar] [CrossRef]
- Kelly, K. High Rate Liquid Hydrogen Fueling for HD Rail; U.S. Department of Energy Hydrogen Program Annual Merit Review; Linde Engineering North America: Tonawanda, NY, USA, 2024. Available online: https://www.hydrogen.energy.gov/docs/hydrogenprogramlibraries/pdfs/review24/sdi016_kelly_2024_p.pdf (accessed on 23 April 2026).
- Ransom, K.S.; Johnson, G.K. STS-114: Engine Cut-OffSensors Are a No-Go; NASA Case Study; NASA: Washington, DC, USA, 2012. [Google Scholar]
- Saltari, F.; Pizzoli, M.; Migliorino, M.T.; Binni, A.; Coppotelli, G.; Mastroddi, F.; Pagliaroli, T.; Del Duchetto, F.; Gambioli, F.; Abarca, R.; et al. Experimental Investigations on the Sloshing-Induced Pressure Drop in Tanks for Hydrogen-Powered Aircraft. AIAA SCITECH 2024. [Google Scholar] [CrossRef]
- Winter, A.; Kochan, K.; Weinig, V. Liquid Hydrogen Mass Gauging: Sensor Concepts for Future Hydrogen Aircraft Tanks. In Proceedings of the German Aerospace Congress 2025; Deutsche Gesellschaft für Luft- und Raumfahrt-Lilienthal-Oberth e.V.: Bonn, Germany, 2026. [Google Scholar] [CrossRef]
- Mori, D.; Hirose, K. Recent Challenges of Hydrogen Storage Technologies for Fuel Cell Vehicles. Int. J. Hydrogen Energy 2009, 34, 4569–4574. [Google Scholar] [CrossRef]
- ISO/AWI 19888-1; Hydrogen Technologies—Aerial Vehicles—Part 1: Liquid Hydrogen Fuel Storage System. International Organization for Standardization: Geneva, Switzerland, 2025. Available online: https://www.iso.org/standard/65491.html (accessed on 17 September 2025).
- SAE AS6679; Liquid Hydrogen Storage for Aviation. SAE International: Warrendale, PA, USA, 2019. Available online: https://www.sae.org/standards/content/as6679/ (accessed on 17 September 2025).
- ISO 13985:2006; Liquid Hydrogen—Land Vehicle Fuel Tanks. International Organization for Standardization: Geneva, Switzerland, 2006. Available online: https://www.iso.org/standard/39892.html (accessed on 17 September 2025).
- ARINC 611-1; Guidance for the Design and Installation of Fuel Quantity Systems. Aeronautical Radio Inc.: Annapolis, MD, USA, 1999. Available online: https://aviation-ia.sae-itc.com/standards/arinc611-1-611-1-guidance-design-installation-fuel-quantity-systems (accessed on 17 September 2025).
- Kotzem, M.A.; Wöhler, S.; Burschyk, T.; Hesse, C.; Hellbrück, S.; Zill, T. Conceptual Aircraft Design of a Research Baseline with Direct Liquid Hydrogen Combustion. In Proceedings of the 34th Congress of the International Council of the Aeronautical Sciences; ICAS: Florence, Italy, 2024; Available online: https://www.icas.org/icas_archive/icas2024/data/papers/icas2024_0503_paper.pdf (accessed on 2 March 2026).
- Winter, A.J.O.; Kochan, K. Liquid Hydrogen in Aviation: A Critical Review of Usage and Level Sensing Technologies. Prog. Aerosp. Sci. 2026, 162, 101205. [Google Scholar] [CrossRef]
- Olsen, W.A. A Survey of Mass and Level Gauging Techniques for Liquid Hydrogen. In Advances in Cryogenic Engineering; Springer: New York, NY, USA, 1963; Volume 8, pp. 303–310. [Google Scholar] [CrossRef]
- Johnson, W.L.; Balasubramaniam, R.; Hibbs, R.; Zimmerli, G.A.; Asipauskas, M.; Bittinger, S.; Dardano, C.; Koci, F.D. Demonstration of Multilayer Insulation, Vapor Cooling of Structure, and Mass Gauging for Large-Scale Upper Stages: Structural Heat Intercept, Insulation, and Vibration Evaluation Rig (SHIIVER) Final Report; NASA: Washington, DC, USA, 2021. Available online: https://ntrs.nasa.gov/citations/20205008233 (accessed on 2 March 2026).
- Corruccini, R.J. Dielectric Constant of Liquid Parahydrogen; National Institute of Standards and Technology: Gaithersburg, MD, USA, 1962. [Google Scholar] [CrossRef]
- McCarty, R.D.; Hord, J.; Roder, H.M. Selected Properties of Hydrogen (Engineering Design Data): Technical Report NBS MONO 168; National Institute of Standards and Technology: Gaithersburg, MD, USA, 1981. [Google Scholar] [CrossRef]
- Ely, J.F.; Straty, G.C. Dielectric Constants and Molar Polarizabilities of Saturated and Compressed Fluid Nitrogen. J. Chem. Phys. 1974, 61, 1480–1485. [Google Scholar] [CrossRef]
- Parahydrogen. National Institute of Standards and Technology. Available online: https://webbook.nist.gov/cgi/cbook.cgi?Name=parahydrogen&Units=SI (accessed on 2 March 2026).
- Nitrogen. National Institute of Standards and Technology. Available online: https://webbook.nist.gov/cgi/cbook.cgi?Name=n2&Units=SI (accessed on 2 March 2026).
- PeakTech, «PeakTech® P 2170» LCR-/ESR-Meter, 100 Hz–100 kHz, with USB. Available online: https://www.peaktech.de/uk/PeakTech-P-2170-LCR-ESR-Meter-100-Hz-100-kHz-with-USB/P-2170 (accessed on 23 April 2026).
- Pott, Y. Experimentelle Untersuchung Elektrischer Streufeldsensoren zur Füllstandsbestimmung Zukünftiger Flüssigwasserstofftanks in der Luftfahrt. Bachelor Thesis, Hamburg University of Applied Sciences, Hamburg, Germany, 2025. [Google Scholar]
- Behruzi, P.; Hunt, A.; Foster-Turner, R. Evaluation of Liquid Sloshing Using Electrical Capacitance Tomography. In AIAA Propulsion and Energy 2020 Forum; AIAA: Reston, VA, USA, 2020; Volume 3804. [Google Scholar] [CrossRef]
- Maekawa, K.; Takeda, M.; Matsuno, Y.; Fujikawa, S.; Kuroda, T.; Kumakura, H. Fundamental Study of Tank with MgB2 Level Sensor for Transportation of Liquid Hydrogen. Phys. Procedia 2015, 67, 1164–1168. [Google Scholar] [CrossRef]
- Innovative Sensor Technology IST AG. Part No. P1K0.232.6W.A.007: Standard Pt1000 (232) Class F0.15, with Optimized ESD Design Temperature Sensor Datasheet; Innovative Sensor Technology IST AG: Ebnat-Kappel, Switzerland, 2026; Available online: https://www.mouser.de/ProductDetail/Innovative-Sensor-Technology/P1K0.232.6W.A.007?qs=Imq1NPwxi76rLTrKsGJ9%2Fw%3D%3D (accessed on 23 April 2026).
- IEC 60751:2022; Industrial Platinum Resistance Thermometers and Platinum Temperature Sensors. International Electrotechnical Commission: Geneva, Switzerland, 2022. Available online: https://cdn.standards.iteh.ai/samples/102478/eb22a33147f842f7a71ab9db245d92ba/IEC-60751-2022.pdf (accessed on 23 April 2026).
- Chi, X.; Ke, X.; Xu, W. Optical Fibre Liquid Sensor for Cryogenic Propellant Mass Measurement. Electron. Lett. 2019, 55, 278–280. [Google Scholar] [CrossRef]
- Wei, C.; Klingberg, A.; Strand, C.L.; Hanson, R.K. Measurement of Hydrogen and Nitrogen via Collision-Induced Infrared Absorption. Int. J. Hydrogen Energy 2024, 93, 364–373. [Google Scholar] [CrossRef]
| Disclaimer/Publisher’s Note: The statements, opinions and data contained in all publications are solely those of the individual author(s) and contributor(s) and not of MDPI and/or the editor(s). MDPI and/or the editor(s) disclaim responsibility for any injury to people or property resulting from any ideas, methods, instructions or products referred to in the content. |