


Abstract
Saltwater batteries can be made using brine from the desalination of seawater for low-cost energy storage. This study investigates the performance characteristics of saltwater batteries for potential off-grid energy applications. The systematic investigation of 15 electrode pairings from six electrodes (copper, iron, zinc, graphite, aluminium, and tin) across eleven concentration levels, combined with studies on electrode geometry, spacing, and volume, provides comprehensive insights into galvanic cell behaviour for saltwater batteries. Results indicate that the open-circuit voltage (OCV) is primarily determined by electrode potential differences rather than salt concentration, with zinc-carbon and aluminium-carbon pairings producing the highest voltages (1.1–1.2 V). Short circuit current increases with salt concentration up to approximately 30% (0.3 M), which is the saturation point, beyond which ion mobility decreases. This study demonstrates that electrode geometry and surface area significantly affect current density and internal resistance, while increased electrode spacing raises internal resistance and reduces maximum current output. These findings contribute to understanding the feasibility and performance characteristics of saltwater batteries as accessible energy sources using recyclable materials.
1. Introduction
Sodium, a group 1 alkali metal positioned below lithium in the periodic table, has attracted billions of dollars in research investment as a promising solution for short- to medium-term energy storage [1,2,3]. Sodium is the sixth most abundant metal in the earth’s crust and exists predominantly as salt (NaCl), making it far more accessible than lithium. With the accelerating integration of renewable energy sources into global power grids, research focus has shifted towards robust energy storage systems (ESS). Currently, 80% of commercial batteries use rare and expensive and scarce elements, namely, lithium (Li), nickel (Ni), cobalt (Co) and manganese (Mn) [1]. The compact ionic radius of 72 pm in lithium ions gives them high mobility, achieving a high energy density of 250 Wh/kg, which has made lithium the dominant choice in today’s energy storage systems [2,3]. However, lithium-ion batteries (LIBs) present several critical challenges; LIBs pose safety concerns, with high heat release rates of 10 K/s during thermal runaway [3], and suffer from severely degraded performance in cold environments, experiencing up to 70% energy capacity reduction at temperatures between 0 and −10 °C, particularly in high-altitude regions [3].
In contrast, sodium-ion batteries (SIBs) demonstrate superior thermal and temperature stability, with a significantly lower heat release rate of 2 K/s and reliable operation across a wide temperature range of −50 to 100 °C [3]. While sodium’s larger ionic radius of 102 pm [2] results in a moderate energy density of 150 Wh/kg, this trade-off makes both SIBs and saltwater batteries (SWBs) economically viable and cost-effective solutions for off-grid, short- to medium-term energy storage applications.
Historically, saltwater batteries have been primarily explored as power sources for deep-sea operations, such as seafloor geophysical studies [4] and autonomous control systems [4,5]. Wilcock and Kauffman [6] demonstrated that magnesium anodes outperform aluminium alternatives and identified dissolved oxygen concentration in seawater as a key factor influencing battery power output. More recently, Park et al. [7] investigated the use of saltwater as a catholyte in rechargeable aqueous salt–air batteries, opening new avenues for further research.
This research study focuses on the use of brine, a by-product of seawater desalination, as a source of sodium for possible energy storage in low-power devices using water as the anolyte, to systematically investigate the full salt concentration spectrum from 0% to 100%. This investigation also examines the effects of surface area, electrode geometry, dissolved impurities in the water, the spacing between the electrodes, and the long-term performance of cells. The materials used are limited to six recyclable electrode materials [8], namely, copper (Cu), zinc (Zn), aluminium (Al), tin (Sn), iron (Fe), and graphite (C).
2. Methodology
When salt dissolves in water, the salt separates into aqueous Na+ ions and Cl− ions [9]. Placing metal electrodes in the electrolyte (a solution of ions) provides a path for the movement of ions in the electrolyte, which generates a current [10]. The standard cell potential is the voltage of an electrochemical cell under standard conditions, calculated by subtracting the standard reduction potential of the anode half-cell from that of the cathode half-cell, as seen below [10].
Ecell = Ecathode − Eanode
Anode Reaction
The anode is the more reactive metal of the electrode pairs. The anode (any Metal M) is consumed over time through oxidation and galvanic corrosion by the formation of positive aqueous ions which react with hydroxide ions to form coloured solid on the surface of the anode metal [9].
Half-Reaction: M(s) → M2+(aq) + 2e−
Half-Reaction: M2+(aq) + 2OH−(aq) → M(OH)2(s)
Cathode Reaction
At the cathode, oxygen from the air dissolves in water to form hydroxide ions, see Equation (4). This occurs at the inert cathodes for example, graphite or carbon rods. The less reactive metals of the electrode pairs (for example copper and tin) act as an electron path. The hydrogen ions are reduced to form Hydrogen gas, as in Equation (5). The presence of the gas can be tested with a burning splint which produces a pop sound. Therefore, only the anode is consumed in the galvanic cell. The sodium ions released from the dissolved salt in water also react with the hydroxide ions to form an alkaline solution as a by-product as in Equation (6).
Half-Reaction: O2(g) + H2O(l) → OH−(aq) + 2H+(aq)
Half-Reaction: 2H+(aq) + 2e− → H2 (g)
Half-Reaction: Na+(aq) + OH− → NaOH(aq)
2.1. Experiment Methodology
Table 1 summarises the experiments carried out, the target knowledge area and the measurements taken for analysis. Each experiment aims to determine certain characteristics of salt-water batteries, primarily focusing on the cell internal resistance. The electrode tests explore the parameters that contribute to internal resistance due to the electrode pairing, electrode spacing and electrode geometry. The electrolyte tests aim to determine parameters of internal cell resistance due to electrolyte salt concentration, electrolyte volume, and electrolyte flow. The cell behaviour tests investigate the by-products of the cell and the long-term behaviour of the cell. The following sections detail each experiment in more detail.
Table 1.
Experiments carried out to determine key Salt-Water Battery Characteristics.
2.1.1. Effect of Electrode Pairing
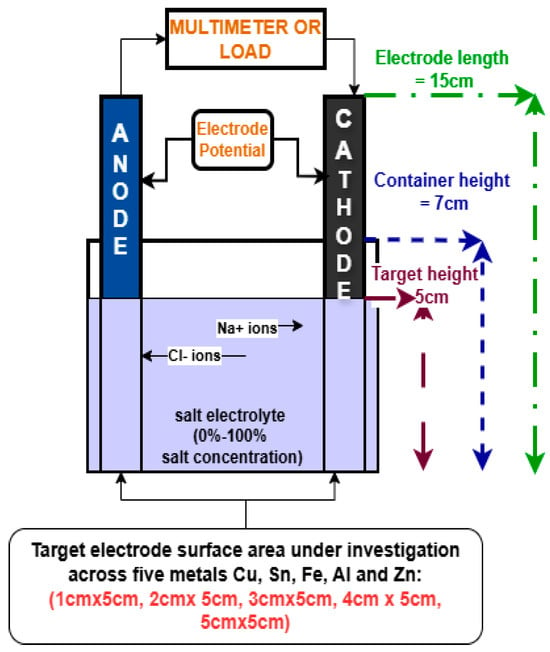
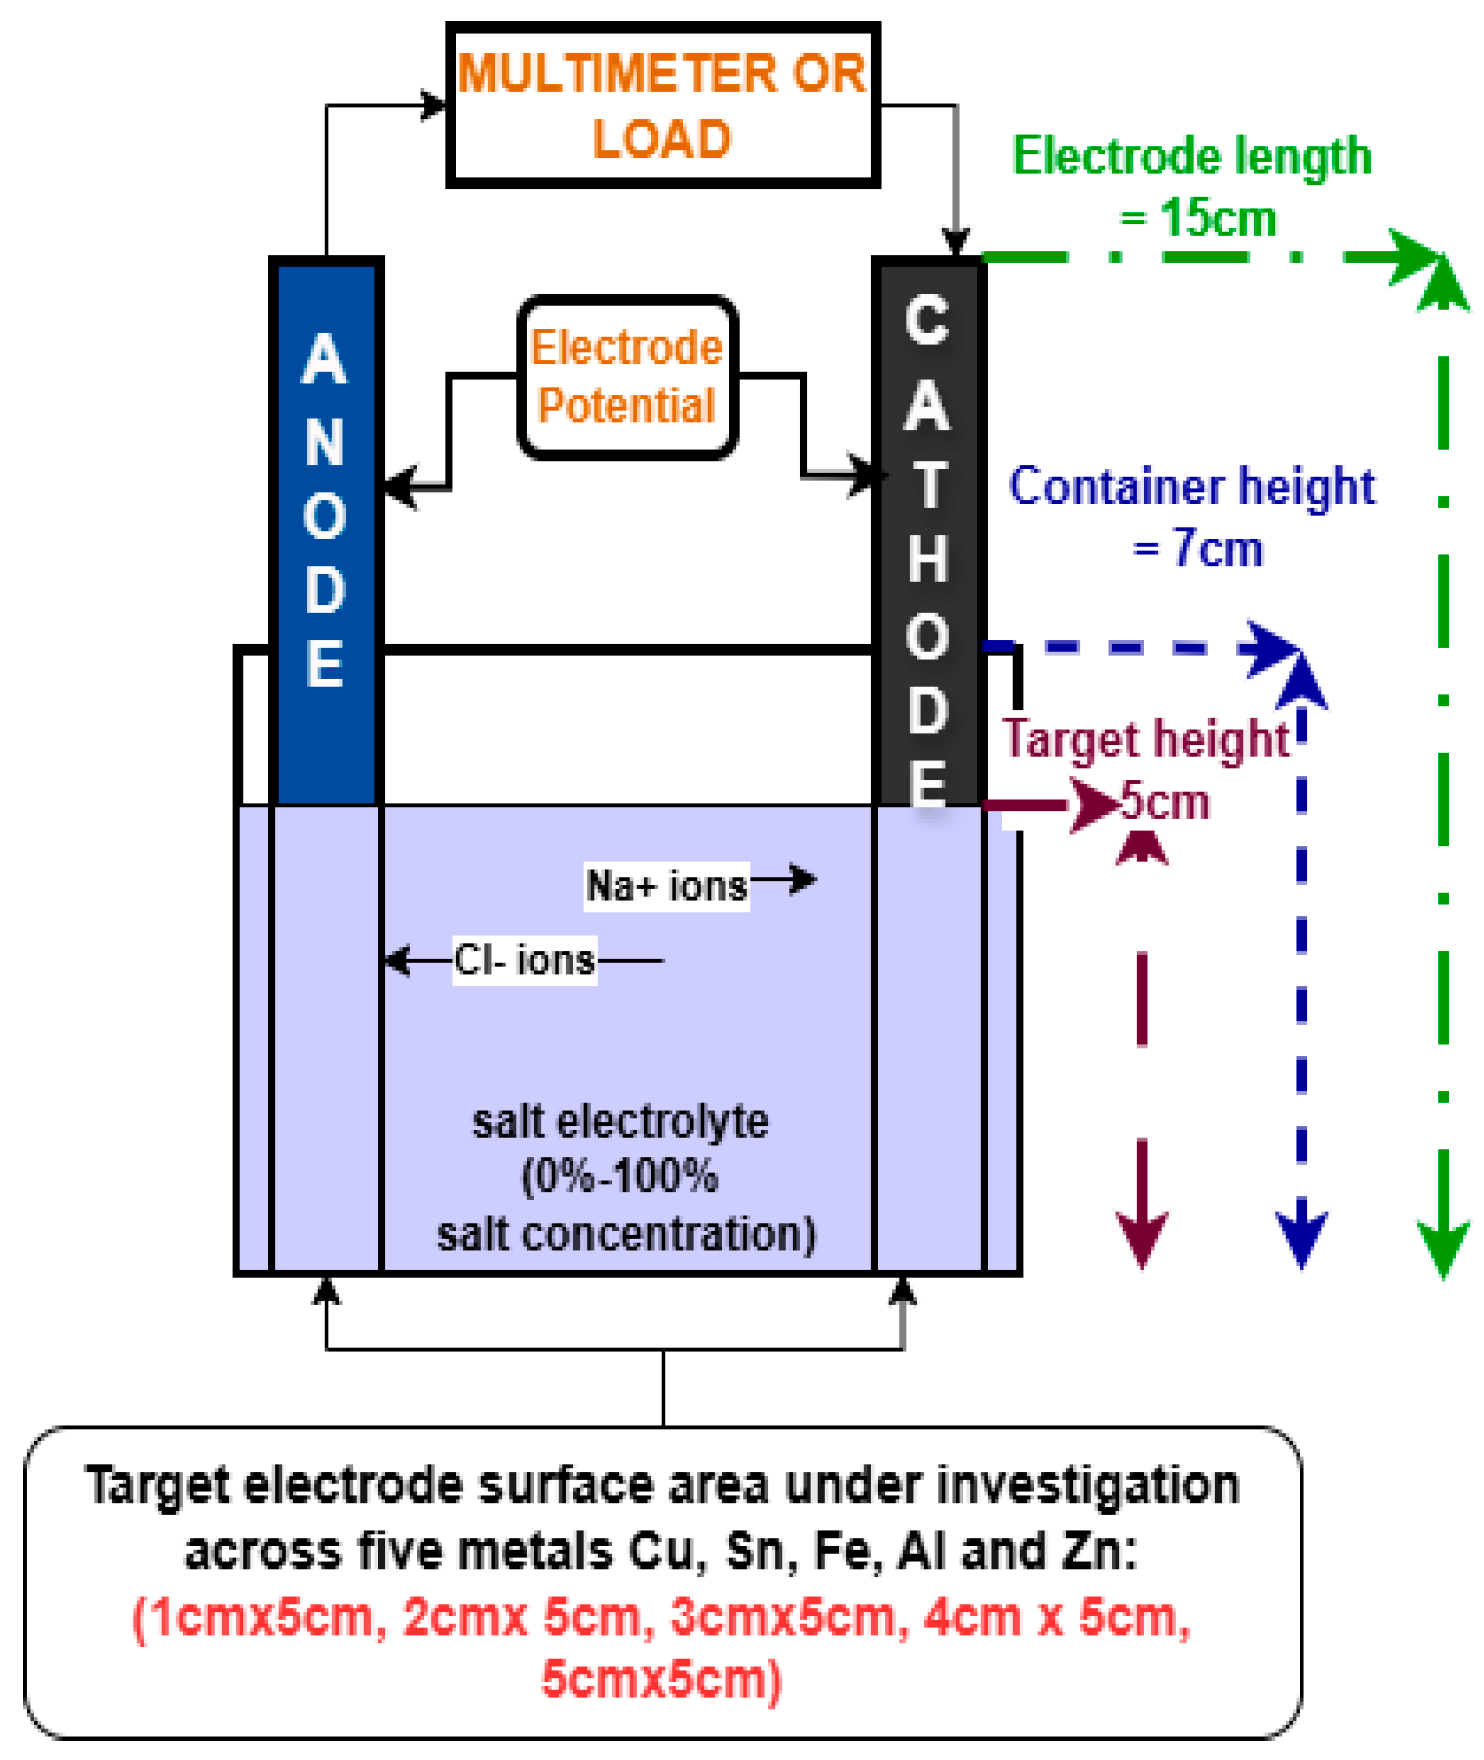
The hypothesis for this experiment was that the electrode combination with the largest cell potential difference (E°) would create cells with the largest OCV and SCC. The controlled variables for this experiment were: effective surface area, the concentration of salt in the electrolyte, the volume of the electrolyte in each cell and the spacing between electrodes. The depth of the electrodes was fixed to 50 mm to standardise the electrode contact surface area. Table A1 in the Appendix A describes in detail how the electrodes cut into different sizes. The experimental set-up is shown in Figure 1 below.
Figure 1.
Galvanic cell experiment set-up. The experiment set up was the same for each experiment.
2.1.2. Effect of Electrode Area
Surface area tests were used to determine the relationship between the area of the electrode in contact with the electrolyte (effective surface area) and battery performance. It was hypothesised that with an increasing effective surface area, cell performance will also increase. The salt concentration, electrolyte volume and electrode spacing were fixed.
2.1.3. Effect of Electrode Spacing
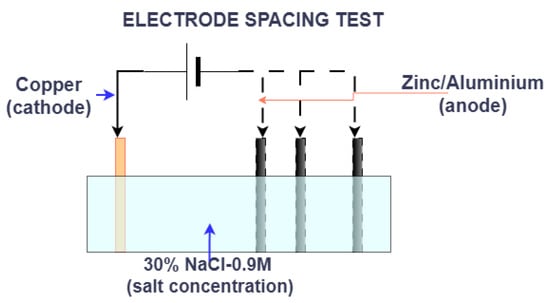
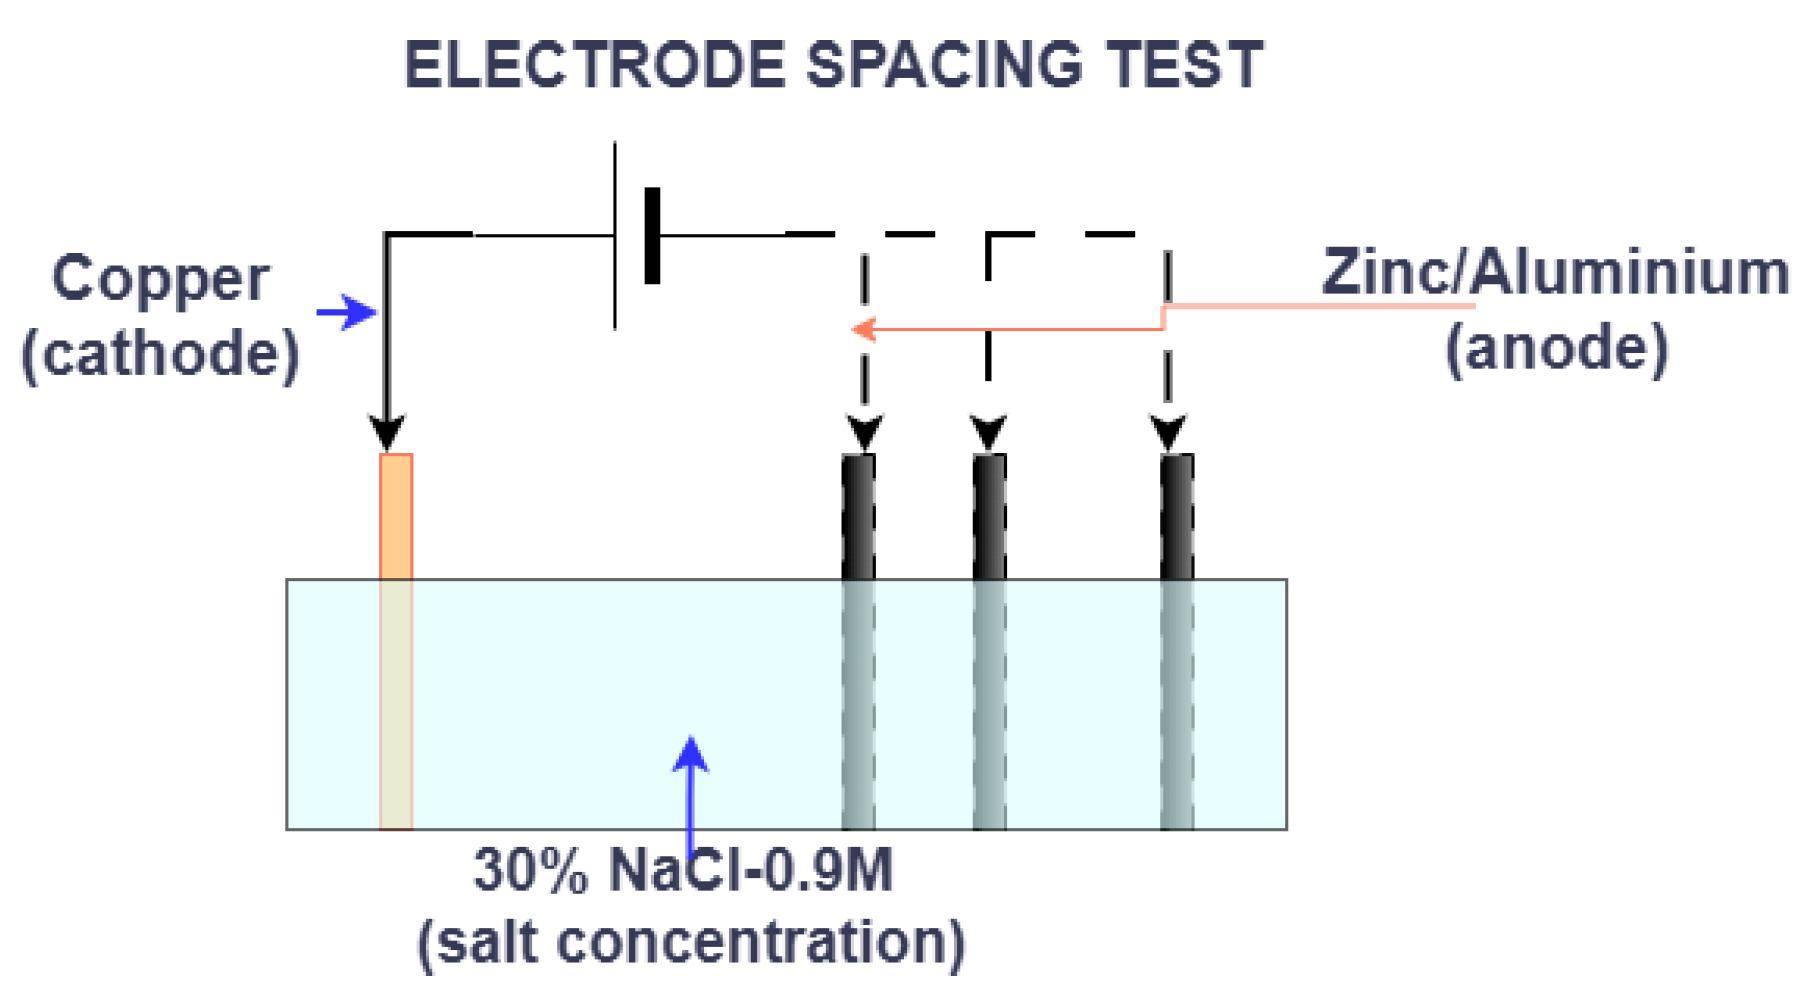
The distance between electrodes was expected to have an inverse relationship with cell performance, with increasing distance resulting in poorer cell performance. For this test, the concentration of salt and the effective electrode surface area were controlled. Figure 2 illustrates the experiment set-up.
Figure 2.
Electrode spacing experiment set-up in a salt-water tub. The anode was moved in 2 cm intervals from the stationary cathode. OCV and SCC measurements were taken.
2.1.4. Effect of Electrode Geometry
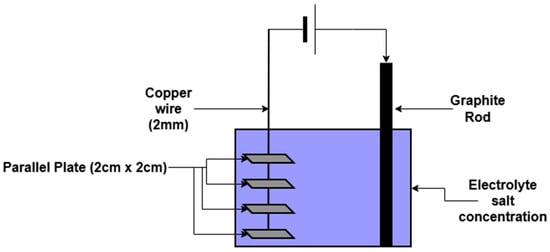
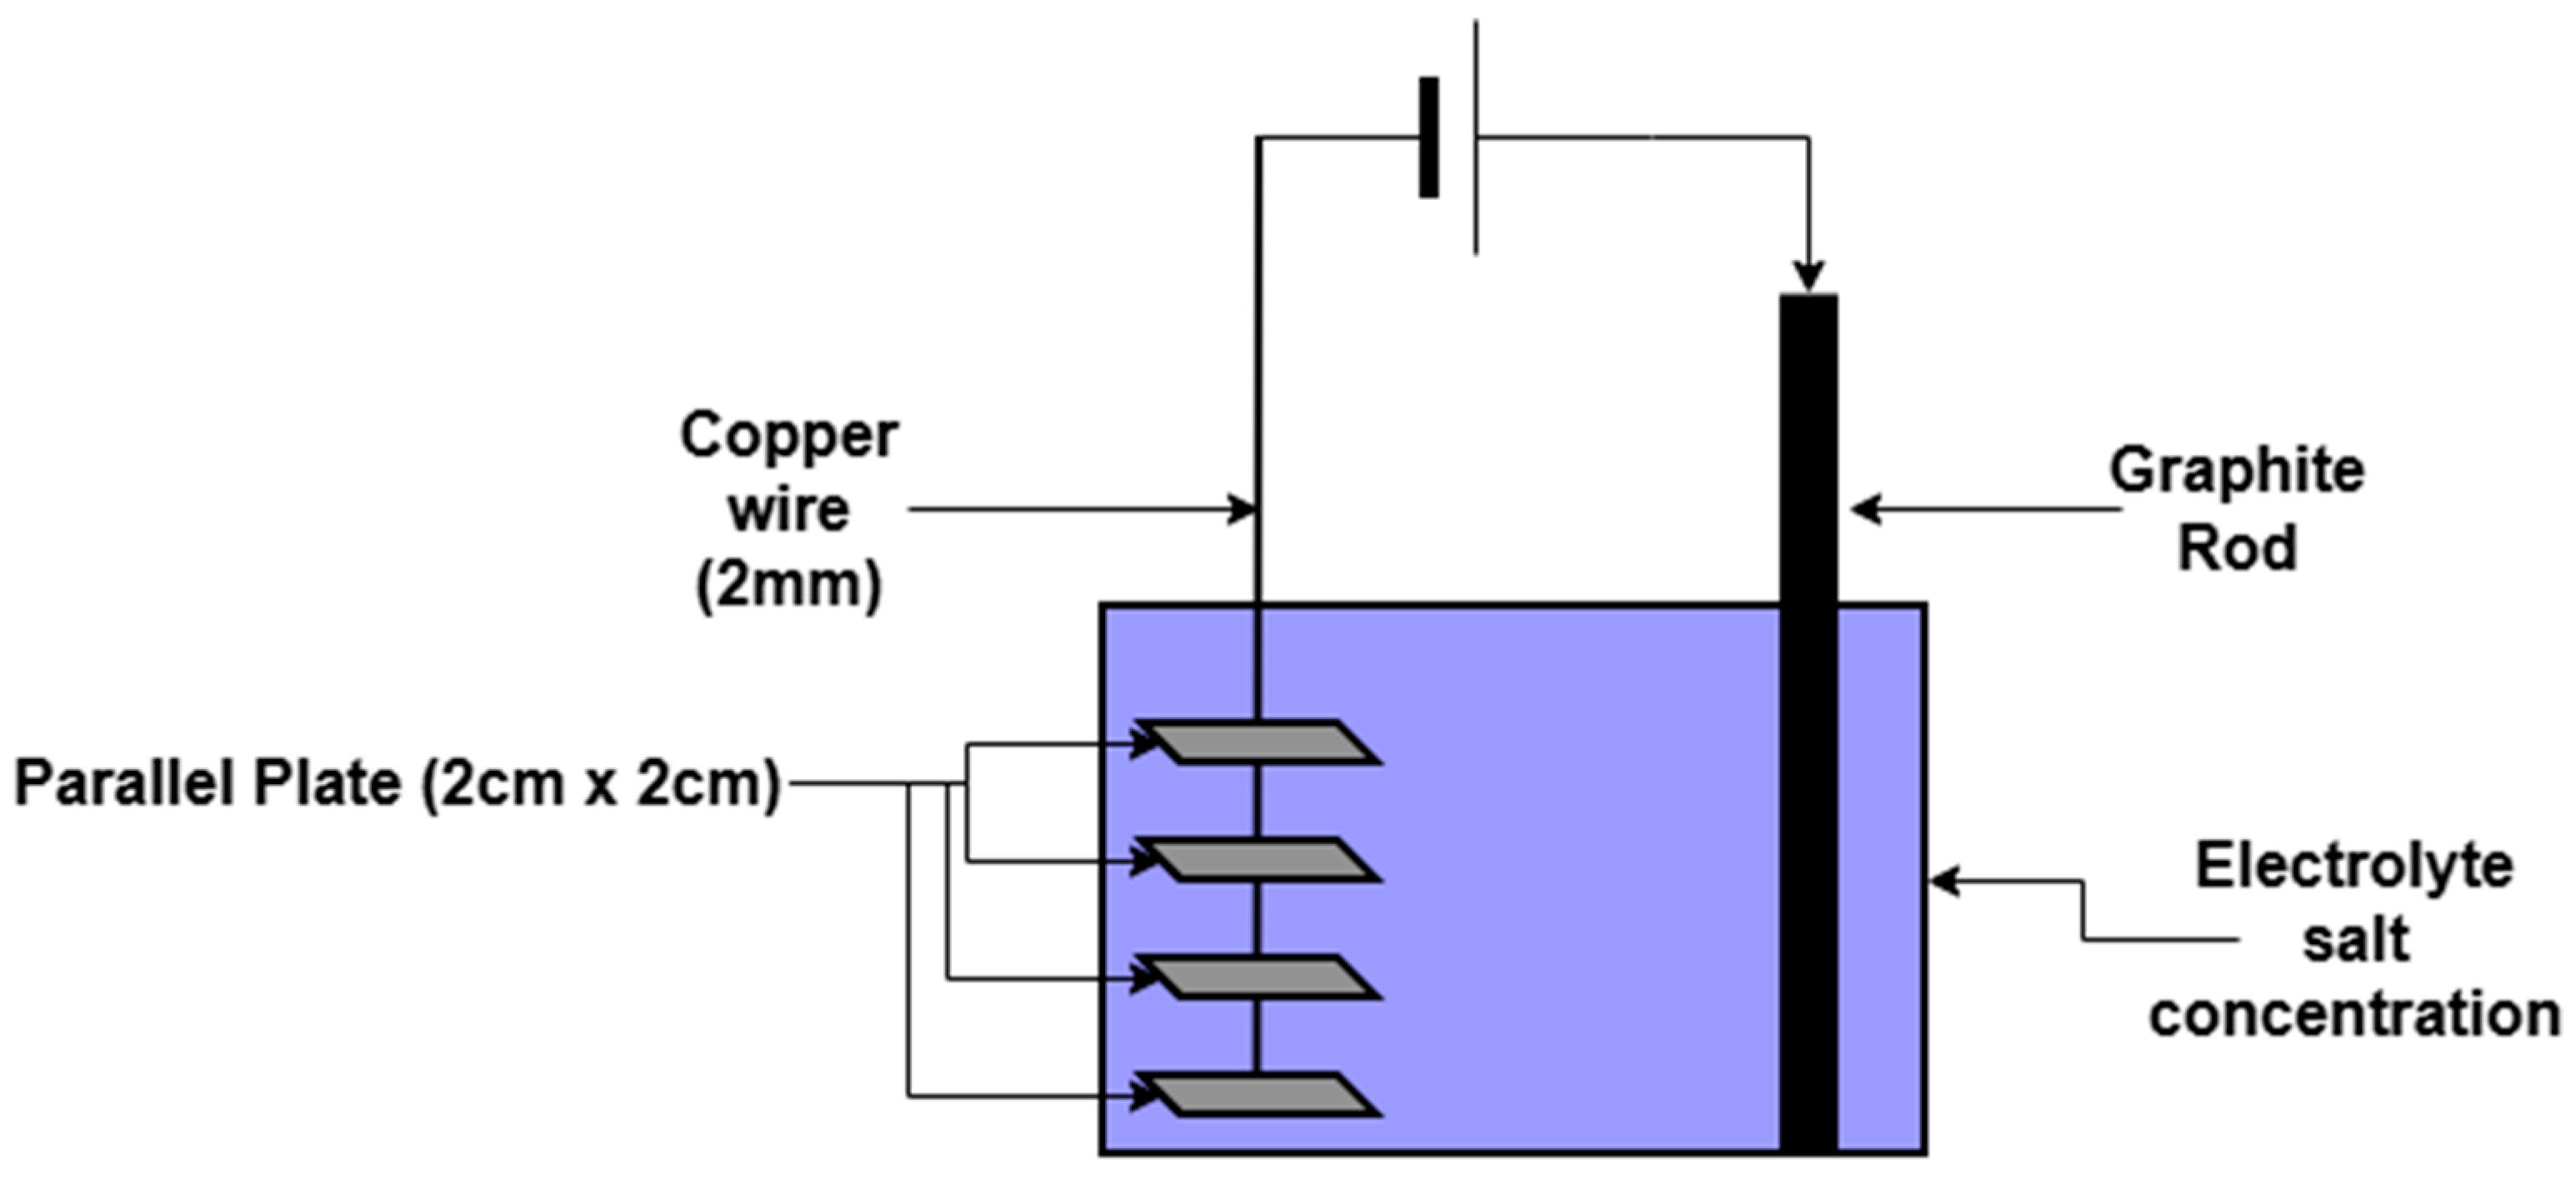
Electrode geometry affects the effective surface area and the electrode spacing. Compact electrode geometry may allow for space-saving and reducing the cell size to improve energy density. The electrode structure shown in Figure 3 was tested using a fixed electrolyte concentration and fixed volume. The effect of electrode geometry on cell internal resistance was investigated using hollow and rod electrodes. The hypothesis was that after accounting for changes in effective surface area and electrode spacing in previous experiments, the electrode geometry has no effect on OCV but causes an increase in surface area resistance, resulting in lower SCC. The results are compared against those of the E2 size zinc anode-graphite pairing.
Figure 3.
Electrode geometry experiment set up: On the left, four parallel 2 cm zinc plates separated by 2 cm gaps were soldered on a 2 mm copper wire. On the right is the graphite cathode.
2.2. Electrolyte Tests
2.2.1. Concentration Tests
The purpose of the concentration tests was to determine whether the amount of salinity increases OCV and SCC or alters cell internal resistance and energy density. The hypothesis was that the short-circuit current would increase with increasing salt concentration. The effective electrode surface area, the electrode spacing, and the cell volume were controlled in these tests, and OCV and SCC readings were taken for all 15 electrode combinations.
2.2.2. Water Purity Tests
Tap water contains calcium ions, magnesium ions, and fluoride ions, which naturally occur in fresh water [5,11]. Distilled water is free from these ions. Aluminium–Carbon and Zinc-Carbon pairings were used to establish the effect of water type on the OCV and SCC. The different water types have different internal resistance and conductivity, and these were investigated using an electrolyte salt concentration of 10%.
2.2.3. Effect of Electrolyte Flow
It was hypothesised that stirring the electrolyte would increase the SCC by the acceleration of mobile aqueous cations and anions. For this experiment, the electrolyte volume and concentration, along with the electrode surface area, were held constant to understand the effect of flowing electrolyte versus stagnant electrolyte on cell performance.
2.3. Cell Behaviour Tests
2.3.1. Long-Term Tests
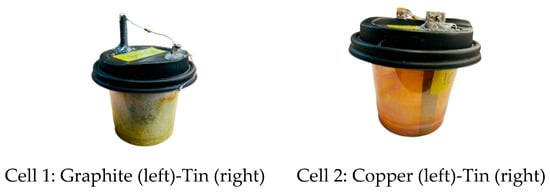
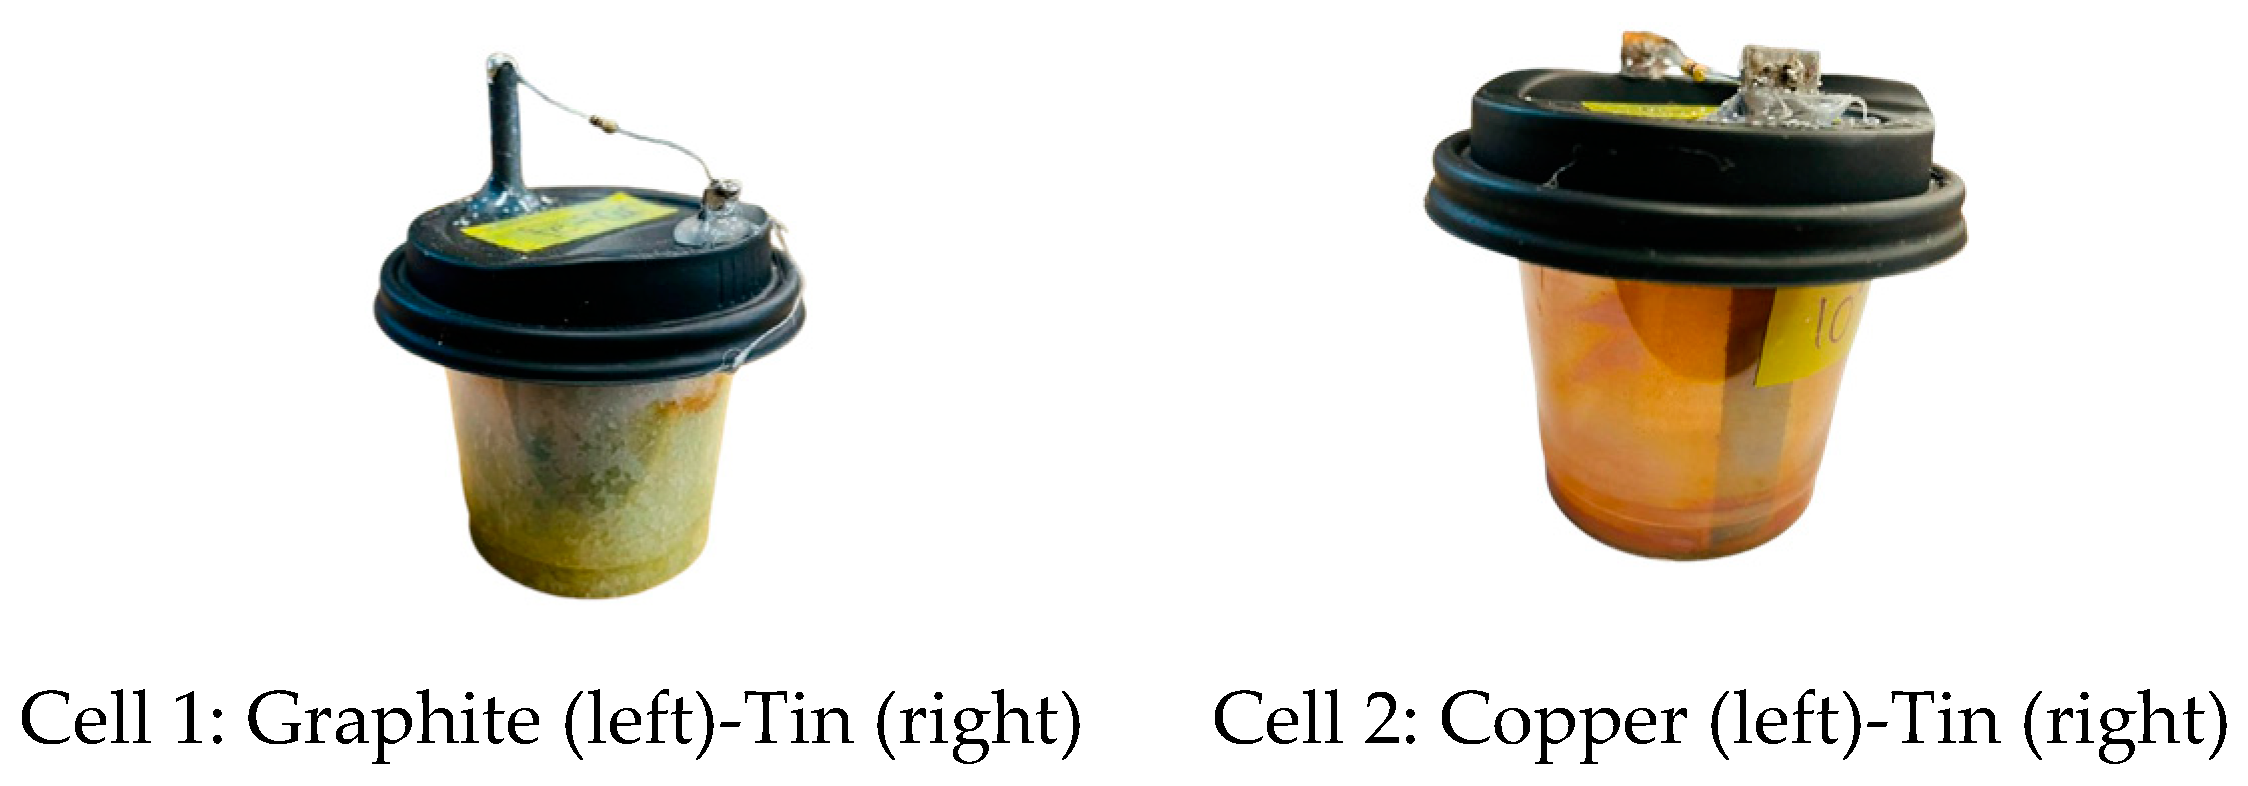
The experiment aimed to evaluate the cell energy capacity. The cells were set up as illustrated in Figure 4. The cells were sealed to prevent evaporation and were kept at room temperature. A 0.25 W 100 Ω resistor was connected across the terminals to slowly discharge the cells over 3 weeks. The readings were taken at 9 am, 12 pm and 3 pm, to monitor changes in the load voltage and the load current over time.
Figure 4.
Long term cell set up: Lids were used to limit evaporation using hot glue. The electrodes were secured using hot-glue. A 0.25 W 100 Ω resistor was soldered across the terminals to slowly discharge the cells over a period of 3 weeks.
2.3.2. Two-Hour Tests
During the concentration tests, it was observed that the OCV kept rising over time. To investigate this behaviour further, cells were connected to an Arduino that logged the open-circuit voltage of the cells for 2 h, with a sampling period of 500 ms. It was hypothesised that the OCV in a more reactive electrode would pair cells with more reactive electrodes (larger standard electrode potential) and stabilise faster to the highest OCV, while those cells with less reactive electrodes would show increasing logarithmic behaviour with respect to time. For these tests, the cell volume, electrolyte concentration, electrode spacing, and effective surface area remained constant.
2.3.3. Chemical Tests
The resulting by-products at the cell’s end of life affect the sustainability and safety of the cell. Examining the resulting by-products can also indicate the kind of reactions taking place within the cell. The cells used for the long-term tests were analysed using pH indicator strips and an acid test with HCl (hydrochloric acid) to test for the presence of NaOH.
3. Results
3.1. Electrode Test Results
3.1.1. Effect of Electrode Area
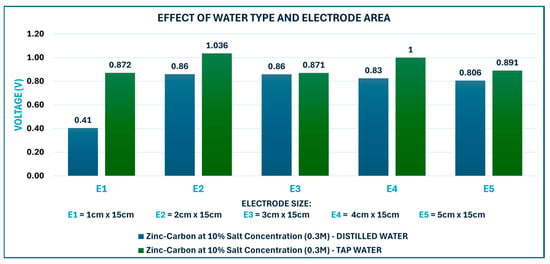
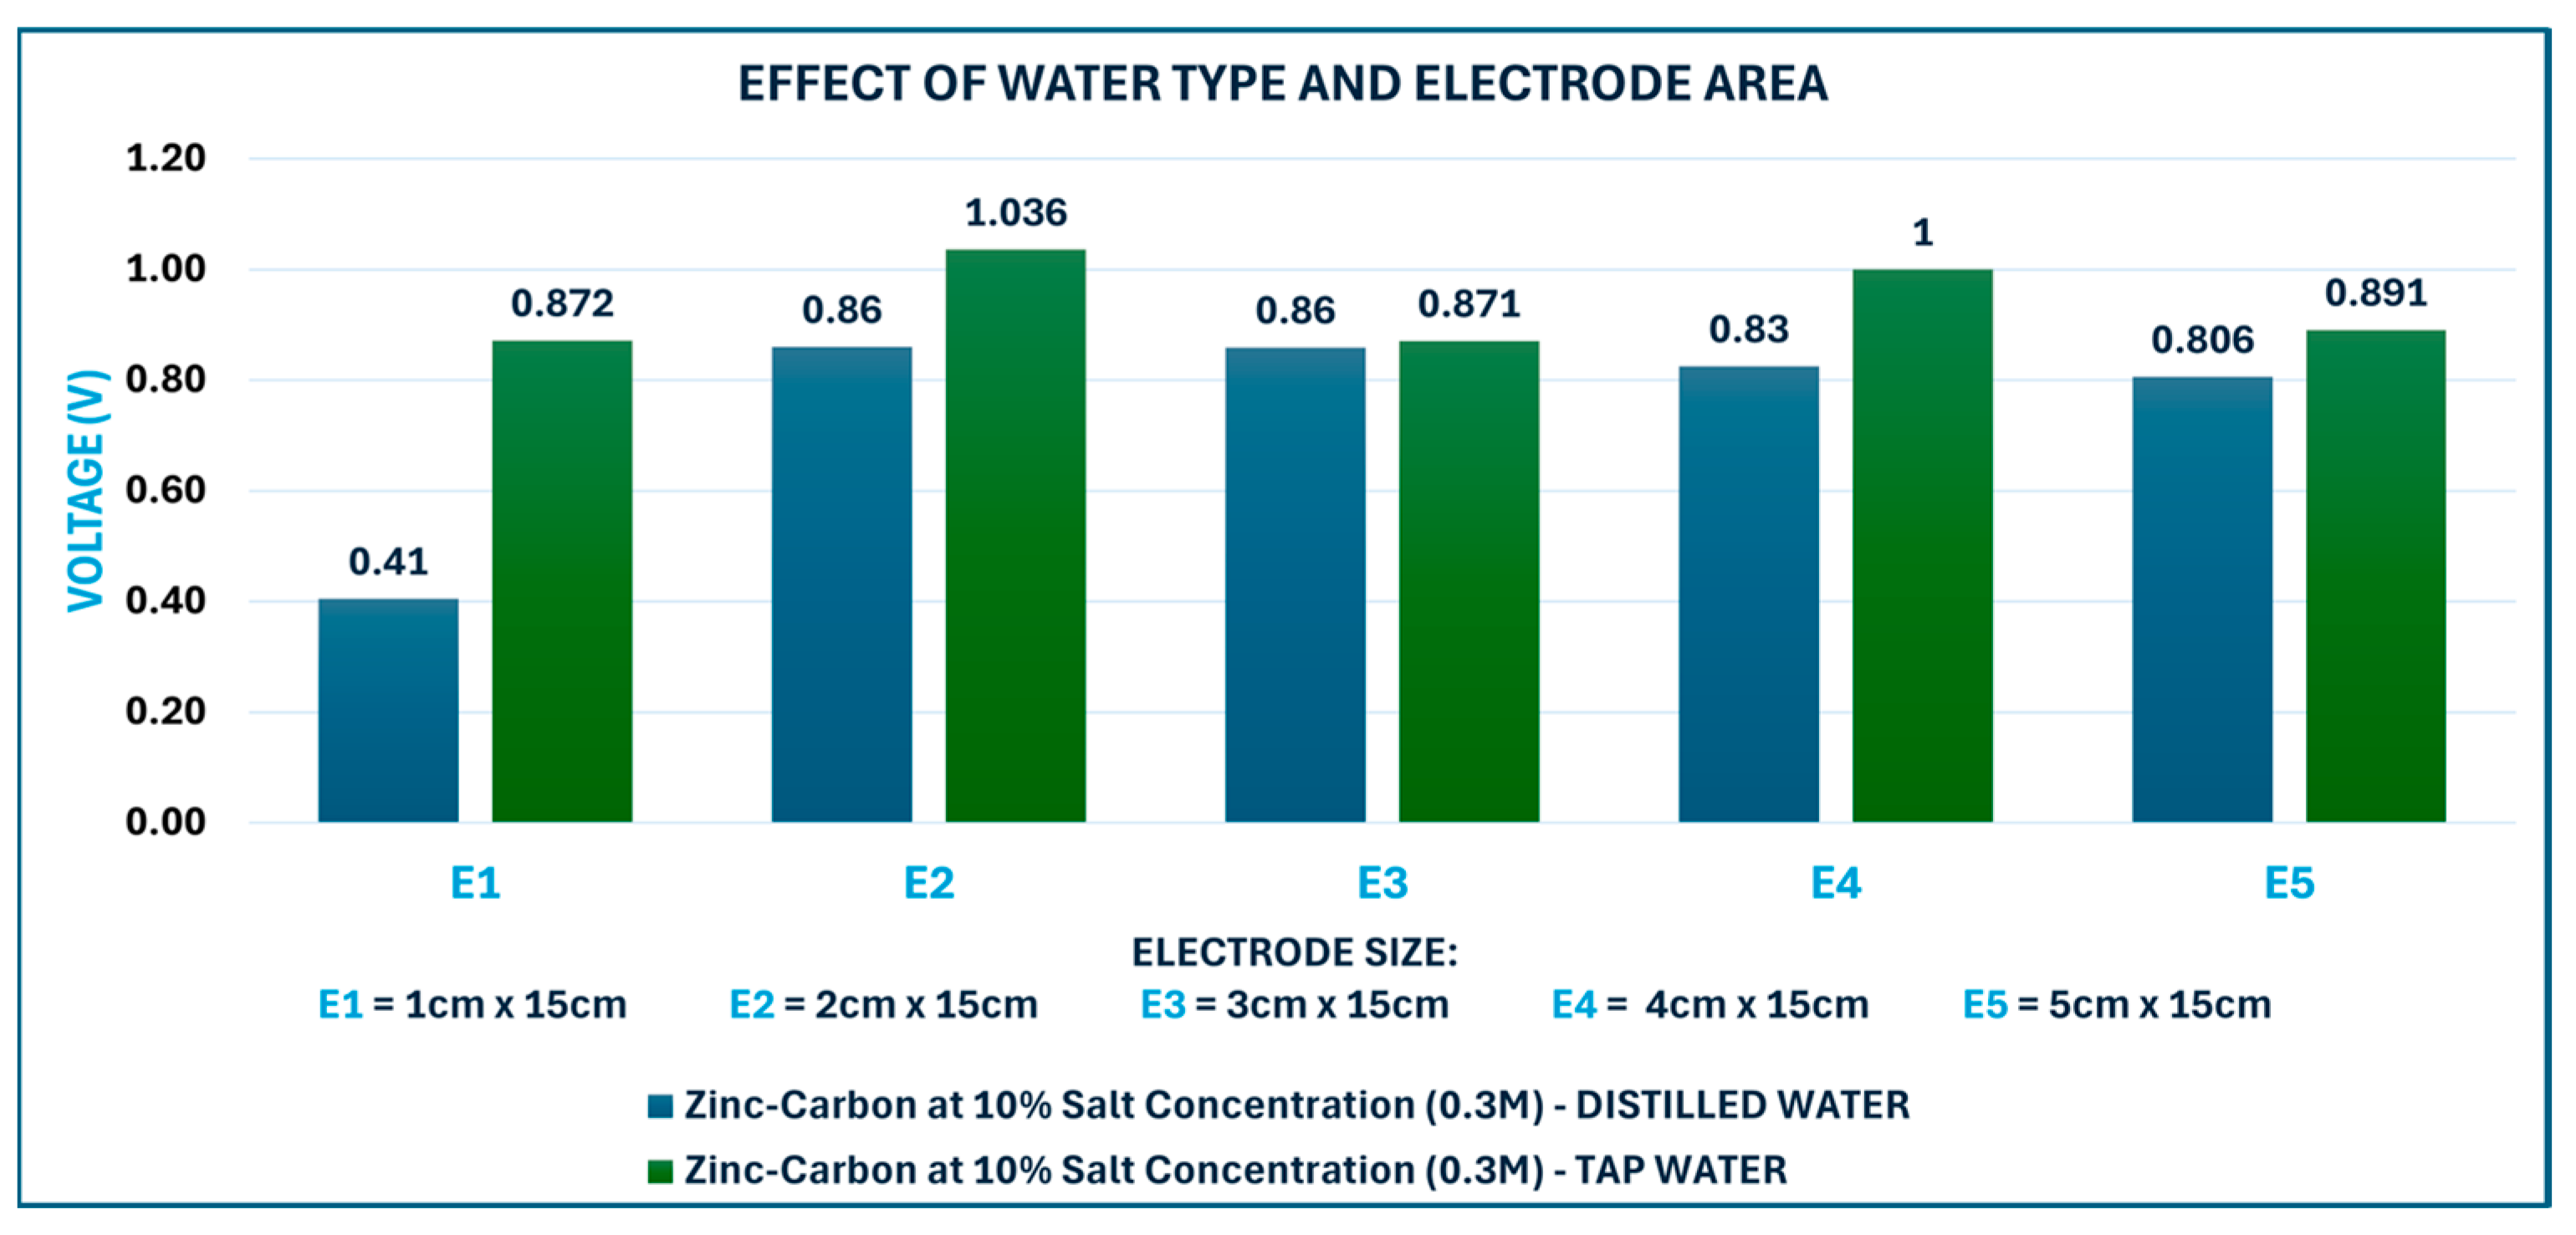
As shown in Figure 5, E1 (1 cm × 15 cm) had a lower OCV compared to the other electrode areas. This suggests that a smaller anode area decreases OCV. However, the OCV did not drastically increase from E2 (2 cm × 15 cm) to E5 (5 cm × 15 cm), OCV remained fairly constant across the electrode area at fixed concentrations in both water types, with 0.921 V average ± 0.115 V deviation. This suggests that E2 had an optimum electrode area. The cathode area does not contribute to an increase in OCV as the cathode acts as the current collector. Increasing the anode area increases the maximum OCV; however, once the maximum OCV is reached, increasing the anode area does not increase OCV. Instead, it increases the total internal resistance of the cell.
Figure 5.
Open-Circuit Voltage for electrode surface areas and two electrolyte preparations. The highest OCV 1.036 V was seen at E2 (2 cm × 5 cm).
- A.
- Maximum OCV Readings
All pairings with carbon had a higher OCV. The pairing of metals with low electrode potentials (Fe-Sn), which are metals that are lower in the reactivity series, had a lower OCV of 0.08 V. The OCV range was in accordance with the reactivity series, suggesting that the more reactive a metal is, the more likely it is to produce a higher OCV. Aluminium, the most reactive metal of the six, had a maximum OCV of 1.2 V with carbon and Zinc, the second most reactive metal, had a maximum OCV voltage of 1.1 V with carbon. These two metals gave the highest OCV readings for every salt concentration.
- B.
- Current Collectors and Current Density
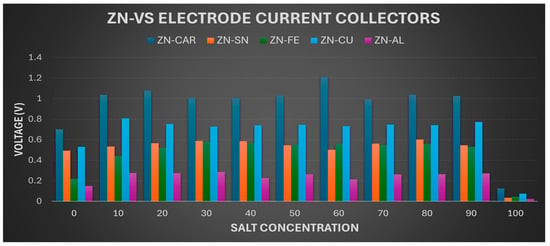
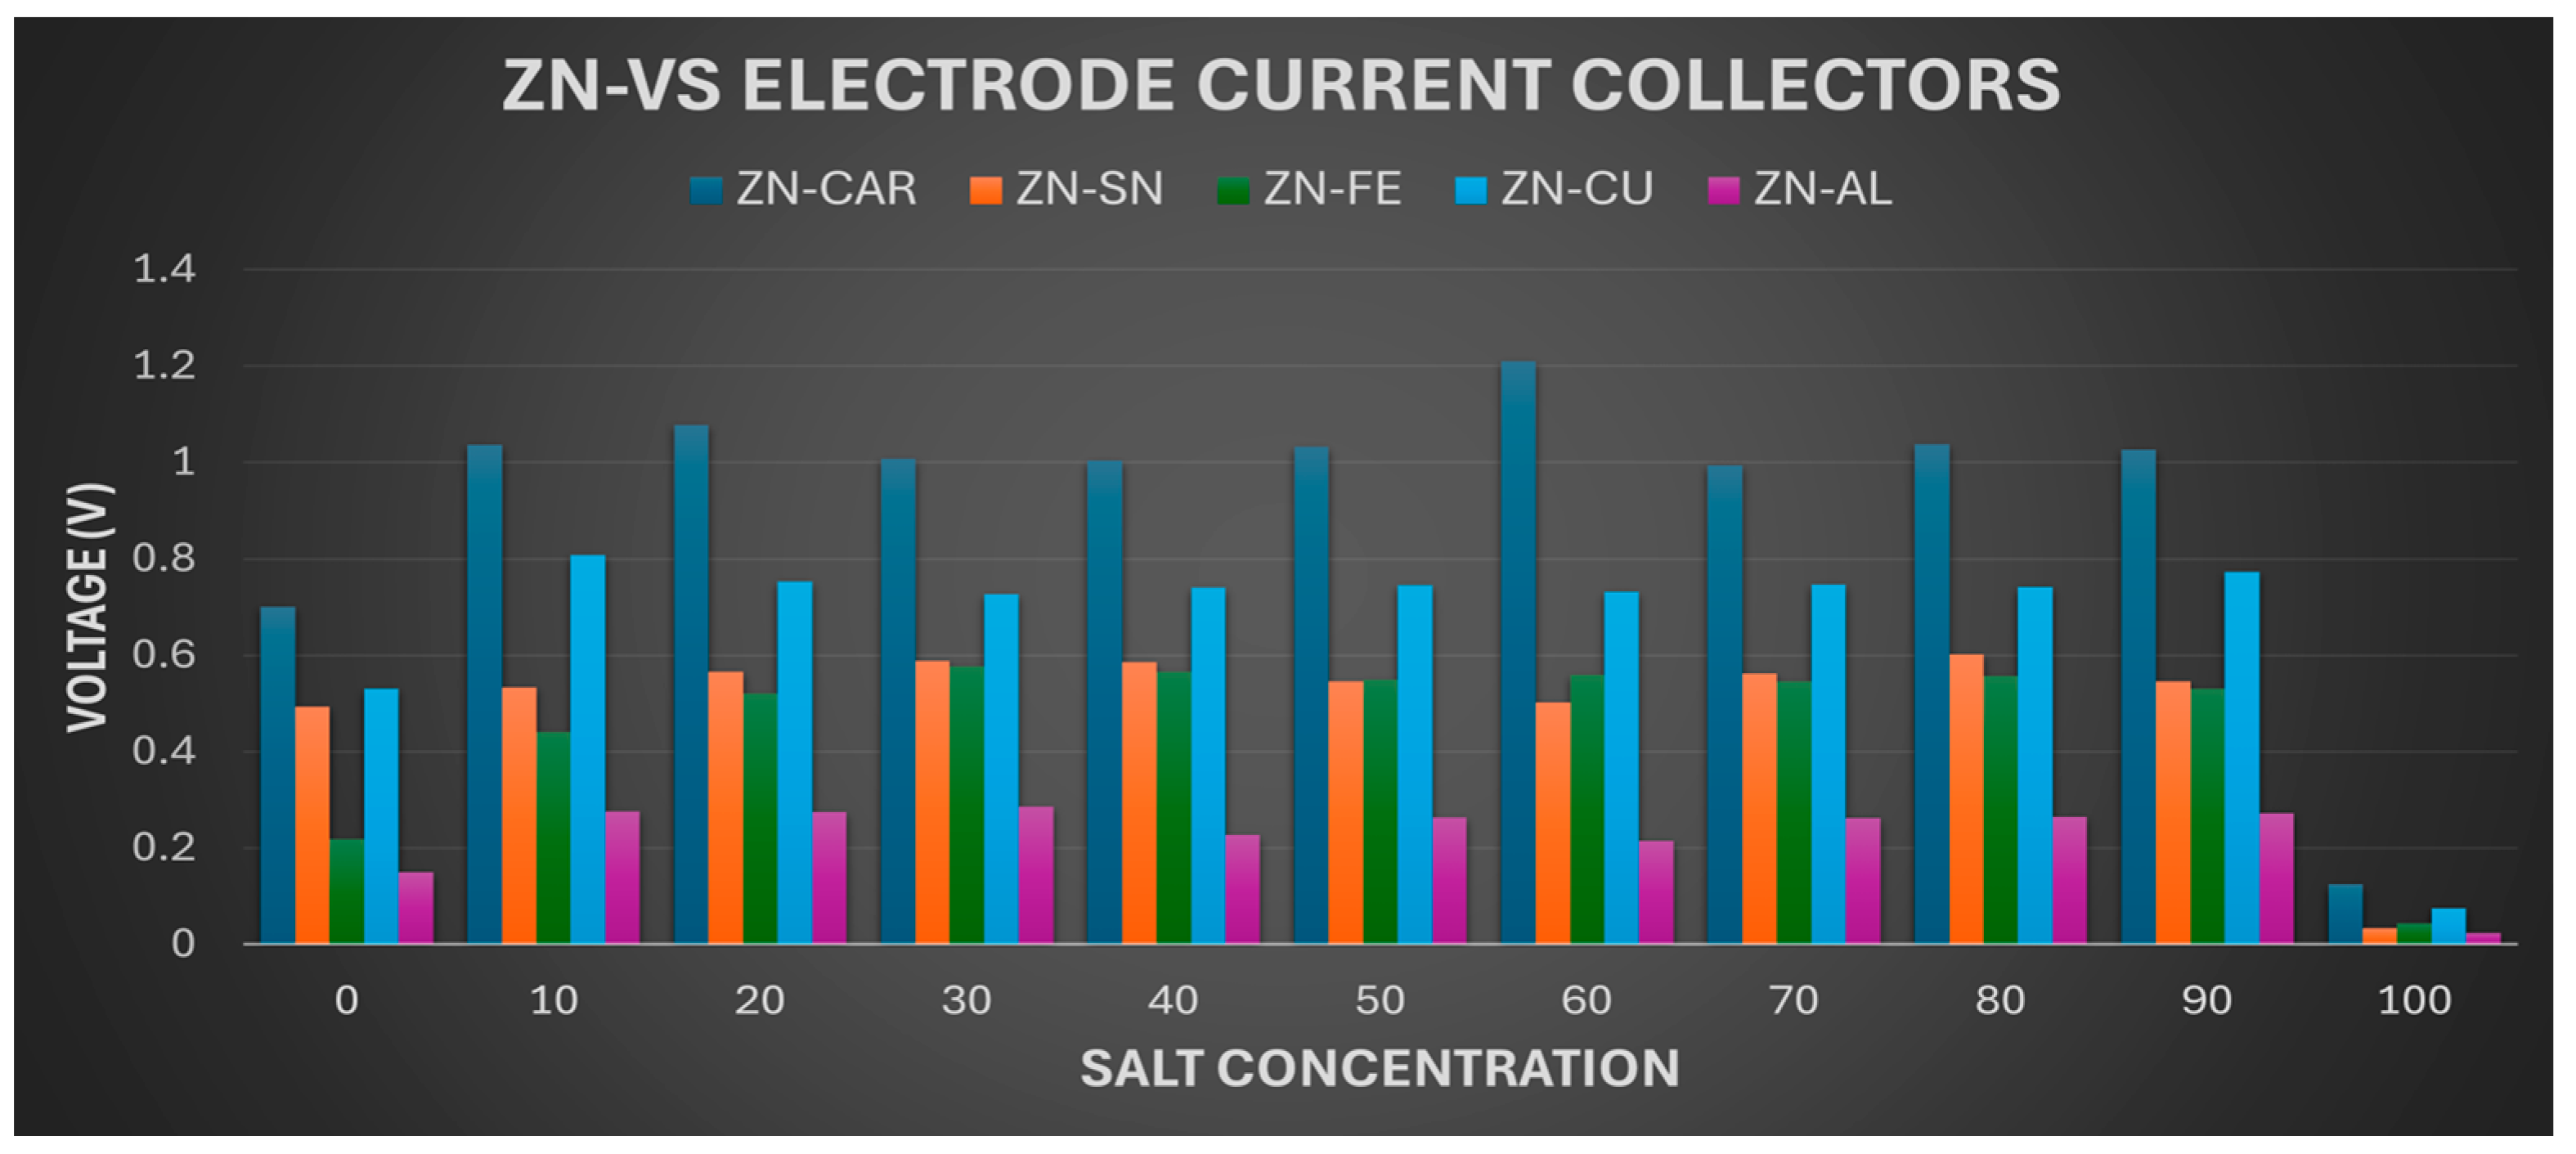
The more inert or less reactive the cathode is, the better it is as a current collector. Carbon is inert and so outperformed copper as a current collector. Figure 6 illustrates comparison of Zinc anode with five electrode current collectors. As expected, the Zn-Graphite pair gave the highest OCV indicating excellent conduction of the aqueous ions. Carbon performs best, followed by Copper. The Zn–Al pairing resulted in the least OCV and SCC for all Zinc readings. This is because Aluminium is more reactive than Zinc, making Zinc the cathode.
Figure 6.
Zinc Anode vs. Current Collectors.
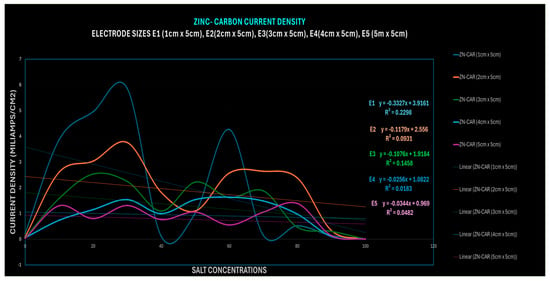
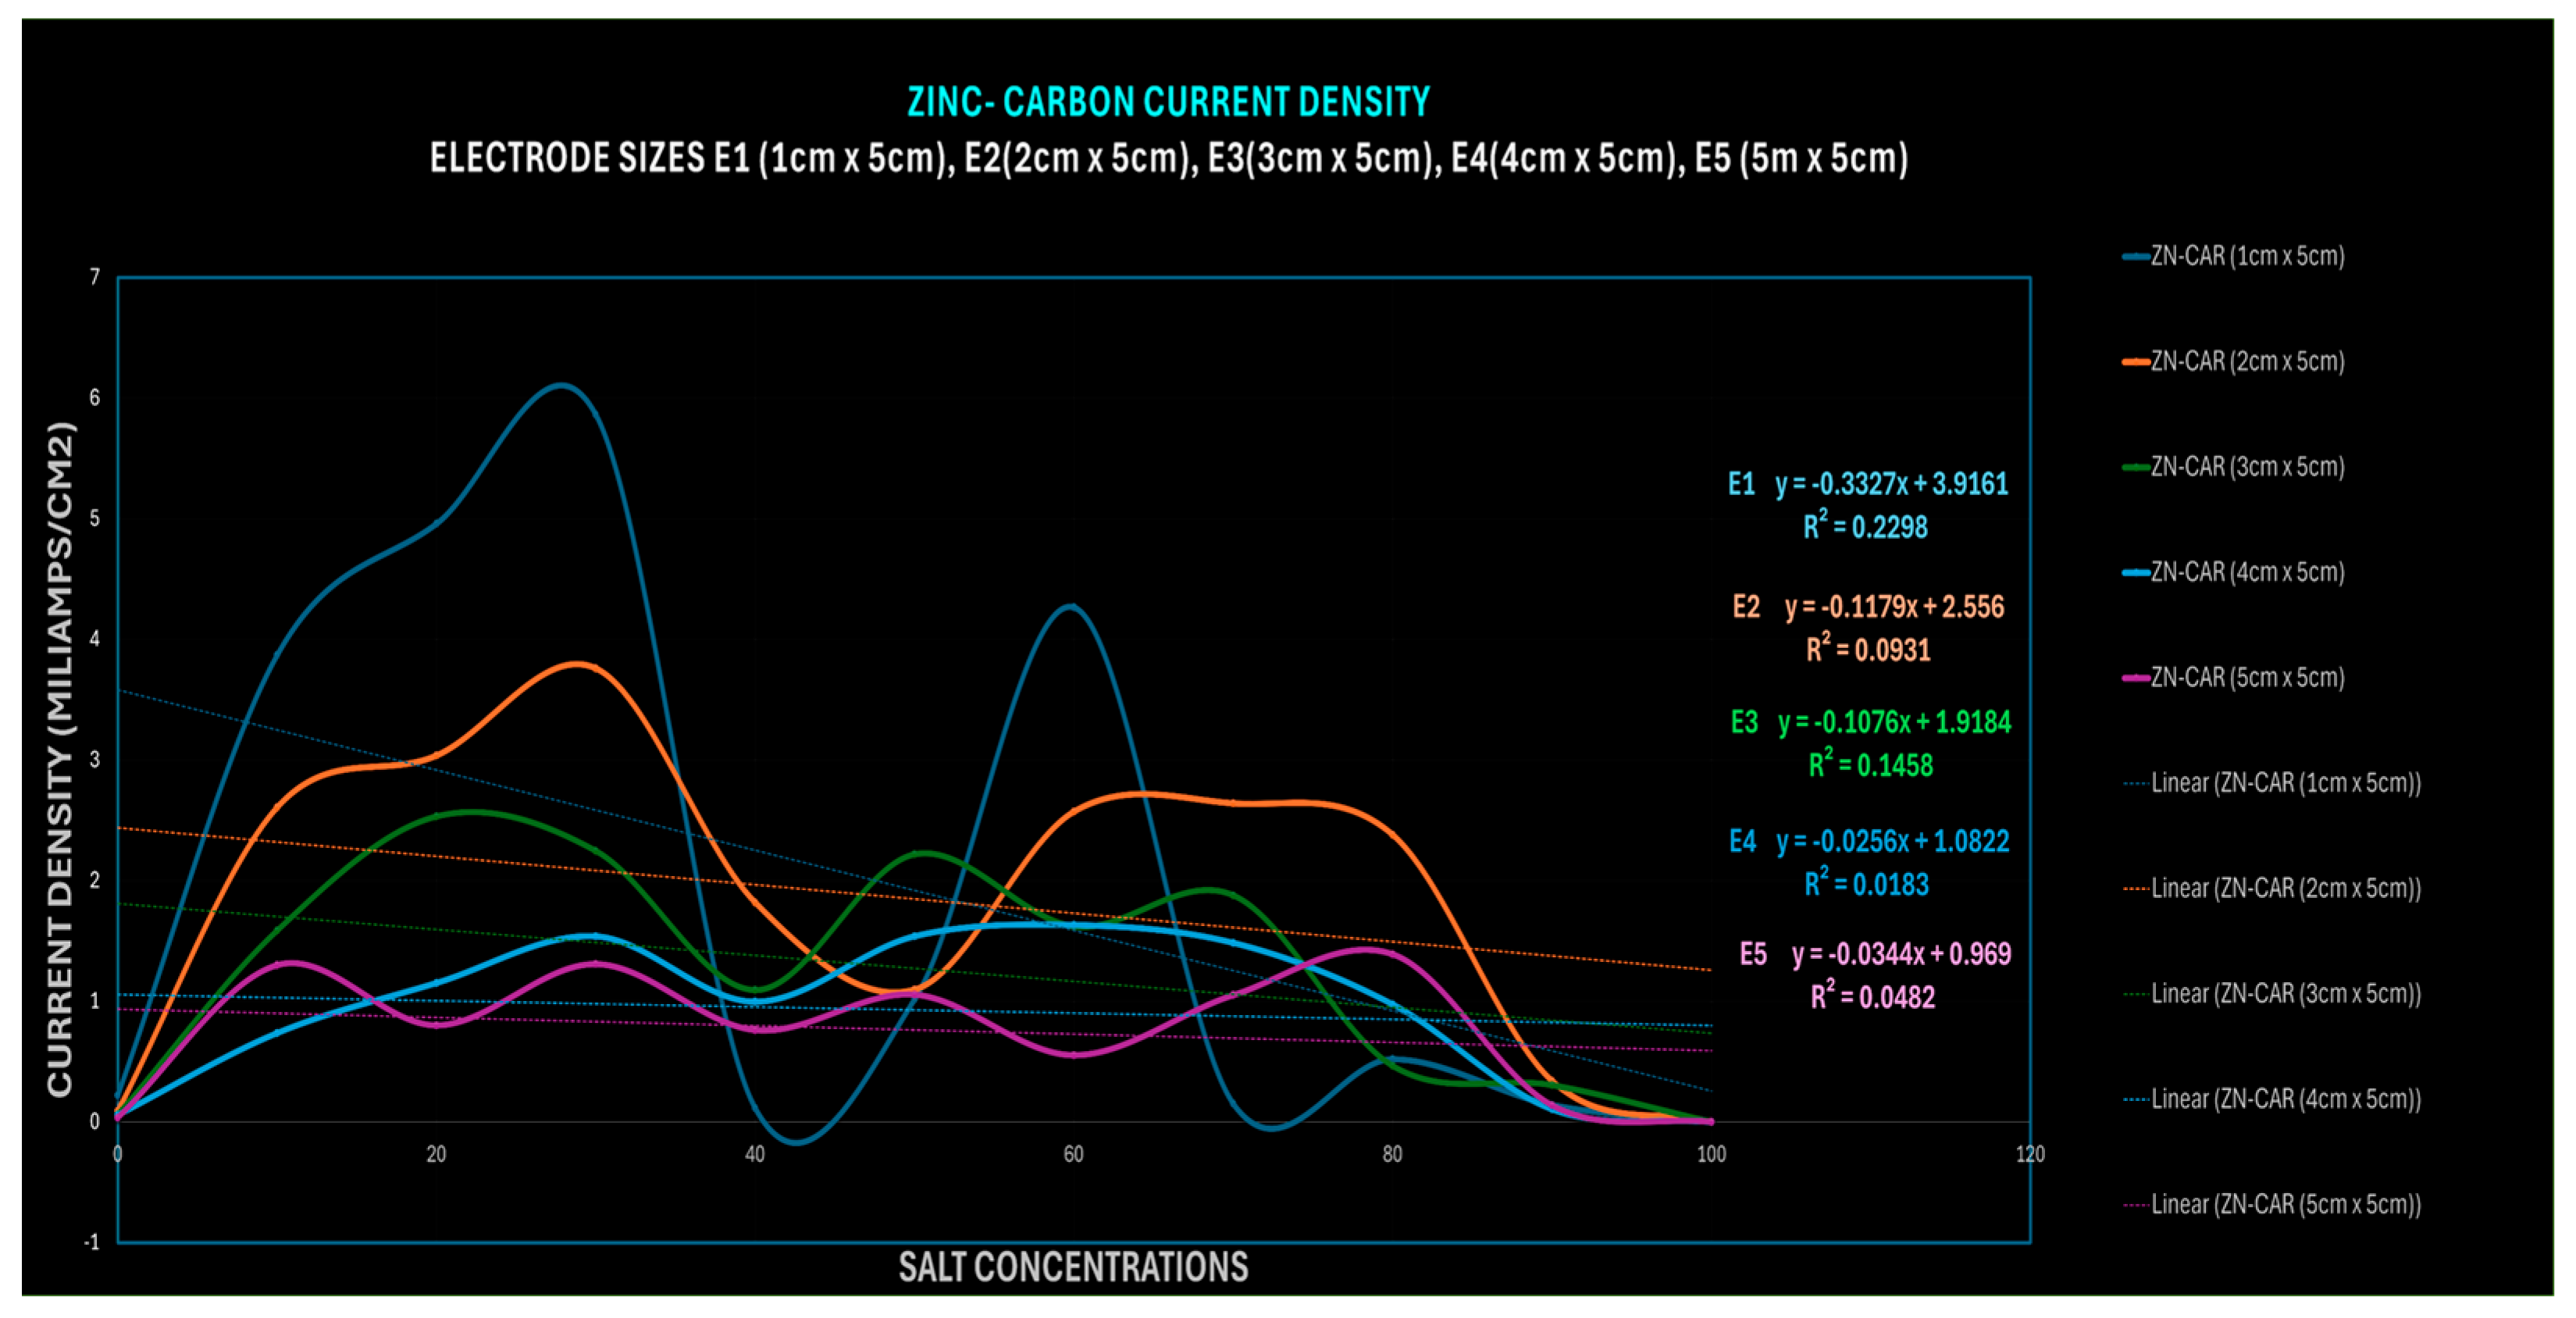
Current density was calculated by dividing the SCC by the electrode area for the different electrode sizes (E1–E5). The current density was used to determine which salt concentration produced the highest current density per cm2. The results shown in Figure 7 illustrate that the 30% and 60% salt concentrations produced the highest current densities. The 30% salt concentration represents the saturation point. At this concentration, there is an equilibrium between the ions dissolving in the water and the ions remaining undissolved over a longer period. In contrast, solutions with higher salt concentrations become oversaturated, resulting in excess salt remaining undissolved in the solution. From Figure 7, E1 electrode size has the highest current density. Followed by E2. Highest current density readings were observed at 30% then 60% salt concentration.
Figure 7.
Electrode Current Density for five electrode surface areas (E1–E5) (1 cm × 5 cm to 5 cm × 5 cm).
- C.
- Effect of Electrode Area on Internal Resistance
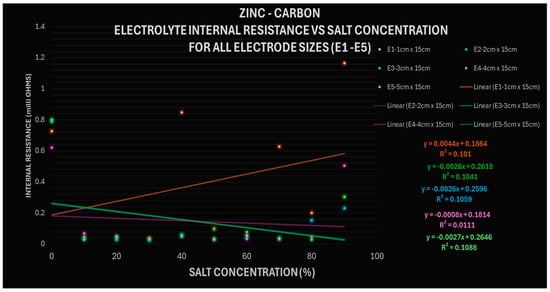
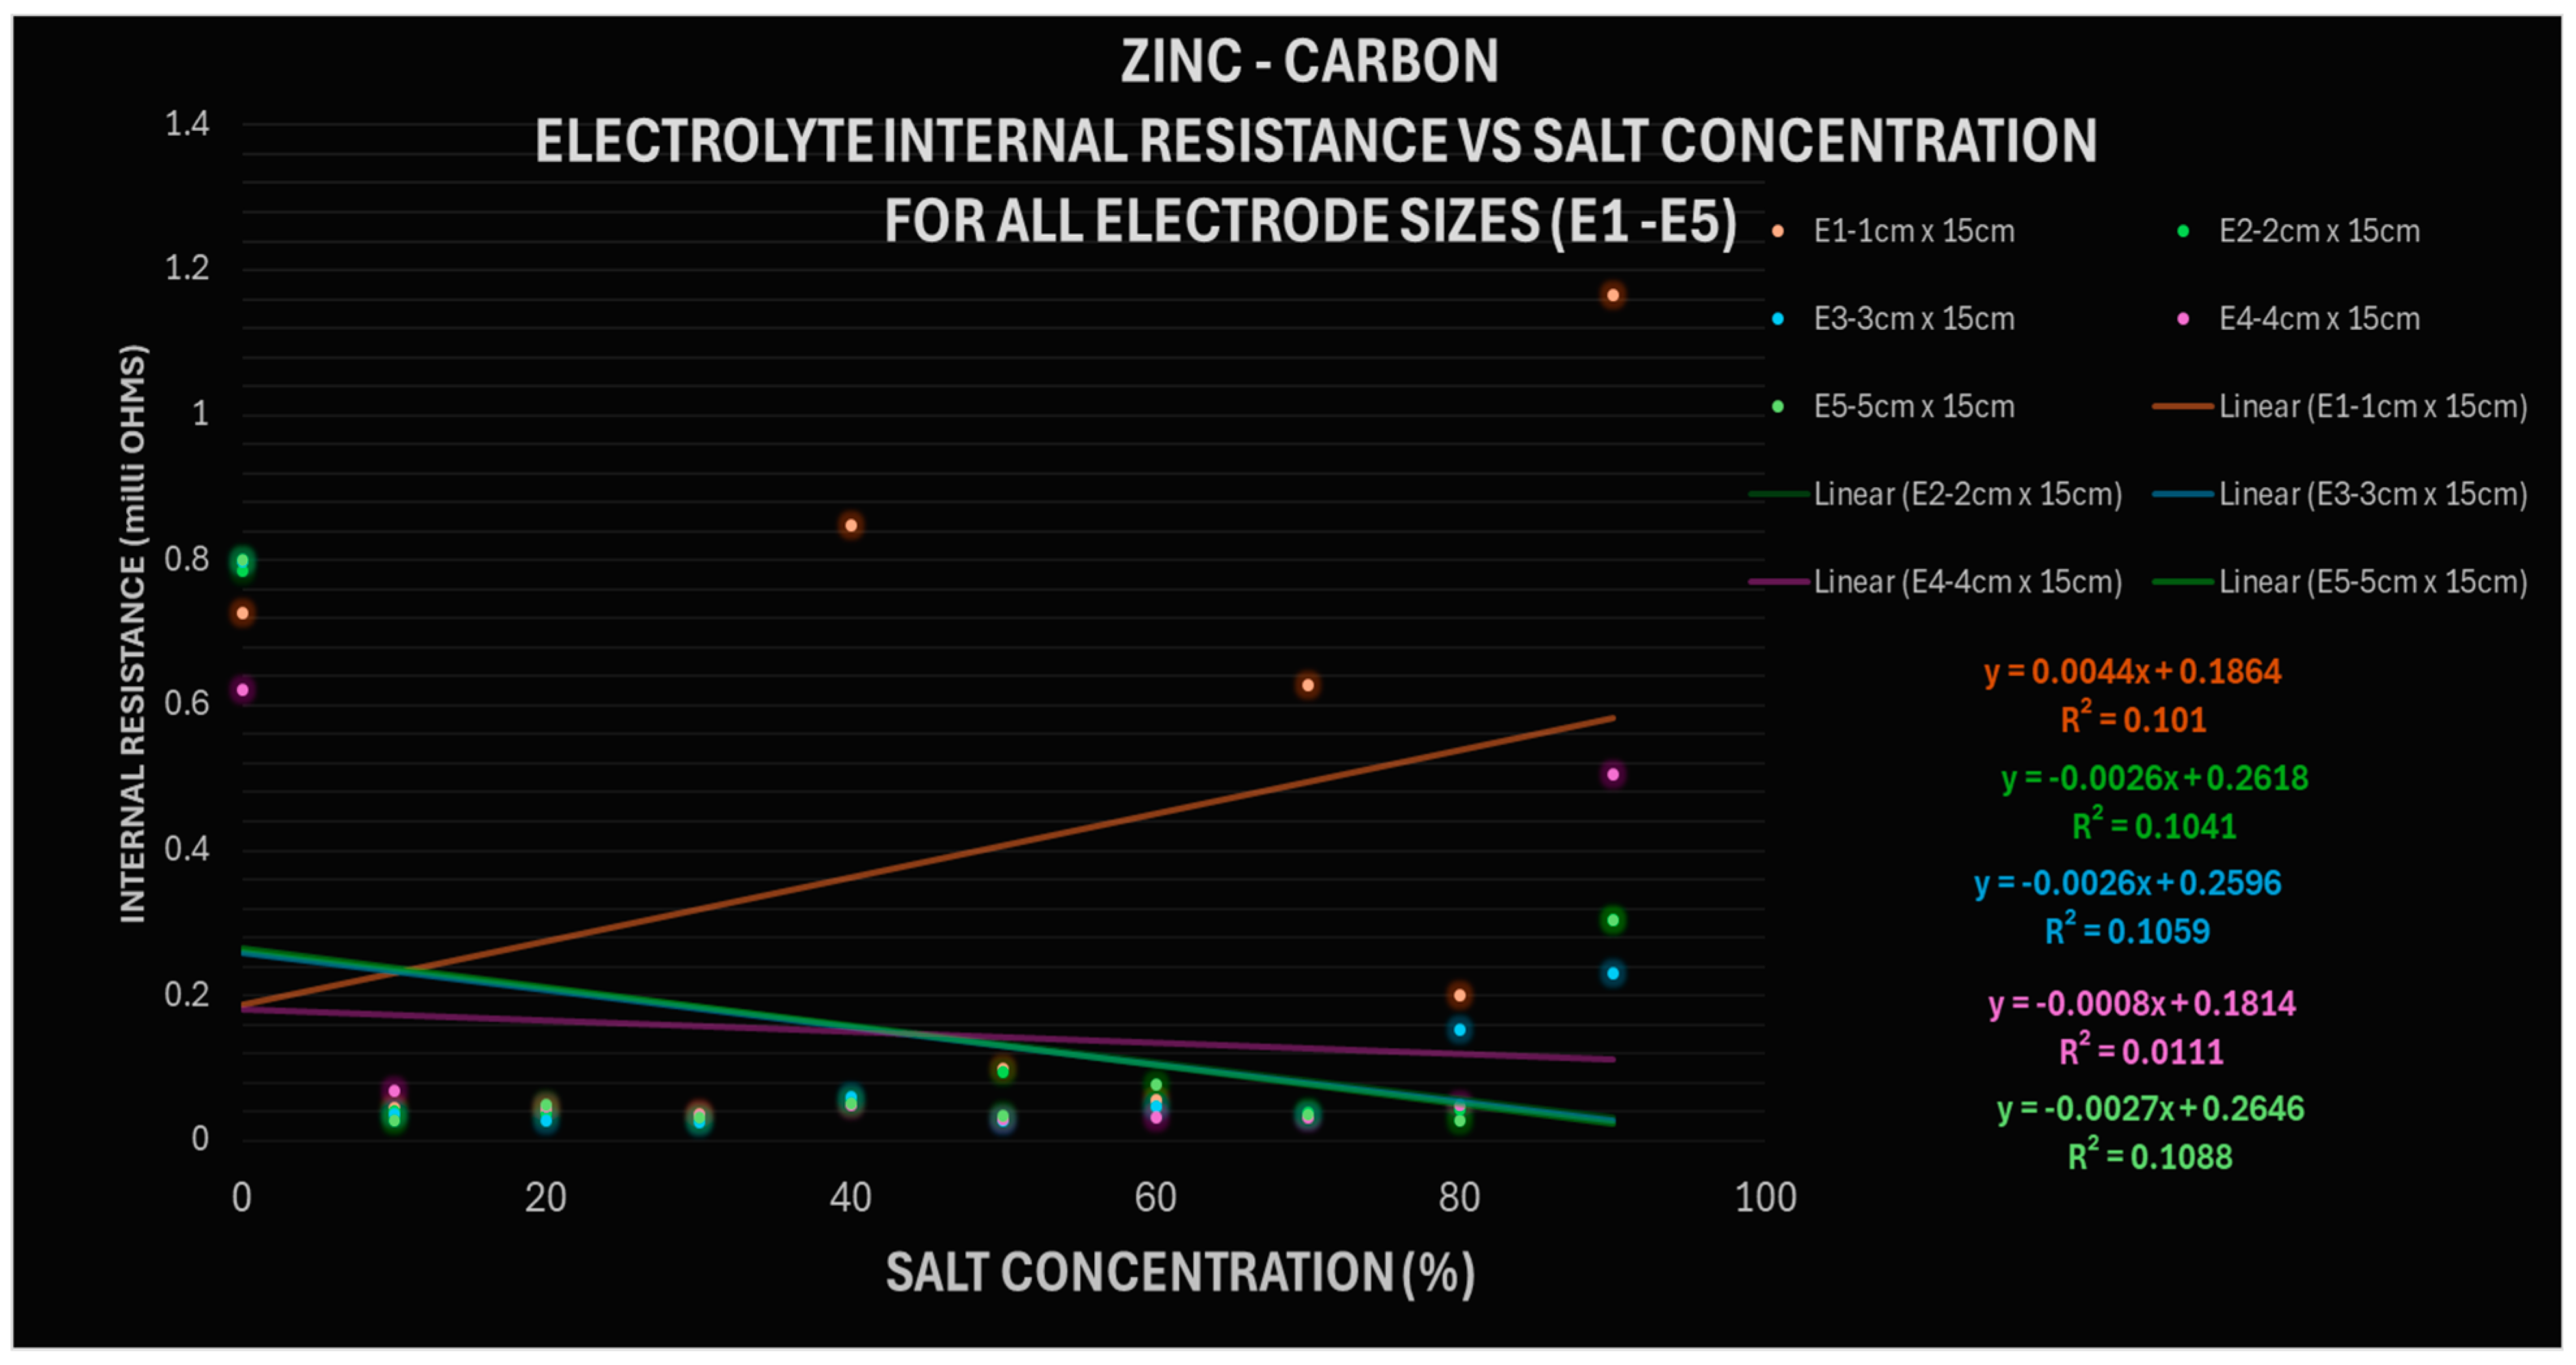
For battery making, the shorter the electrode, the lower the electrode resistance, and the smaller area the electrode, the lower its contribution to the total cell resistance. A lower electrode area increases current density. Metals like iron and tin, which are lower in the reactivity series, corrode quickly. This corrosion leads to the formation of an oxide layer that inhibits ion mobility, resulting in an increase in the internal resistance of the cell. In Figure 8, for Zn–Carbon, cell resistance is on average ±0.227 mOhms.
Figure 8.
Zinc–Carbon Cell Internal resistance across all concentrations with increasing electrode area.
- D.
- Effect of Electrode Area on Short Circuit Current
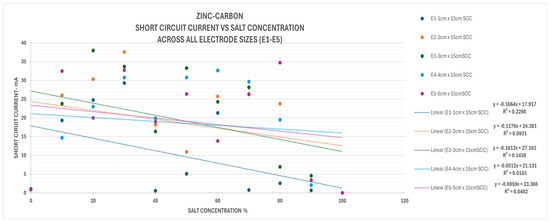
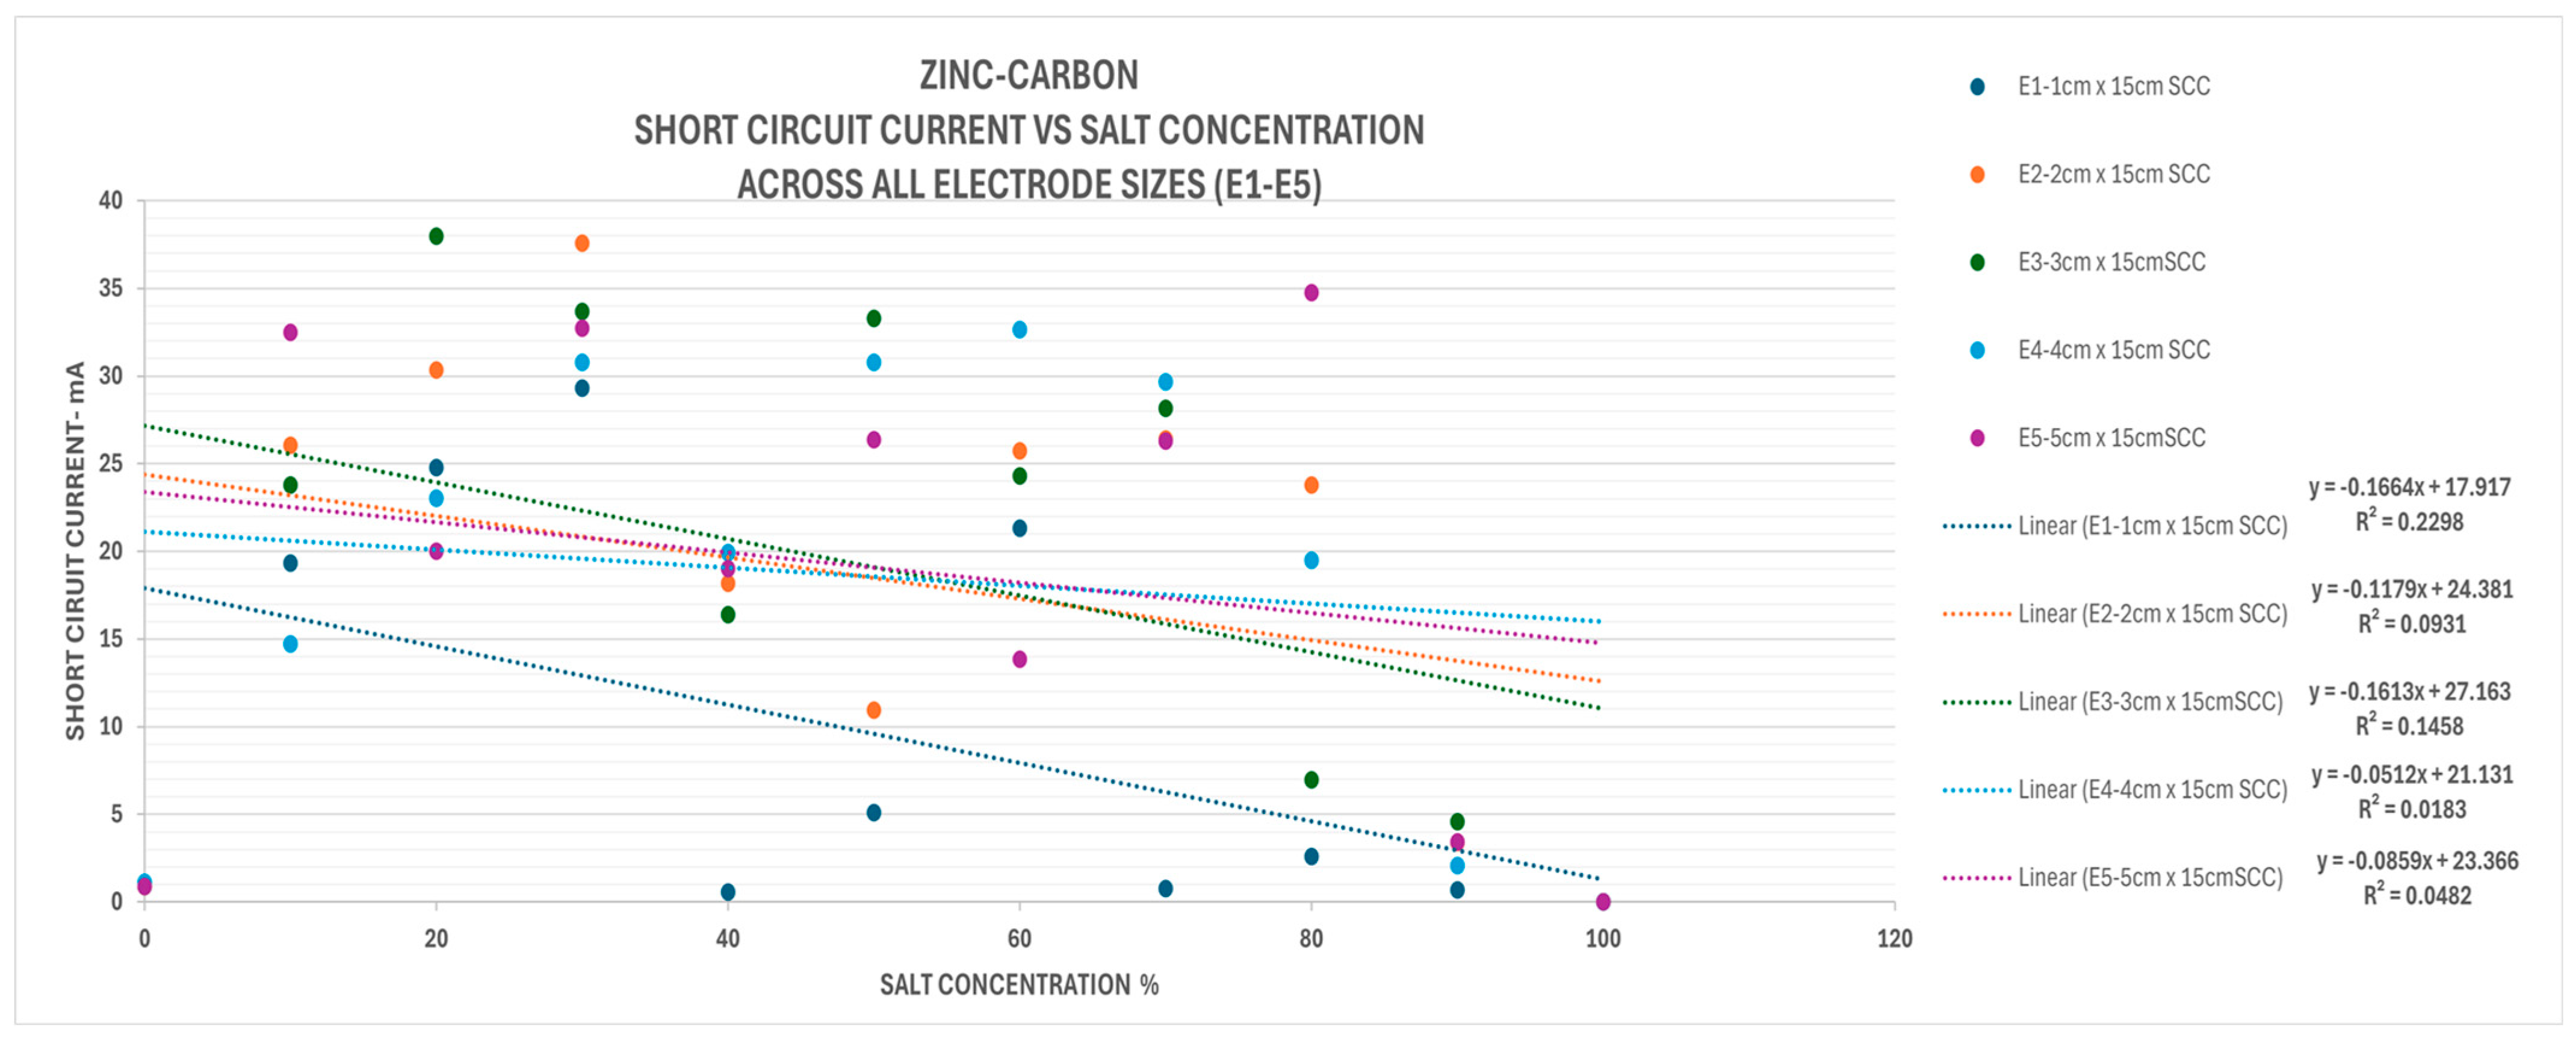
Short Circuit Current increased with increase in electrode area. An increase in electrode area results in a decrease in internal resistance, as in Relectrode ∝ 1/A. This resulted in a higher SCC with the increase in area. However, due to the increase in electrolyte internal resistance, Relectrolyte, with increase in concentration, SCC values dropped as shown in Figure 9. For maximum SCC output, large surface area and electrolyte at saturation equilibrium are required. The maximum area can be achieved by use of powdered or paste anode (anolytes) as seen in common household batteries. Figure 9 shows decrease in Short Circuit Current across all Electrode sizes with increasing salt concentration. This is due to an increase in electrolyte internal resistance with an increase in salt concentration. Zinc–Carbon average SCC is 22.4 mA ± 4.623 mA deviation.
Figure 9.
Effect of Electrode sizes and electrolyte concentration on short circuit current readings.
3.1.2. Effect of Electrode Distance
The results from the experiment show that OCV is independent of the electrode spacing. This is because OCV is determined by the electrode pairing as mentioned in Section 3.1.1. However, electrode distance affects the settling time of the OCV where shorter distances give a shorter settling time to maximum OCV.
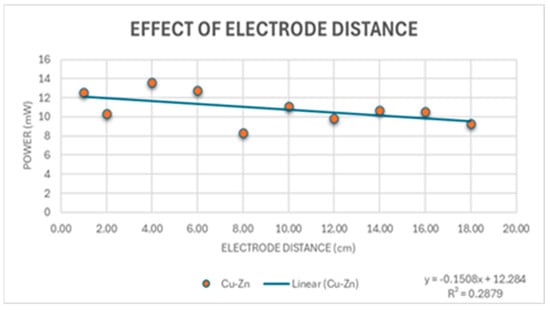
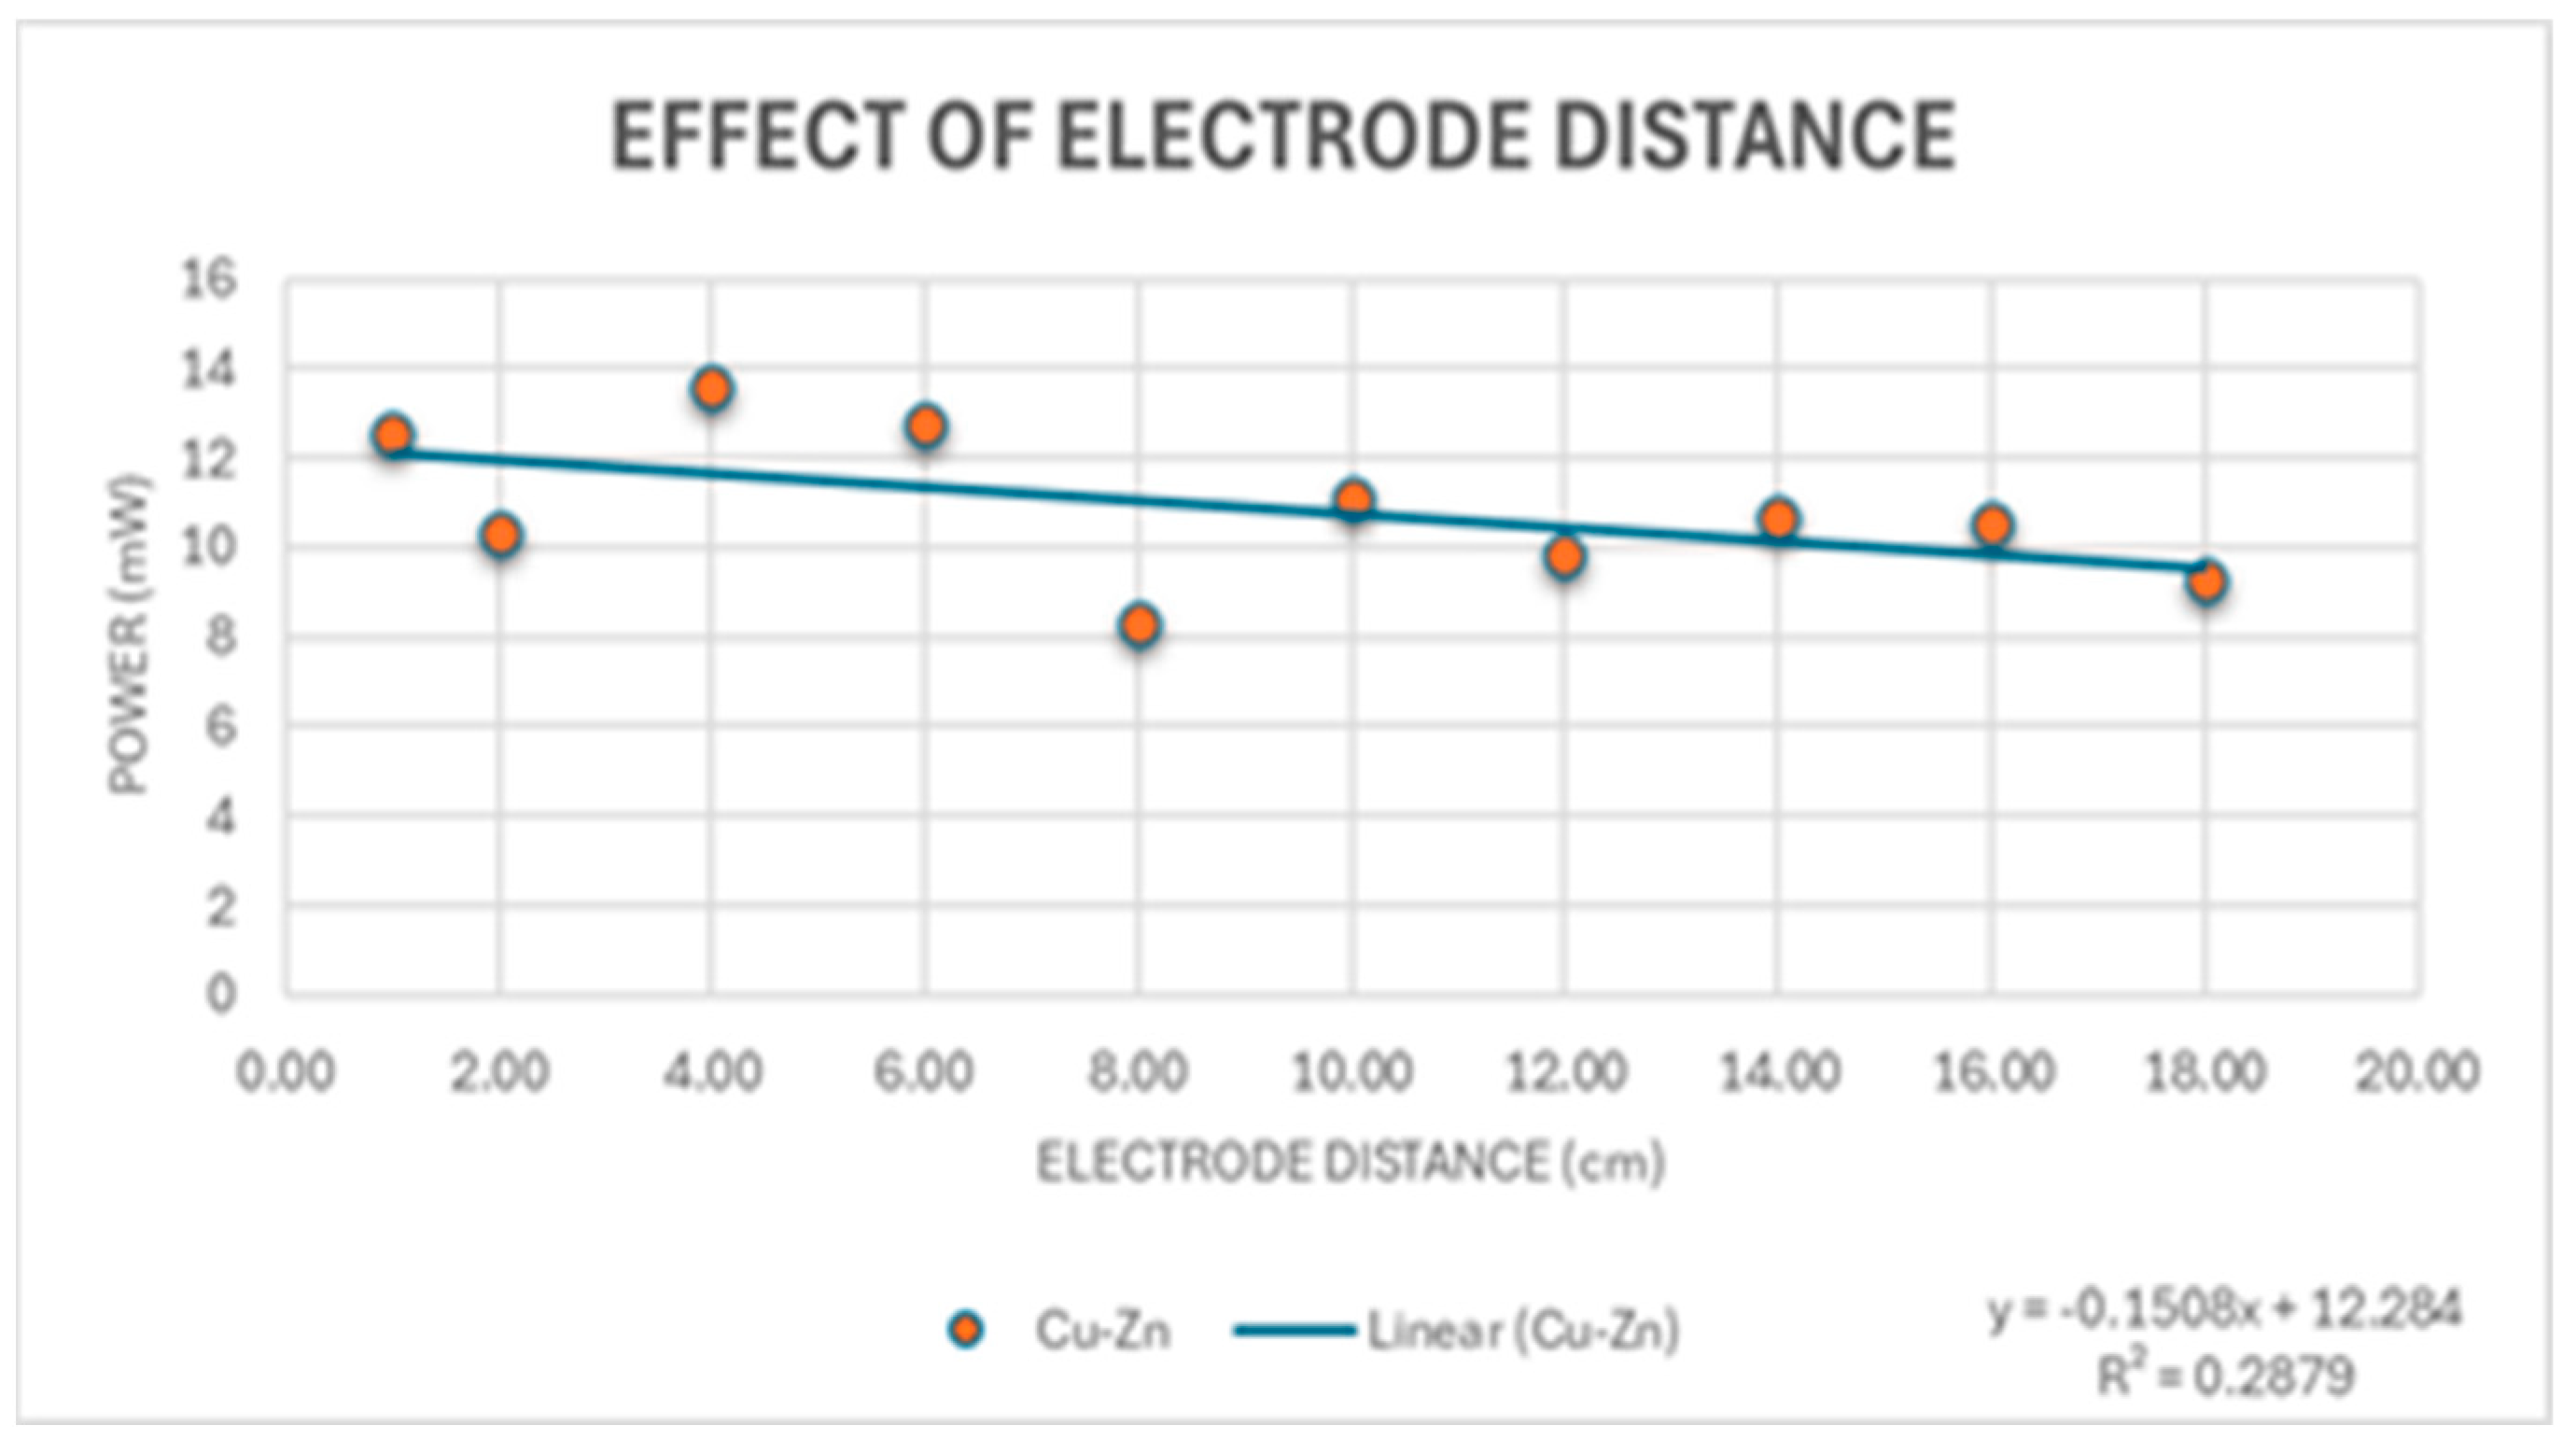
For SCC, the electrode spacing increases the internal resistance of the electrolyte Relectrode ∝ D, where D is the distance between the electrodes. The increase in internal resistance due to electrode spacing reduces the short-circuit current, the maximum current of the cell. This results in a decrease in cell output power at a rate of −0.75 mW/cm as shown in Figure 10.
Figure 10.
Effect of electrode spacing on cell power (Cu–Zn) pairing.
3.1.3. Effect of Electrode Geometry
The readings show that the OCV is determined by the electrode potential between the paired electrodes and not by the salt concentrations. Electrode pairings of 22–32 mm (larger-diameter tubes) have lower OCV and SCC compared with 15 mm diameter tubes. The geometry affects the current density. Hollow tubes have lower OCV and SCC and have an increased surface area, lowering the current density. Rod anode electrodes produce a lower OCV compared to plate electrodes. Rod electrodes have a lower SCC and lower specific cell capacity due to the increase in weight, resulting in heavier cells, which are not ideal.
- A.
- Electrode Structure
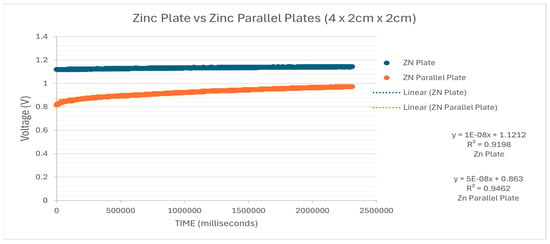
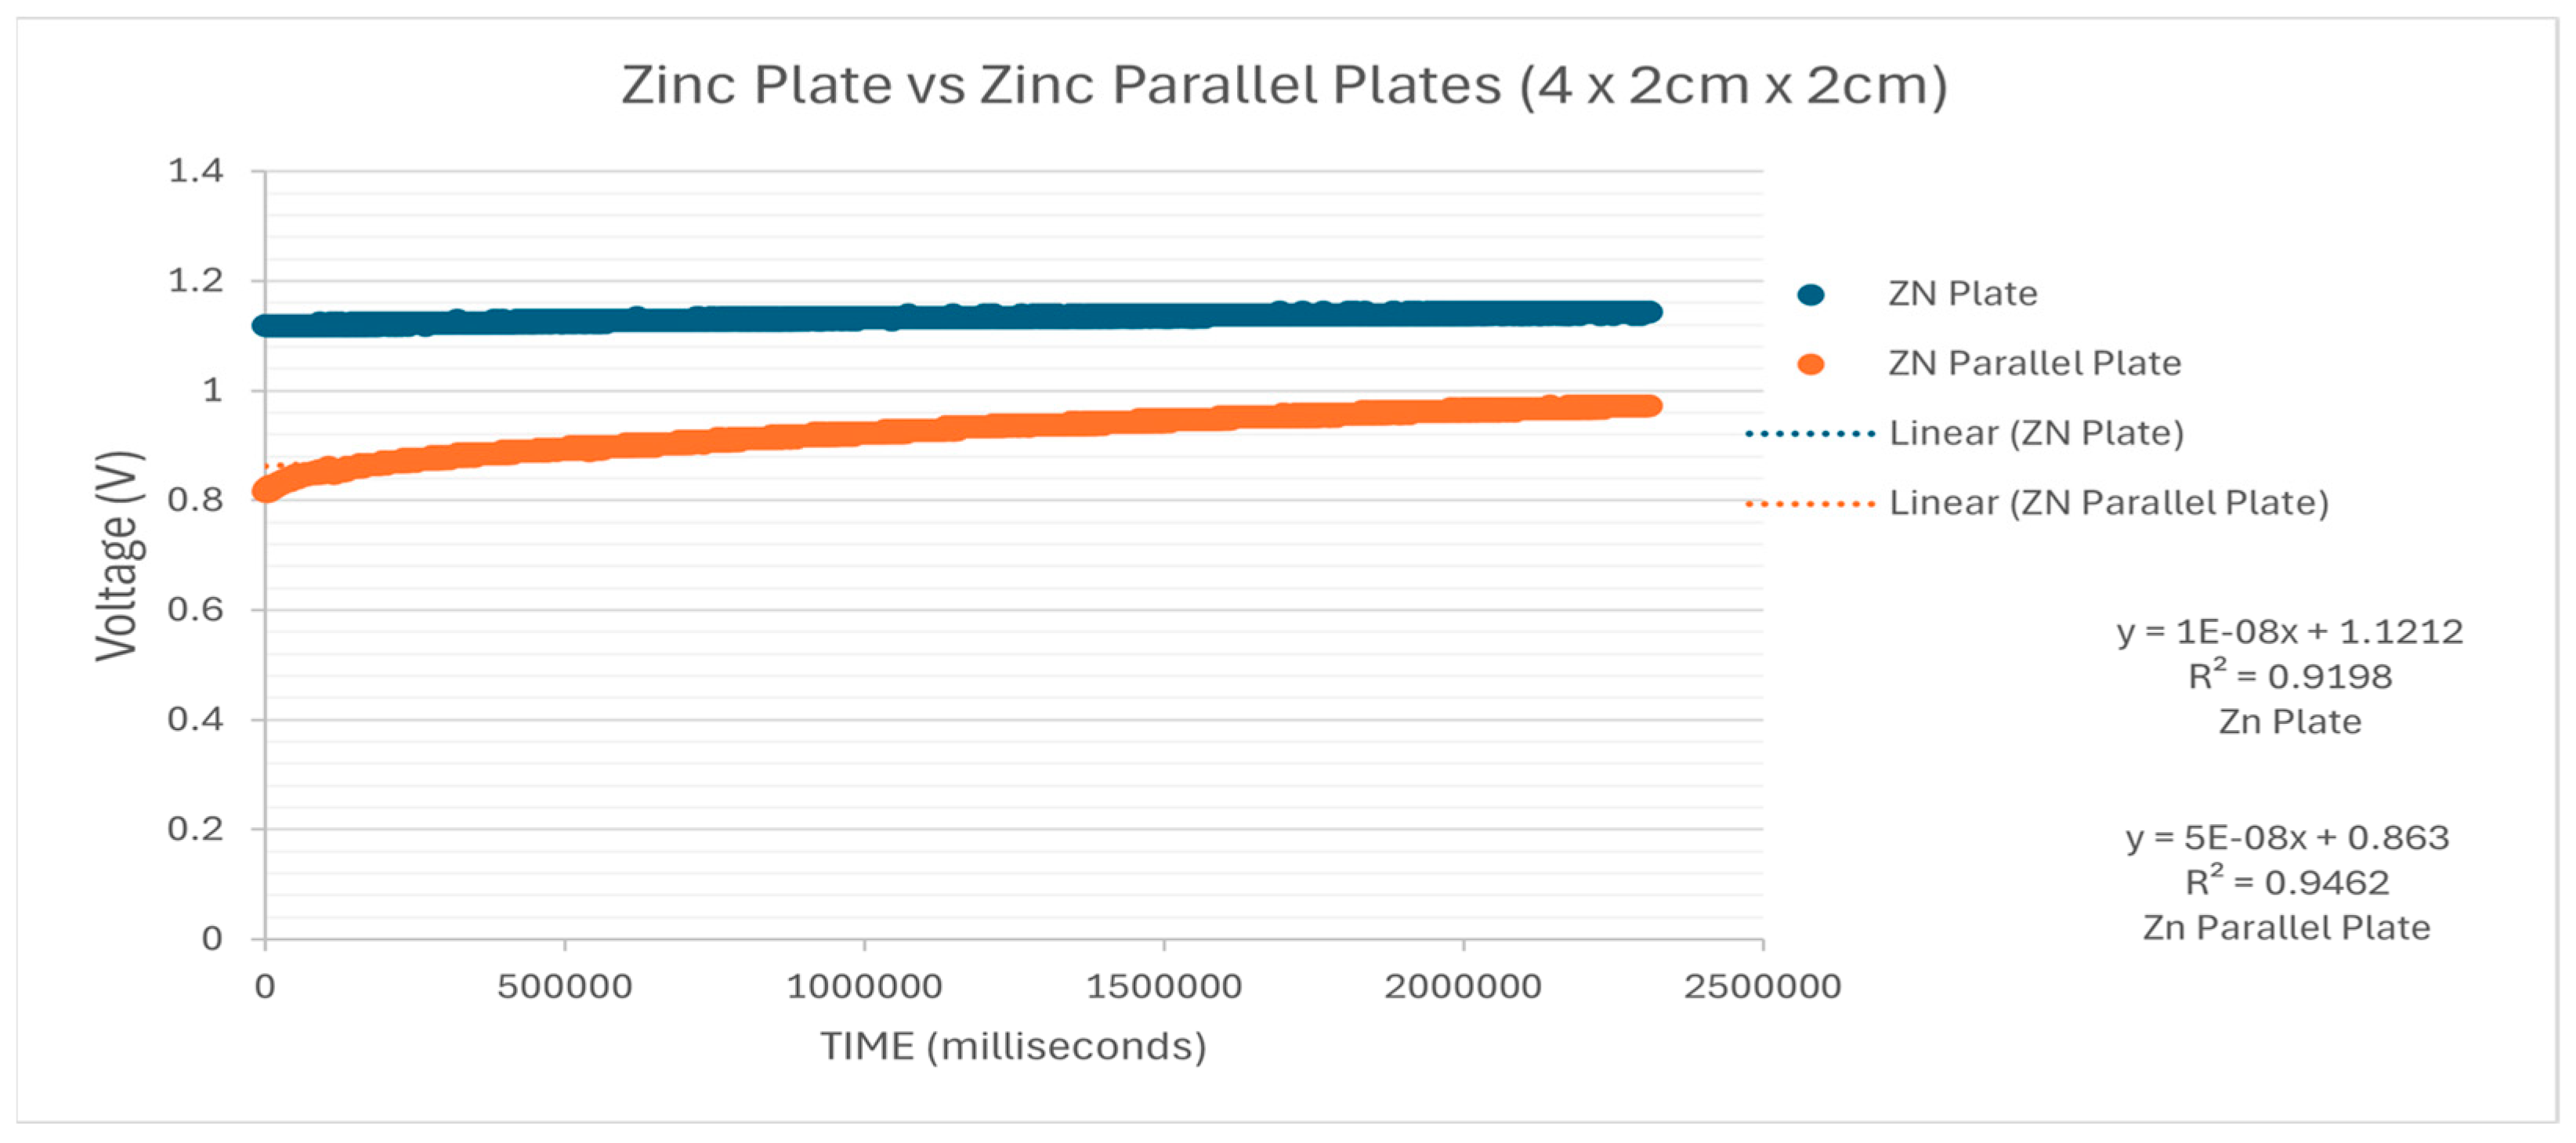
Figure 11 above illustrates the results from the experiment described in Section 2.1.4 in comparison to the single flat zinc electrode. The results show that a single flat zinc electrode has a higher OCV compared with that of the parallel plate structure. A possible explanation for this finding is that the parallel plates create capacitive spaces in between, reducing the number of ions released for a higher potential difference. The parallel structure, however, will result in a higher SCC due to the stored charge.
Figure 11.
Voltage comparison of parallel plates with flat zinc plates.
3.1.4. Effect of Concentration
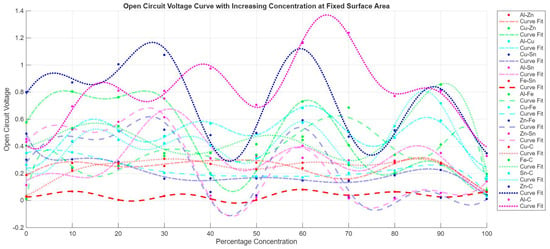
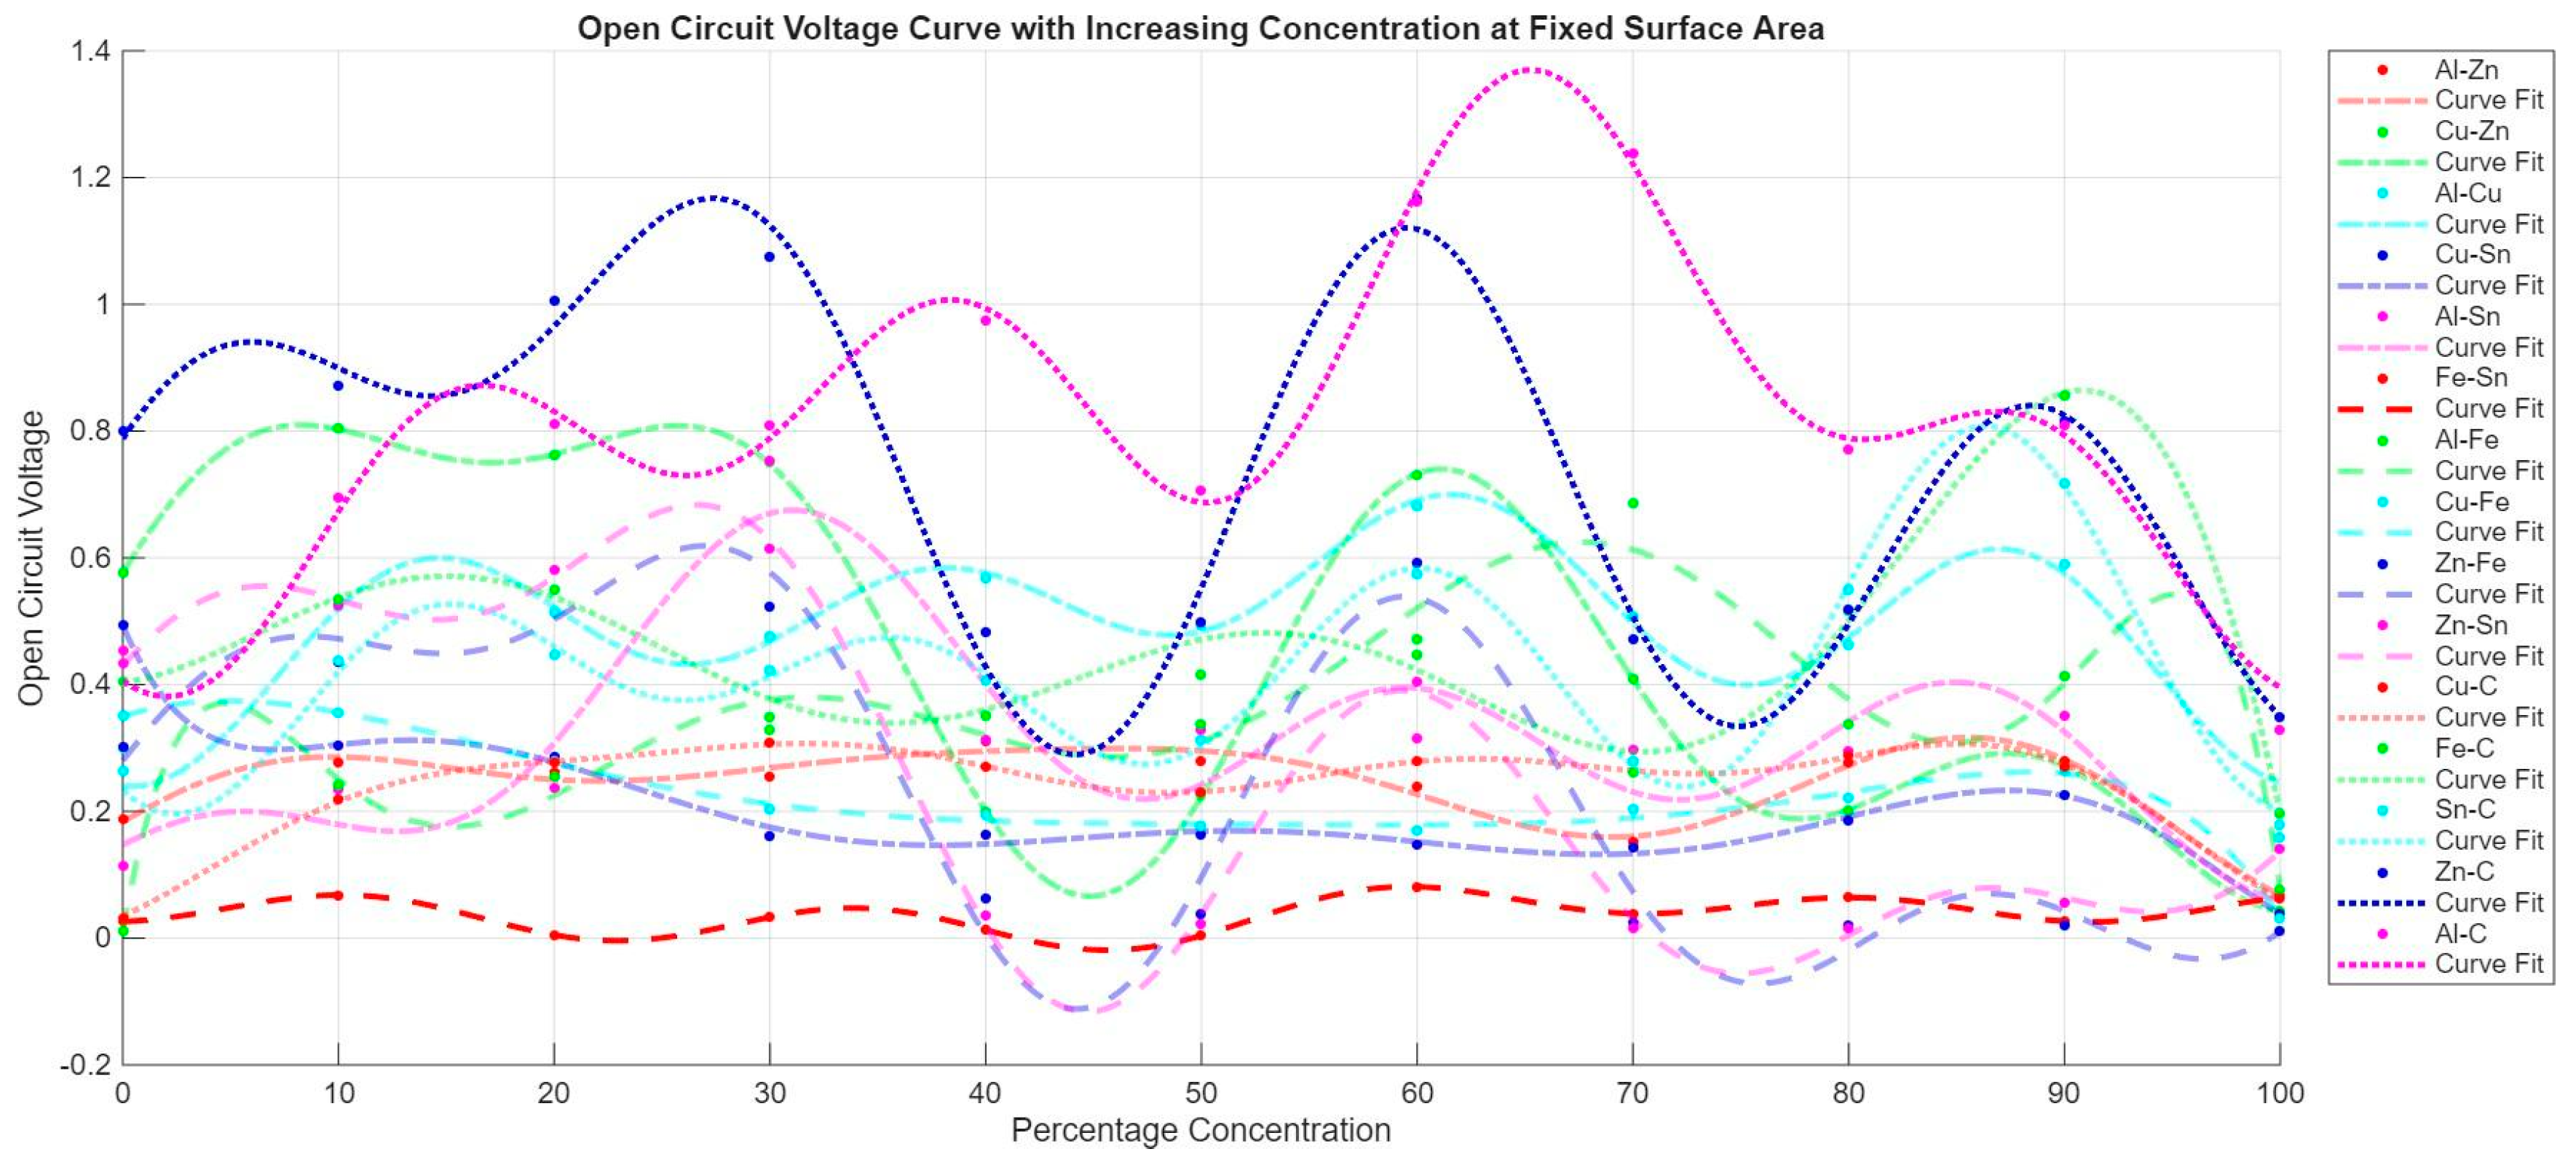
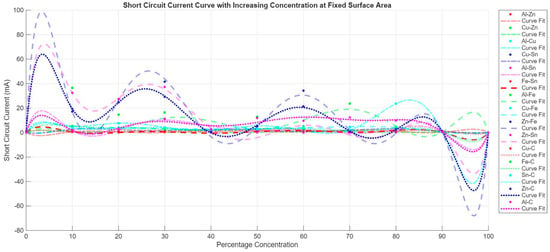
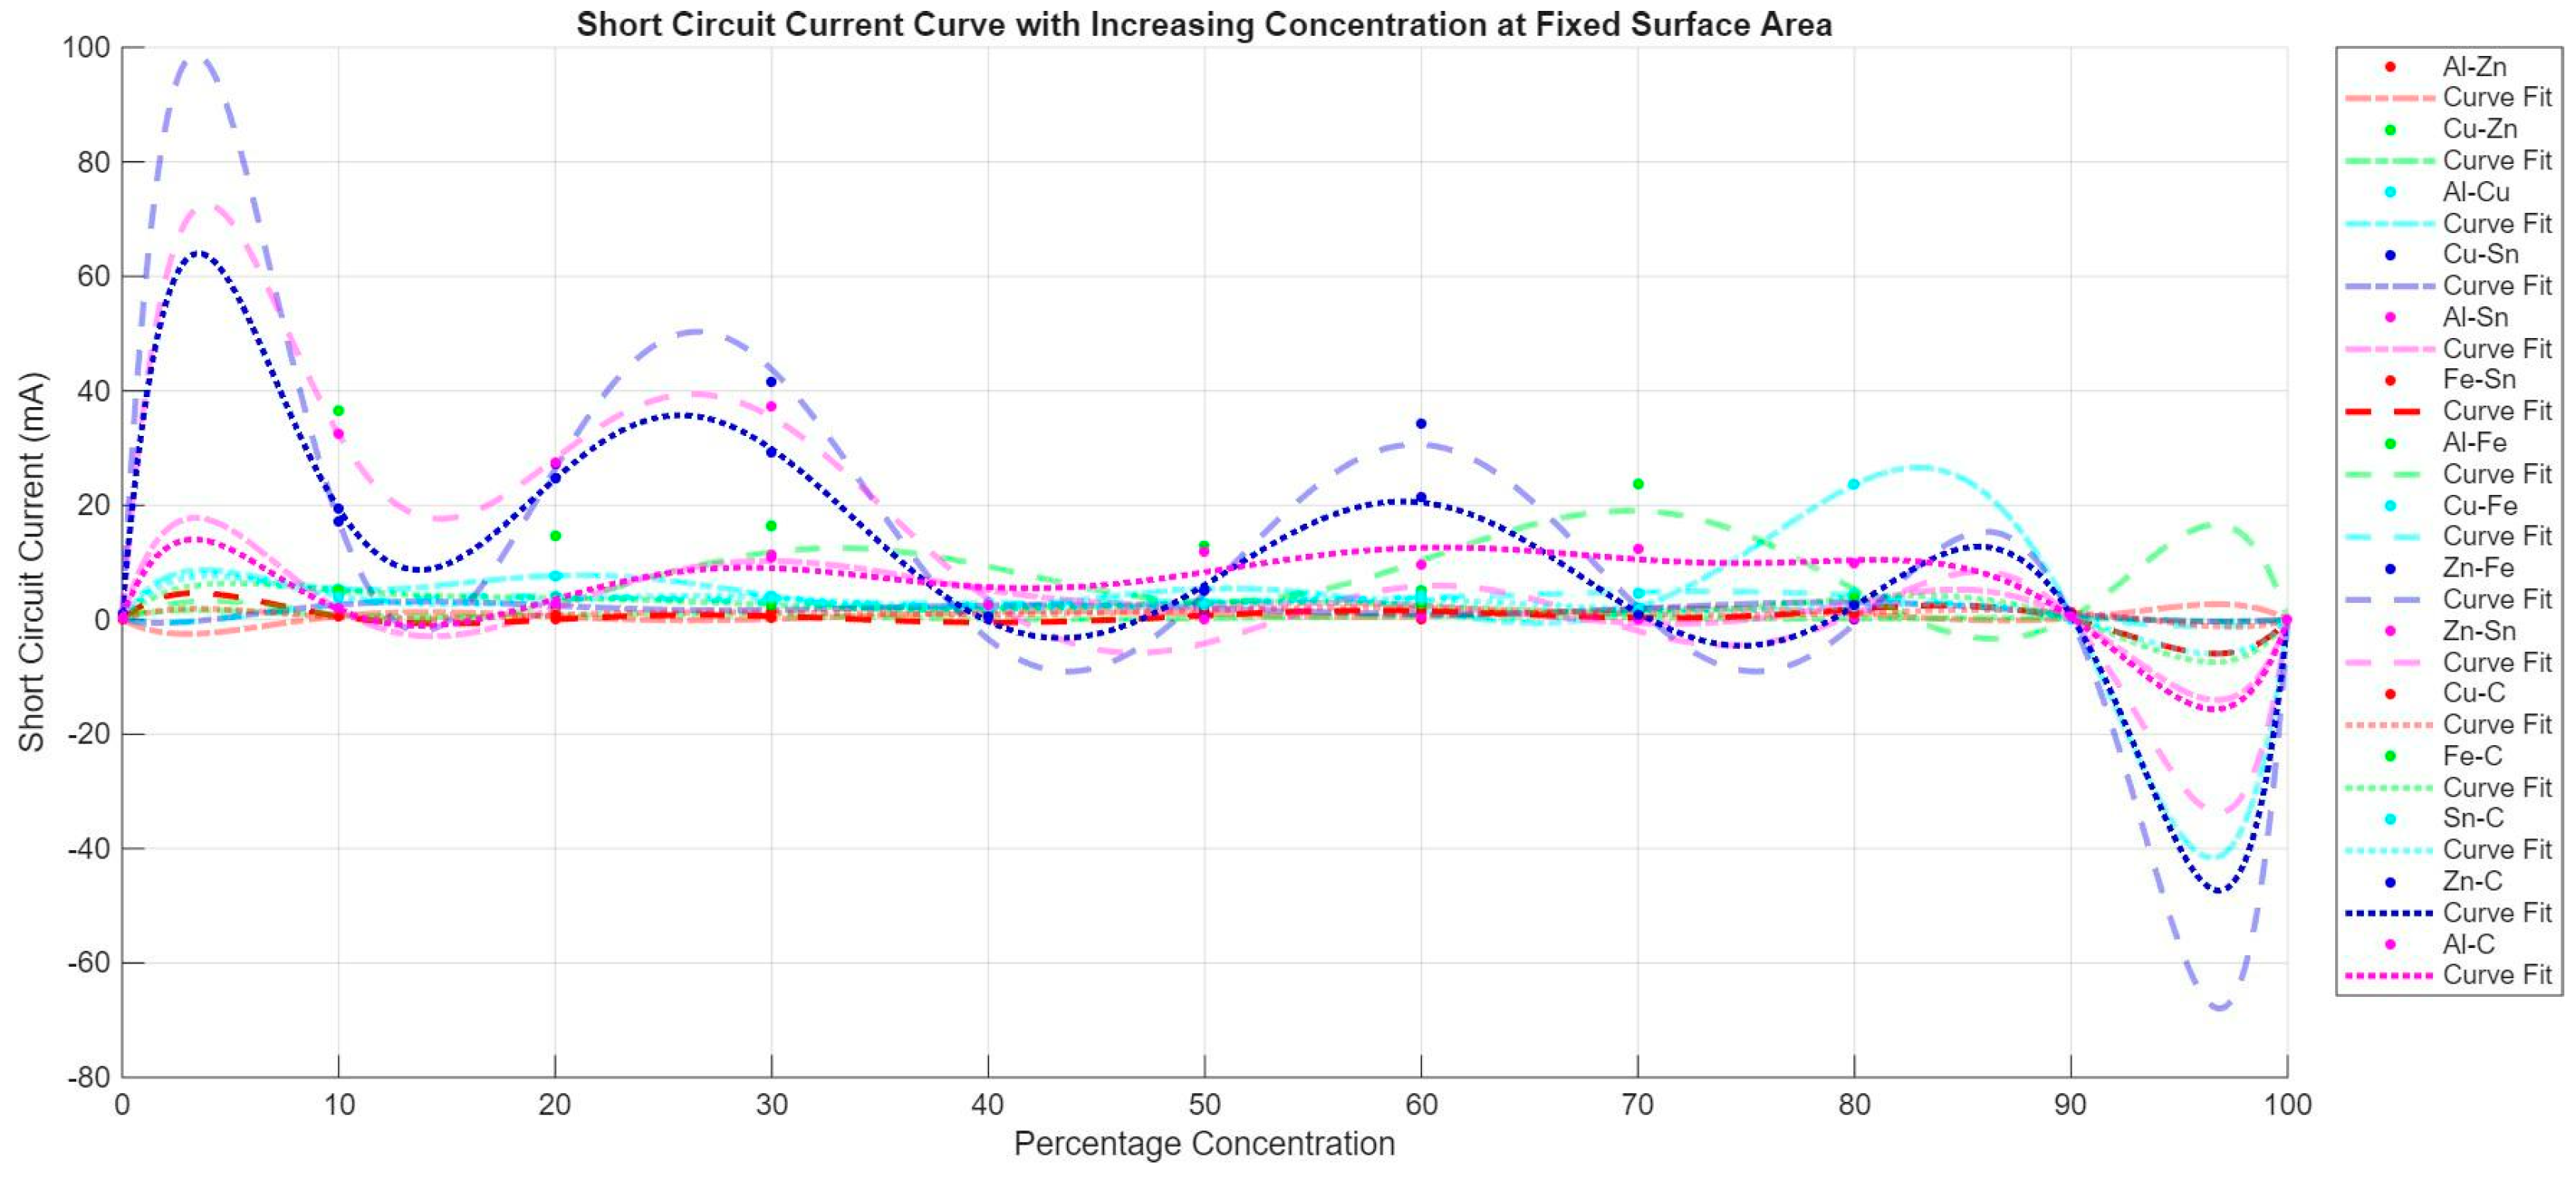
Figure 12 and Figure 13 show the changes in OCV and SCC, respectively, with increasing concentration, both graphs are data-fitted using four-term fourier series. The results show that the OCV is independent of the salt concentration and is determined by the electrode potential difference between the electrode pairings. As shown in Figure 12, the best-performing pairs are clearly Al-C and Zn-C, followed by Cu-Zn. The poorest-performing pair is Fe-Sn. These findings confirm the results obtained in the electrode tests and also show that the OCV of the cell is unrelated to the increasing salt concentration; the highest value for Al-C is 1.161 V and the lowest is 0.328 V. The highest readings occur at 30% and 60% salt concentrations. This varying pattern may be partially explained by the increase in dissociated NaCl ions, thereby reducing the internal cell resistance until saturation point. In Figure 13, the results show a non-linear relationship between SCC and increasing salt concentration. The SCC is limited by the internal resistance of the cell. The internal resistance increases non-linearly with an increase in salt concentration. Increasing the salt concentration increases the SCC, suggesting an increase in the number of ions. The increase in ion mobility decreases after 30% concentration, as seen in the slower settling time and lower SCC values. The conductivity of the electrolyte increases from 0%, with an internal resistance of 0.709 Ω, to its highest conductivity at 30%, with an internal resistance of 0.0026 Ω.
Figure 12.
Plot of OCV vs. Salt concentration for all 15 electrode pairs.
Figure 13.
Plot of SCC vs. Salt concentration for all 15 electrode pairs.
3.1.5. Effect of Water Purity
The results of the water purity test show that cells prepared with tap water, compared with identical cells prepared with distilled water, have a higher OCV across all five surface areas and for both pairings. The SCC results, however, show that distilled water has higher internal resistance. This is only true for salinity beneath a saturation point of 30%. After saturation, distilled water outperforms tap water for both SCC and OCV. This is visible in Figure 5.
3.1.6. Effect of Electrolyte Flow
From the experiment, it was observed that the voltage rises when the solution is stirred. This implies that flow in the electrolyte solution improves ion mobility and removes the thin layer of depleted electrolyte around the electrodes; however, the energy poured into the system is greater than the small benefit from the increase in voltage and cell current. The effect of laminar and turbulent flow on the OCV and SCC needs to be examined further. It is anticipated that high speeds give turbulent flow, which would lower the OCV due to irregularity in the flow direction of ions. Laminar flow is expected to result in temporal higher OCV readings.
3.2. Cell Behaviour Results
3.2.1. Long-Term Cell Tests
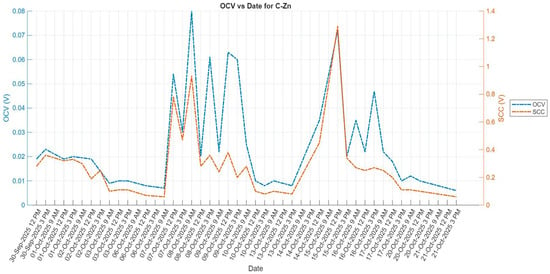
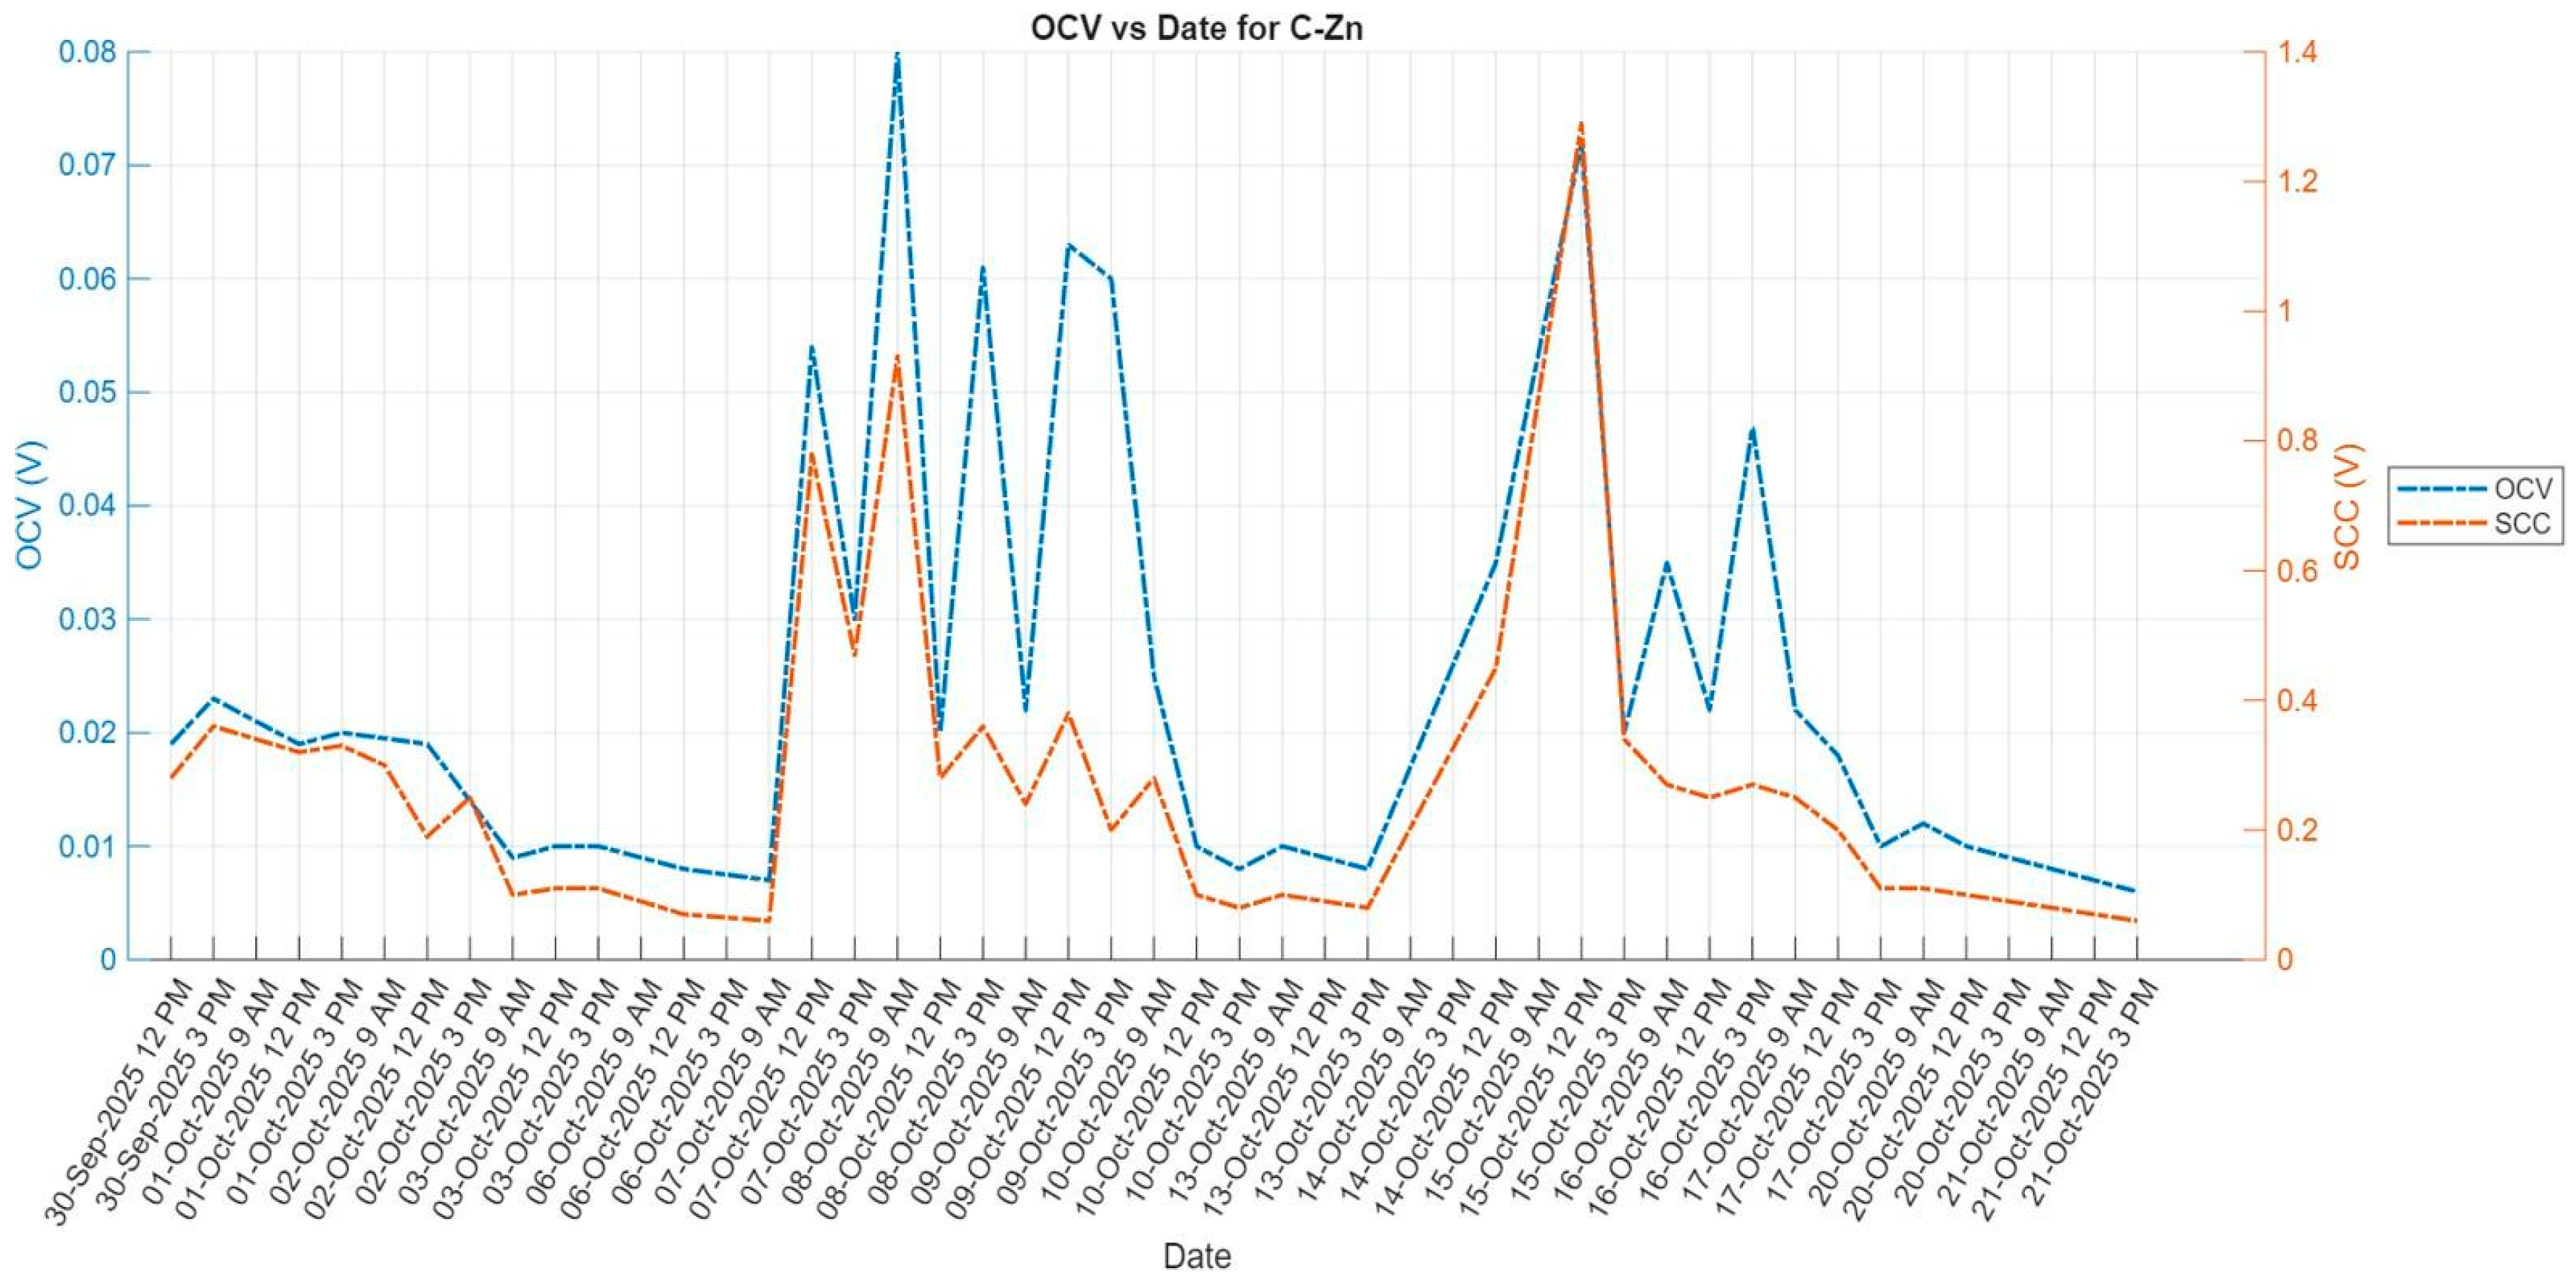
The graph in Figure 14 shows a decreasing voltage over time (in blue), showing a loss of power as the cell is discharged across the load. The area under the voltage and current curves gives an estimate for the power rating of the C-Zn cell (20.832 mW). The cells were monitored over 21 days, i.e., 504 h. The calculated energy capacity was 6.010 µW. The weight of the cell was about 200 g, yielding an energy density of 0.03005 µW·g−1. The readings show sudden increase at 12 pm confirming that increase in temperature increases in kinetic energy, improving ionic mobility in the solution to give higher OCV and SCC readings. However, increase in temperature decreases the energy capacity of the cell as the ions are depleted faster.
Figure 14.
Long-term cell behaviour: The graph shows the OCV and SCC readings taken over three weeks for the Zinc-Graphite cell.
3.2.2. Chemical Tests
Chemical litmus paper tests were performed on the by-products of the long term cells. It was found that cells in which one of the electrodes is corroded were slightly acidic. The alkaline cell products, when mixed with hydrochloric acid, produced a white salt that was NaCl. Hydrogen burned with a pop sound in Al-Cu and Zn-Cu cells. All Zn-Sn, Al-Sn, Al-Cu and Zn-Cu cells burst over the period 3 weeks due to gas pressure formed inside the cell. This shows that combinations of electrolyte and anode-cathode pairs that result in gas production must be avoided for batteries in closed casings, unless a gas outlet is included in the battery design.
4. Discussion
The internal resistance of a cell increases with a larger electrode surface area, diameter, and length. A greater distance between the electrodes also raises internal resistance, which is further influenced by the reactivity of the electrode pairs. Measurements taken with inserted rods showed lower internal resistance because they reduced the inter-electrode distance. These give rise to the total resistance due to the electrodes as a parameter, Relectrode.
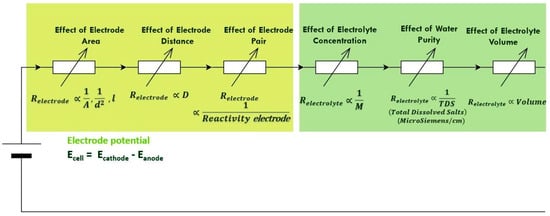
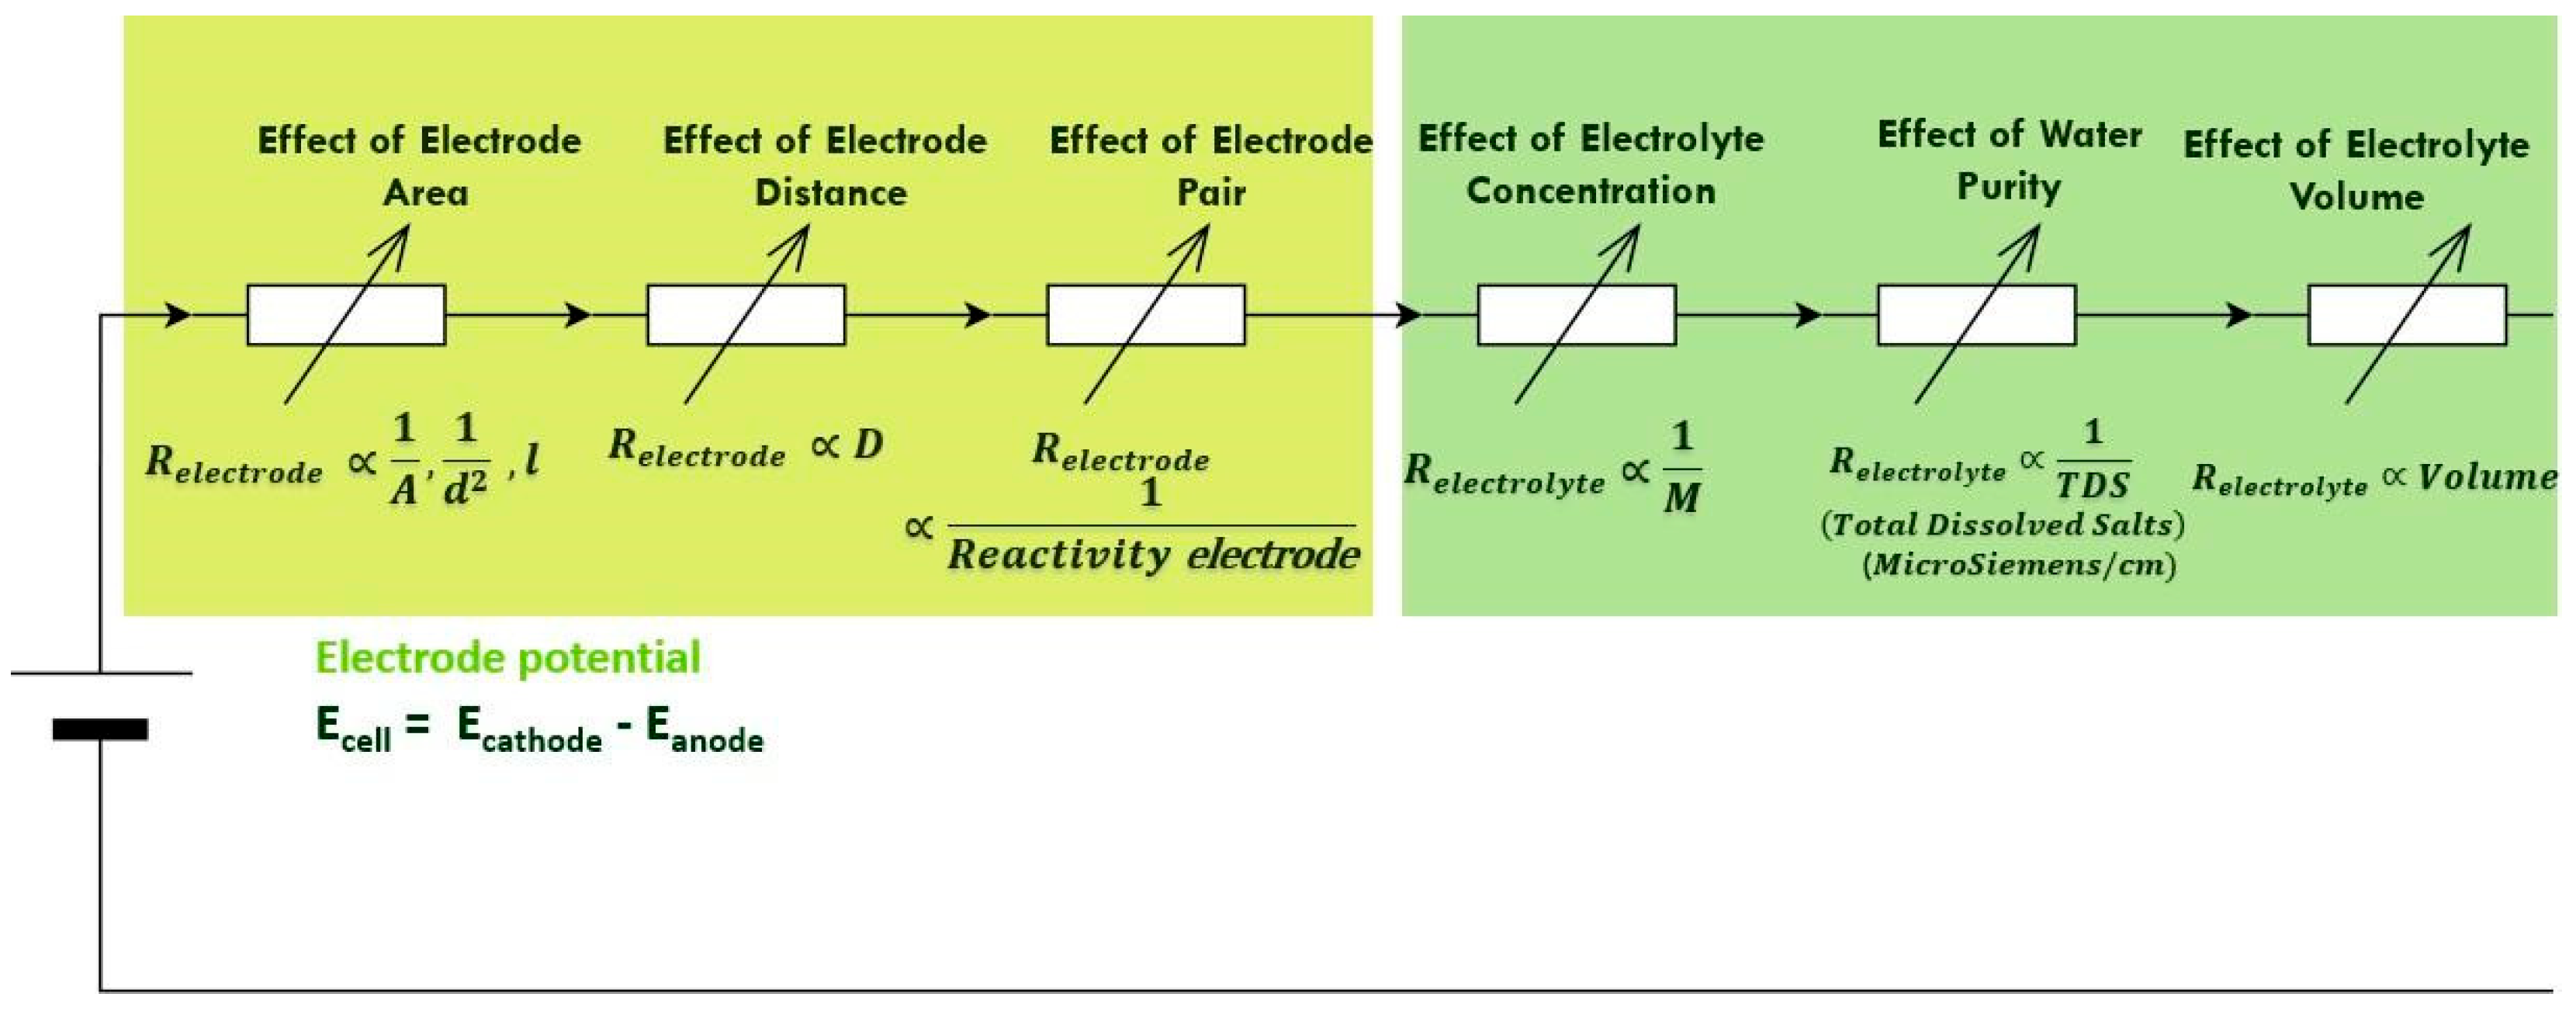
Salt concentration improves current mobility up to a saturation point: in this case, 30%. Beyond this point, any further increase in salt concentration leads to higher internal resistance. An increase in the total dissolved ions in the water generally decreases the electrolyte’s internal resistance, Relectrolyte; however, a very high concentration of dissolved ions reduces the cell’s open-circuit voltage (OCV). Distilled water yields a lower OCV and, therefore, a lower energy density/capacity. Increasing the electrolyte volume raises the cell’s energy capacity but lowers its energy density. Furthermore, energy density is reduced by an increase in electrode area and the distance between electrodes. The energy capacity of the cell is increased by both the electrolyte volume and the salt concentration, but only up to the saturation point. An analogous circuit diagram in Figure 15 summarizes the findings. The total internal resistance is summarised as Rcell = Relectryolyte + Relectrode.
Figure 15.
The diagram summarises the experimental conclusions. The overall cell electrode potential is determined by the electrode pairing, however the cell internal resistance is a variable of (1) electrode area, (2) electrode spacing/distance, (3) electrolyte concentration, (4) water purity, and (5) the volume of the electrolyte.
Experiment Critical Analysis
A critical analysis of the experiment indicates several areas that could have improved the investigation. Measurement of room, and cell temperature may have provided significant information on temperature influence on ion mobility, reaction rates, and overall cell efficiency. The absence of gas collection chambers also limited the ability to monitor and quantify gases produced in the long term cells. In addition, the electrolyte was not changed after each concentration experiment, which may have introduced contamination or residual effects that influenced subsequent results. The salt concentration study also relied on concentration by weight rather than concentration by volume, which may have affected the consistency and accuracy of the electrolyte preparations. Long-term cell testing using the same salt concentration should be investigated, to fairly evaluate the energy capacity and energy density of cells.
5. Future Work
The use of saltwater batteries can be developed further for off-grid power solutions. A compact system built from these results lit three 3 V 0.25 W white LEDS for 72 h. The technology has the potential to provide lighting and charging solutions during power outage periods. This technology can be further developed for adoption in low-energy devices such as underwater Internet of Things routers and communication devices [6,7,8]. Further investigations can be made into powdered zinc–saltwater paste. Recent advances have demonstrated that optimising electrode surface morphology and employing nanostructured materials can significantly enhance charge transfer kinetics and overall battery performance [12]. Contemporary research has also explored hybrid configurations combining saltwater electrolytes with air-breathing cathodes [13], which leverage ambient oxygen to improve energy density and extend operational lifetimes, positioning these systems as viable alternatives for grid-scale stationary storage and remote off-grid applications [14].
6. Conclusions
Through this investigation, it has been established that the main influence on OCV is from the electrode materials themselves. The concentration of salt in the electrolyte, the surface area, and the distance between electrodes does not have a material impact on the cell’s OCV. It has also been shown that the concentration of the electrolyte has a relationship with the SCC, but that there is a maximum point before the SCC tapers off. It has also been shown that the electrode surface area has a small positive impact on the SCC by reducing the cell’s internal resistance. Furthermore, the internal workings of the cells have been explored through cell behaviour tests, and the energy density of the C-Zn cells was found to be 0.03005 µW·g−1.
Author Contributions
Conceptualization, R.M.C., Z.C. and J.B.; methodology, R.M.C. and Z.C.; software, R.M.C. and Z.C.; validation, R.M.C. and Z.C.; formal analysis, R.M.C. and Z.C.; investigation, R.M.C. and Z.C.; resources, R.M.C., Z.C. and J.B.; data curation, R.M.C. and Z.C.; writing—original draft preparation, R.M.C. and Z.C.; writing—review and editing, R.M.C., Z.C. and J.B.; visualization, R.M.C. and Z.C.; supervision, J.B.; project administration, R.M.C. and Z.C. All authors have read and agreed to the published version of the manuscript.
Funding
This research received no external funding.
Institutional Review Board Statement
Not applicable.
Informed Consent Statement
Not applicable.
Data Availability Statement
Test data can be requested by contacting the corresponding author.
Acknowledgments
The authors would like to thank Phillip Mabaso from the Actom Energy laboratory at the University of the Witwatersrand, and Donald Mahole from the School of Chemistry without whom this project would not have been successful.
Conflicts of Interest
The authors declare no conflicts of interest.
Appendix A
Table A1.
Electrode sizes used to test the effect of electrode area on OCV.
The diameter of the graphite rods was measured, and the surface area was found to be 1138 mm2. Accounting for the electrode material thickness, the E1 electrodes were cut so as to have the same surface area as the rods. The non-carbon electrodes were cut into five different sizes, all measuring 15 cm long and with widths ranging from 1 cm to 5 cm in 1-centimetre increments.
The electrode materials were harvested from recyclable materials and laboratory cut-offs. The materials were tested using sulfuric acid and referenced to known material samples to avoid questions regarding the purity/composition of alloys. Iron (Fe), tin (Sn), aluminium (Al), zinc (Zn), copper (Cu), and graphite rods (C) were used in all possible unique combinations, comprising 15 in total, to understand the effect of electrode combinations on cell performance.
References
- Jumare, I.A. Energy storage with salt water battery: A preliminary design and economic assessment. J. Energy Storage 2020, 27, 101130. [Google Scholar] [CrossRef] [Scilit]
- Klein, F.; Jache, B.; Bhide, A.; Adelhelm, P. Conversion reactions for sodium-ion batteries. Phys. Chem. Chem. Phys. 2013, 15, 15876–15887. [Google Scholar] [CrossRef] [Scilit] [PubMed]
- Xu, H.; Zhang, G.; Zhang, J.; Zhang, J.; Wu, H.; Jiang, L.; Jiang, W.; Liu, J.; Peng, K. Comparative analysis of electrochemical properties and thermal behaviors of sodium ion and lithium ion batteries. Int. J. Electrochem. Sci. 2025, 20, 101027. [Google Scholar] [CrossRef] [Scilit]
- Shinohara, M.; Araki, E.; Mochizuki, M.; Kanazawa, T.; Suyehiro, K. Practical application of a sea-water battery in deep-sea basin and its performance. J. Power Sources 2009, 187, 253–260. [Google Scholar]
- Shen, P.K.; Tseung, A.C.C.; Kuo, C. Development of an aluminium/sea water battery for sub-sea applications. J. Power Sources 1994, 47, 119–127. [Google Scholar] [CrossRef] [Scilit]
- Wilcock, W.S.D.; Kauffman, P.C. Development of a seawater battery for deep-water applications. J. Power Sources 1997, 66, 71–75. [Google Scholar] [CrossRef] [Scilit]
- Park, S.; SenthilKumar, B.; Kim, K.; Hwang, S.M.; Kim, Y. Saltwater as the energy source for low-cost, safe rechargeable batteries. J. Mater. Chem. A 2016, 4, 7207–7213. [Google Scholar] [CrossRef] [Scilit]
- Hwang, S.M.; Park, J.; Kim, Y.; Go, W.; Han, J.; Kim, Y.; Kim, Y. Rechargeable Seawater Batteries—From Concept to Applications. Adv. Mater. 2019, 31, 1804936. [Google Scholar] [CrossRef] [Scilit]
- Jarujamrus, P.; Khattiyavong, P.; Supasorn, S.; Kulsing, C. The Development of Small Scale and Low-Cost Galvanic Cells as a Teaching Tool for Electrochemistry. J. Res. Unit Sci. Technol. Environ. Learn. 2014, 5, 146–154. [Google Scholar]
- Álvarez-Carulla, A.; Montes-Cebrián, Y.; Colomer-Farrarons, J.; Miribel-Català, P.L. Self-Powered Point-of-Care Device for Galvanic Cell-Based Sample Concentration Measurement. Sensors 2021, 21, 2665. [Google Scholar] [CrossRef] [Scilit] [PubMed]
- Hasvold, Ø.; Henriksen, H.; Melvær, E.; Citi, G.; Johansen, B.Ø.; Kjønigsen, T.; Galetti, R. Sea-water battery for subsea control systems. J. Power Sources 1997, 65, 253–261. [Google Scholar] [CrossRef] [Scilit]
- Corti, M.; Caruana, R.; Di Caterino, A.; Fustinoni, D.; Gramazio, P.; Vitali, L.; Guilizzoni, M. Morphology and Solidity Optimization of Freeform Surface Turbulators for Heat Exchangers Equipped with Narrow Channels. Energies 2025, 18, 2903. [Google Scholar] [CrossRef] [Scilit]
- Chen, J.; Sun, L.; Wang, K.; Zhang, Y. Research and applications of rechargeable seawater battery. J. Energy Storage 2024, 76, 109659. [Google Scholar] [CrossRef] [Scilit]
- CBN. Seawater Batteries for South Africa Grid Storage. Cape Business News. Available online: https://cbn.co.za/industry-news/renewable-energy-alternative-energy-solutions-news/seawater-batteries-for-south-africa-grid-storage/ (accessed on 21 May 2026).

Disclaimer/Publisher’s Note: The statements, opinions and data contained in all publications are solely those of the individual author(s) and contributor(s) and not of MDPI and/or the editor(s). MDPI and/or the editor(s) disclaim responsibility for any injury to people or property resulting from any ideas, methods, instructions or products referred to in the content. |
© 2026 by the authors. Licensee MDPI, Basel, Switzerland. This article is an open access article distributed under the terms and conditions of the Creative Commons Attribution (CC BY) license.