Proceeding Paper

The Performance Evaluation of a Solar PV-Fuel Cell System Under Dynamic Irradiance and Temperature Conditions †
Department of Power Engineering, Durban University of Technology, Steve Biko Campus, Durban 4001, South Africa
*
Author to whom correspondence should be addressed.
Presented at the 34th Southern African Universities Power Engineering Conference (SAUPEC 2026), Durban, South Africa, 30 June–1 July 2026.
Eng. Proc. 2026, 140(1), 45; https://doi.org/10.3390/engproc2026140045
Published: 1 June 2026

Abstract

Renewable energy sources (RESs) in microgrids are vital for sustainable and resilient power networks, especially in rural South Africa with diverse climatic conditions. Photovoltaic (PV) energy generation is intermittent, making it difficult to offer reliable electricity in varying conditions. The Proton Exchange Membrane Fuel Cell (PEMFC) and solar system are integrated in this study to provide a sustainable energy source that can address these issues. Under varying temperature and irradiance conditions, the PV system was evaluated with and without an LCL filter and PEMFC unit using PVGIS Northern Cape daily solar irradiation data. Results show that solar input variability causes large voltage fluctuations in the standalone PV system. This study adds to the expanding knowledge on RES resilience by utilising real-world climatic data and shows that PV-FC systems can be a sustainable and reliable option for microgrid and standalone applications in rural locations with ample resources or without electrical infrastructure.

1. Introduction

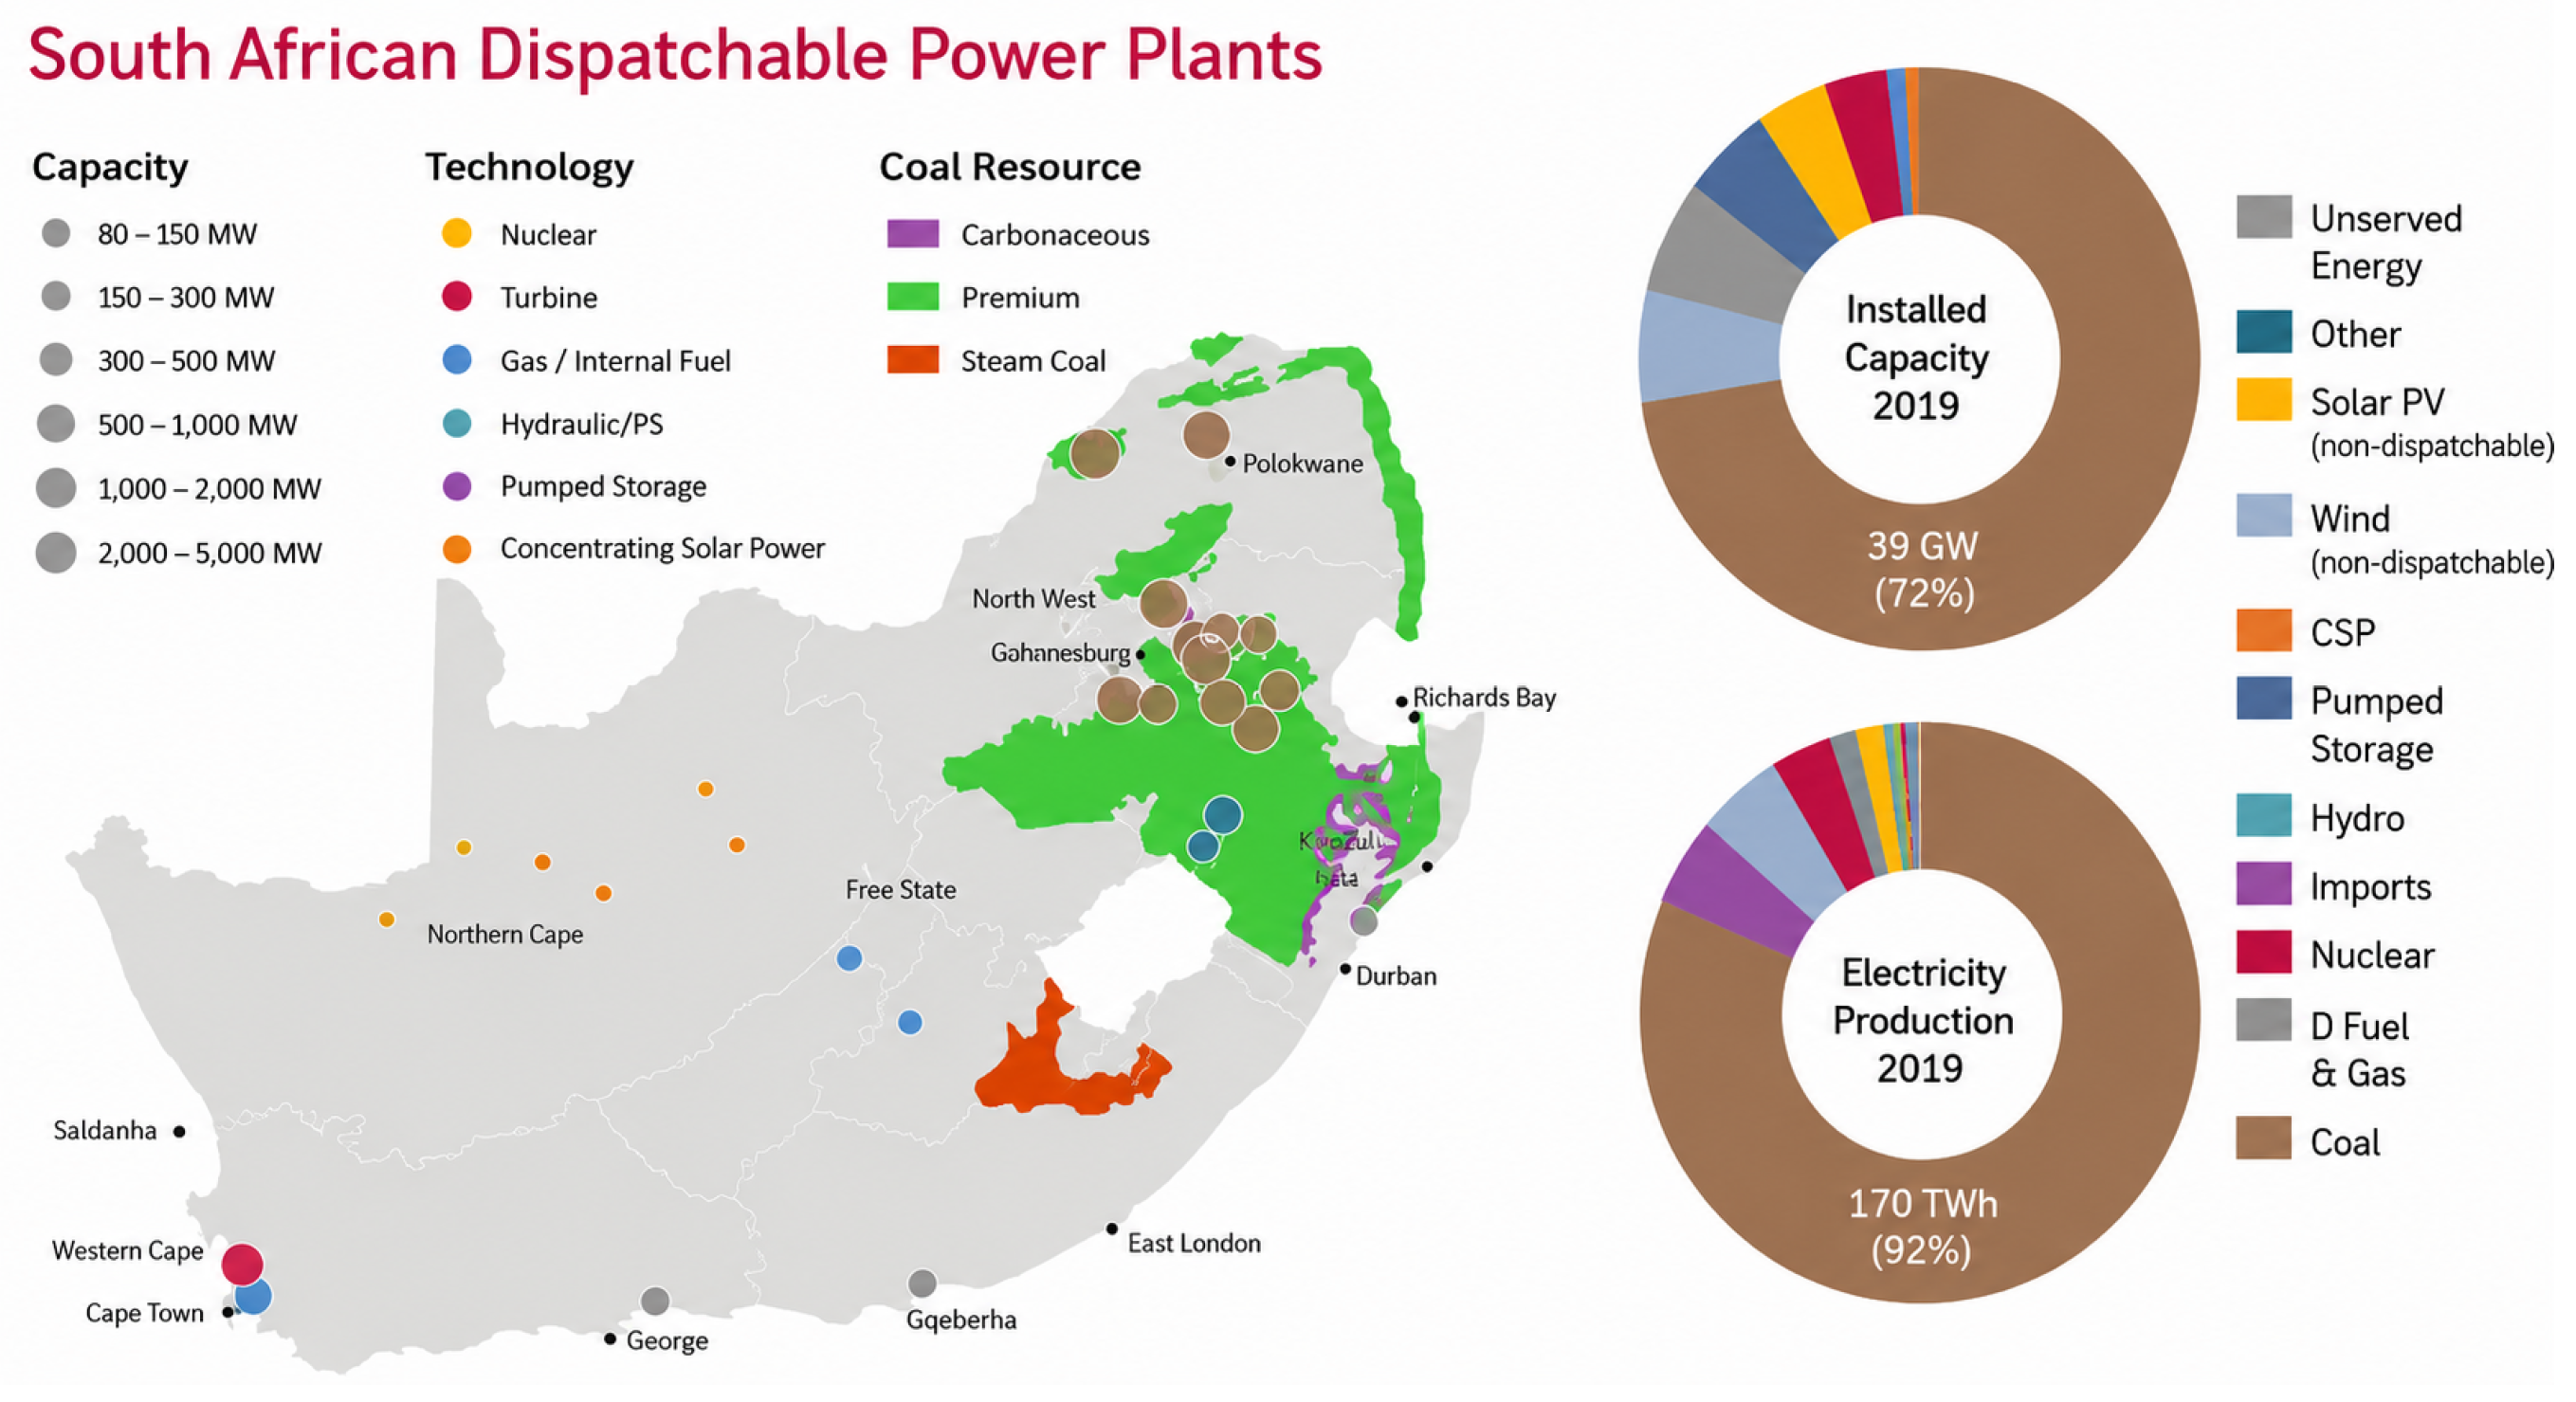
South Africa is dealing with substantial energy issues stemming from its reliance on coal-based power generation, which significantly impacts carbon emissions, pollution, and climate change, as demonstrated in Figure 1. The current energy mix is heavily dominated by coal, which constitutes 91.5%. In response, the government has established objectives to decrease this proportion to 59% by the year 2030 and to reach net-zero emissions by 2050 [1]. The increasing energy demand, especially in underserved rural areas, has prompted a significant transition towards renewable energy sources [2,3]. Solar photovoltaic (PV) systems stand out due to their scalability, cost-effectiveness, and positive impact on the environment. Nonetheless, the output from photovoltaic systems is fundamentally variable and significantly affected by changes in solar irradiance and surrounding temperature conditions. This variability presents a significant obstacle to ensuring a consistent power supply in standalone and microgrid applications.
Proton exchange membrane fuel cells (PEMFCs) present a complementary solution by effectively storing excess solar energy and providing power during periods of low irradiance or peak demand. The combination of PV systems with fuel cells can improve system reliability, energy independence, and environmental sustainability, especially in remote or off-grid situations [5]. Although they hold significant potential, PV-fuel cell hybrid systems have not seen widespread adoption in South Africa, and there is a scarcity of studies examining their dynamic performance in actual weather scenarios. Many investigations operate under the assumption of standard test conditions, failing to account for the operational challenges introduced by daily and seasonal fluctuations in solar irradiance and temperature.
This study aims to evaluate the dynamic performance of a standalone PV-fuel cell system under varying irradiance and temperature conditions, aiming to evaluate its feasibility for rural electrification through MATLAB/Simulink R2024b analysis. Data on empirical solar irradiance from designated regions in the Northern Cape, obtained from the Photovoltaic Geographical Information System (PVGIS), are employed to assess the dynamic performance of the system.

2. Overview of PV Systems and Fuel Cells

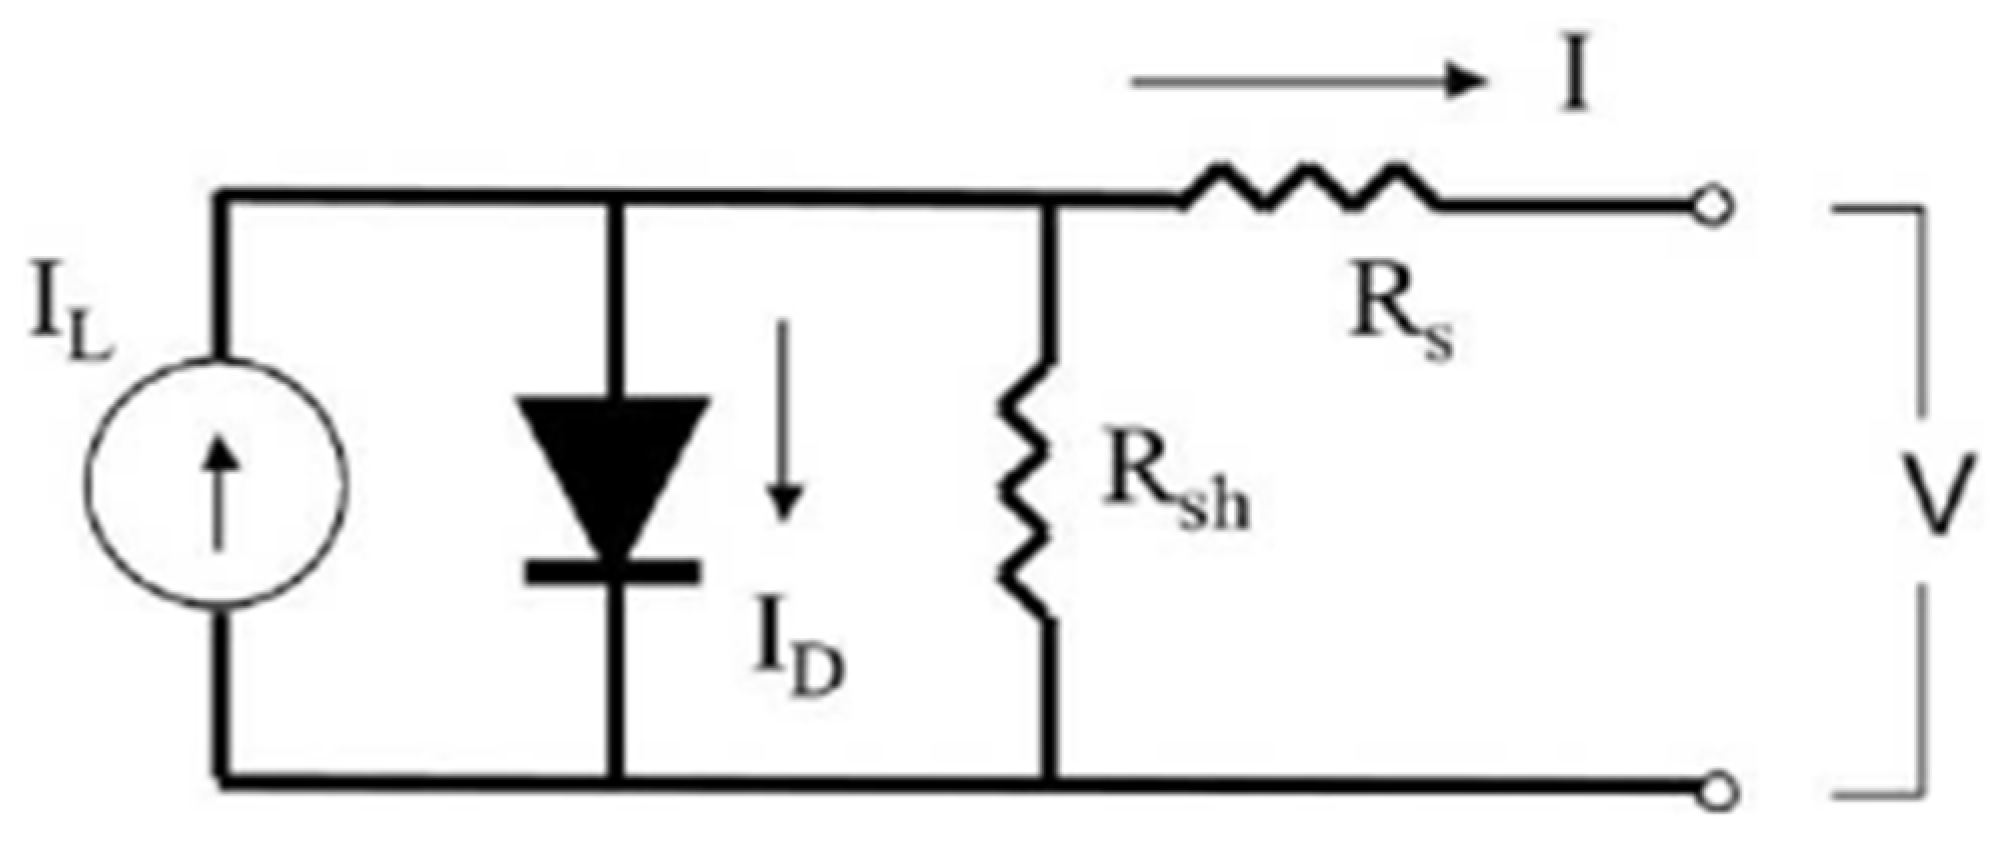
Solar energy denotes the portion of the sun’s heat radiation and light that may be captured at the Earth’s surface for diverse energy-generating purposes, particularly for the transformation of solar energy into usable energy forms. Solar cells are included within solar modules, formally known as PV modules. These PV solar modules, consisting of several cells containing photovoltaic material, are employed to generate power via the photovoltaic method [6,7]. Connecting electrical conductors to the positive and negative terminals of a circuit enables the harnessing of electrons to generate an electric current. The requisite power output can be attained by configuring several solar cells in series to elevate the voltage and in parallel to augment the current [8]. The equivalent circuit of a PV cell is shown in Figure 2. PV panels generate DC electrical energy contingent upon irradiance, temperature, and module specifications.
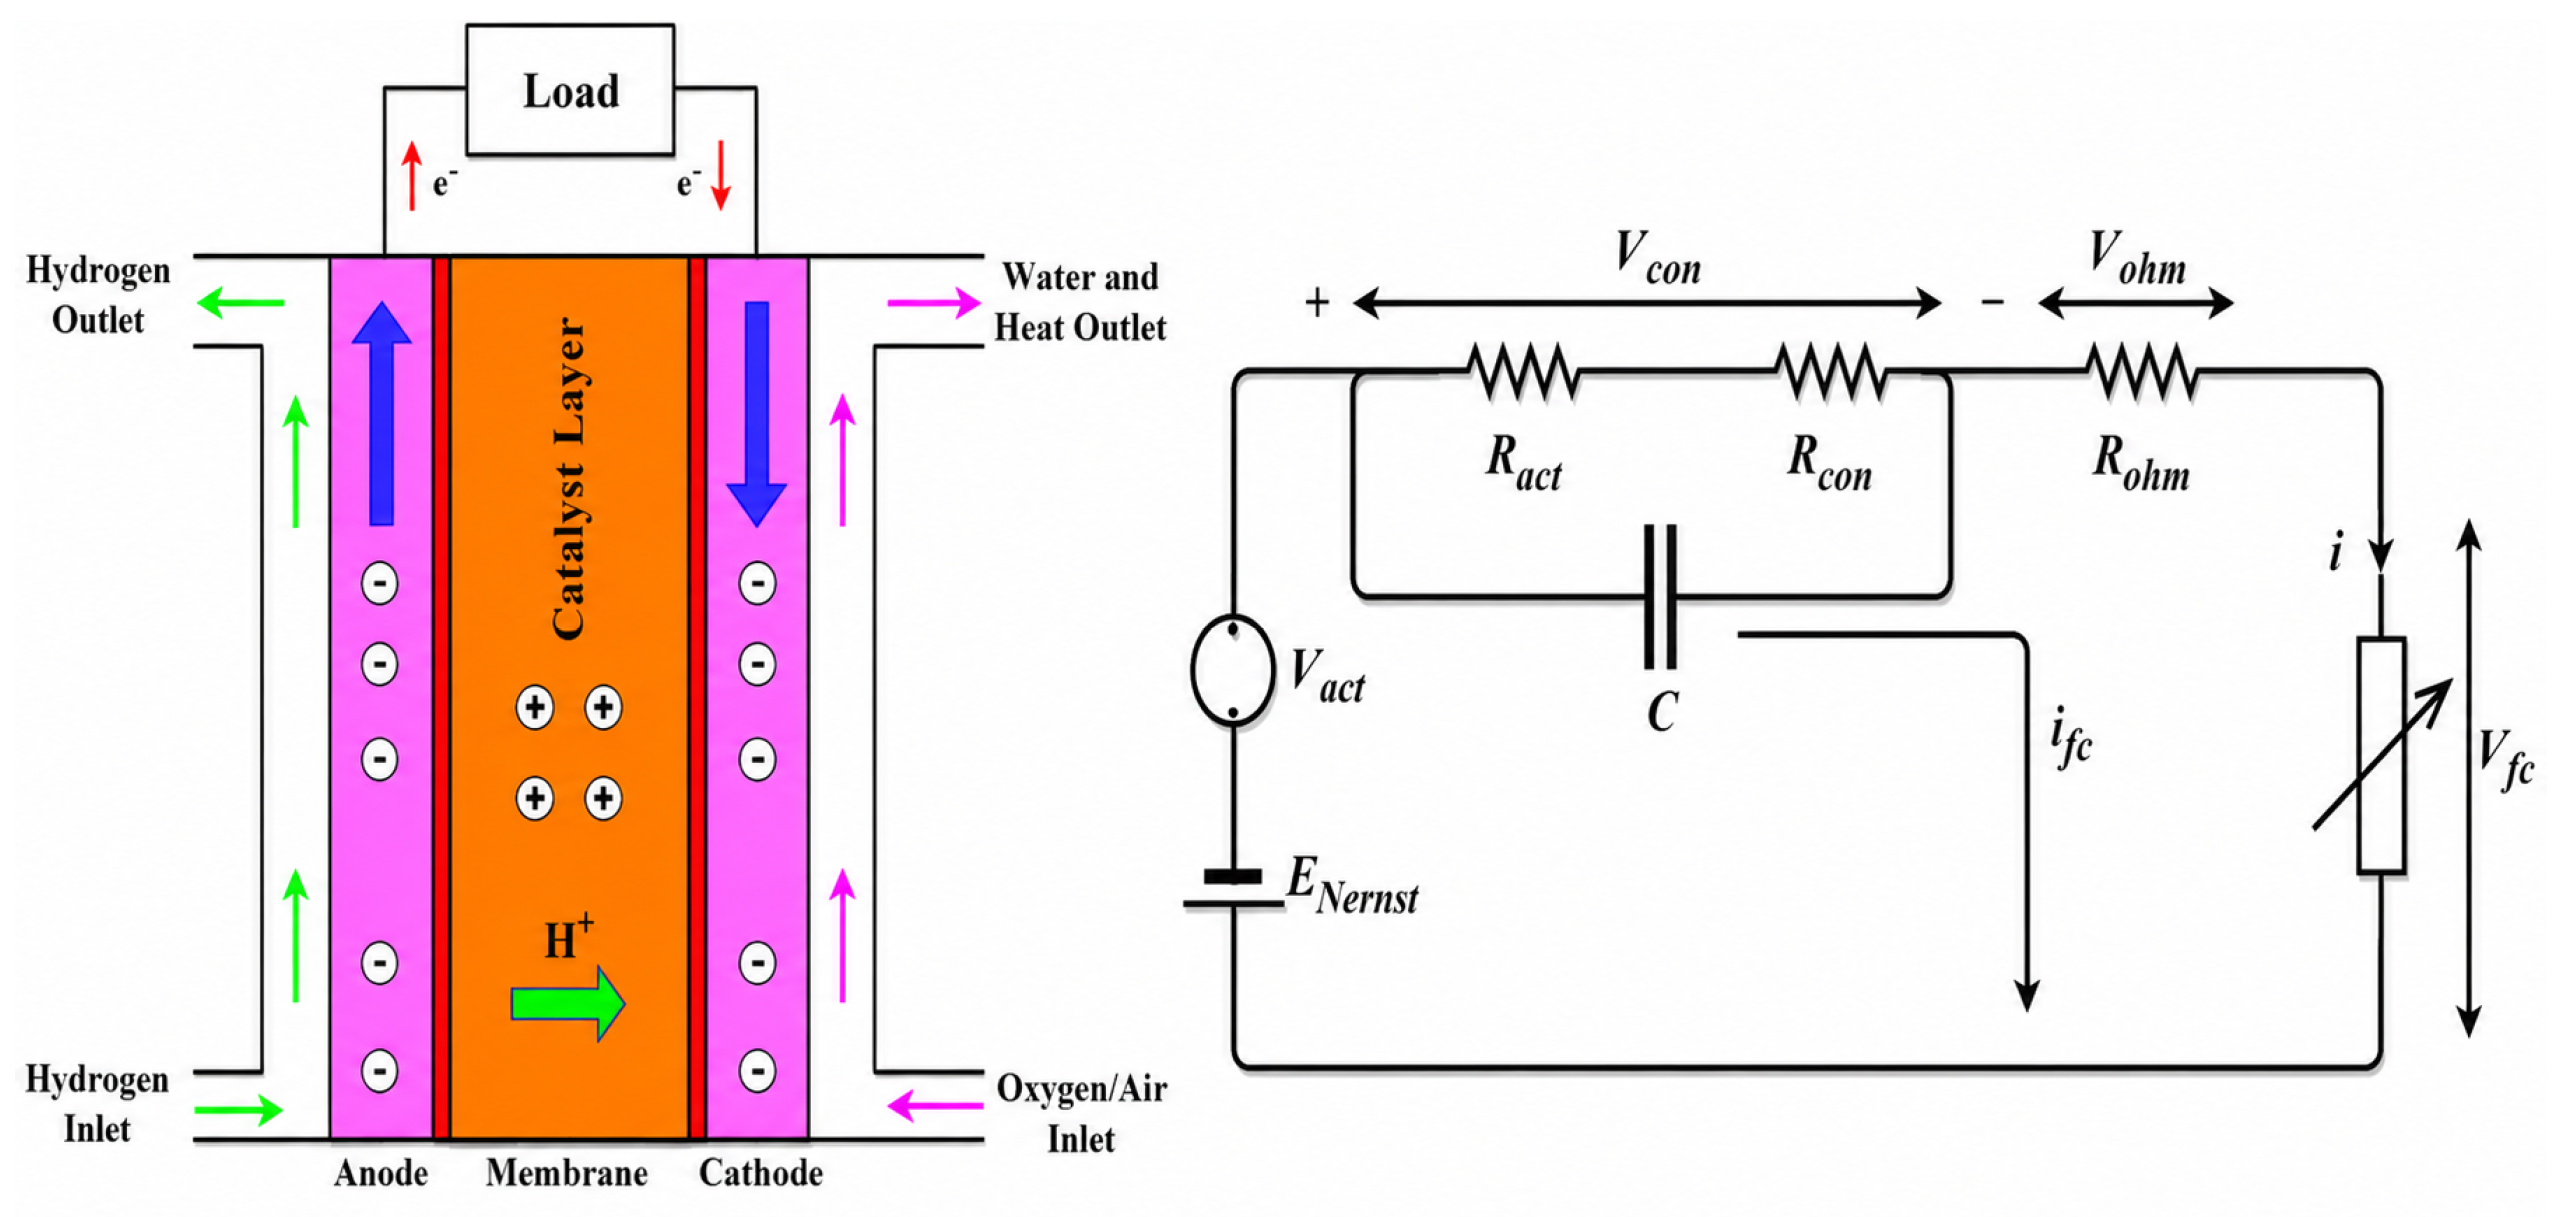
A variety of fuel cells (FCs) can be found in the current market. However, they are typically classified based on the type of electrolyte material or fuel they use. Their power outputs, operating temperatures, electrical efficiencies, catalysts used, and typical applications vary significantly [5]. The FC equivalent circuit is presented in Figure 3. The proton exchange membrane fuel cell (PEMFC) stands out as the optimal selection for fuel cells serving as a power source due to several compelling reasons:
  • Reduced operational temperature, allowing for quick activation and deactivation;
  • Decreased operational pressure, resulting in enhanced safety;
  • Straightforward configuration into mode systems;
  • Diminished emission ratio coupled with an improved conversion ratio [9,10].
Figure 3. PEMFC schematic and electrical circuit model [9].
Engproc 140 00045 g003

3. The Impedance Source Inverter and Pulse Width Modulation Overview

The Z-source inverter (ZSI) utilises a unique impedance network to link the converter’s main circuit to the power supply, load, or another converter, offering specific benefits absent in traditional voltage-source (V-source) and current-source (I-source) converters, which rely on capacitors and inductors, respectively. The ZSI addresses the technical and scientific constraints of conventional V-source and I-source converters with the application of a new power conversion technology [11].
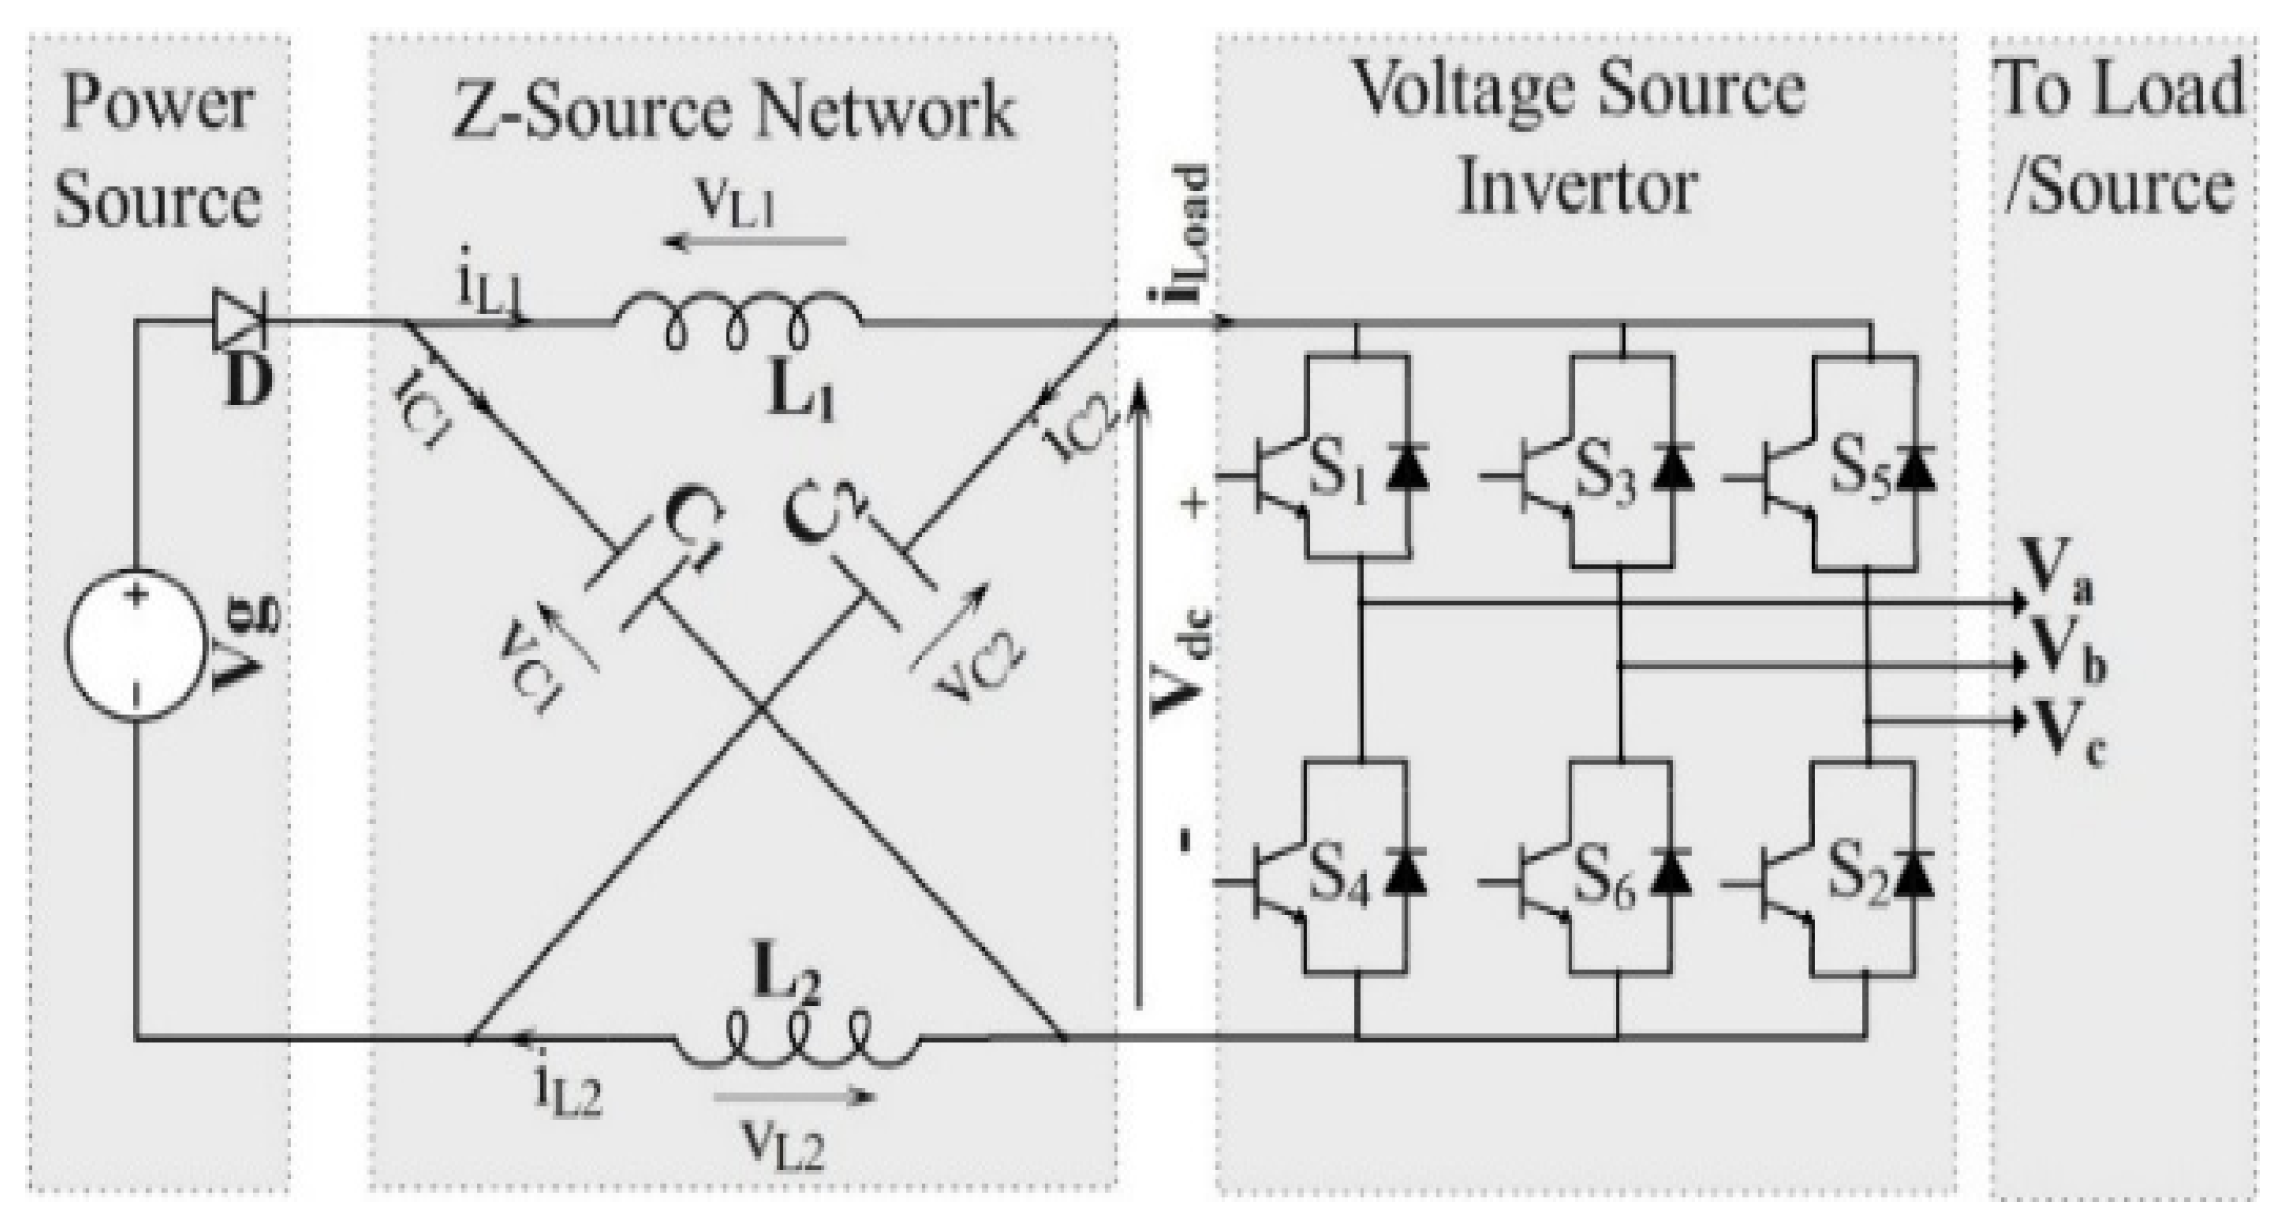
The ZSI operates as a buck-boost inverter, capable of functioning at various voltage levels. In contrast to Voltage Source Inverters (VSIs) and Current Source Inverters (CSIs), which are restricted to eight allowed switching modes, Z-Source Inverters (ZSIs) provide nine allowable switching modes, including the shoot-through (ST) state that facilitates voltage enhancement. The standard VSI forbids this ST zero state (or vector) because of the potential of a ST condition [11,12]. Figure 4 depicts the equivalent ZSI circuit.
The ZSI is connected to a load, another converter, or a DC supply by an X-arrangement of split-inductor L1 and L2 and capacitors C1 and C2. In most cases, the power switching components of switching devices such as IGBTs or MOSFETs are utilised in the ZSI. MOSFETs are employed in the ZSI, and they promise to use simpler and more efficient drive circuits, with substantial savings in costs over bipolar devices [12].
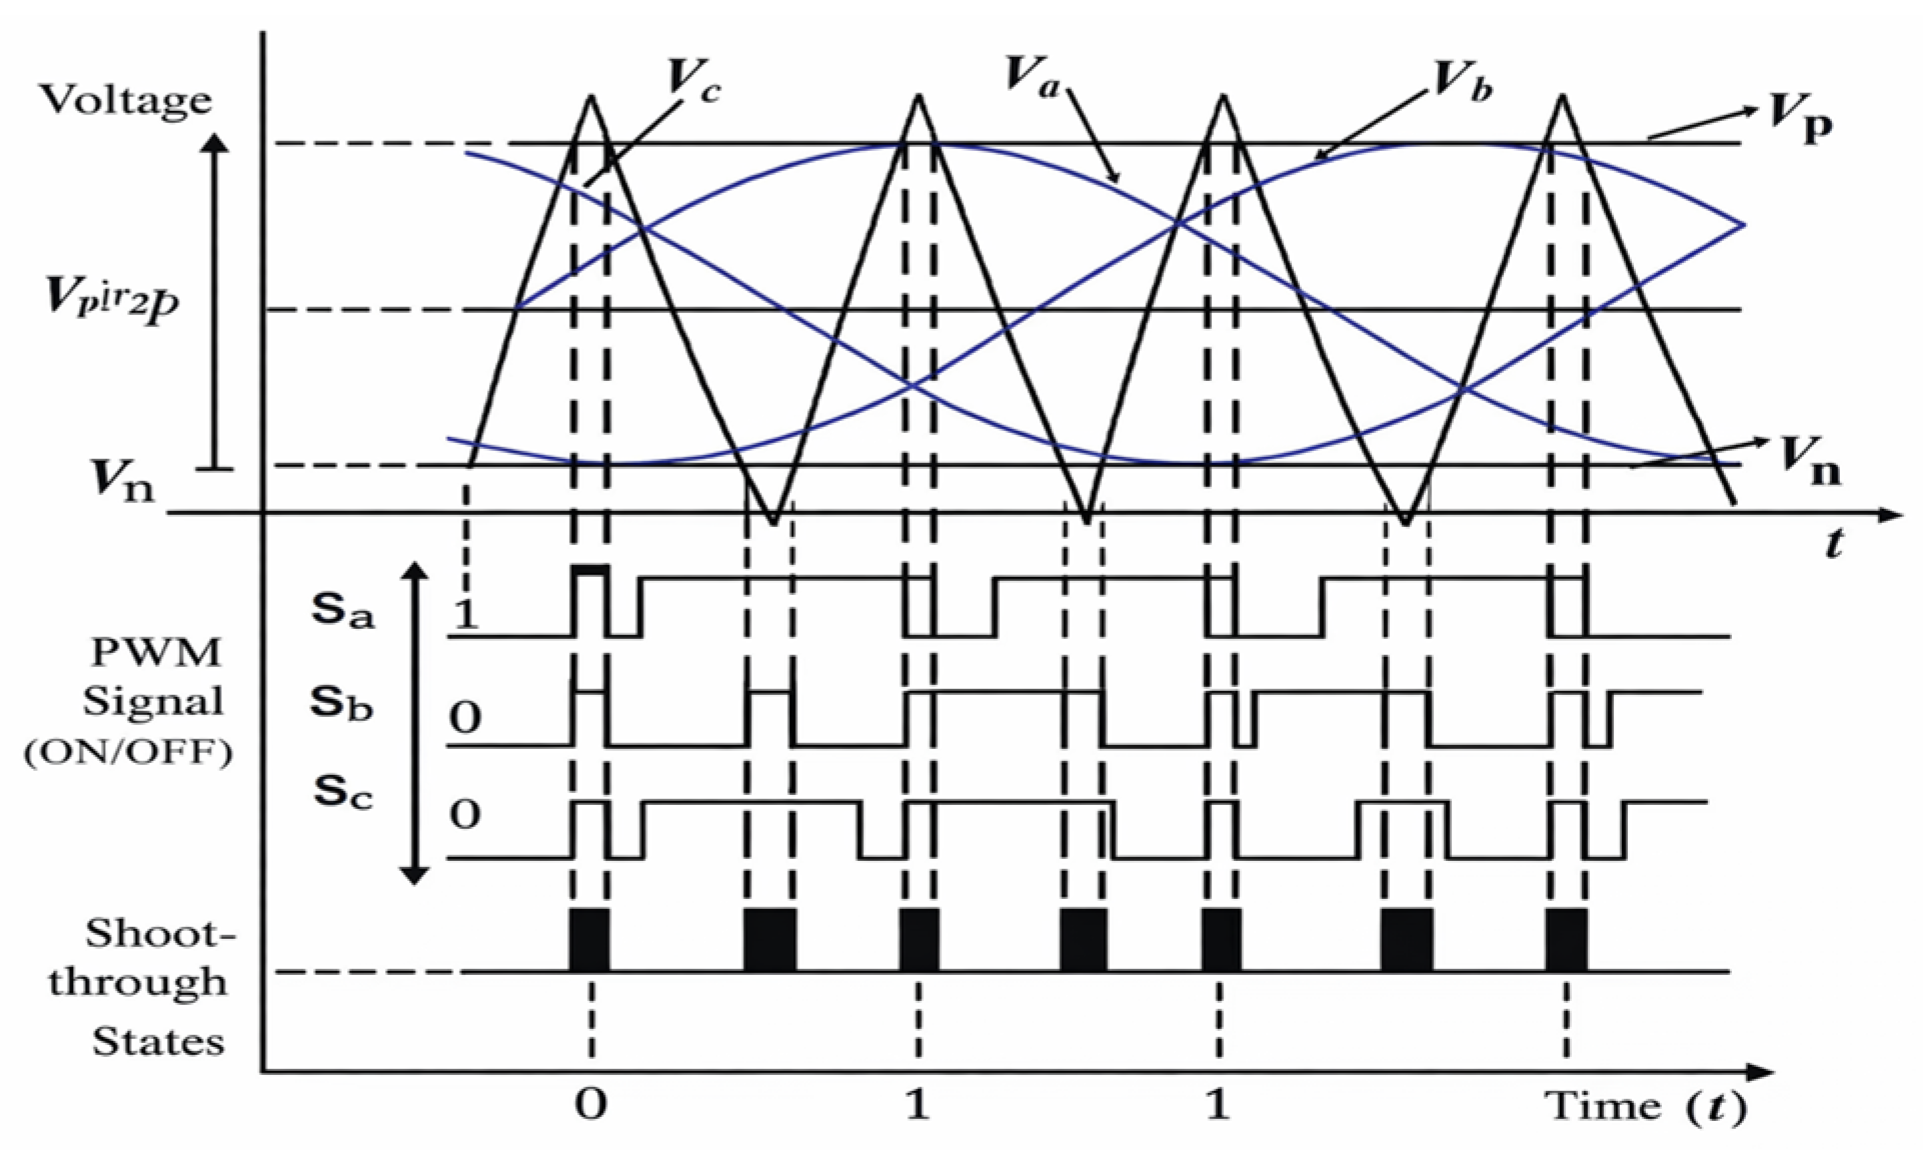
The simple boost control (SBC) method is regarded as the fundamental approach for ZSI topology that is employed for switching the MOSFETs or IGBTs of the universal bridge, such that the endpoints of a ZSI that generate the desired AC output waveform. It entails comparing three-phase reference signals (Va, Vb, and Vc) with a carrier signal for non-shoot through operation of the inverter, along with two straight shoot through (ST) lines (Vp and Vn) compared to the carrier for ST operation of the inverter, as illustrated in Figure 5. The dashed vertical lines in Figure 5 represent switching borders during each modulation cycle, whereas the black shaded intervals indicate ST states purposefully produced during PWM operation to enhance DC-link voltage. The ST state happens when any of the seven ST states discharge the Z-source impedance terminals. The Z-source network is cut off by connecting both switches in any leg of the bridge simultaneously [12]. The non-ST state occurs when the ZSI is in one of the active or zero states (such as a typical VSI) for an extended period. When the diode is forward-bias, the capacitors begin to charge, and the power stored in the inductors gets distributed to the load [12]. When the Z-source network is in its shoot through state, the diode opens and the bridge is equivalent to a short-circuit, while in the non-ST state, all eight switches are active [14].

4. The LCL Filter Overview

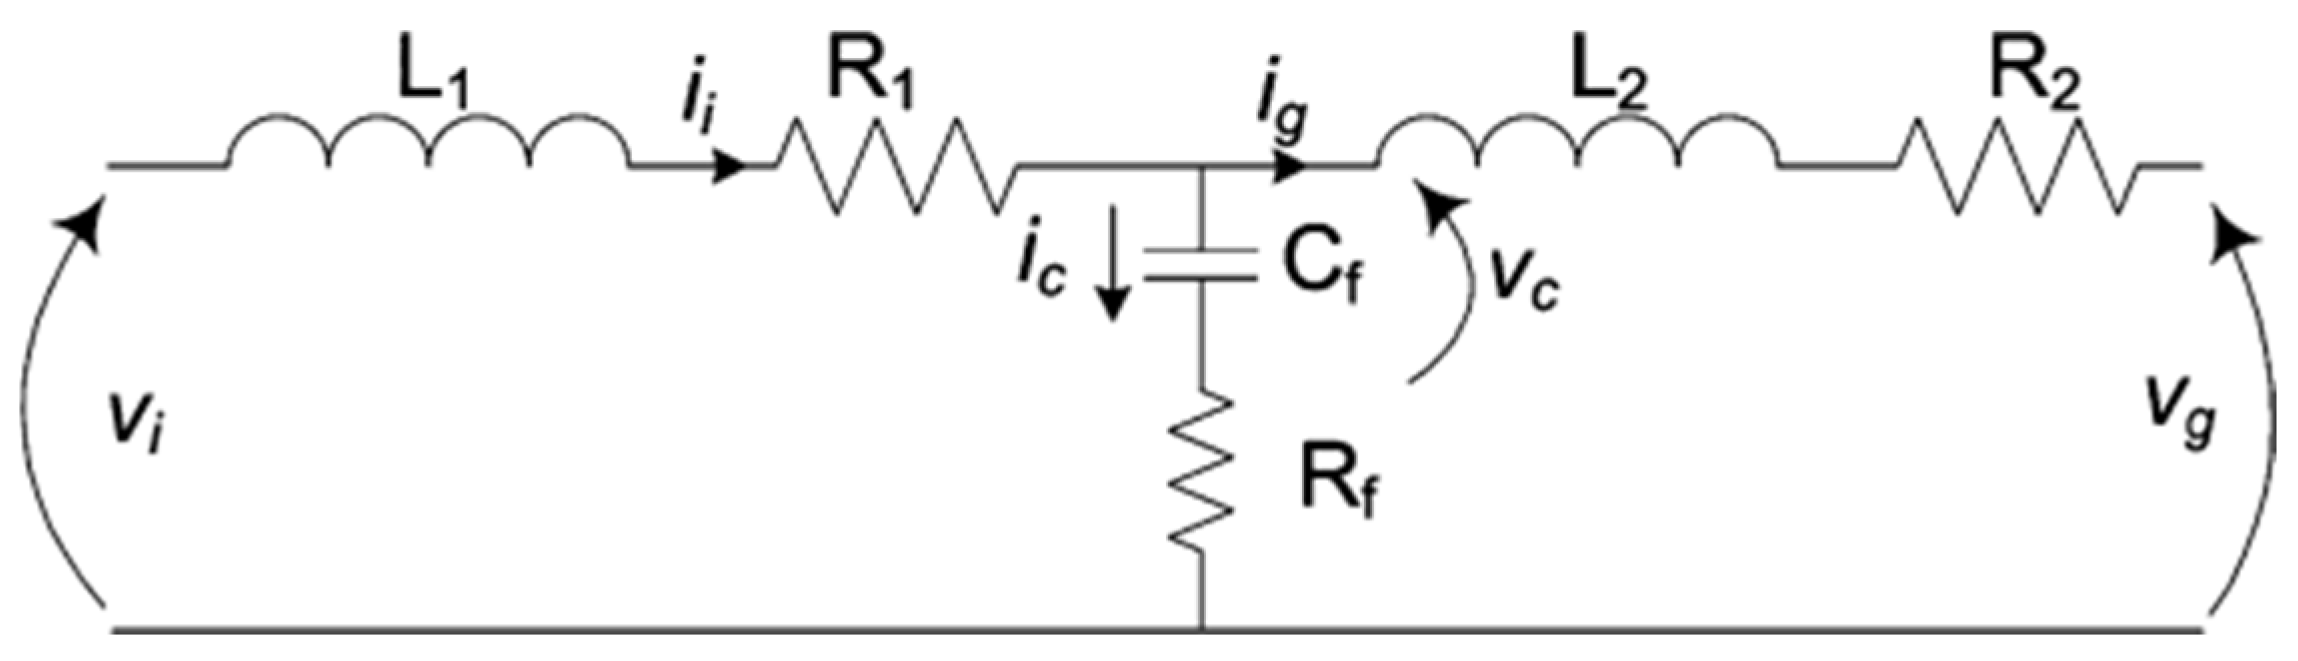
The installation of a suitable high-inductance filter efficiently mitigates harmonics in DC-AC converters [15]. The substantial size of the inductor makes inductive filters too costly for practical applications beyond several kilowatts, despite their simple design, and they demonstrate insufficient dynamic responsiveness [15]. The ZSI application necessitates a low-pass filter to transmit low-frequency components while attenuating high-frequency harmonics [12]. Figure 6 illustrates the schematic representation of a typical LCL filter. The LCL filter exhibits a positive response to current ripple, even with the use of low inductance. LCL offers enhanced decoupling of the circuit from the grid, surpassing the performance of the other two filters in terms of loss characteristics. The attenuation of the LCL filter is roughly -60 dB per decade [12,15,16].

5. The 55 kW PV System Modelling and Design

5.1. Environmental Input Parameters

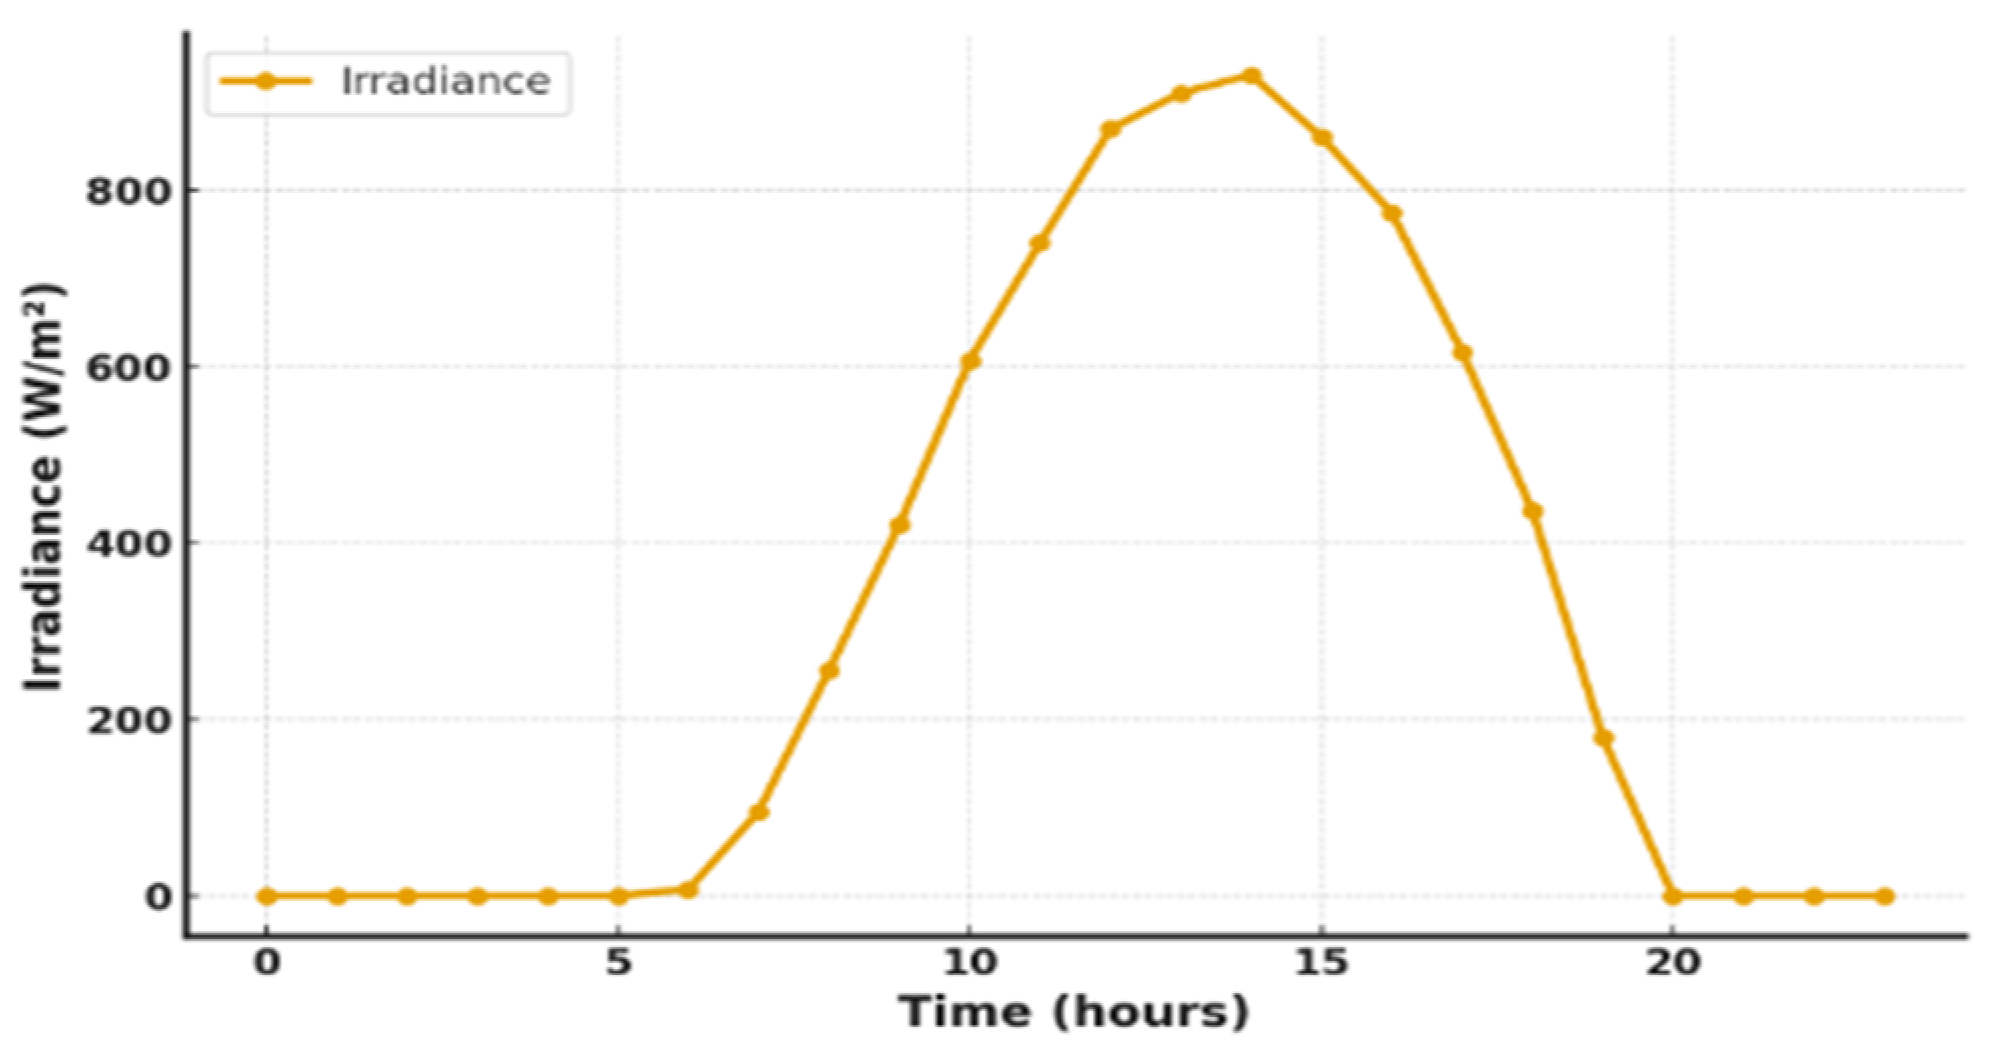
This study employed actual daily irradiance data for January sourced from the PVGIS database to simulate realistic operating conditions, concentrating on the Northern Cape province, recognised for its significant solar potential and extreme temperature fluctuations as shown in Figure 7. The selected values aim to assess the dynamic performance of the hybrid system amidst actual variations in solar availability and thermal operating conditions.

5.2. PV Array Design Parameters

The PV array was constructed utilising Canadian Solar CS6U-345M polycrystalline modules. A configuration of nine modules in series, along with 18 parallel strings, was established to produce a maximum output of 55 kW. The specifications of the panel are summarised in Table 1; the array voltage is 342.9 V, while the DC link voltage is set at 514.35 V.

5.3. ZSI and LCL Filter Design Parameters

This PV system converts DC to AC in one step using a ZSI. The inverter converts DC to AC efficiently using multilayer PWM and MOSFETs to generate low harmonic distortion output. The selected SBC controls the MOSFET shoot-through condition and ZSI output voltage, which are crucial for inverter performance. An LCL filter improves ZSI output voltage waveforms and reduces system harmonics. Table 2 shows ZSI and LCL filter design parameters.

6. The System Results

6.1. Voltage Waveforms Before Filtering

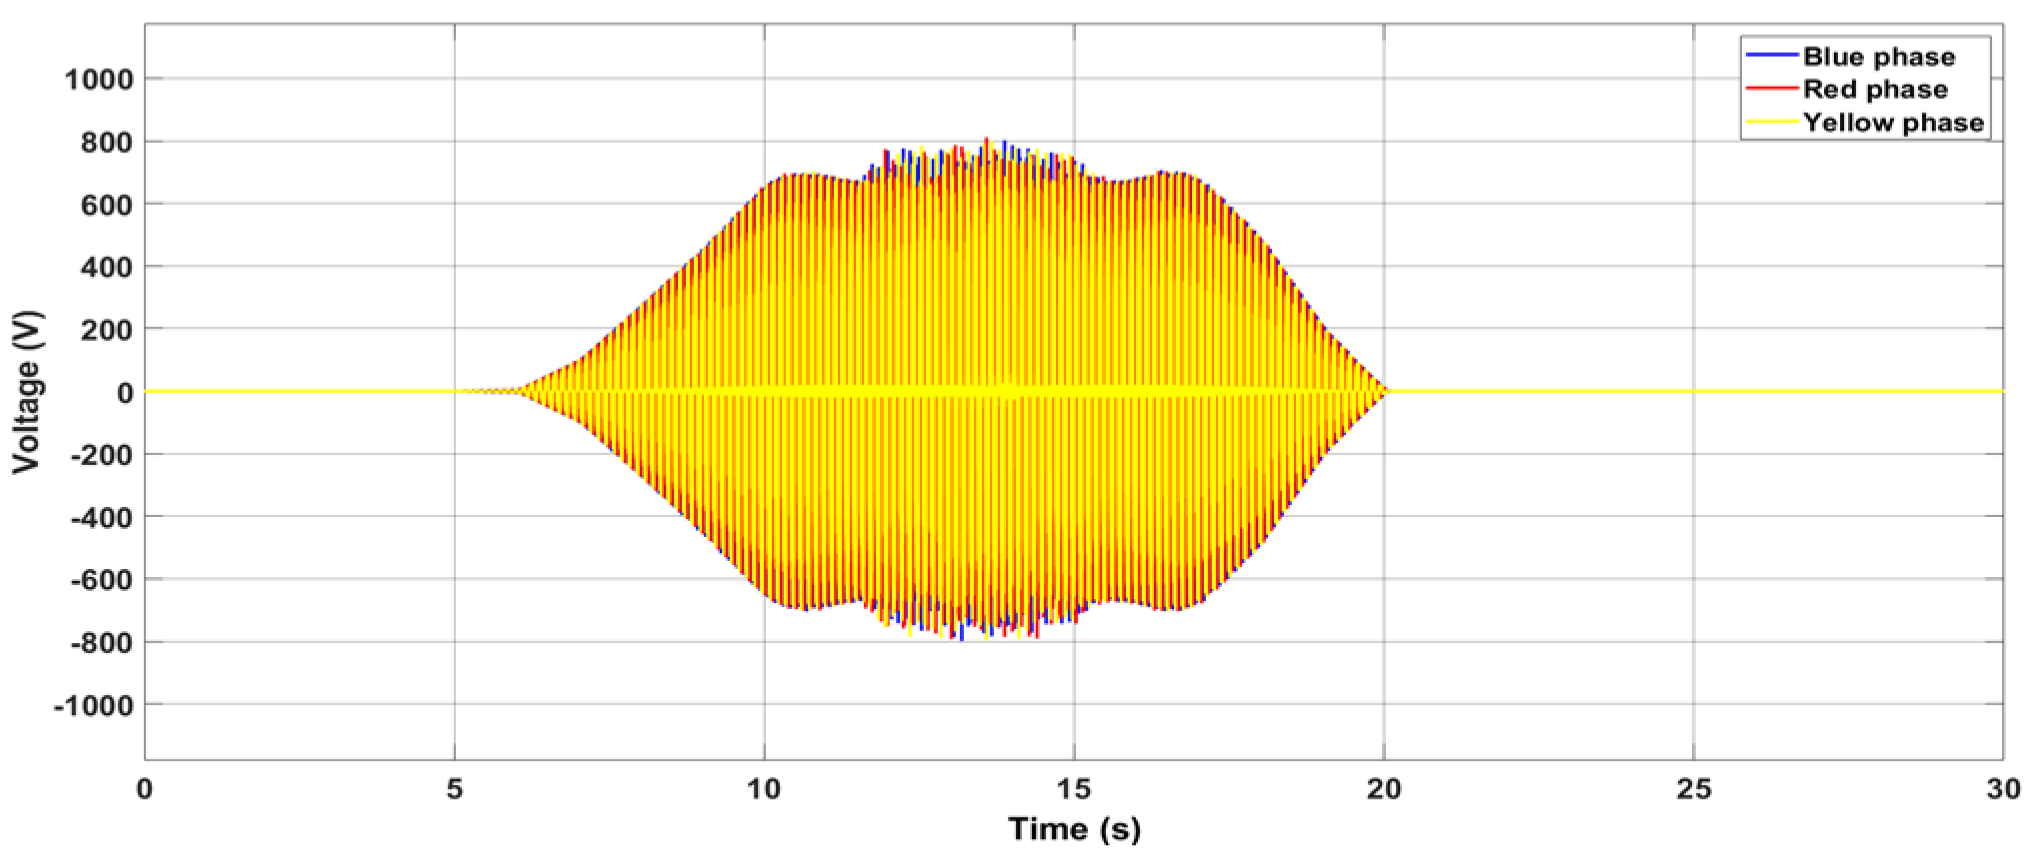
Early-stage irradiance supplies minimal energy, keeping system voltage around zero for 0–5 s (early morning). Voltage increases at 5–10 s (morning), peaking 10–15 s (midday) into the observation time. The PV array’s irradiance or power output increased during the simulation. High-frequency oscillations and voltage ripples occur during voltage increase and decrease. Poor filtering and dampening cause oscillations in Figure 8.
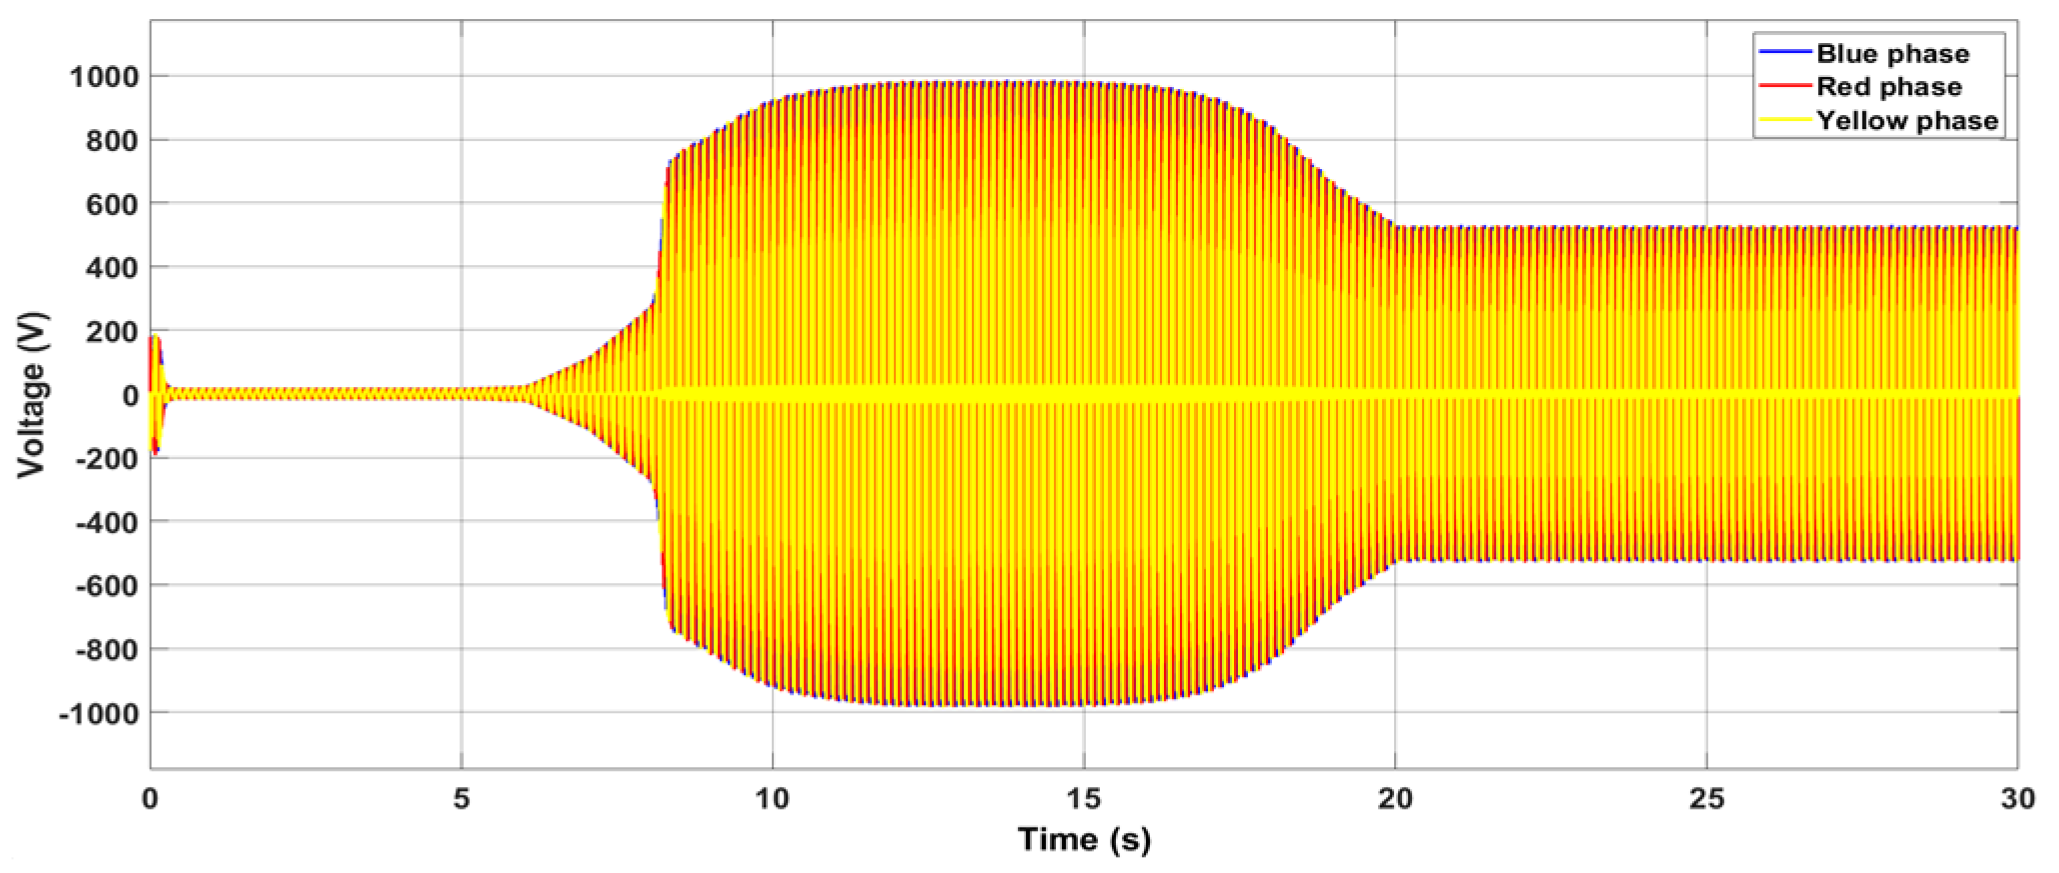
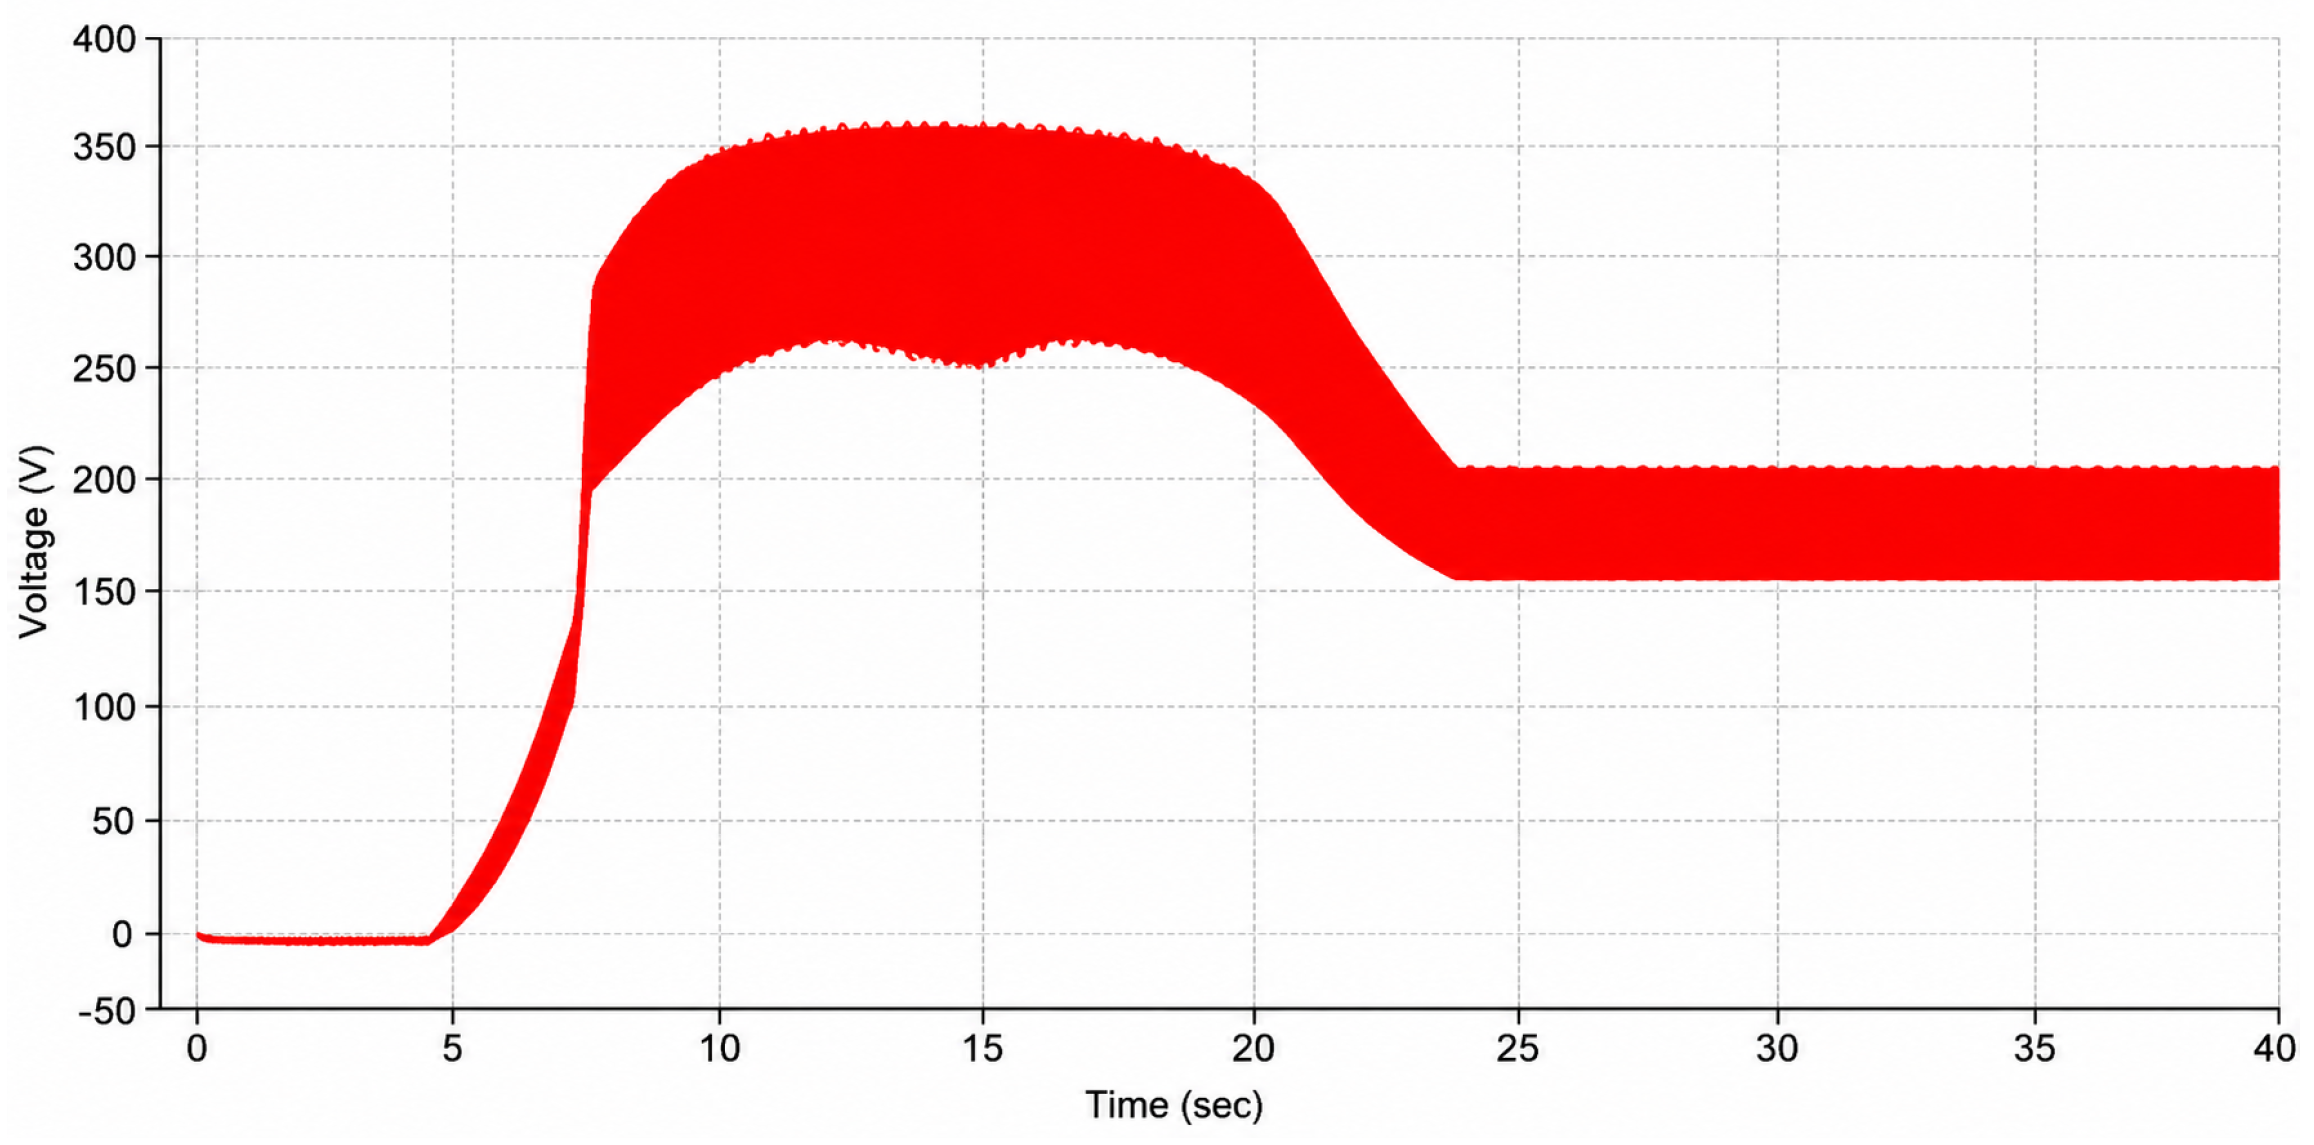
The PEMFC was added to the system. Figure 9 shows that the PEMFC alone powers the microgrid even after 20 s (afternoon) of lower PV array irradiation than Figure 8. Comparing 800 V to the converter’s DC link’s 514.35 V reveals an increase.

6.2. Voltage Waveforms After Filtering

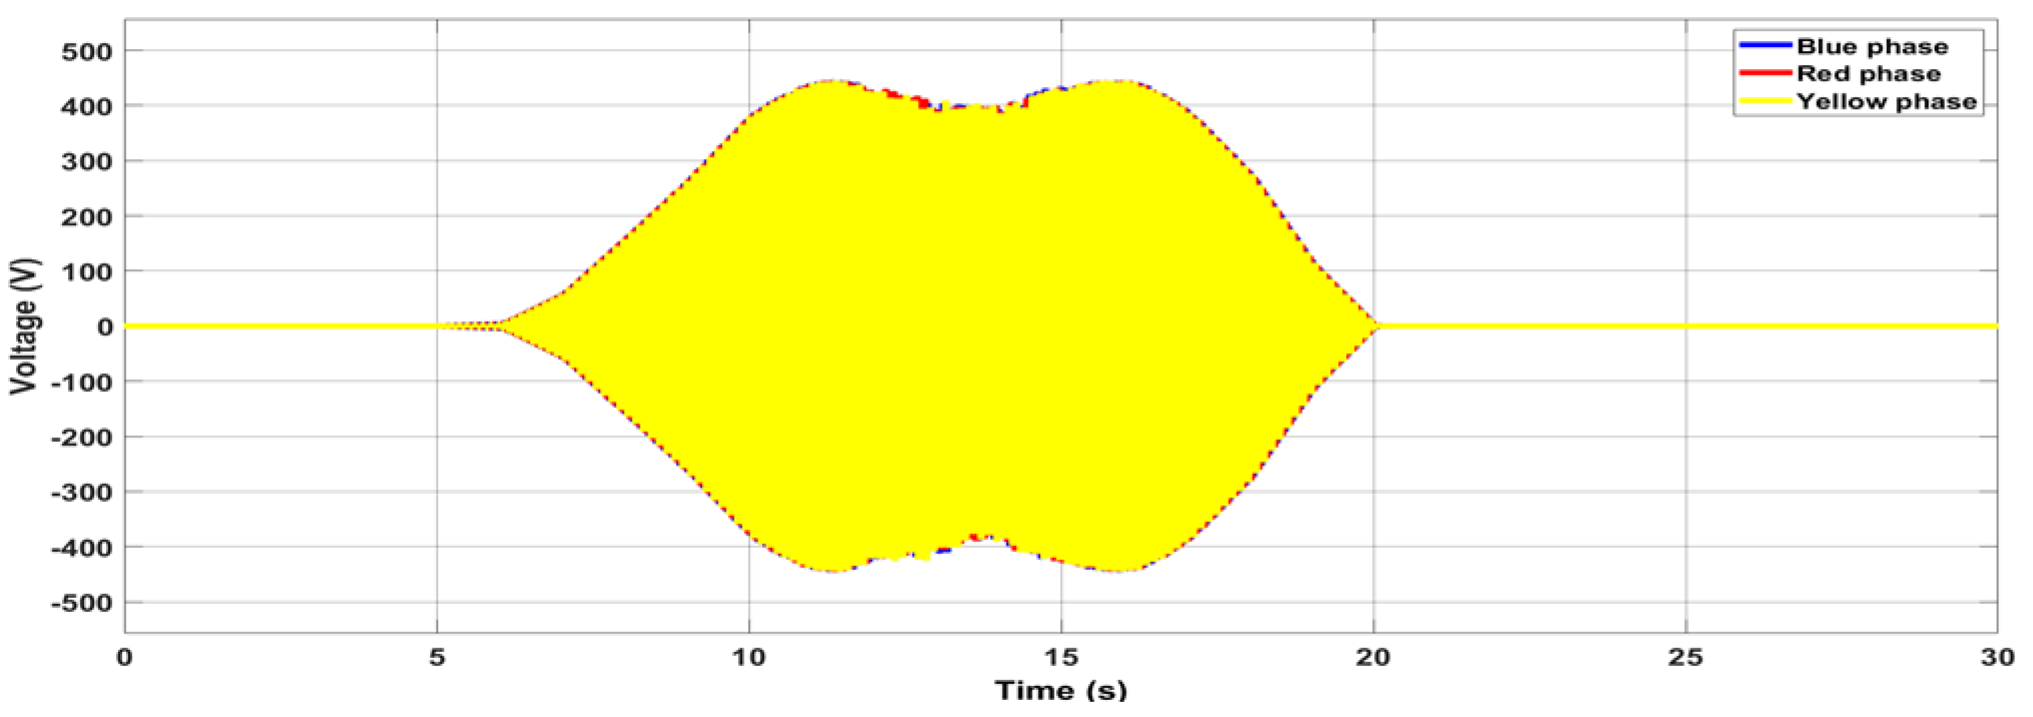
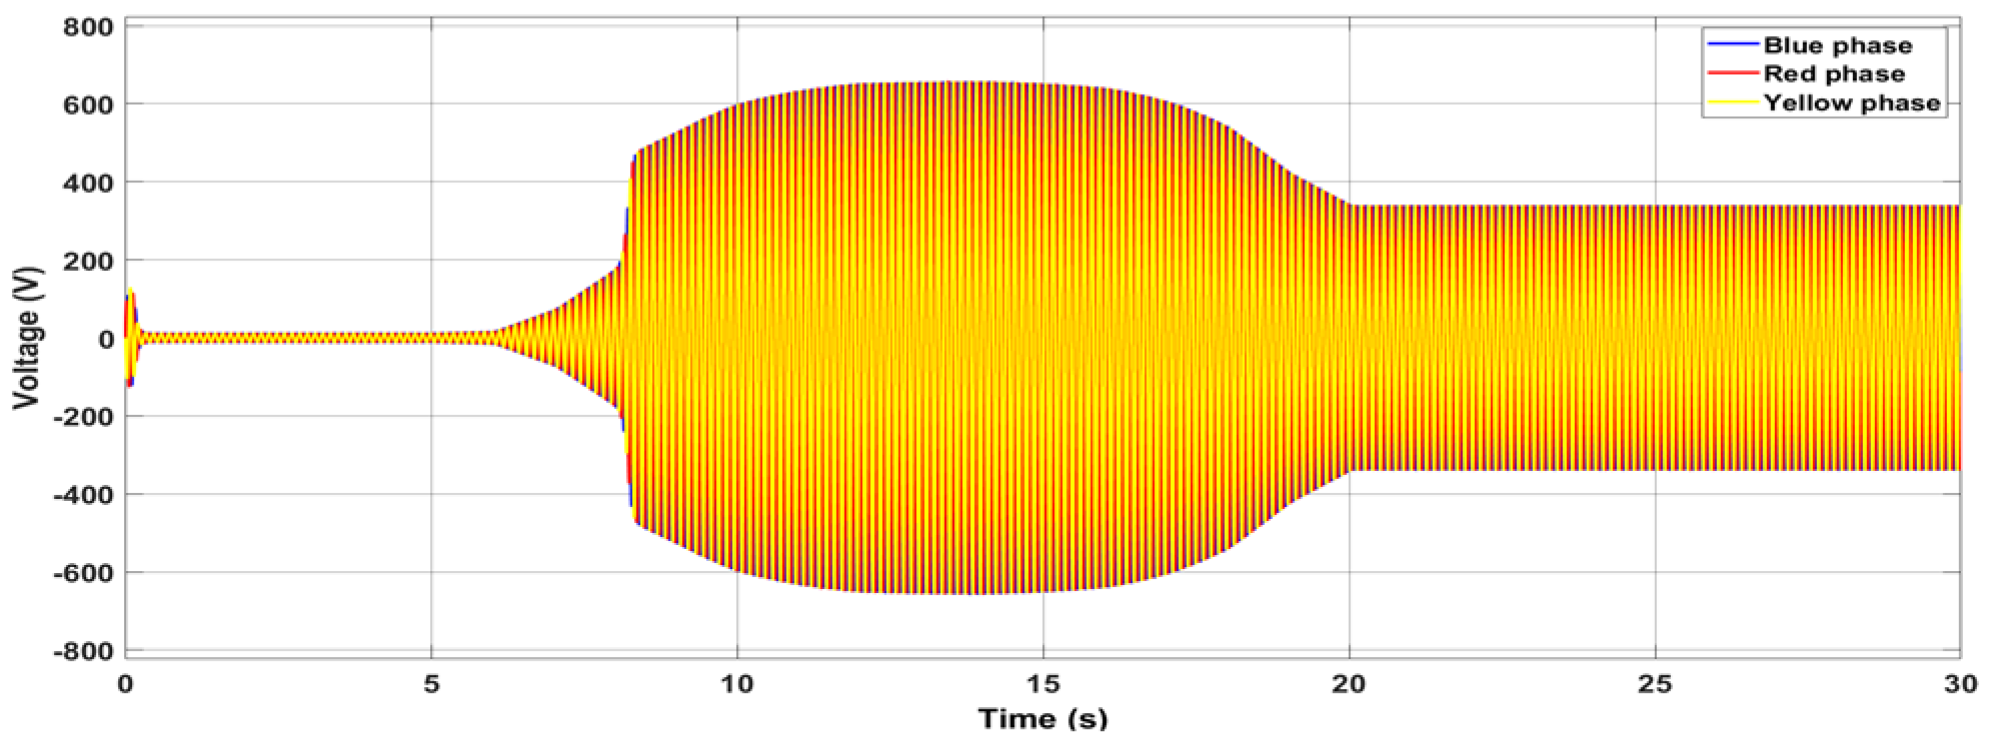
The performance voltage profile in Figure 10 now has a smoother sinusoidal waveform with reduced ripple, notably at peak irradiance between 10 and 15 s (midday). The LCL filter reduces inverter switching harmonics, enhancing voltage. The voltage profile shape is improved, although magnitude shifts occur between the beginning (10–15 s) and end (20 s) transitions. These oscillations are caused by insufficient energy backup and variable irradiance.
Figure 11 shows that PEMFC delivers energy and stability above PV under a 30 s (mimicking a day) simulation that stabilises the waveform. Despite irradiance changes, the voltage waveform stabilises after 10 s. PEMFCs provide smooth transitions and reduce voltage fluctuation during irradiance drop-off while delivering energy.

6.3. PV-PEMFC System Performance

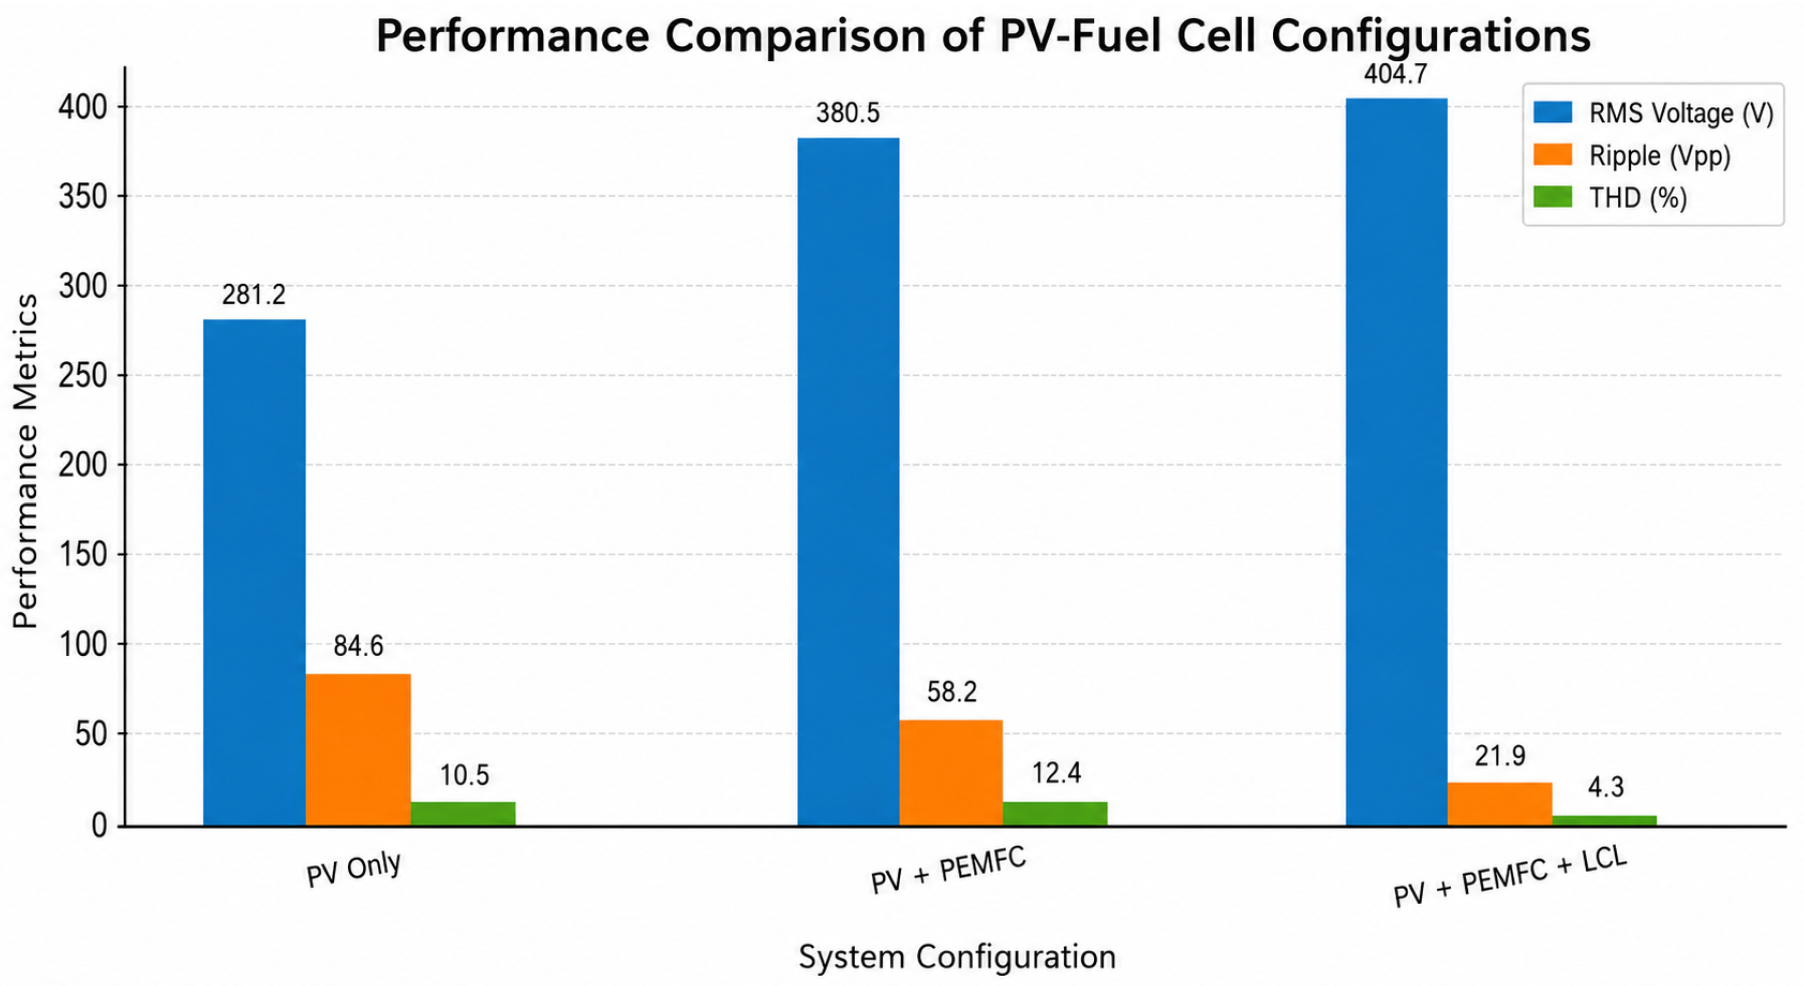
PEMFC integration stabilises PV power output, and LCL filtering improves waveform quality and load voltage. The hybrid arrangement suppresses transient oscillations, increasing power quality in this system, as shown by the 74% ripple reduction from Figure 12. These findings demonstrate that LCL filtering reduces harmonic content, ensuring inverter output standards.

6.4. PEMFC Stack Voltage

PEMFC voltage is low for the first 0–5 s. In the simulation, especially around 5–10 s, the voltage rapidly rises to meet the rising energy needs that the PV system alone cannot supply, as shown in Figure 13. The PEMFC quickly boosts voltage to stabilise the system. The PEMFC outputs 400 V for 10–20 s. During peak operation, the PV system receives maximum irradiance. Small voltage ripples indicate a dynamic response to load and PV output fluctuations. The voltage drops after 20 s and stabilises at 250–300 V. When nighttime solar irradiance drops, system demand drops or PV contribution rises. The PEMFC cuts output to conserve energy and boost efficiency. Dynamically responsive PEMFC voltage fluctuations are smooth and regulated. It matches its output to the PV system to give electricity during solar input changes.

7. Conclusions

This study detailed the design, modelling, and performance assessment of a solar PV–PEMFC system under varying solar irradiance and temperature conditions, utilising daily irradiance data from the Northern Cape area of South Africa. The main objective was to examine the efficacy of combining a PEMFC with a PV system to improve energy stability and quality in microgrid applications. The integration of the PEMFC resulted in a notable improvement in voltage stability and power supply continuity within the solar PV-PEMFC system. The PEMFC compensated for intermittent PV system production, notably during low irradiance times, to ensure a more constant voltage output. Additional future work will explore this system under diverse climatic profiles to evaluate seasonal adaptability.

Author Contributions

Conceptualization, methodology, software, M.S.M.; validation, M.S.M., E.O. and N.C.; formal analysis, investigation; writing—original draft preparation, M.S.M.; writing—review and editing, E.O.; visualisation, M.S.M.; supervision, E.O. and N.C. All authors have read and agreed to the published version of the manuscript.

Funding

This research received no external funding.

Institutional Review Board Statement

Not applicable.

Informed Consent Statement

Not applicable.

Data Availability Statement

This research includes the original contributions offered in the article. Additional enquiries may be sent to the corresponding author.

Conflicts of Interest

The authors declare no conflicts of interest.

References

  1. Kalt, T.; Simon, J.; Tunn, J.; Hennig, J. Between green extractivism and energy justice: Competing strategies in South Africa’s hydrogen transition in the context of climate crisis. Rev. Afr. Polit. Econ. 2023, 50, 302–321. [Google Scholar] [CrossRef] [Scilit]
  2. Aliyu, A.K.; Modu, B.; Tan, C.W. A review of renewable energy development in Africa: A focus in South Africa, Egypt and Nigeria. Renew. Sustain. Energy Rev. 2018, 81, 2502–2518. [Google Scholar] [CrossRef] [Scilit]
  3. Finn, I. How is global warming affecting our daily life in South Africa and what can we do about it? Trans. R. Soc. S. Afr. 2008, 63, 191–193. [Google Scholar] [CrossRef] [Scilit]
  4. Owusu-Mante, S. South Africa’s 2019 IRP renewable energy targets. Clim. Policy Lab. 2020, 13, 2020. [Google Scholar]
  5. Miri, M.; Tolj, I.; Barbir, F. Review of Proton Exchange Membrane Fuel Cell-Powered Systems for Stationary Applications Using Renewable Energy Sources. Energies 2024, 17, 3814. [Google Scholar] [CrossRef] [Scilit]
  6. Khatib, T.; Elmenreich, W. Modeling of Photovoltaic Systems Using Matlab: Simplified Green Codes; John Wiley & Sons: Hoboken, NJ, USA, 2016. [Google Scholar]
  7. Ma, T.; Yang, H.; Lu, L. Solar photovoltaic system modeling and performance prediction. Renew. Sustain. Energy Rev. 2014, 36, 304–315. [Google Scholar] [CrossRef] [Scilit]
  8. White, S. Solar Photovoltaic Basics: A Study Guide for the NABCEP Associate Exam; Routledge: London, UK, 2018. [Google Scholar]
  9. Qasem, N.A.; Abdulrahman, G.A. A recent comprehensive review of fuel cells: History, types, and applications. Int. J. Energy Res. 2024, 2024, 7271748. [Google Scholar] [CrossRef] [Scilit]
  10. Mekhilef, S.; Saidur, R.; Safari, A. Comparative study of different fuel cell technologies. Renew. Sustain. Energy Rev. 2012, 16, 981–989. [Google Scholar] [CrossRef] [Scilit]
  11. Jamal, I.; Elmorshedy, M.F.; Dabour, S.M.; Rashad, E.M.; Xu, W.; Almakhles, D.J. A comprehensive review of grid-connected PV systems based on impedance source inverter. IEEE Access 2022, 10, 89101–89123. [Google Scholar] [CrossRef] [Scilit]
  12. Ngongoma, M.S.P. Impact of Different Pulse Width Modulation (PWM) Techniques on the Performance of a Three Phase Z-Source Inverter (ZSI). Master’s Thesis, University of KwaZulu-Natal, Durban, South Africa, 2019. [Google Scholar]
  13. Adle, R.; Renge, M.; Muley, S.; Shobhane, P. Photovoltaic based series z-source inverter fed induction motor drive with improved shoot through technique. Energy Procedia 2017, 117, 329–335. [Google Scholar] [CrossRef] [Scilit]
  14. Roomi, M.M. An Overview of Carrier-based Modulation Methods for Z-Source Inverter. Power Electron. Drives 2019, 4, 15–31. [Google Scholar] [CrossRef] [Scilit]
  15. Wu, Z.; Aldeen, M.; Saha, S. A novel optimisation method for the design of LCL filters for three-phase grid-tied inverters. In Proceedings of the 2016 IEEE Innovative Smart Grid Technologies-Asia (ISGT-Asia), Melbourne, VIC, Australia, 28 November–1 December 2016; pp. 214–220. [Google Scholar]
  16. Bitoleanu, A.; Popescu, M.; Linca, M. Limitations of LCL filter for three-phase shunt active power filters in active traction substations. In Proceedings of the 2016 International Symposium on Power Electronics, Electrical Drives, Automation and Motion (SPEEDAM), Capri, Italy, 22–24 June 2016; pp. 671–676. [Google Scholar]
  17. Reznik, A.; Simoes, M.G.; Al-Durra, A.; Muyeen, S. LCL filter design and performance analysis for grid-interconnected systems. IEEE Trans. Ind. Appl. 2013, 50, 1225–1232. [Google Scholar] [CrossRef] [Scilit]
Figure 1. South Africa’s electrical energy installed capacity and production [4].
Engproc 140 00045 g001
Figure 2. Single-diode model of a solar cell [8].
Engproc 140 00045 g002
Figure 4. The ZSI schematic representation [13].
Engproc 140 00045 g004
Figure 5. The SBC PWM signals [14].
Engproc 140 00045 g005
Figure 6. LCL filter per-phase schematic [17].
Engproc 140 00045 g006
Figure 7. Northern Cape daily irradiance profile.
Engproc 140 00045 g007
Figure 8. PV voltage profile without PEMFC and LCL filter.
Engproc 140 00045 g008
Figure 9. PV-PEMFC voltage waveforms before filtering.
Engproc 140 00045 g009
Figure 10. PV system voltage waveforms after filtering.
Engproc 140 00045 g010
Figure 11. PV-PEMFC voltage waveforms after filtering.
Engproc 140 00045 g011
Figure 12. PV system performance comparison with PEMFC integration and LCL filter.
Engproc 140 00045 g012
Figure 13. PEMFC stack voltage waveform.
Engproc 140 00045 g013
Table 1. CS6U-345M Polycrystalline PV solar panel parameters.
ParameterValue
Maximum power345.186 W
Open circuit voltage (VOC)46.4 V
Short circuit current (ISC)9.56 A
Voltage at maximum power point (Vmp)38.1 V
Current at maximum power point (Imp)9.06 A
Table 2. The ZSI and LCL filter parameters.
ParameterValue
L1 = L2 of the ZSI43.805 µH
C1 = C2 of the ZSI88.072 µF
PPV55.95 kW
Switching frequency for ZSI (fsw)20 kHz
Duty cycle (D)17%
L1 of the filter269.57 µH
L2 of the filter1.673 µH
C of the filter741.664 µF
Switching frequency for the LCL filter (fsw)10 kHz
Disclaimer/Publisher’s Note: The statements, opinions and data contained in all publications are solely those of the individual author(s) and contributor(s) and not of MDPI and/or the editor(s). MDPI and/or the editor(s) disclaim responsibility for any injury to people or property resulting from any ideas, methods, instructions or products referred to in the content.