1. Introduction
Electrical insulation breakdown is a major concern in high-voltage systems because the failure of insulating components can result in flashovers, power interruptions, or irreversible equipment damage. Such failures often occur during transient overvoltages generated by lightning impulses, switching operations, or system faults. Under these conditions, the applied voltage increases rapidly and produces intense, highly non-uniform electric fields that may initiate discharges either through the surrounding air or along the surface of solid insulation [
1,
2]. Surface discharges, commonly referred to as surface flashover, are particularly destructive. They induce localised heating, surface erosion, and significant distortion of the electric field, all of which contribute to accelerated long-term degradation of insulating materials.
The mechanism of electrical breakdown in gases provides the fundamental framework for understanding surface flashover behaviour. Breakdown begins when free electrons, accelerated by the applied electric field, collide with neutral gas molecules and generate additional ionisation. This process grows exponentially through repeated collisions and is known as the Townsend avalanche [
3]. The number of electrons after travelling a distance x within the field is described by Equation (1):
where
n0 is the initial number of free electrons, and
α is the first Townsend ionisation coefficient (ionising collisions per unit length) [
3]. Under impulse excitation and atmospheric pressure, this avalanche transitions into the streamer mechanism, where the accumulated space charge enhances the local electric field and forms a self-propagating plasma channel, known as an arc. Breakdown occurs when the effective ionisation integral satisfies Equation (2):
where
d is the electrode gap, and
η is the electron attachment coefficient [
3]. This streamer criterion corresponds to the conditions under which an electron avalanche becomes self-sustaining, and is therefore highly relevant to lightning impulse breakdown, which occurs in air under strongly non-uniform fields.
2. Previous Work
After several fundamental experimental works [
4,
5], Gomes et al. [
6] carried out one of the earliest systematic optical studies of flashover behaviour under standard 1.2/50 µs lightning impulses using a rod–plane configuration and polymer rods fabricated from PMMA, PVC, and polyethene. Their experiments identified three characteristic arc modes: fully aerial discharges, partially surface-adhering discharges, and fully surface-adhering discharges. A strong dependence on impulse polarity was observed. Positive impulses produced predominantly aerial streamers, whereas negative impulses favoured arcs that propagated along the polymer surface. Although primarily qualitative in nature, the study provided important early insight into the influence of polarity on streamer development and the mechanisms governing surface attachment on polymeric insulation. Later, Gomes and the team [
6,
7,
8] extended their work with several variations.
Minhas et al. [
8] recently expanded this line of investigation by examining similar polymeric materials, PMMA, PVC, and nylon, while introducing three distinct surface geometries: cylindrical, concave, and convex. Their experiments used a rod–rod configuration in which one electrode was energised and the other grounded. The study focused exclusively on positive lightning impulses and therefore did not evaluate polarity effects. The findings underscored the strong influence of surface curvature and material type on arc trajectory and breakdown characteristics. The present work extends these earlier observations by employing a rod–plane arrangement that generates a more divergent electric field and enables a controlled comparison between positive and negative impulse polarities. Additionally, a controlled surface-contamination parameter is introduced through a thin sunflower oil coating to simulate modified surface conductivity under realistic outdoor conditions.
Further insight into the influence of surface films can be drawn from contamination-based studies. Venkataraman and Gorur [
1] developed an empirical model for polluted non-ceramic insulators and demonstrated a strong correlation between flashover voltage, surface resistance, and contamination severity. Their results showed that increasing surface conductivity lowers flashover voltage, whereas hydrophobic materials maintain higher surface resistance and therefore endure higher electric stress before breakdown. This behaviour is directly relevant to the present investigation because sunflower oil is a good electrical insulator [
9]. The applied oil layer thus forms a resistive surface film that is expected to increase the breakdown voltage and potentially extend the time to breakdown relative to clean samples.
The influence of contamination uniformity was examined by Ghayedi et al. [
9] and Pawlicki et al. [
10], who combined modelling and experimentation to study flashover on silicone-rubber insulators subjected to non-uniform pollution. They reported that uniform contamination enhances local electric-field stress and reduces flashover voltage, while non-uniform contamination alters the breakdown voltage depending on its spatial distribution. Although their work was conducted under AC excitation, it illustrates the sensitivity of flashover behaviour to subtle variations in surface films. In the present study, oil-coated samples were dried for 16 h to promote uniformity; however, the model in [
9] suggests that even small deviations from uniform thickness, together with natural experimental scatter, may still influence flashover initiation.
At the microscopic level, Xie et al. [
11] investigated surface-charge accumulation on polymers such as PMMA under DC voltage stress. Their results showed that trapped charges distort the local electric field and reduce flashover voltage, with PMMA exhibiting the highest sensitivity. The described mechanism of charge trapping, redistribution, and local field enhancement is directly relevant to impulse-voltage breakdown. It provides a physical basis for the polarity-dependent arc behaviour observed in the present study, where charge accumulation and localised field intensification along the surface strongly influence streamer propagation and the likelihood of surface attachment.
3. Methodology
3.1. Experimental Setup
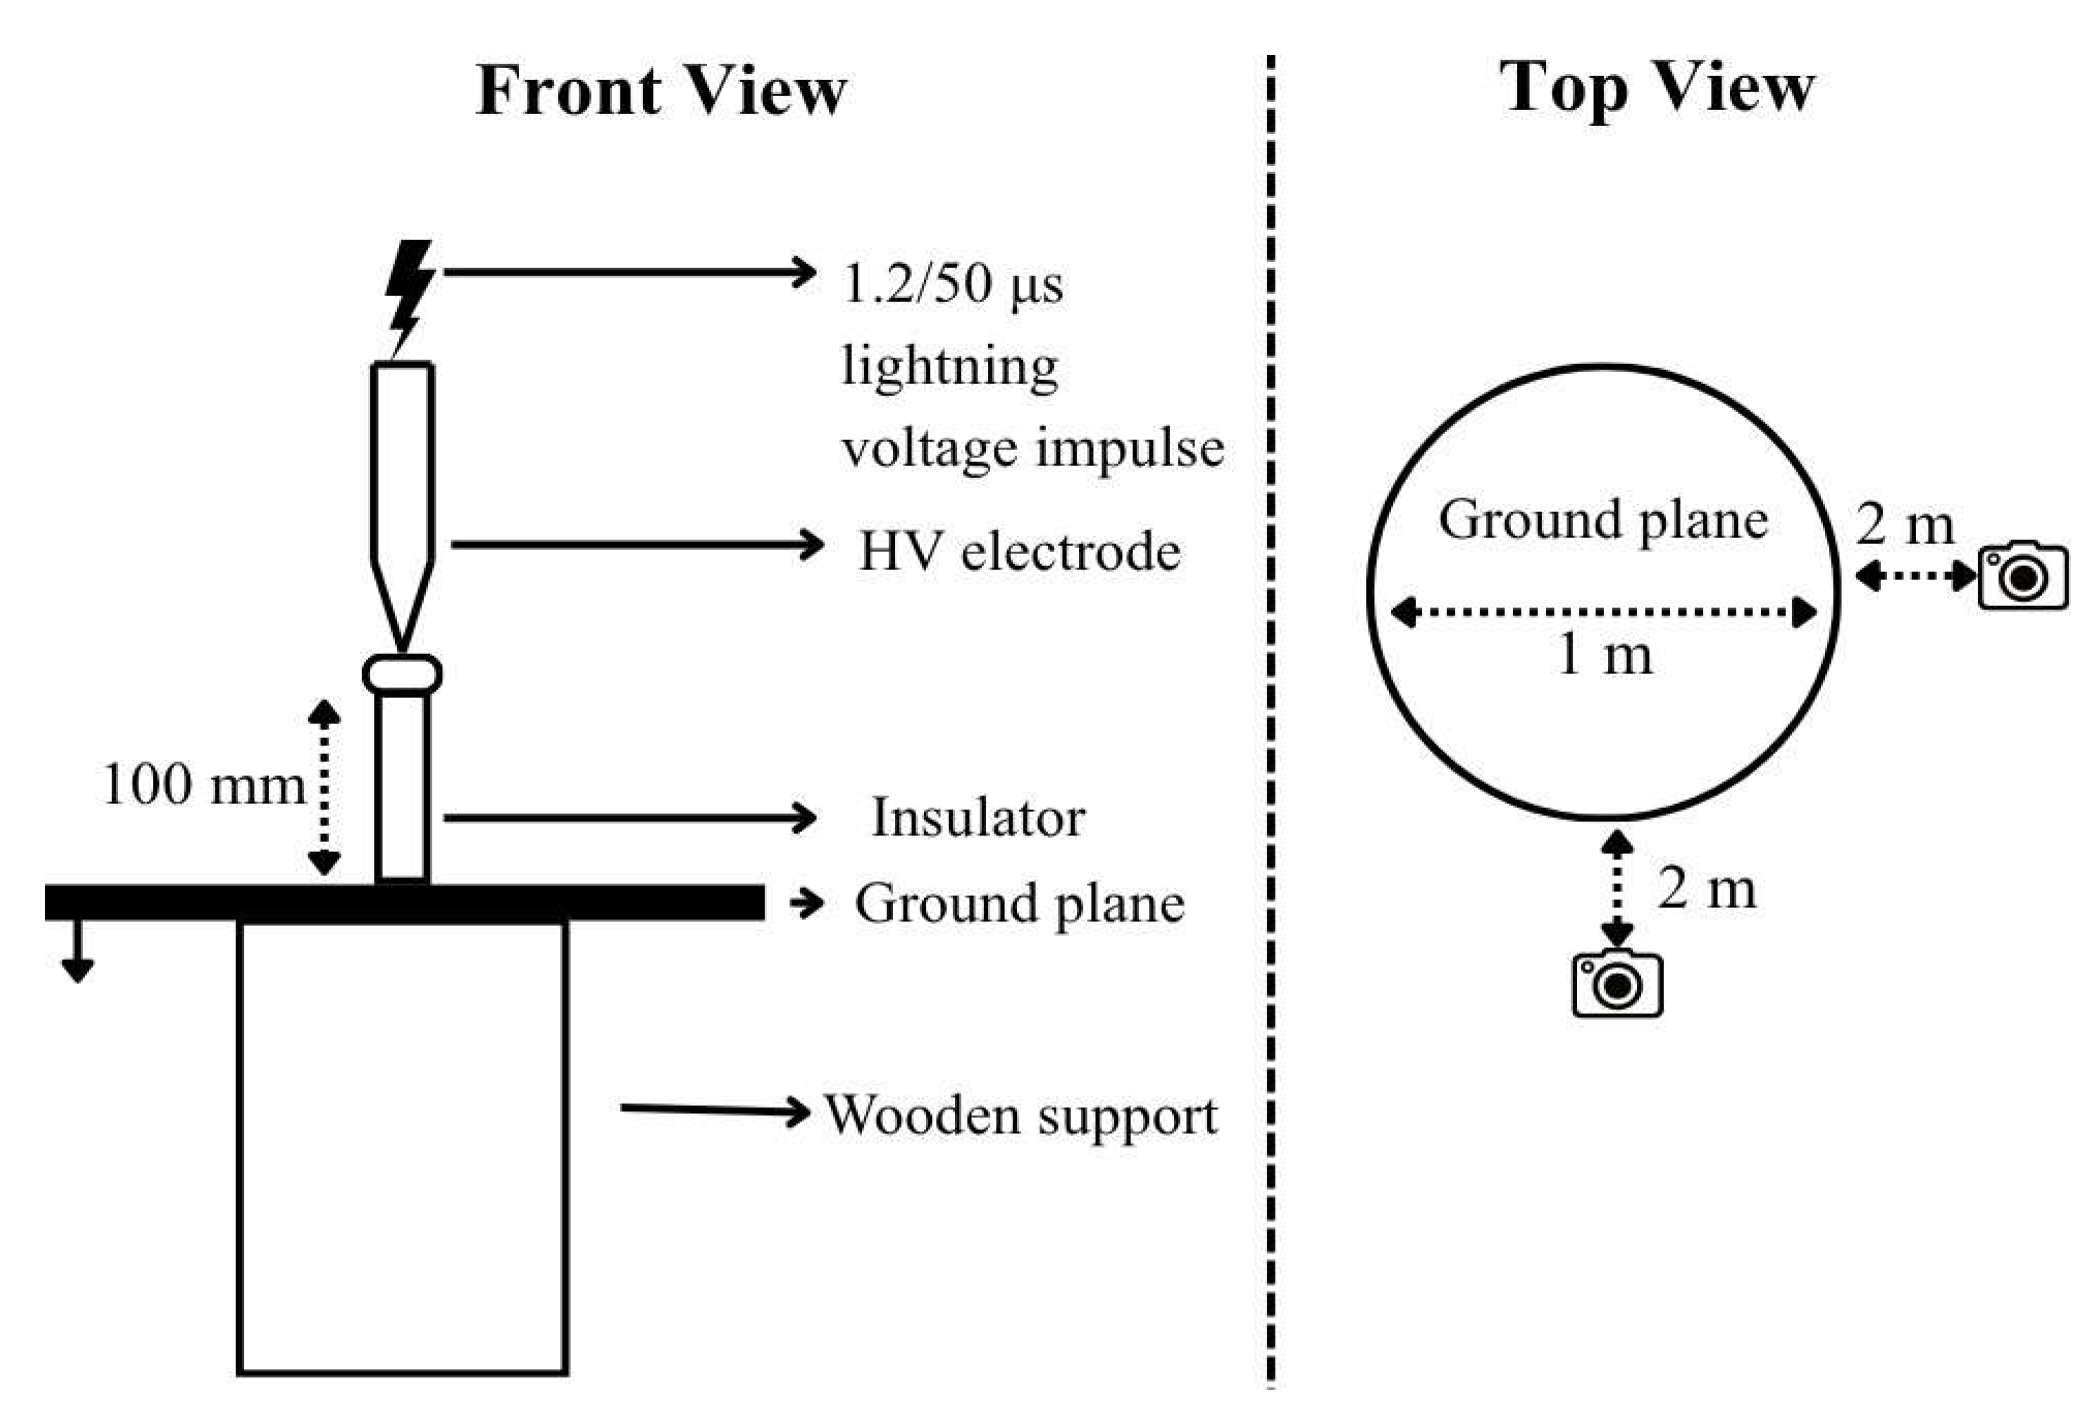
The experimental programme was performed in the High Voltage Laboratory of the University of the Witwatersrand using an 800 kV multi-stage Marx generator as the impulse source. The high-voltage electrode consisted of a steel rod equipped with a detachable brass tip. This configuration transformed the discharge region from a classic point–plane arrangement to a rod–plane geometry and ensured a stable, reproducible field enhancement necessary for controlled streamer initiation. The grounded electrode was a circular aluminium plate with a diameter of 1 m, selected to provide a uniform, electrically smooth termination surface. A fixed electrode separation of 100 mm was maintained throughout all tests to ensure comparability of breakdown data across materials and surface conditions.
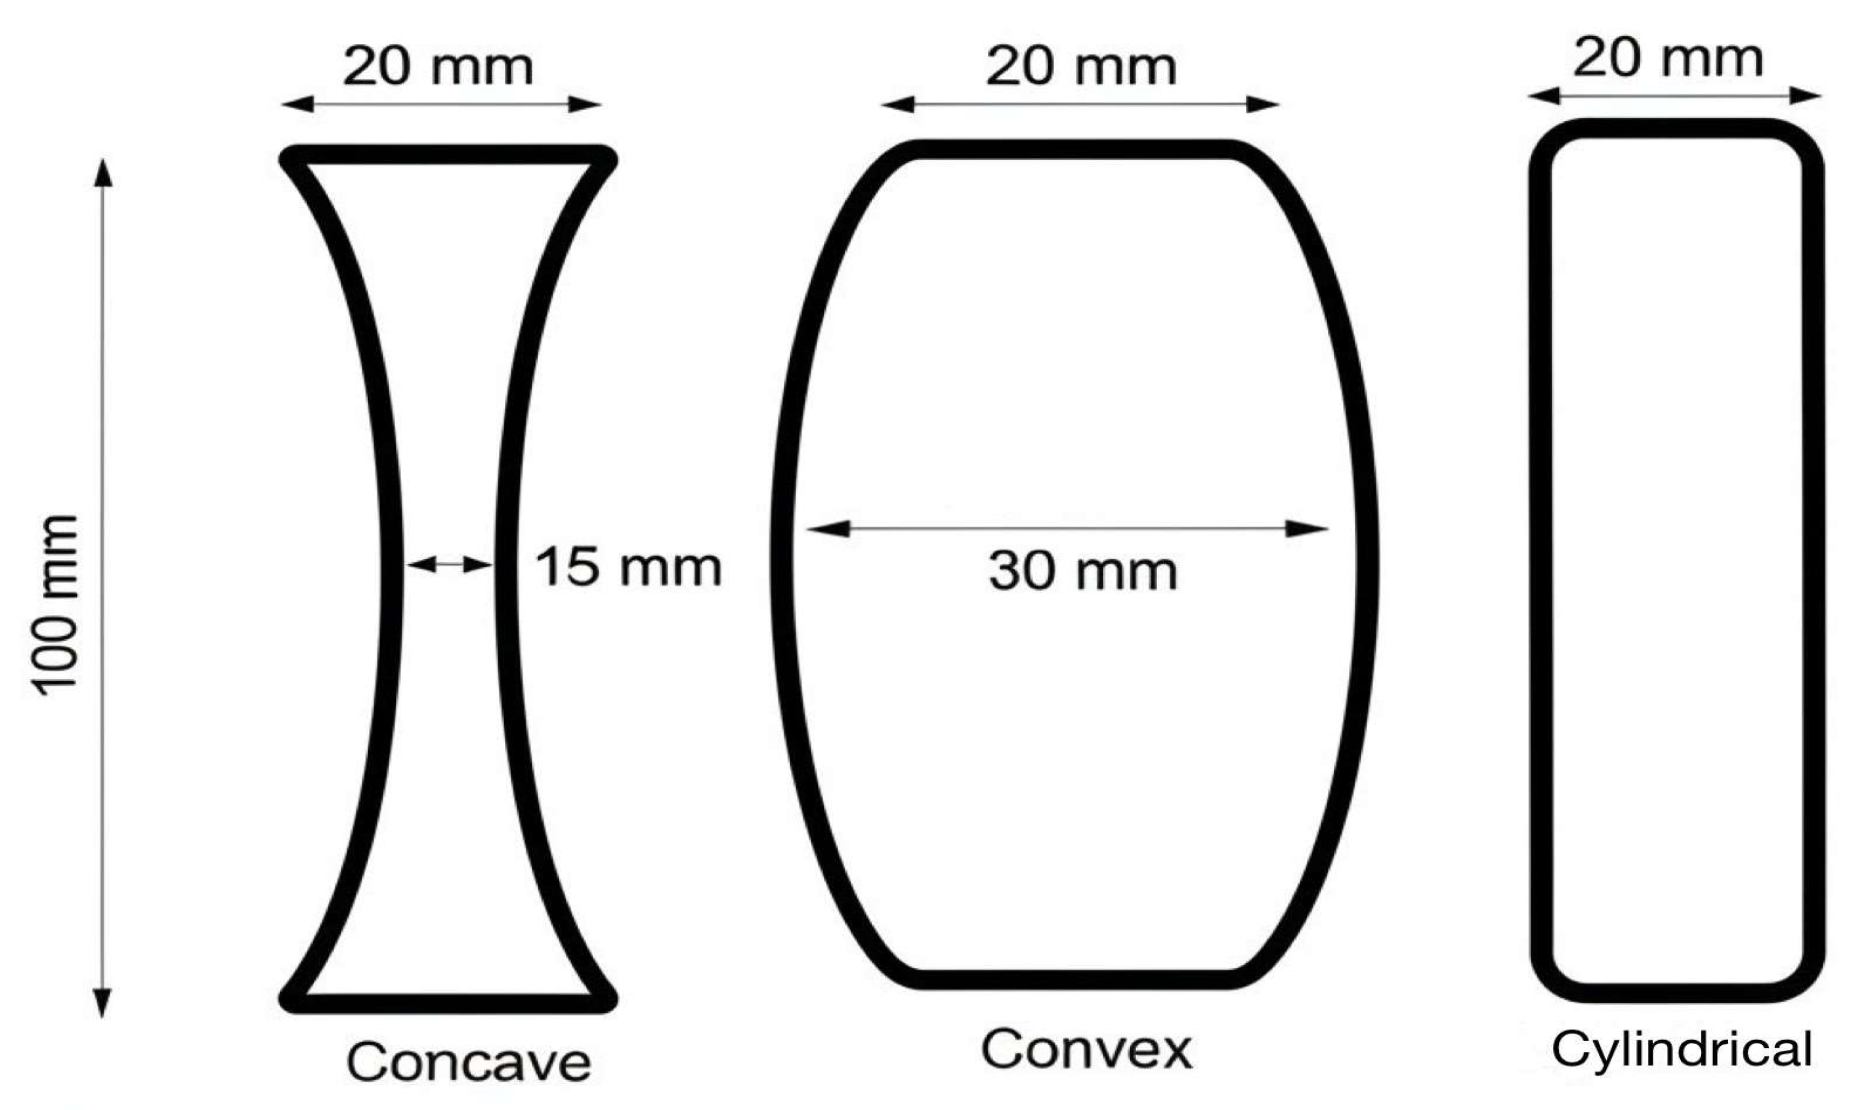
Polymeric insulator samples manufactured from PMMA, nylon, and PVC were prepared with three different surface profiles, namely concave, convex, and cylindrical. These specimens, illustrated in
Figure 1, were mounted vertically along the axis between the high-voltage rod and the grounded plate so that the discharge channel intercepted the central region of each insulator. By maintaining strict alignment, the influence of geometry, material properties, and surface condition on arc propagation could be examined under well-defined electric-field distributions.
Each insulator was evaluated under two surface conditions that were implemented in a controlled sequence.
Clean condition: The samples were washed thoroughly with isopropyl alcohol to remove residual contaminants and fingerprints. They were then air-dried for approximately five minutes to ensure that no solvent film or moisture remained before energisation.
Oil-coated condition: The samples were completely immersed in sunflower oil and subsequently dried for approximately sixteen hours at ambient laboratory temperature. This procedure resulted in the formation of a thin, uniform surface film with stable dielectric properties. Sunflower oil was selected due to its ready availability and well-characterised insulating behaviour. To ensure consistent surface conditions and recovery times across all materials and geometries, each specimen was dipped every 30 min. This interval corresponded to the time required to complete a full series of fifteen impulse shots, and therefore maintained uniformity in oil-film ageing and evaporation across the entire experimental matrix.
Two non-conductive matte-black background screens, fabricated from plywood panels coated with high-absorption black paint, were arranged orthogonally around the test region to maximise optical contrast and suppress stray reflections during image acquisition. Digital imaging was performed using two high-resolution cameras positioned approximately 2 m from the electrode gap and oriented 90° relative to one another. This arrangement enabled simultaneous front and side-view recording of the discharge phenomena. Each camera operated in long-exposure mode to capture the full temporal evolution of the arc within a single impulse event.
To mitigate electromagnetic interference generated by the high-voltage impulse, each camera was placed inside an improvised yet effective Faraday enclosure constructed from multiple layers of aluminium foil. The shielding configuration attenuated impulsive electromagnetic fields while preserving an unobstructed optical path. The overall experimental arrangement is illustrated in
Figure 2.
3.2. Test Procedure
A standard 1.2/50 µs lightning impulse voltage waveform was generated using a Marx generator in accordance with IEC 60060-1 standards for high-voltage impulse testing. Tests were conducted for both positive and negative polarities of the rod electrode [
12]. For each test condition and polarity, the applied voltage was set close to the 50% breakdown voltage (U
50) to ensure sufficient stress to initiate electrical breakdown while allowing observation of pre-breakdown phenomena such as corona inception and streamer development.
The applied voltage was incrementally increased until surface breakdown occurred across the insulator. Each unique material–geometry–condition combination was subjected to 15 impulse breakdown tests, providing adequate data for statistical analysis. A recovery interval of approximately two minutes was maintained between successive discharges to allow for complete charge dissipation and to prevent cumulative thermal or surface effects.
Breakdown events were verified both optically, via visible arc formation captured on camera, and electrically, characterised by a sharp voltage collapse and subsequent oscillations in the recorded waveform. The oscilloscope trigger was synchronised with the impulse generator to ensure accurate capture of both pre-breakdown and breakdown intervals.
- ii.
Measurement System
Impulse voltage waveforms were recorded using a calibrated resistive–capacitive voltage divider connected to a digital oscilloscope. For operator safety and signal fidelity, the oscilloscope was powered through an isolation transformer and located inside the laboratory’s shielded test enclosure (Faraday cage). Only the voltage signal was monitored, as concurrent current measurements provided no additional diagnostic benefit; sufficient information on discharge dynamics was derived from the voltage traces alone.
Two key parameters were extracted from each recorded waveform:
VBD (Breakdown Voltage): Determined using the oscilloscope cursor at the instant of voltage collapse, corresponding to the onset of breakdown.
TBD (Time to Breakdown): Defined as the time interval between the initiation of the voltage impulse and the appearance of visible arc formation.
Simultaneously, the two orthogonally positioned cameras recorded each discharge sequence, allowing direct correlation between the electrical data VBD, TBD and the optical discharge trajectory. The combined dataset was used to compare clean and oil-coated surface conditions, and to assess the influence of polarity and surface geometry on breakdown behaviour.
Statistical analysis of VBD and TBD values included computation of the mean and standard deviation to quantify consistency and variability across all test conditions.
- iii.
Environmental conditions
Environmental parameters were continuously monitored during all tests. The ambient temperature, relative humidity, and atmospheric pressure were maintained at approximately 20 ± 5 °C, 45 ± 2%, and 830 ± 5 mbar, respectively. These minor fluctuations had a negligible effect on breakdown voltage; therefore, no environmental correction factors were applied [
13].
4. Results & Discussion
4.1. Arc Type Observations
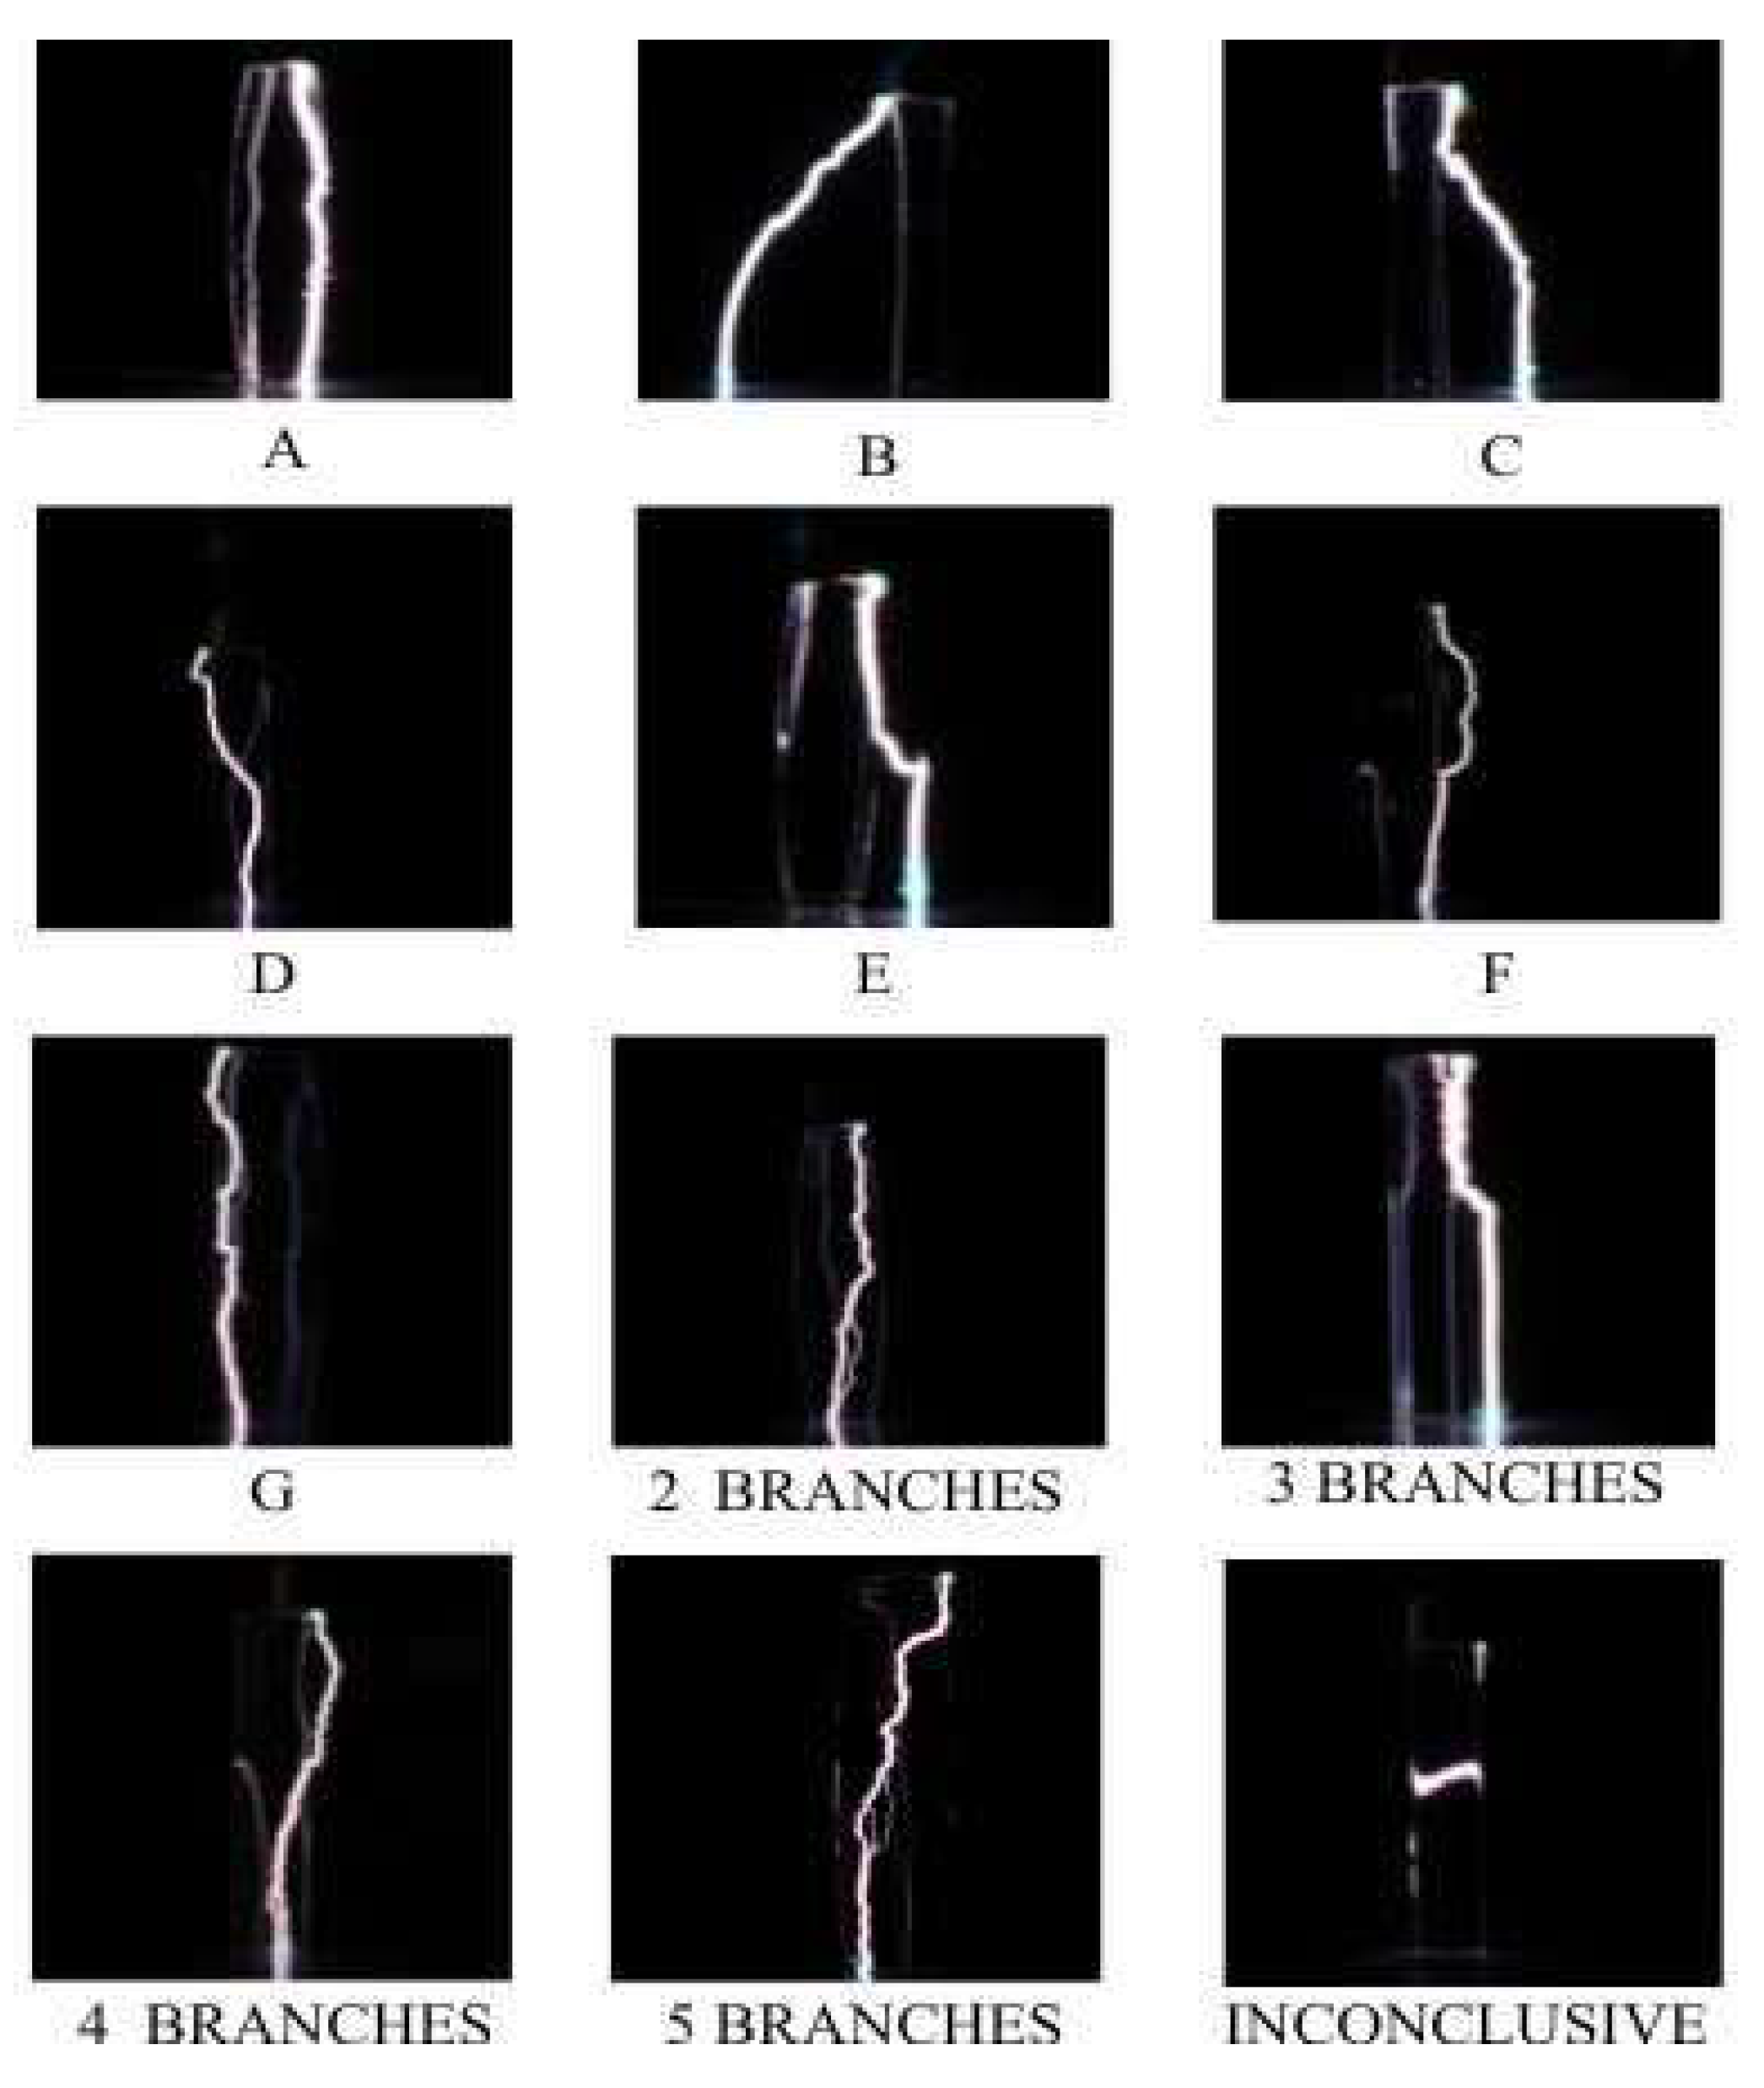
Seven distinct arc types were identified, as illustrated in
Figure 3 and classified in
Table 1. The predominant combinations observed across different materials and surface conditions are summarised in
Table 2.
Arc behaviour was found to be primarily influenced by surface geometry rather than by material properties, consistent with the findings reported in [
8]. Convex profiles predominantly produced Type A arcs, characterised by close surface adherence; concave profiles favoured Type B arcs, which propagated through the surrounding air; and cylindrical profiles exhibited a mixture of Types A, B, and D. Across all tested materials, PMMA, PVC, and Nylon, this geometry-dependent trend persisted, with no consistent material-specific behaviour observed.
Branching behaviour was also observed, with two-way bifurcations being the most prevalent, occurring in approximately 33% of clean samples and 11% of oil-coated samples. Infrequent multi-branch events involving three to five channels (less than 5% of cases) were excluded from quantitative analysis due to their limited occurrence.
These observations extend the findings of [
6,
8], which predominantly reported single-channel or single-split discharges. The comparatively higher branching frequency recorded in this study, particularly under clean, positive-polarity conditions, indicates that the rod–plane configuration, characterised by a more divergent electric field, promotes the initiation of multiple concurrent streamer paths. This contrasts with the rod–rod geometry employed in [
8], where the field distribution was more uniform, and branching was consequently less pronounced.
Additionally, negative polarity impulses predominantly generated Type B arcs, which contrasts with the findings of [
6,
14], where negative discharges were reported to favour surface-adhering or near-surface propagation. In the present study, positive polarity did not exclusively produce Type A or Type B arcs as previously observed, but rather a combination of Types A, B, and D. This suggests a more complex interaction between polarity and surface geometry under the rod–plane field configuration, likely arising from differences in field divergence and charge distribution dynamics compared with the geometries examined in [
7].
4.2. Voltage at Breakdown (VBD)
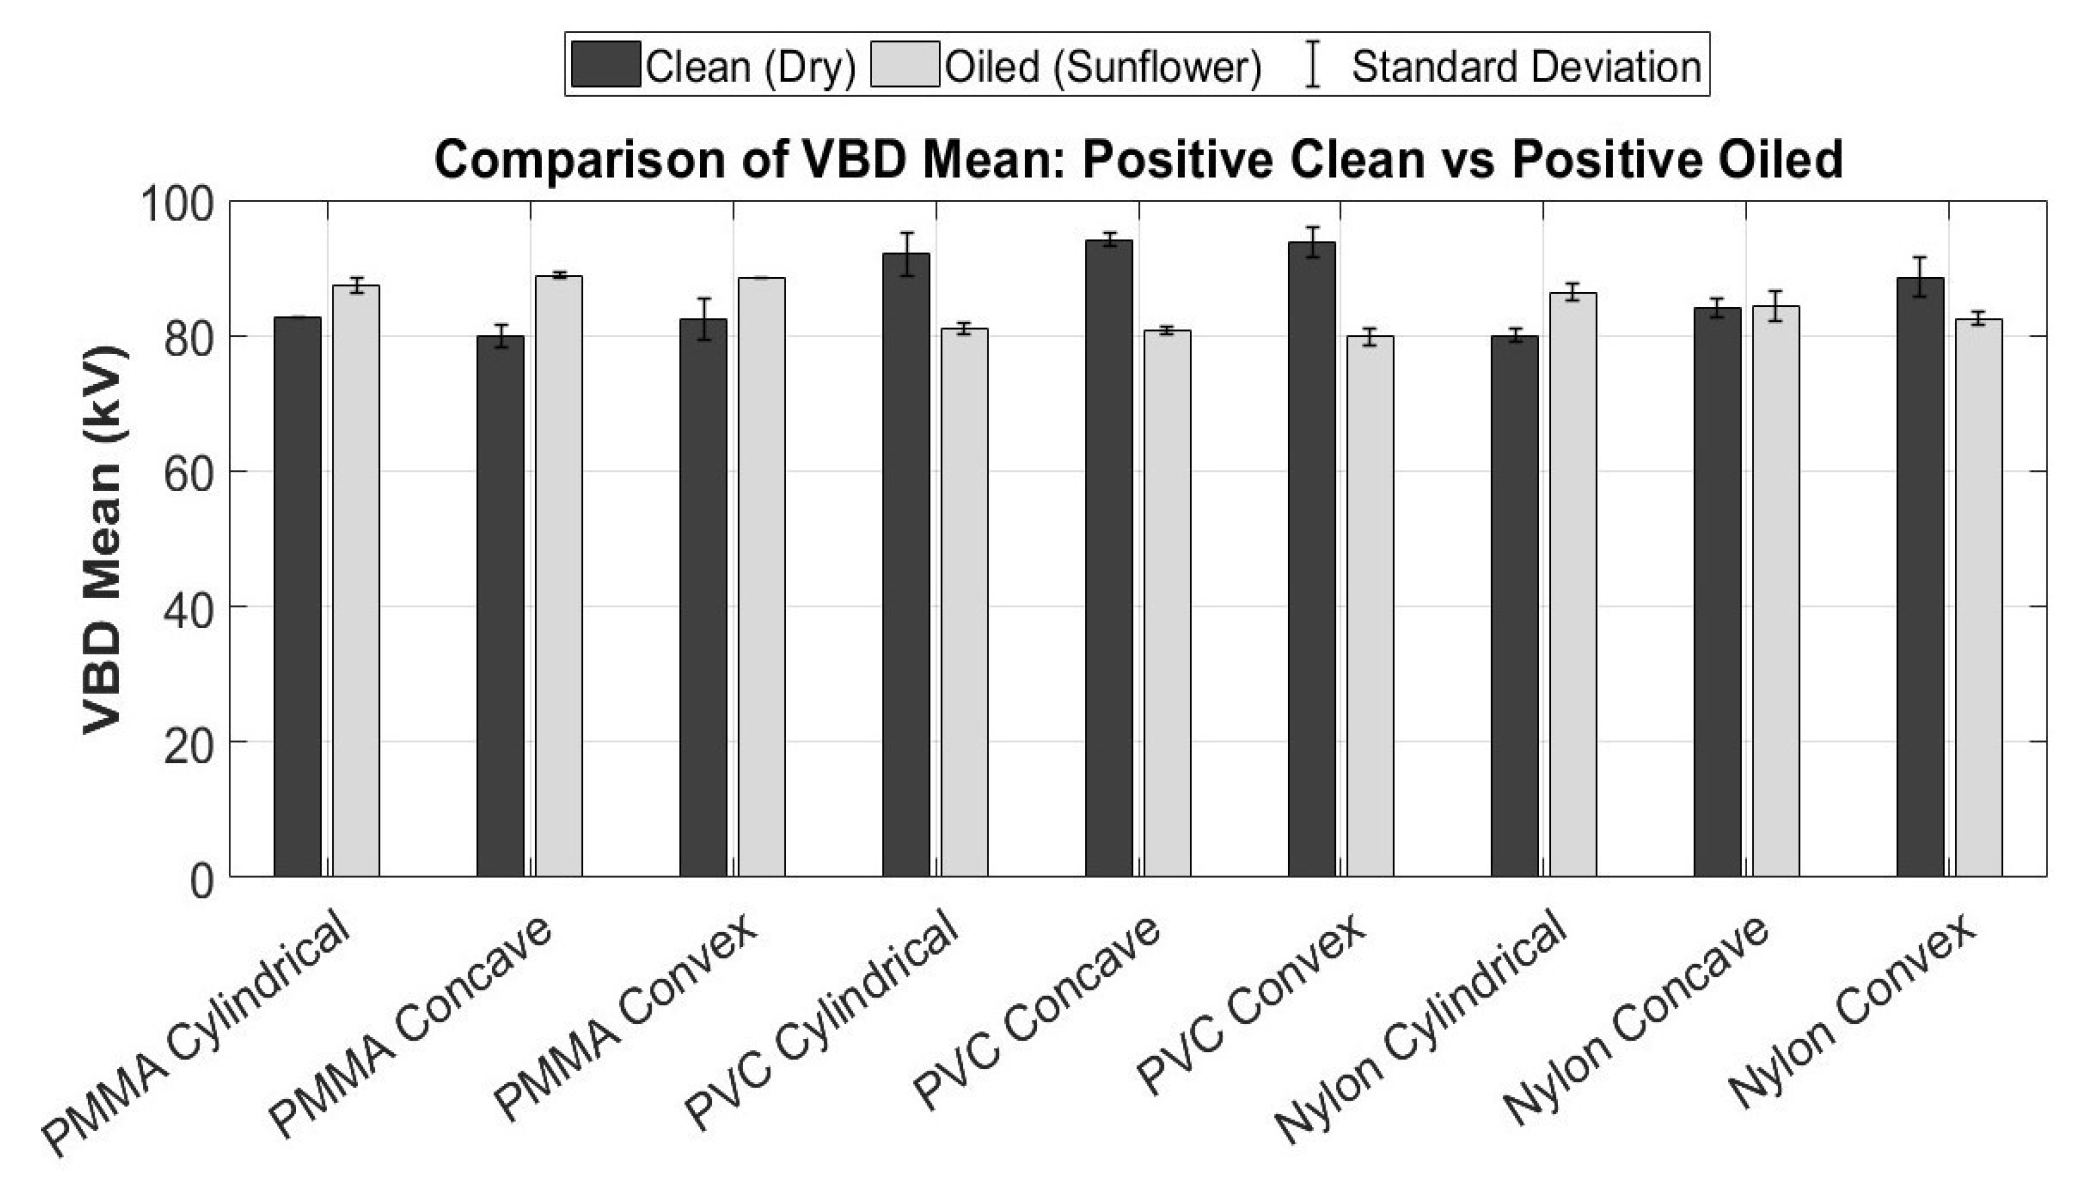
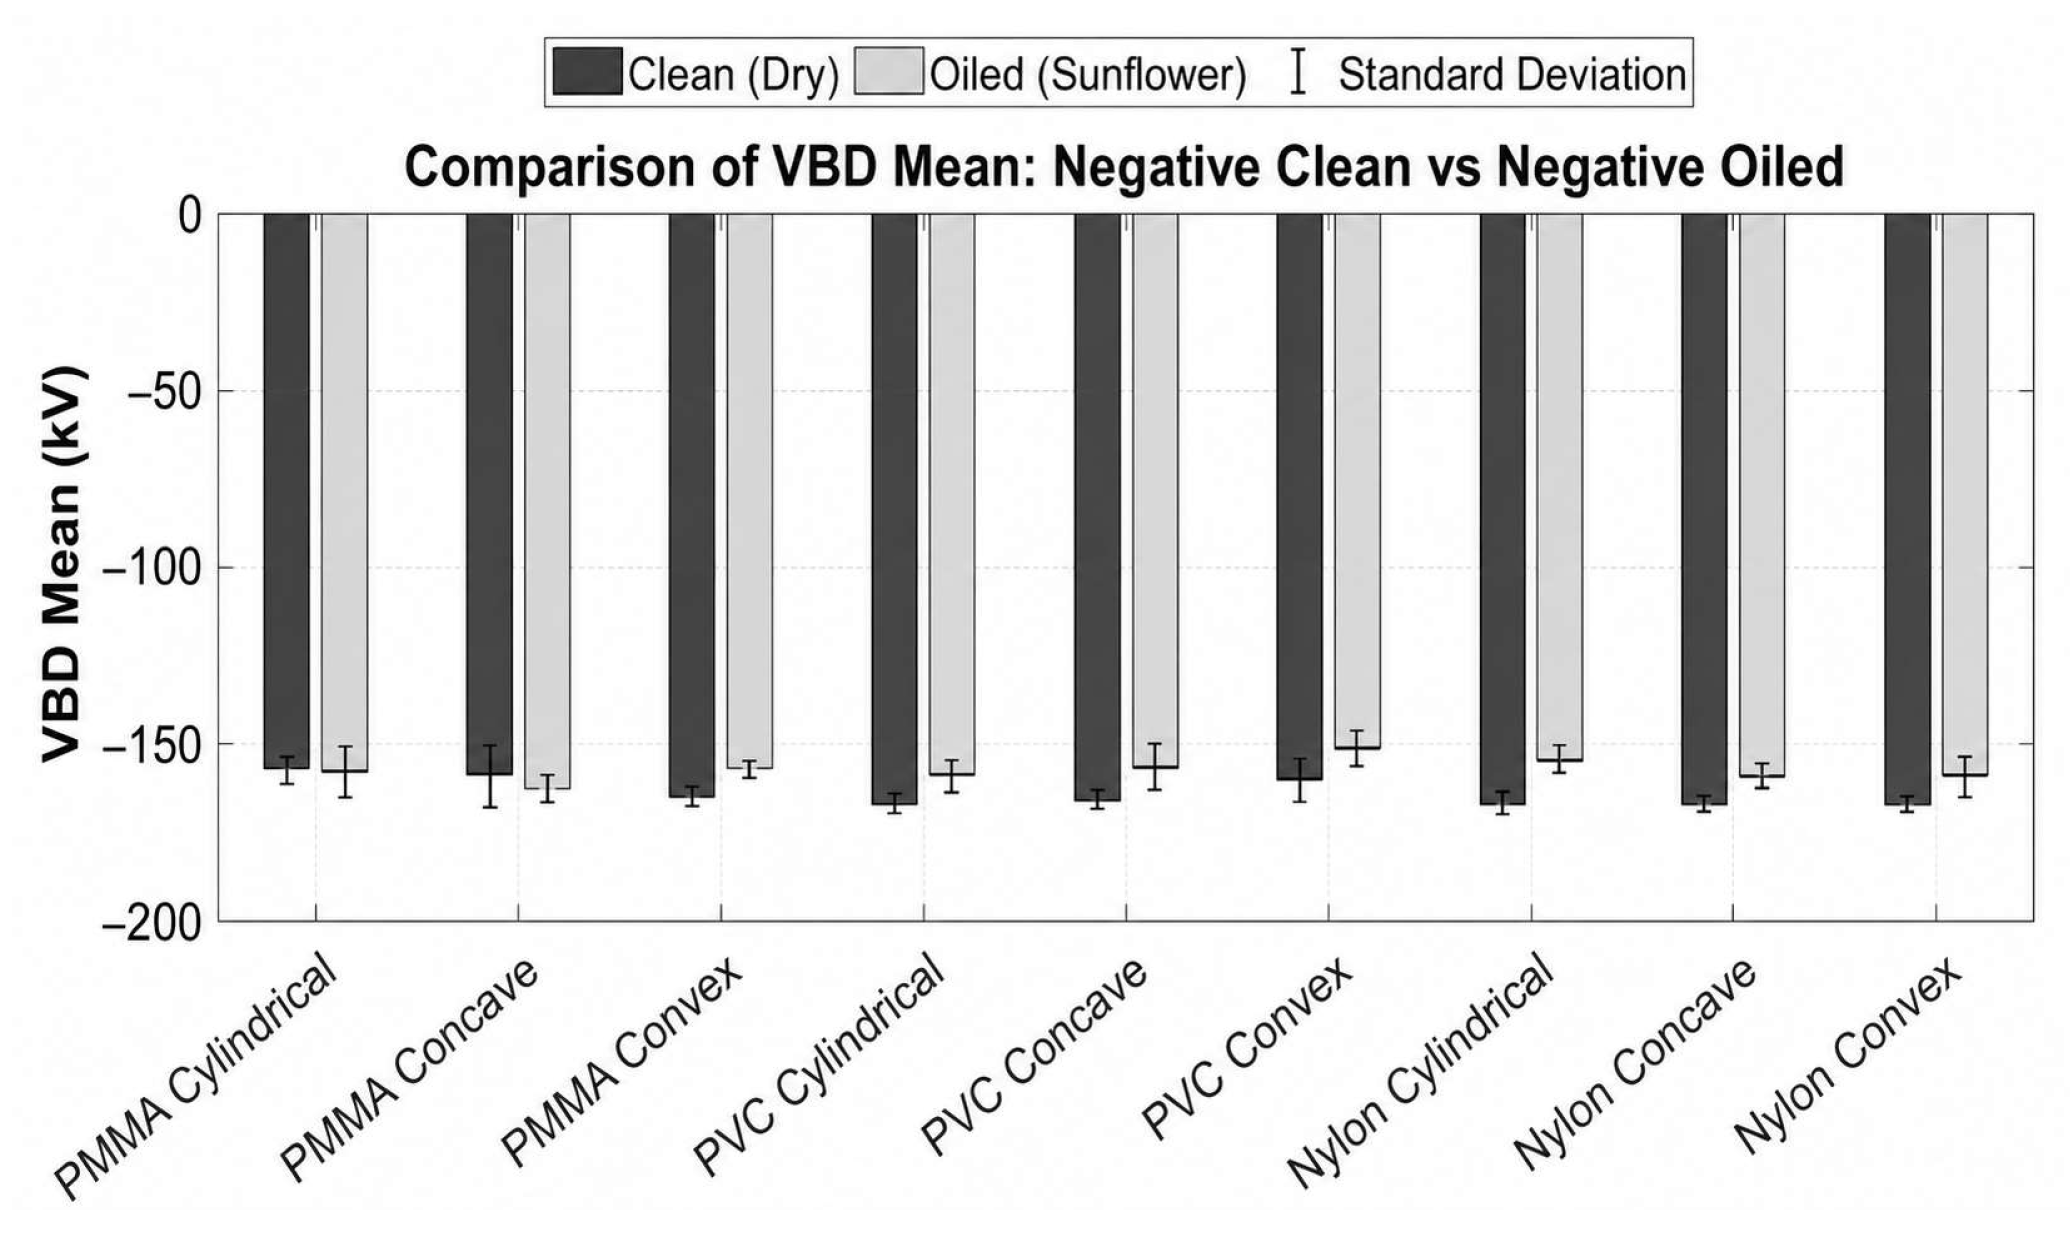
Figure 4 and
Figure 5 present the mean V
BD and corresponding standard deviations for both polarities.
Under positive polarity, clean samples of PMMA, PVC, and Nylon exhibited breakdown voltages ranging from 80 to 95 kV. The introduction of oil contamination induced material-dependent variations: PMMA showed a 5–11% increase in breakdown voltage, PVC experienced an 11–15% reduction, while Nylon displayed mixed behaviour, modest increases for cylindrical and concave profiles, but a 7% decrease for convex samples.
For negative polarity, the breakdown voltages were generally higher, ranging from 150 to 170 kV for clean samples. This indicates that the rod–plane configuration required a stronger local electric field to initiate surface discharges when the energised electrode was negative. Mechanistically, negative polarity produces cathodic streamer propagation from the electrode tip toward the grounded surface [
15]. In this configuration, electron emission from the cathode initiates fast-moving streamers, but the space-charge distribution near the electrode results in a local field depression, effectively increasing the voltage required to sustain discharge development. By contrast, positive polarity promotes anodic streamer initiation, where electron avalanches propagate toward the energised electrode and enhance local field intensification near surface asperities, generally resulting in lower VBD for clean samples [
16,
17].
Surface contamination with sunflower oil generally reduced VBD by 4–7%, although minor increases of 0.2–2% were observed for PMMA samples with concave and cylindrical geometries. This deviation from the typical trend reflects the complex interplay between surface conductivity, local electric-field enhancement, and streamer attachment dynamics. The observed behaviour aligns more closely with the findings of Ghayedi et al. [
9], who demonstrated that flashover voltage is highly sensitive to the uniformity and distribution of surface films. Non-uniform oil coverage can produce localised regions of higher conductivity, which act as preferential pathways for surface streamers and modify the local space-charge distribution, thereby influencing VBD. These results highlight that the macroscopic breakdown voltage is strongly coupled to microscopic surface conditions and the spatial evolution of streamer channels.
4.3. Time-to-Breakdown (TBD)
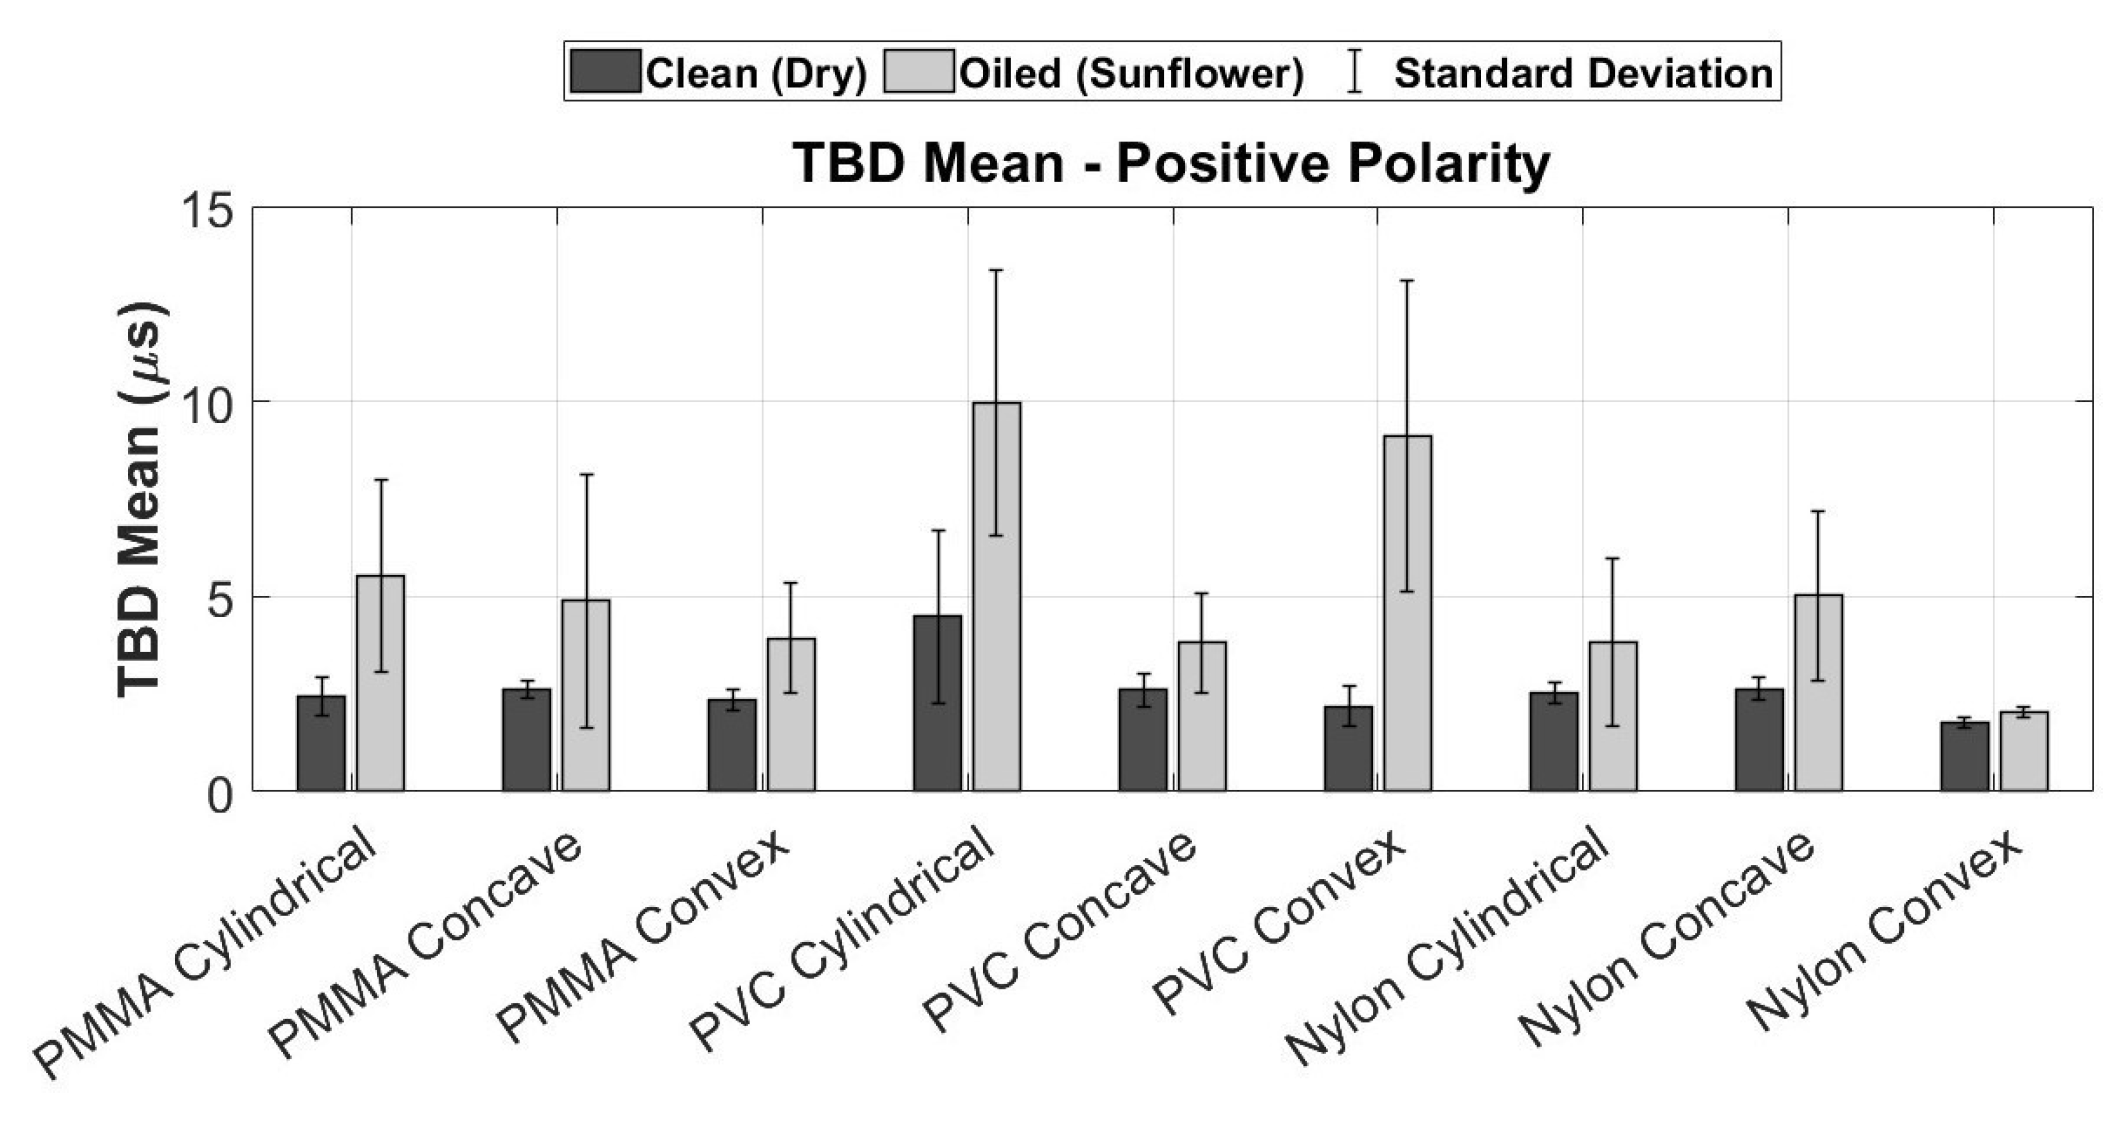
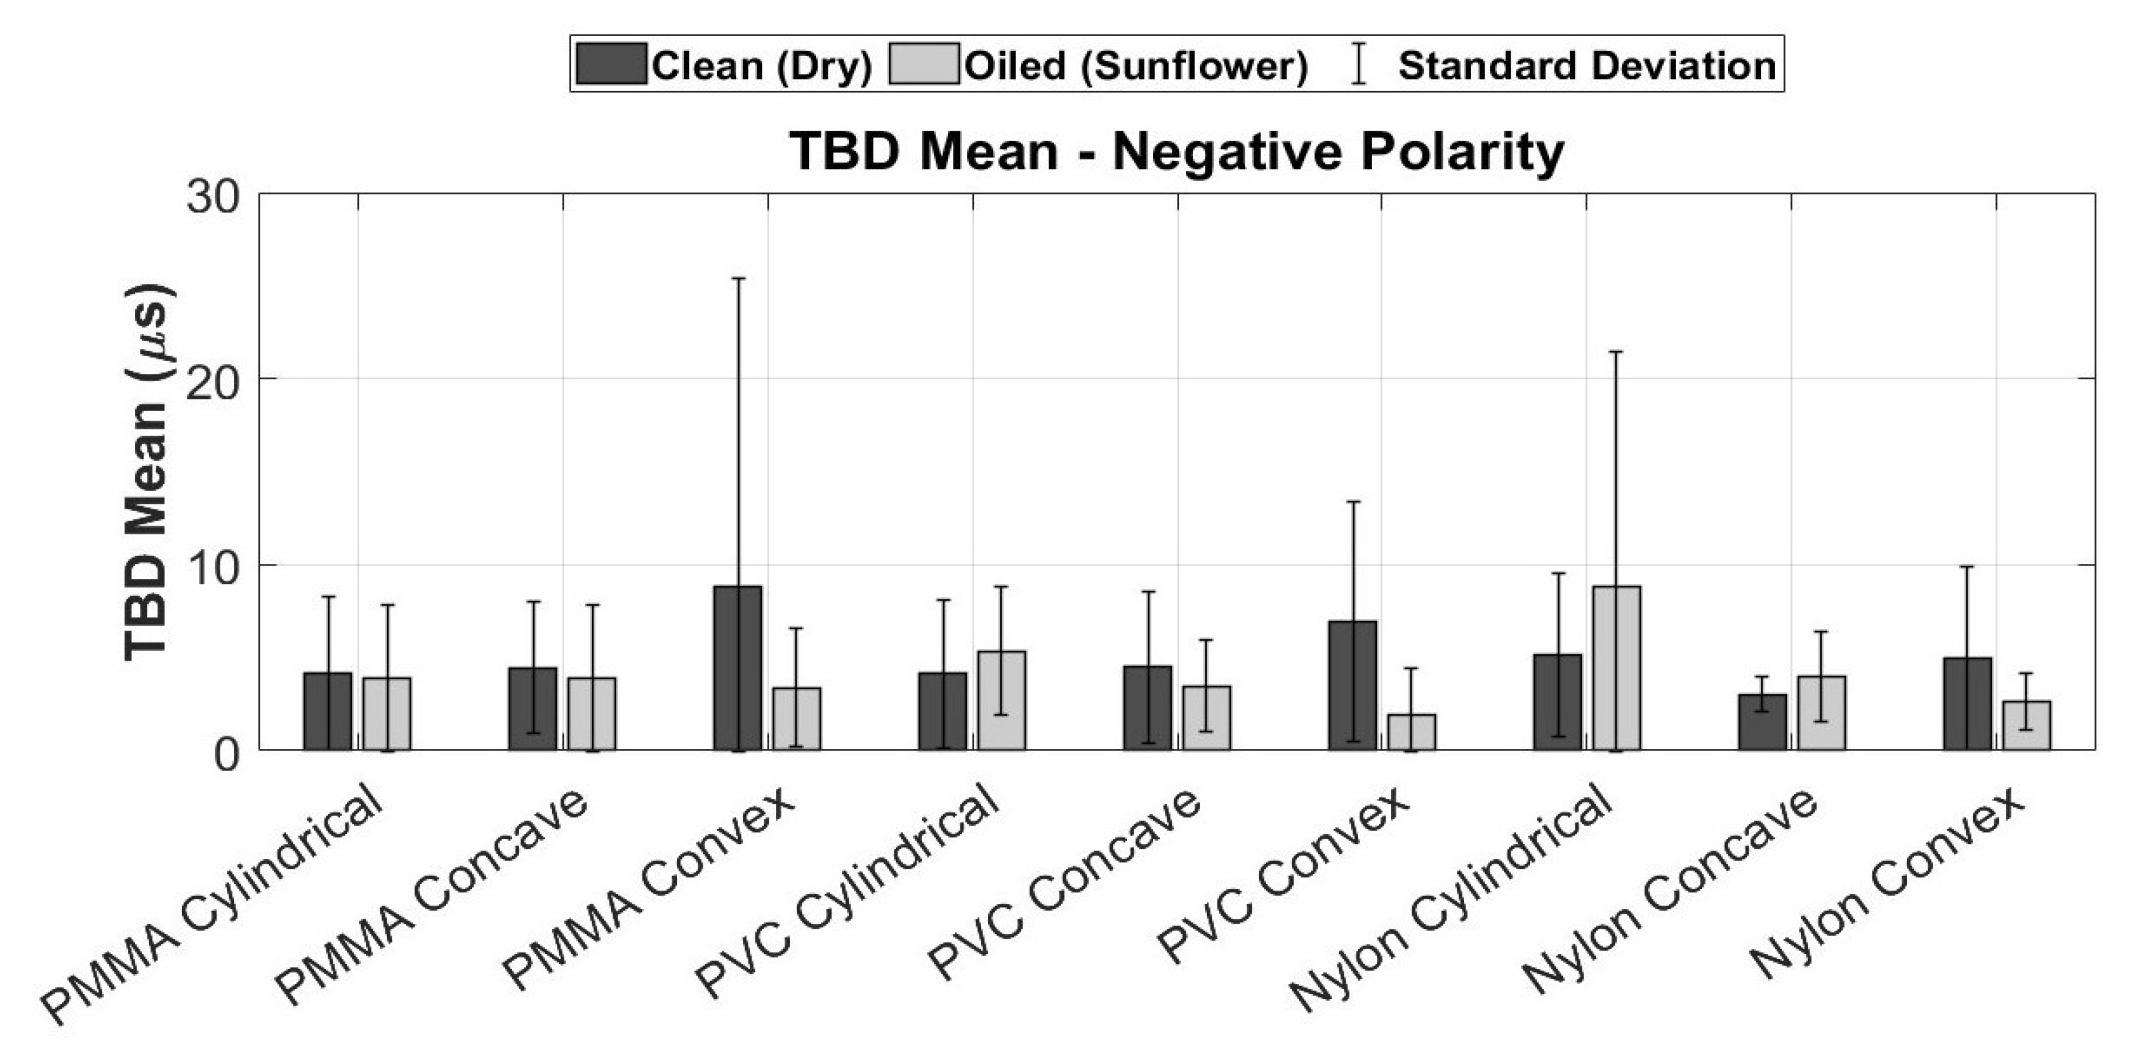
The mean time-to-breakdown values for all samples are presented in
Figure 6 and
Figure 7. Under positive polarity, oiled samples consistently exhibited longer TBD, ranging from approximately 47% for PVC concave specimens to over 300% for PVC convex geometries, with PMMA and nylon showing similar trends [
18]. The extended TBD can be explained mechanistically by the moderating effect of the oil layer on local electric-field intensification. The weakly conductive surface film slows charge accumulation at protrusions and along micro-asperities, delaying the formation of a self-sustaining streamer network [
19,
20].
Under negative polarity, TBD values were generally shorter and less sensitive to the presence of the oil layer. This is consistent with cathodic streamer dynamics, where electron emission from the negative electrode promotes rapid streamer propagation and faster charge redistribution along the polymer surface [
20]. The polarity-dependent differences in both VBD and TBD underscore the critical role of local space-charge effects and streamer development in surface flashover. Furthermore, the interplay between surface geometry, material properties, and the uniformity of the contamination layer determines the initiation sites and propagation paths of streamers, highlighting the necessity of carefully controlling both surface conditions and polarity in experimental flashover studies [
21,
22].
For negative polarity, the time to breakdown exhibited notable inconsistency across samples. Some oil-contaminated surfaces broke down more rapidly, while others showed significant scatter. In particular, PMMA displayed reductions in
TBD ranging from 7% to 61%, whereas PVC and Nylon showed no systematic polarity-dependent trend. This irregular behaviour aligns with the findings of [
9], where it was demonstrated that non-uniform surface conductivity can either accelerate or delay breakdown, depending on localised charge accumulation and the resulting distortions in the surface electric field.
The relatively large standard deviations, up to 12.7 µs for the oiled Nylon (cylindrical) configuration, indicate that the discharge initiation process is highly sensitive to small-scale variations in surface topography, oil-film thickness, and permittivity gradients. Such variations can locally enhance or suppress field intensity, altering streamer inception probability and propagation speed, consistent with observations in [
11].
Although all oil films were air-dried for 16 h to promote uniform coating, the remaining variability likely arises from a combination of residual surface non-uniformities, microscopic defects, and the stochastic nature of electron avalanche initiation. These factors collectively influence the local field enhancement at the oil–air interface, leading to randomised breakdown onset rather than behaviour governed by a single dominant parameter [
23,
24].
5. Conclusions & Recommendations
This study experimentally examined the influence of surface geometry, material type, surface condition, and polarity on lightning impulse flashover behaviour of polymeric insulators in a rod–plane configuration. Across all tests, geometry and polarity emerged as the dominant factors governing arc-path morphology, while material and surface condition primarily affected the breakdown voltage and time to breakdown.
Convex geometries favoured surface-adhering arcs, concave profiles promoted airborne propagation, and cylindrical profiles displayed mixed or transitional behaviour. Negative polarity generally produced higher breakdown voltages, consistent with the suppressed cathodic field near the electrode tip, while positive polarity led to longer breakdown delays, associated with the gradual formation of anodic streamers. The introduction of oil contamination modified surface conductivity and electric-field uniformity, resulting in material-dependent outcomes, an increase in VBD for PMMA, a decrease for PVC, and mixed effects for nylon. The large standard deviations observed, particularly under oil-coated and negative-polarity conditions, confirmed the stochastic nature of streamer inception, influenced by microscopic irregularities, oil-film non-uniformities, and random charge accumulation.
These findings emphasise that flashover on polymeric surfaces cannot be attributed to a single factor but arises from the complex coupling of geometry, polarity, and surface microphysics. Improved surface uniformity and tighter environmental control are essential to enhance experimental repeatability and model validation.
Future work should incorporate high-speed imaging and spectroscopic diagnostics to resolve the temporal evolution of streamers and quantify space-charge dynamics. Extending the study to additional dielectric materials, non-uniform contamination patterns, and varied humidity and pressure conditions would broaden applicability to outdoor insulation systems. Furthermore, numerical field simulations integrating measured surface properties could support predictive models for impulse flashover performance, guiding the optimised design of polymeric insulators for high-voltage applications.
Author Contributions
Conceptualization, S.M. and C.G.; methodology, A.M. and S.M.; formal analysis, A.M.; investigation, K.N. and A.M.; data curation, K.N. and A.M.; writing—original draft preparation, A.M., K.N. and C.G.; writing—review and editing, A.M. and C.G.; visualization, A.M.; supervision, S.M. and C.G.; project administration, S.M. and C.G.; funding acquisition, C.G. All authors have read and agreed to the published version of the manuscript.
Funding
This research received no external funding.
Institutional Review Board Statement
Not applicable.
Informed Consent Statement
Not applicable.
Data Availability Statement
The datasets referenced in this article are not readily available because the data is part of an ongoing study. Requests to access the datasets should be directed to the corresponding author.
Acknowledgments
During the preparation of this manuscript/study the author’s used ChatGPT 5.2 for the purposes of proof reading and grammar correction. The authors have reviewed and edited the output and take full responsibility for the content of this publication.
Conflicts of Interest
The authors declare no conflicts of interest.
Abbreviations
The following abbreviations are used in this manuscript:
| VBD | Voltage at Breakdown |
| TBD | Time to Breakdown |
| kV | Kilovolts |
| PMMA | Polymethyl Methacrylate |
| PVC | Polyvinyl Chloride |
| µs | Microseconds |
References
- Venkataraman, S.; Gorur, R.S. Prediction of Flashover Voltage of Non-Ceramic Insulators Under Contaminated Conditions. IEEE Trans. Dielectr. Electr. Insul. 2006, 13, 862–870. [Google Scholar] [CrossRef] [Scilit]
- Song, Z.; Yang, H.; Shen, W.; Ren, Y.; Li, Y.; Ma, J. Distribution of Partial Arc Propagation Path on Insulator and Its Discrimination Method. Energy Eng. 2023, 120, 2097–2113. [Google Scholar] [CrossRef] [Scilit]
- Kuffel, E.; Zaengl, W.S.; Kuffel, J. High Voltage Engineering: Fundamentals, 2nd ed.; Butterworth-Heinemann: Oxford, UK, 2000. [Google Scholar]
- Gomes, C.; Gao, L.; Cooray, V.; Roman, F. Breakdown characteristics of 500 mm and 250 mm long sparks along insulating surfaces. In Proceedings of the 11th International Symposium on High Voltage Engineering, London, UK, 23–27 August 1999. [Google Scholar]
- Gao, L.; Gomes, C.; Cooray, V.; Roman, F. Comparison of long sparks in air and over an insulator surface. In 11th International Symposium on High Voltage Engineering; IEE Conference Publication: London, UK, 1999; Volume 3, pp. 3.31.S5–3.34.S5. [Google Scholar]
- Gomes, C.; Cooray, V.; Rahman, M. Break- down Characteristics and Optically Visible Dis- charge Paths of Surface Flashover. In 2012 IEEE Conference on Sustainable Utilisation and Development in Engineering and Technology (STUDENT); IEEE: Kuala Lumpur, Malaysia, 2012; pp. 111–116. [Google Scholar]
- Rusli, H.B.; Gomes, C.; Kadir, M.Z. ARC-phobic and Other Characteristics of Surface Flashover. In Proceedings of the Progress in Electromagnetics Research Symposium (PIERS) 2012, Kuala Lumpur, Malaysia, 27–30 March 2012. [Google Scholar]
- Minhas, S.; Minhas, A.; Gomes, C.; Nyamupangedengu, C. Optically Visible Discharge Paths of Surface Flashover on Insulators. In Proceedings of the International Symposium on High Voltage Engineering (ISH 2025), Karuizawa, Japan, 24–29 August 2025. [Google Scholar]
- Ghayedi, M.; Shariatinasab, R.; Mirzaie, M. AC Flashover Dynamic Theoretical and Experimental Model under Fan-Shaped and Longitudinal Pollution on Silicone Rubber Insulator. IET Sci. Meas. Technol. 2021, 15, 719–729. [Google Scholar] [CrossRef] [Scilit]
- Pawlicki, L.T.; Rostocki, A.J.; Tefelski, D.B.; Siegoczyn’ski, R.M.; Ptasznik, S. Electric Properties of Sunflower Oil under Pressure. Int. J. Sci. Eng. Appl. Sci. (IJSEAS) 2022, 8, 214–227. [Google Scholar]
- Xie, Q.; Liang, S.; Fu, K.; Liu, L.; Huang, H.; Lü, F. Distribution of Polymer Surface Charge under DC Voltage and its Influence on Surface Flashover Characteristics. IEEE Trans. Dielectr. Electr. Insul. 2018, 25, 2157–2167. [Google Scholar] [CrossRef] [Scilit]
- IEC 60060-1:2025; High-Voltage Test Techniques—Part 1: General Terminology and Test Requirements. 4th ed. International Electrotechnical Commission (IEC): Geneva, Switzerland, 2025.
- IEC 60068-1:2013; Environmental Testing—Part 1: General and Guidance. 7th ed. International Electrotechnical Commission (IEC): Geneva, Switzerland, 2013.
- Meng, X.; Wang, L.; Mei, H.; Cao, B.; Bian, X. Streamer propagation along the insulator with the different curved profiles of the shed. Polymers 2021, 14, 897. [Google Scholar] [CrossRef] [Scilit] [PubMed]
- Wong, T.; Timoshkin, I.; MacGregor, S.; Given, M. Characteristics of impulse-driven surface flashover across polymers with different surface conditions. IEEE Trans. Plasma Sci. 2025, 53, 1571–1582. [Google Scholar] [CrossRef] [Scilit]
- Wong, T.; Timoshkin, I.; MacGregor, S.; Wilson, M.; Given, M. The Breakdown and Surface Characteristics of Polymer Interfaces Under HV Impulses. IEEE Trans. Dielectr. Electr. Insul. 2025, 32, 170–179. [Google Scholar] [CrossRef] [Scilit]
- Li, X.; Sun, A.; Teunissen, J. A computational study of negative surface discharges: Characteristics of surface streamers and surface charges. IEEE Trans. Dielectr. Electr. Insul. 2020, 27, 1178–1186. [Google Scholar] [CrossRef] [Scilit]
- Li, Z.; Liu, J.; Ohki, Y.; Chen, G.; Gao, H.; Li, S. Surface flashover in 50 years: Theoretical models and competing mechanisms. High Volt. 2023, 8, 853–877. [Google Scholar] [CrossRef] [Scilit]
- Jamaludin, F.A.; Chao, C.S. Effect Analysis of Pollutant Distribution on the Flashover Performance of Porcelain and Composite insulator using Finite Element Method. Sci. Technol. Asia 2024, 29, 82–90. [Google Scholar]
- Yao, L.; Weng, J.; Li, M.; Zhang, M. Experimental study on creeping flashover characteristics along dielectric surfaces in oil-filled transformer using electro-optic coupling method. IET Nanodielectr. 2024, 8, e70004. [Google Scholar] [CrossRef] [Scilit]
- Slama, M.E.A.; Beroual, A. Flashover discharges dynamic with continuous and discontinuous pollution layer under lightning impulse stress. Electr. Eng. 2021, 103, 2887–2895. [Google Scholar] [CrossRef] [Scilit]
- Zogning, C.; Lobry, J.; Moiny, F. Numerical simulation of corona discharge plasma affecting the surface behavior of polymer insulators. Energies 2023, 17, 4247. [Google Scholar] [CrossRef] [Scilit]
- Mahmoodi, J.; Mirzaie, M.; Shayegani-Akmal, A.A. Surface charge distribution analysis of polymeric insulator under AC and DC voltage based on numerical and experimental tests. Int. J. Electr. Power Energy Syst. 2019, 105, 283–296. [Google Scholar] [CrossRef] [Scilit]
- Hu, Q.; Li, Q.; Liu, Z.; Xue, N.; Ren, H.; Haddad, M. Surface flashover induced by metal contaminants adhered to tri-post epoxy insulators under superimposed direct and lightning impulse voltages. Polymers 2022, 14, 1374. [Google Scholar] [CrossRef] [Scilit] [PubMed]
| Disclaimer/Publisher’s Note: The statements, opinions and data contained in all publications are solely those of the individual author(s) and contributor(s) and not of MDPI and/or the editor(s). MDPI and/or the editor(s) disclaim responsibility for any injury to people or property resulting from any ideas, methods, instructions or products referred to in the content. |