


Abstract
In 3 kV DC systems, the pantograph–catenary interface and auxiliary converter unit (ACU) are among the critical high-voltage subsystems, where electrical transients and thermal overload conditions frequently lead to service disruptions. This paper presents a case study on the application of machine-learning-based predictive maintenance to a 3 kV DC electric train, with a specific focus on the pantograph and ACU. A 2-year period of operational data collected from a passenger rail fleet was analysed using a hybrid data sampling strategy to capture both operational conditions and events associated with failures. Logistic Regression (LR), and Random Forest (RF) were trained and evaluated using standard performance metrics. The RF model achieved superior predictive performance, with an accuracy of approximately 93%, a precision of 0.91, a recall of 0.88, and an F1-score of 0.89, outperforming the baseline across all metrics. The analyses demonstrated that anomalies in electrical arcing, line voltage, and ACU current and temperature frequently preceded recorded fault events, confirming that failures arise from subsystems interactions and that it is critical for such parameters to be monitored. The results demonstrate the technical feasibility and practical value of integrating machine learning into EMU maintenance practice, enabling earlier detection of degradation, more targeted interventions, and a transition towards condition-based maintenance.
1. Introduction
Electric multiple units (EMUs) operating in dense urban and commuter networks are particularly sensitive to maintenance performance, as failures in critical subsystems can propagate quickly into service delays, cancellations, and safety risks. This research is a case study of a Metrorail 3 kV DC EMU fleet, where traditional maintenance strategies implemented are reactive (corrective) and time-based preventive. While these strategies are easier to implement, they do not detect equipment failures before they occur, which is not ideal for some of the critical subsystems such as pantographs and auxiliary converter units (ACUs). As a result, faults occur unexpectedly in service, leading to service disruptions impacting passenger experience. However, predictive maintenance enabled by artificial intelligence (AI) and machine learning (ML) enables condition-based management of rail assets. By continuously analysing sensor data, ML models can detect changes in operating conditions and identify patterns that precede faults, allowing interventions to be optimally scheduled with clear intervention objectives. This study is pursued to demonstrate the potential of data-driven models specifically focusing on pantograph and converter systems of 3 kV DC EMUs.
This paper addresses this gap by training and evaluating a predictive maintenance framework for the pantograph and ACU of a specific fleet of EMUs using supervised machine learning. The study leverages operational data of a period between 2023 and 2024 collected from a South African Metrorail operator. Two ML models, Logistic Regression and Random Forest, are trained on the resulting dataset after systematic preprocessing, including handling missing data, normalisation, and class imbalance mitigation. The main objective of this paper is to demonstrate that PdM can be implemented on high-voltage equipment such as pantographs and ACUs.
1.1. Railway Maintenance Background
In the railway industry, the evolution and modernisation of maintenance strategies are vital and reflect the industry’s shift towards proactive solutions for improved operational efficiency, safety, and the reliability of assets [1]. In the field of rolling stock, the implementation of maintenance strategies, particularly those that integrate monitoring models, has evolved from being a best practice to an essential requirement [2]. This necessity arises from the complex interaction between environmental factors, mechanical components, and electronic systems, which collectively influence the safety and reliability of railway operations [3]. Ideally, a system is expected to function flawlessly throughout its designed lifespan before inevitably experiencing failure as a result of wear and tear. However, practical experience diverges from this ideal scenario, illustrating maintenance as a comprehensive suite of activities aimed not just at repairing or extending the life of a system but crucially at maintaining its performance to meet its designed functions throughout its operational life [4,5].
1.2. Predictive Maintenance for Electric Train High-Voltage Equipment
Predictive maintenance for high-voltage railway equipment has increasingly been adopted as a practical pathway for shifting maintenance practices from corrective or periodic/ time-based interventions toward condition-based decision-making [6]. This transition is particularly relevant for critical subsystems in 3 kV DC electric multiple units (EMUs), such as pantographs and auxiliary converter units (ACUs), where faults often develop progressively under dynamic operating conditions [7].
Within the pantograph–catenary interface, research has consistently shown that arcing activity, voltage dips, and variations in contact force provide measurable indicators of contact instability, wear, or mechanical misalignment [8,9]. Supervised learning models, including RF, have demonstrated strong performance in detecting fault conditions, particularly in datasets where failures are rare and class imbalance is significant.
2. Predictive Maintenance Implementation Approach
The method was designed to ensure that the application of AI-driven PdM to railways was addressed thoroughly by regarding the correlation between research objectives, data collection procedure, model development and evaluation methods. The research project is centered around applying ML algorithms to analyse data and forecast equipment malfunctions before they occur.
2.1. Data Collection
Sensor data used in this study was collected from the case study operator, from the pantograph and the auxiliary converter unit (ACU) of the EMU. The pantograph was monitored for pressure and vibration to assess its performance and contact stability. The ACU was monitored for current, temperature, and air flow to ensure stable support for non-propulsion systems.
The period of the data collected was two years in order to include seasonal patterns, operational fluctuations and different system states. As a result of the limited number of failure cases, extra synthetic failure data was generated to facilitate model learning of correct failure patterns. A hybrid data sampling strategy was employed, combining periodic sampling at fixed 15 min intervals with event-based sampling.
2.2. Machine Learning Model Development
The core analytical technique used for this investigation was machine learning, which can be framed as a five-step lifecycle—data collection, data modelling, data preparation, model building and training, and model deployment.
Operational data was pre-processed, structured into training and validation sets, and then fed into machine learning frameworks, Logistic Regression and Random Forest, which were incrementally trained and tested to ensure robustness, accuracy, and the ability to generalise across unseen conditions. The data was split into training and validation components, with 80% used in training the model and 20% in validating it. This model was not validated in any real-life environment nor redeployed to the live train monitoring and event logging platform where the original data was collected.
3. A Case Study: 3 kV DC Pantograph and ACU
This section provides a summary of the observation from analysis, simulation and modelling activities that were performed to develop the intelligent PdM model for using the data collected. The paper investigates the ability to predict failures of components relative to operational and environmental conditions of a number of key sub-systems such as the pantograph and auxiliary converter unit (ACU).
3.1. Pantograph
The pantograph serves as a vital electromechanical interface on any electric multiple unit (EMU), ensuring continuous electrical contact with the overhead catenary system and thereby facilitating reliable power transmission to both propulsion and auxiliary systems. Electrical arcing, a common phenomenon during dynamic conditions such as acceleration, braking, or transitions between catenary subsections, manifests as transient voltage drops and contributes to progressive wear of pantograph and contact wire components. In the case of this 3 kV DC EMU system, the arcing frequency is formulated to quantify the rate at which the pantograph experiences electrical arcing.
This formulation of the arcing frequency (f_arc) is mathematically expressed as the number of arc events (N_arc) detected within a specified time period (T), as shown below:
where N_arc is the number of detected real events defined in terms of threshold voltage dips, current derivatives and a signal processing algorithm.
3.1.1. Descriptive Statistics
Table 1 is a compilation of statistical information related to essential operational variables for the pantograph. The measured standard deviation of ±50 A reveals a nearly constant current budget among different operational modes. In particular, the low current levels around 74 A are probably due to idle/coast conditions, and the peaks above 530 A suggest high traction loads during acceleration phases or when traversing steep gradients. Such transient peak currents may also be associated with regenerative braking events, reflecting the bidirectional energy flow characteristic of modern EMU power systems. These observations therefore establish a criterion for threshold-based anomaly detection, permitting the integration of probabilistic forecasting techniques to prevent major breakdowns.
Table 1.
Descriptive statistics—pantograph/Line.
3.1.2. Pantograph Trends from Observed Data
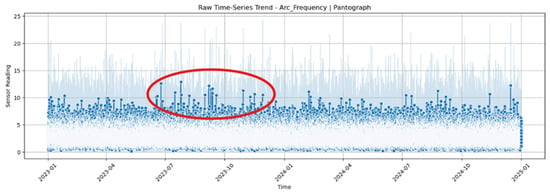
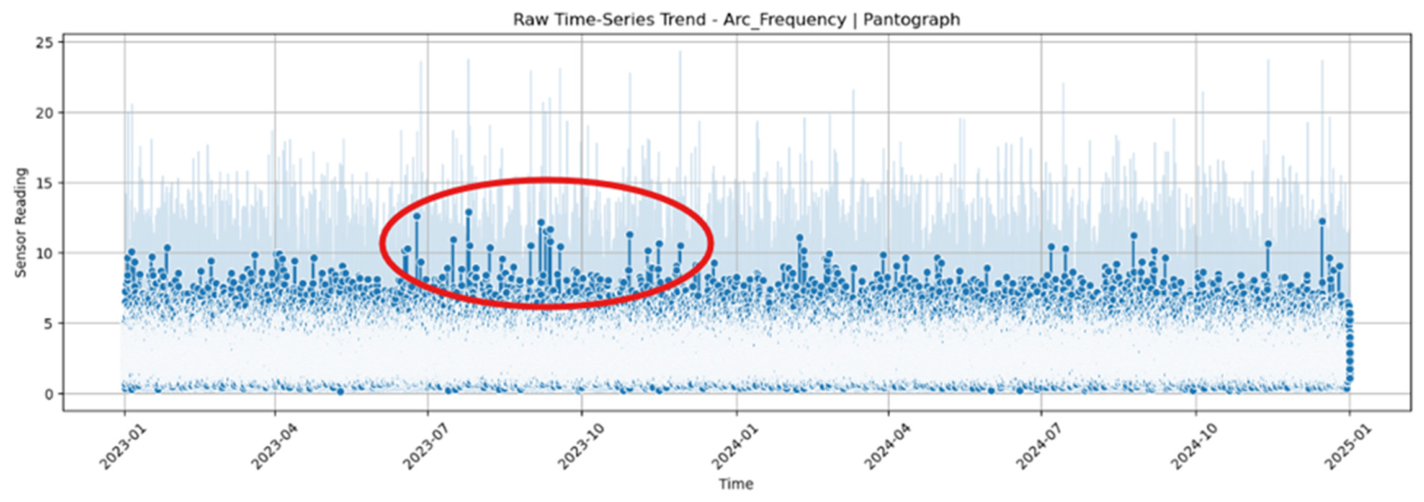
Figure 1 below shows the frequency of overhead electrical arcs on a particular pantograph on Train_1 over the period of two (2) years.
Figure 1.
Raw time series (2023–2024) for pantograph electrical arcing occurrences.
When line voltage measurements were observed, they indicated to be clustering around the nominal supply of 3000 V DC, with occasional spikes above 3200 V and dips below 2800 V. These voltage spikes and dips were often synchronised with spikes in arc frequency.
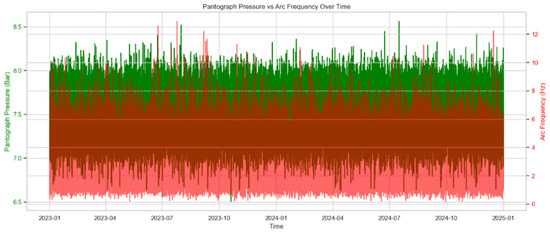
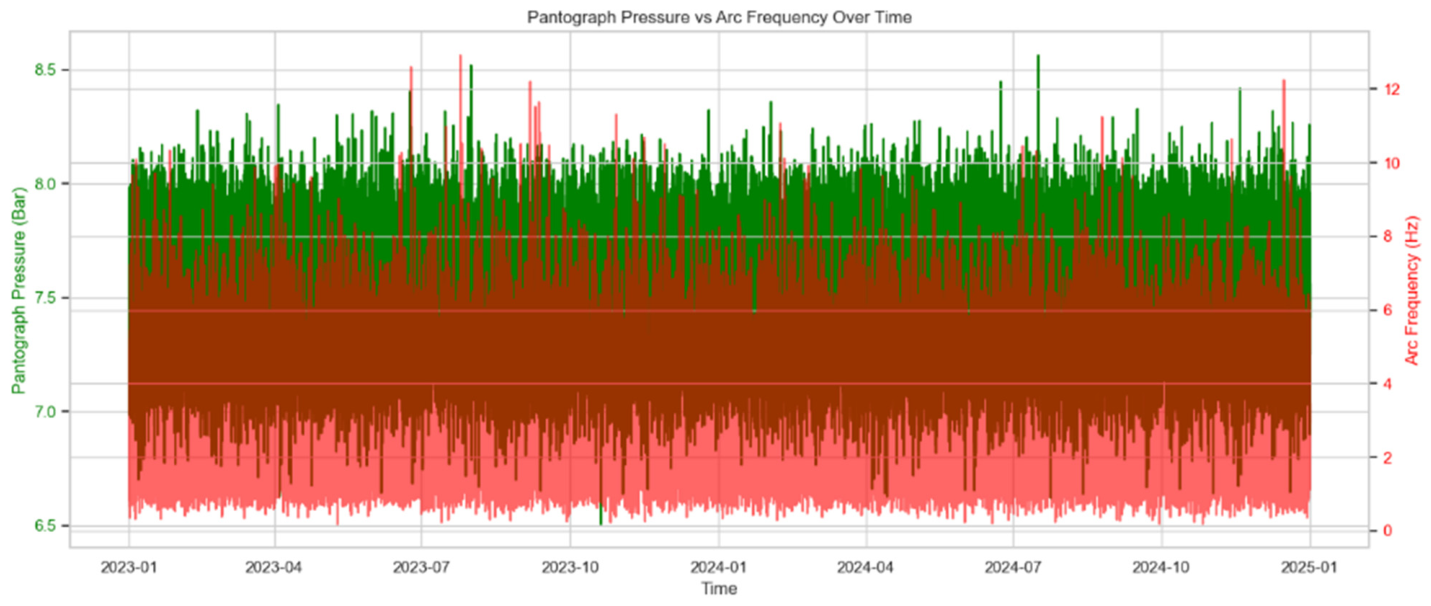
The correlation between pantograph pressure and electrical arcing is also observed in Figure 2 below. The majority of the pantograph pressure measurements are within the normal operating range of 7.0 to 8.5 bar, indicating consistent performance under normal conditions. However, significant increases in arcing frequency, occasionally exceeding 10 Hz, frequently align with periods of reduced pantograph pressure.
Figure 2.
Pantograph pneumatic pressure vs electrical arcing.
3.2. Auxiliary Converter Unit Pre-Analysis
The auxiliary converter unit (ACU) in electric trains is essential for supplying medium (400 VAC) and low (110 VDC) voltages to the auxiliary subsystems. The ACU ensures the seamless operation of these subsystems, which are vital for passenger comfort and safety. To enhance reliability, the ACU is equipped with sensors to monitor key parameters, air flow, current, and temperature.
Descriptive Statistics
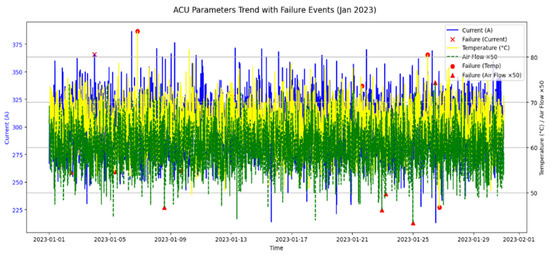
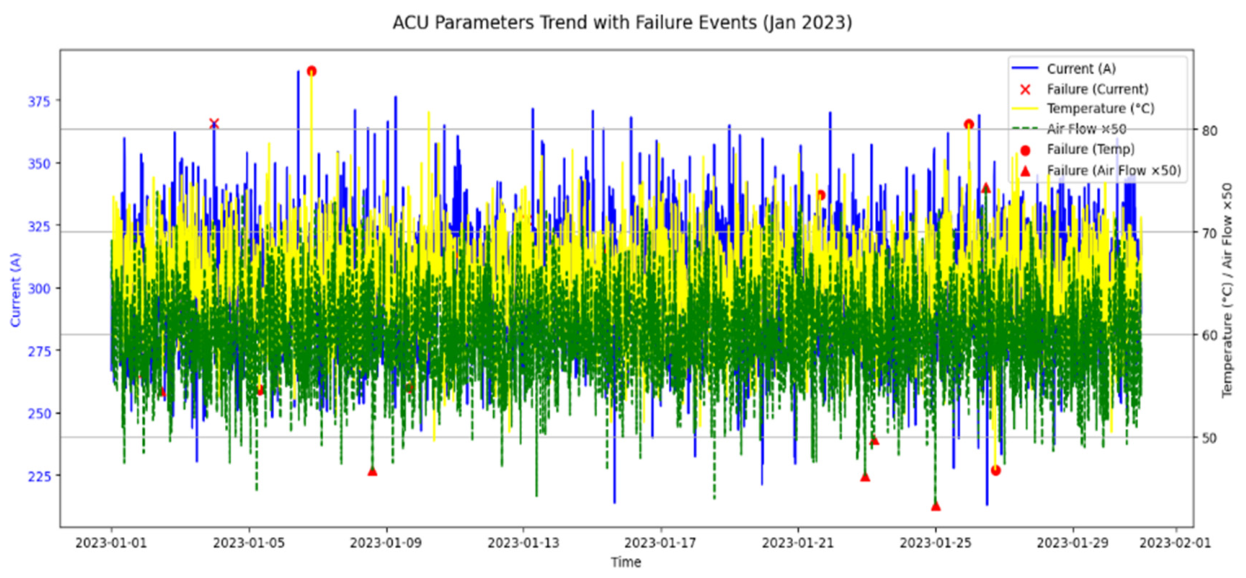
Table 2 shows the ACU’s operational characteristics through descriptive statistics. Air flow measurements indicate a generally stable cooling performance. While temperature readings suggest moderate thermal variability. It is observed that spikes in current and temperature, particularly during also peak conditions or periods of reduced air flow, suggest potential stress points, as shown in Figure 3. These patterns emphasise the importance of integrated monitoring to identify anomalies and inform maintenance strategies, ensuring reliability and preventing failure events in service. Furthermore, failures in the auxiliary converter unit (ACU) seem not to predominantly occur at the extreme limits of the measured parameters but are more commonly observed during typical operational variations.
Table 2.
Descriptive statistics—ACU.
Figure 3.
A one-month view for ACU analysis with fault indicators.
The pattern indicates that failures may stem not only from extreme values but also from intricate interactions among multiple variables or fleeting anomalies that are not immediately evident when examining individual parameter extremes. These findings highlight the critical need for advanced, multi-sensor data analytics and integrated cross-parameter monitoring to enhance predictive maintenance and early fault detection.
3.3. Model Training and Dataset Partitioning
For data pre-processing before the actual model training, several steps of data processing were performed to optimise the integrity and comparability of all variables. This data preparation process ensured that the final dataset was structured into machine learning dataframes, which lead to the training of accurate and explainable predictive models for railway maintenance applications (See Table 3).
Table 3.
Data partitioning.
3.4. Model Development and Evaluation
3.4.1. Logic Regression Predictive Model
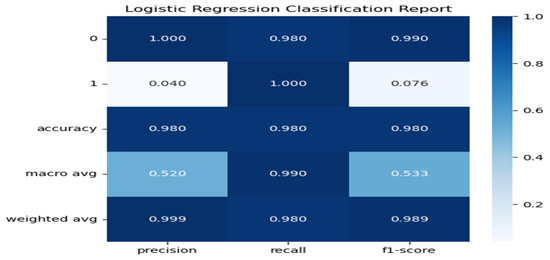
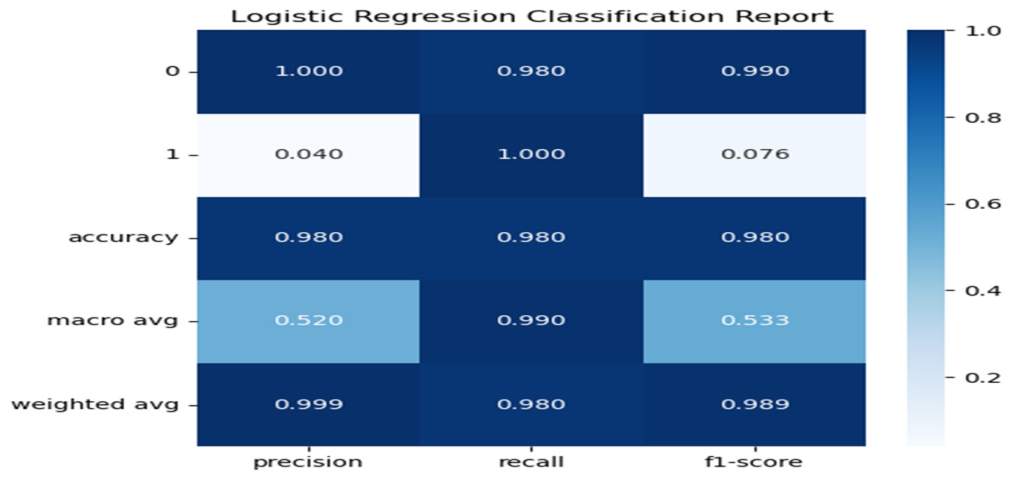
Figure 4 shows the classification report of the Logistic Regression predictive model. The report highlighted high performance for class 0, which was the class allocated to operational data, with a perfect precision of 1.000, high recall (0.980), and an F1-score of 0.990. However, a significant weakness was observed in detecting class 1, which was allocated to represent fault events. This class recorded a precision of only 0.040 with a considerably low F1-score of 0.076, though the recall was good, which indicated that every actual failure was correctly classified as such.
Figure 4.
Logistic Regression classification report.
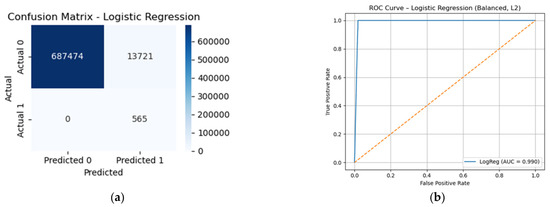
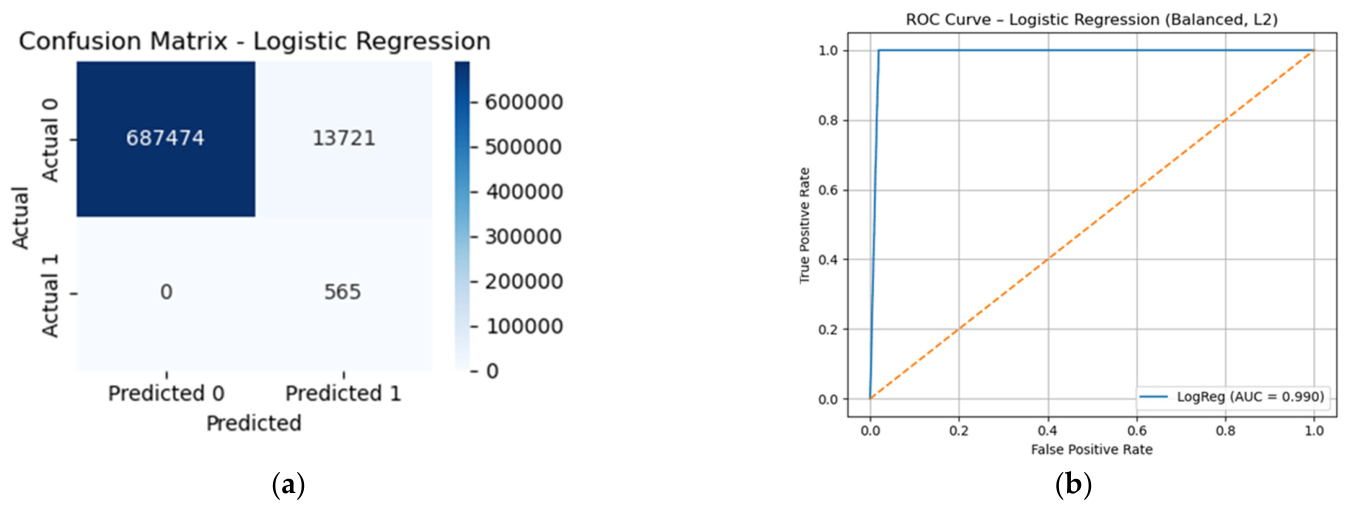
Figure 5a below shows the confusion matrix of the Logistic Regression, which confirmed that while almost all operational events are correctly classified, a significant number (13,721) of failures are incorrectly detected as fault events, though all actual failures are detected, with no actual fault event incorrectly classified. The results demonstrated a high sensitivity (recall) for actual faults but with a higher rate of falsely reporting a fault. The ROC curve in Figure 5b further illustrates the overall discriminative ability of the model, at an AUC of 0.990, which indicates that the model was highly capable of distinguishing failure versus non-failure events under the chosen threshold.
Figure 5.
LR performance: (a) confusion metric and (b) ROC-AUC.
The report indicated that the model, in the framework in which it was implemented, achieved the objective of high failure recall, which is necessary for predictive maintenance, ensuring that the actual fault events are correctly detected. However, it was quite a significant shortfall that the model showed low precision and over-predictive tendencies for the failure events, which led to a high number of failure alerts.
3.4.2. Random Forest Classifier Predictive Model
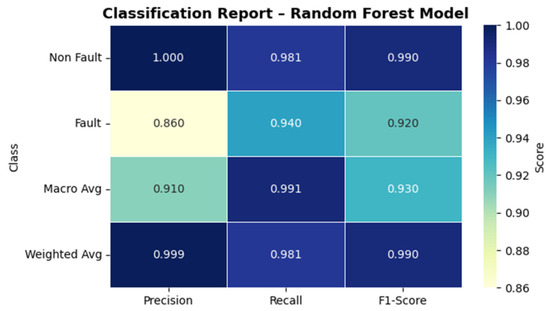
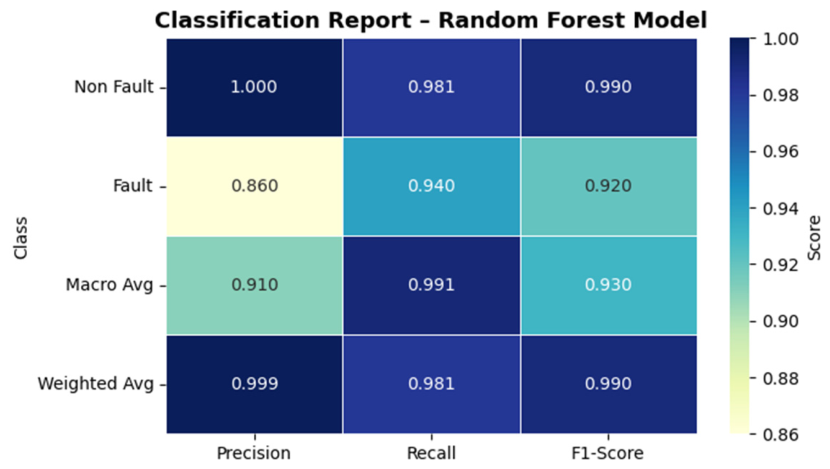
The RF algorithm was configured with an initial set of 400 decision trees, a maximum depth of 14, and balanced class weights to counter the inherent class imbalance observed between failure events and operational events. The model was trained using five-fold cross-validation, which ensured statistical robustness and reduced overfitting tendencies by testing the algorithm’s generalisation capacity across multiple subsets of the data. The model achieved an overall classification accuracy of approximately 95 percent, with a precision of 0.86 and recall of 0.94, resulting in an F1-score of 0.92, as illustrated in Figure 6.
Figure 6.
RF classification report.
For RF, an ROC curve, with an ROC-AUC value of 0.991, which further confirmed the model’s discriminative power, was observed, with the area under the curve approaching unity, illustrating reliable performance across a range of decision thresholds. These metrics collectively demonstrate Random Forest’s ability to discriminate between normal operating states and fault events.
The RF confusion matrix analysis revealed a strong diagonal dominance, with 687,912 actual non-faults (operational events) and 8797 actual faults correctly identified, while 132 non-failure events and 27 faults were incorrectly classified. This indicated high predictive accuracy for both failure and non-failure classes, with relatively insignificant incorrect classification. This pattern validates the effectiveness of the class weight balancing strategy, which compensated for the scarcity of failure events within the dataset.
3.4.3. Comparative Evaluation of the Models
The comparative results, as presented in Table 4, consistently demonstrate that Random Forest outperforms LR across all quantitative performance metrics. The ensemble design of RF allows for recognition of complex non-linear patterns, integrating electrical, thermal, and mechanical parameters. Consequently, the RF model was formally adopted as the preferred algorithm for subsequent predictive maintenance deployment considerations.
Table 4.
Comparative evaluation of the models.
4. Simulation Results Discussion
The LR baseline provided an interpretable reference but demonstrated limited capability in predicting the non-linear interactions inherent in high-voltage railway systems. The RF classifier achieved superior performance, with an accuracy of 0.93, a precision of 0.91, a recall of 0.88, and an F1-score of 0.89. These results confirm the suitability of ensemble learning for predictive maintenance in environments characterised by noise, transient disturbances, and complex parameters.
The findings demonstrate that predictive maintenance for high-voltage railway equipment can be effectively implemented using machine learning when multi-parameter data is available. The strong relationship between pantograph electrical arcing and line voltage stability confirms that pantograph monitoring provides direct insight into traction power quality and current collection health.
5. Conclusions
This paper presents a machine-learning-based predictive maintenance framework for high-voltage railway equipment, focusing on pantograph and auxiliary converter unit behaviour in an EMU fleet operating under a 3 kV DC traction supply. RF model achieved superior prediction performance and is recommended, in comparison to LR, as a suitable modelling approach for practical predictive maintenance implementation in DC railway environments.
Author Contributions
Conceptualisation, M.M. and E.M.; methodology, M.M.; software, M.M. and M.S.; validation, M.M.; formal analysis, M.M.; investigation, M.M.; resources, CUT and PRASA; data processing and manipulation, M.M.; writing—original draft preparation, M.M.; paper review and editing, M.M. and E.M.; supervision, E.M. and M.S. All authors have read and agreed to the published version of the manuscript.
Funding
This research received no external funding.
Institutional Review Board Statement
Not applicable.
Informed Consent Statement
Not applicable.
Data Availability Statement
Research data is available upon request, subject to approval by the data provider. The original consent from the operator was for the data to be used only for interpretation and processing for the purposes of this research.
Conflicts of Interest
The authors declare no conflicts of interest.
Abbreviations
| ACU | Auxiliary Converter Unit |
| AI | Artificial Intelligence |
| CM | Corrective Maintenance |
| EMU | Electrical Multiple Unit |
| ET | Electric Train |
| LR | Logistic Regression |
| ML | Machine Learning |
| PdM | Predictive Maintenance |
| PM | Preventive Maintenance |
| PRASA | Passenger Rail Agency |
| RF | Random Forest |
| TBM | Time-Based Maintenance |
References
- Al-Douri, Y.K.; Tretten, P.; Karim, R. Improvement of railway performance: A study of Swedish railway infrastructure. J. Mod. Transp. 2016, 24, 22–37. [Google Scholar] [CrossRef] [Scilit]
- Nappi, E.R. Integrated Maintenance: Analysis and perspective of innovation in railway sector. arXiv 2014, arXiv:1404.7560. [Google Scholar] [CrossRef] [Scilit]
- Joanni, A.; Mahboob, Q.; Zio, E. Advanced Methods for RAM Analysis and Decision Making. In Handbook of RAMS in Railway Systems; CRC Press: Boca Raton, FL, USA, 2018; pp. 39–62. [Google Scholar] [CrossRef] [Scilit]
- Ciocoiu, L.; Siemieniuch, C.E.; Hubbard, E.-M. From preventative to predictive maintenance: The organisational challenge. Proc. Inst. Mech. Eng. Part F J. Rail Rapid Transit 2017, 231, 1174–1185. [Google Scholar] [CrossRef] [Scilit]
- Malak, S.; Valeria, B.; Faicel, H.; Hichem, S. Predictive maintenance planning for railway systems. In 2023 7th IEEE Congress on Information Science and Technology (CiSt); IEEE: New York, NY, USA, 2023; pp. 553–558. [Google Scholar] [CrossRef] [Scilit]
- Ferrari, D.A.; Giorgio, D.; Spagnolo, O.; Millitar, G.M. Predictive maintenance for Railways: A Case Study. Master’s Thesis, University of Bologna, Bologna, Italy, 2023. Available online: https://iris.cnr.it/retrieve/a8d976fb-fde6-4d5a-b2bc-1415280dd091/TesiMillitari_versione1.pdf (accessed on 19 October 2025).
- Fernandes, M.; Canito, A.; Corchado, J.M.; Marreiros, G. Fault Detection Mechanism of a Predictive Maintenance System Based on Autoregressive Integrated Moving Average Models. In Distributed Computing and Artificial Intelligence, 16th International Conference; Springer: Cham, Switzerland, 2019; pp. 171–180. [Google Scholar] [CrossRef] [Scilit]
- Mariscotti, A.; Giordano, D.; Femine, A.D.; Gallo, D.; Signorino, D. How Pantograph Electric Arcs affect Energy Efficiency in DC Railway Vehicles. In 2020 IEEE Vehicle Power and Propulsion Conference (VPPC); IEEE: New York, NY, USA, 2020; pp. 1–5. [Google Scholar] [CrossRef] [Scilit]
- Yang, G.; Kong, G.; Shen, X. Arc recognition for pantograph-catenery system of railway using current. Measurement 2025, 251, 117304. [Google Scholar] [CrossRef] [Scilit]

Disclaimer/Publisher’s Note: The statements, opinions and data contained in all publications are solely those of the individual author(s) and contributor(s) and not of MDPI and/or the editor(s). MDPI and/or the editor(s) disclaim responsibility for any injury to people or property resulting from any ideas, methods, instructions or products referred to in the content. |
© 2026 by the authors. Licensee MDPI, Basel, Switzerland. This article is an open access article distributed under the terms and conditions of the Creative Commons Attribution (CC BY) license.