


Abstract
The wind-induced bias of catching-type rain gauges is quantified using Computational Fluid Dynamics with embedded particle tracking. The performance of six common commercial gauges having different outer geometries is compared by calculating the Overall Catch Ratio and the Overall Collection Efficiency. Results can be exploited to minimize the impact of wind-induced bias on measurement accuracy. This work provides the basic information needed to apply adjustments to the measured data showing that the instruments with inverted conical shapes have less impact on the raindrop trajectories, while for cylindrical and chimney-shaped gauges the shape of the collector’s rim plays a relevant role.
1. Introduction
In situ atmospheric precipitation measurements are the essential source of information about the precipitation process, its spatiotemporal variability, and observed frequency. The accuracy of these measurements plays a crucial role in the modeling of fluvial and pluvial flooding that affects urban contexts. Indeed, when rain gauge measurements are not corrected against the instrumental and environmental biases the associated underestimation propagates throughout the modeling chain. The instrumental bias can be corrected after appropriate laboratory calibration, following the European Standard EN 17277:2019, while the wind-induced bias can be minimized by applying adjustment curves as a function of the wind speed and rainfall rate.
The first assessment of the aerodynamic effect in precipitation measurements due to wind is generally attributed to Jevons [1]. This measurement bias is also known as the “exposure problem” because it arises from the bluff-body aerodynamic behavior of the instrument body when exposed to the wind. The obstruction produced by the instrument body against the wind generates significant airflow acceleration and vertical velocity components able to deviate the approaching hydrometeors from their undisturbed trajectory, away from the instrument collector. The pattern and numerosity of the deviated trajectories depend on the instrument geometry; therefore, instrument-dependent adjustment curves are required.
According to Sevruk [2], the wind-induced undercatch for liquid precipitation measurements can be estimated within 2–10%. Adjustment functions proposed in the literature are mostly based on experimental campaigns in the field (see, e.g., [3,4]) or numerical simulations (see, e.g., [5]) validated in the wind tunnel [6].
The numerical approach, based on Computational Fluid Dynamics (CFD) simulations and a Lagrangian particle tracking (LPT) model, allows us to investigate a larger number of combinations of gauge geometry, wind speed, and precipitation type (in terms of drop size distribution and intensity). The CFD results provide the airflow patterns (acceleration, velocity components, and turbulence intensity) produced by the aerodynamic response of the gauge geometry, while the LPT model reproduces the trajectory of each hydrometeor when approaching the gauge collector, considering the one-way fluid-particle interaction.
In the present work we summarize the work of [5] where the performances, in windy conditions, of six different commercially available precipitation measurement instruments with shapes that are representative of the most common geometries available in the field are compared. Quantification of the wind-induced bias is provided for five unshielded and one shielded gauge geometries in the form of the resulting Overall Catch Ratio (OCR) and Overall Collection Efficiency (OCE). The OCE can be calculated starting from the OCR after assuming a selected drop size distribution (DSD); indeed, the OCR is independent of the rainfall regime and is calculated assuming a uniform distribution of wind speed, meaning that any wind speed is equally likely to occur.
2. Materials and Methods
The investigated rain gauges are the Geonor T-200B (named CH-GEO) and the OTT Pluvio2 (named CH-OTT) chimney-shaped gauges, the CAE PG10 quasi-cylindrical gauge (named CY-CAE), the Lambrecht rain[e]H3 cylindrical gauge (named CY-LAM), the EML SBS500 inverted conical gauge (named IC-EML), and the AES Nipher shield containing a totalizer gauge (named SH-AES).
CFD simulations are conducted using a time-independent scheme, based on the numerical solution of the Unsteady Reynold-Averaged Navier–Stokes (URANS) equations. The model provides information about the flow after a steady state condition is reached and in the hypothesis of stationary turbulence characteristics, solving the average part of the flow variables while modeling the turbulence-induced fluctuations. The k-ω shear stress transport turbulence model is implemented, with k the turbulent kinetic energy and ω the specific turbulent dissipation rate. The OpenFOAM software v2012 is used [7,8]. The computational domain is 5 m long, 3 m wide, and 2.5 m high. The mesh has a maximum cell size of 0.125 m and is progressively refined up to 2.5 mm near the instrument walls. Undisturbed wind speeds (U) equal to 2, 5, 10, 15, and 20 m s−1 are simulated. Additional details on the model setup are reported in [5].
Raindrop trajectories are modeled using an LPT algorithm validated in [6], embedded in OpenFOAM. Multiple independent particles are released in the airflow field, assuming a spherical shape, with diameters (D) equal to 0.25, 0.5, 0.75 mm and from 1 to 8 mm at 1 mm increments. For each simulation, the catch ratio (CR) is calculated. CR is defined as the ratio between the number of drops that are collected by the instrument under the effect of wind and the number of drops that would have been collected if the instrument were transparent to the wind. The CR is independent of the local climatic characteristics and is therefore representative of the aerodynamic behavior of the specific instrument geometry alone. As a representative variable for the behavior of a generic instrument, the Overall Catch Ratio (OCR) is introduced and calculated as the average CR obtained under a uniform wind climatology, as:
The OCR is obtained by taking the integral of the monodisperse CR over a range of wind speeds that is reasonably expected in natural conditions, assuming the maximum value (Umax) equal to 10 m s−1. This formulation assumes that every wind speed is equally likely to occur. The assumption is proposed here to highlight the overall performance of each instrument with the objective of comparing the various rain gauges investigated.
To introduce the effect of rainfall characteristics in terms of DSD and rainfall intensity (RI), the Overall Collection Efficiency (OCE) is calculated as:
where ρ is the density of water (kg m−3), V(D) the drop volume (m3), N(D) the numerosity (m−3 mm−1) of the drops having a diameter equal to D in the assumed DSD and the OCEmax is obtained for an OCR equal to unity for each particle size, U and RI.
3. Results and Discussion
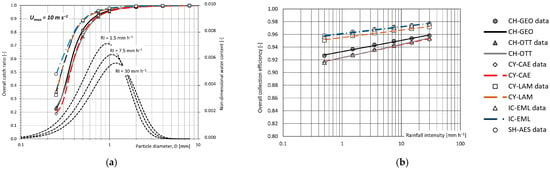
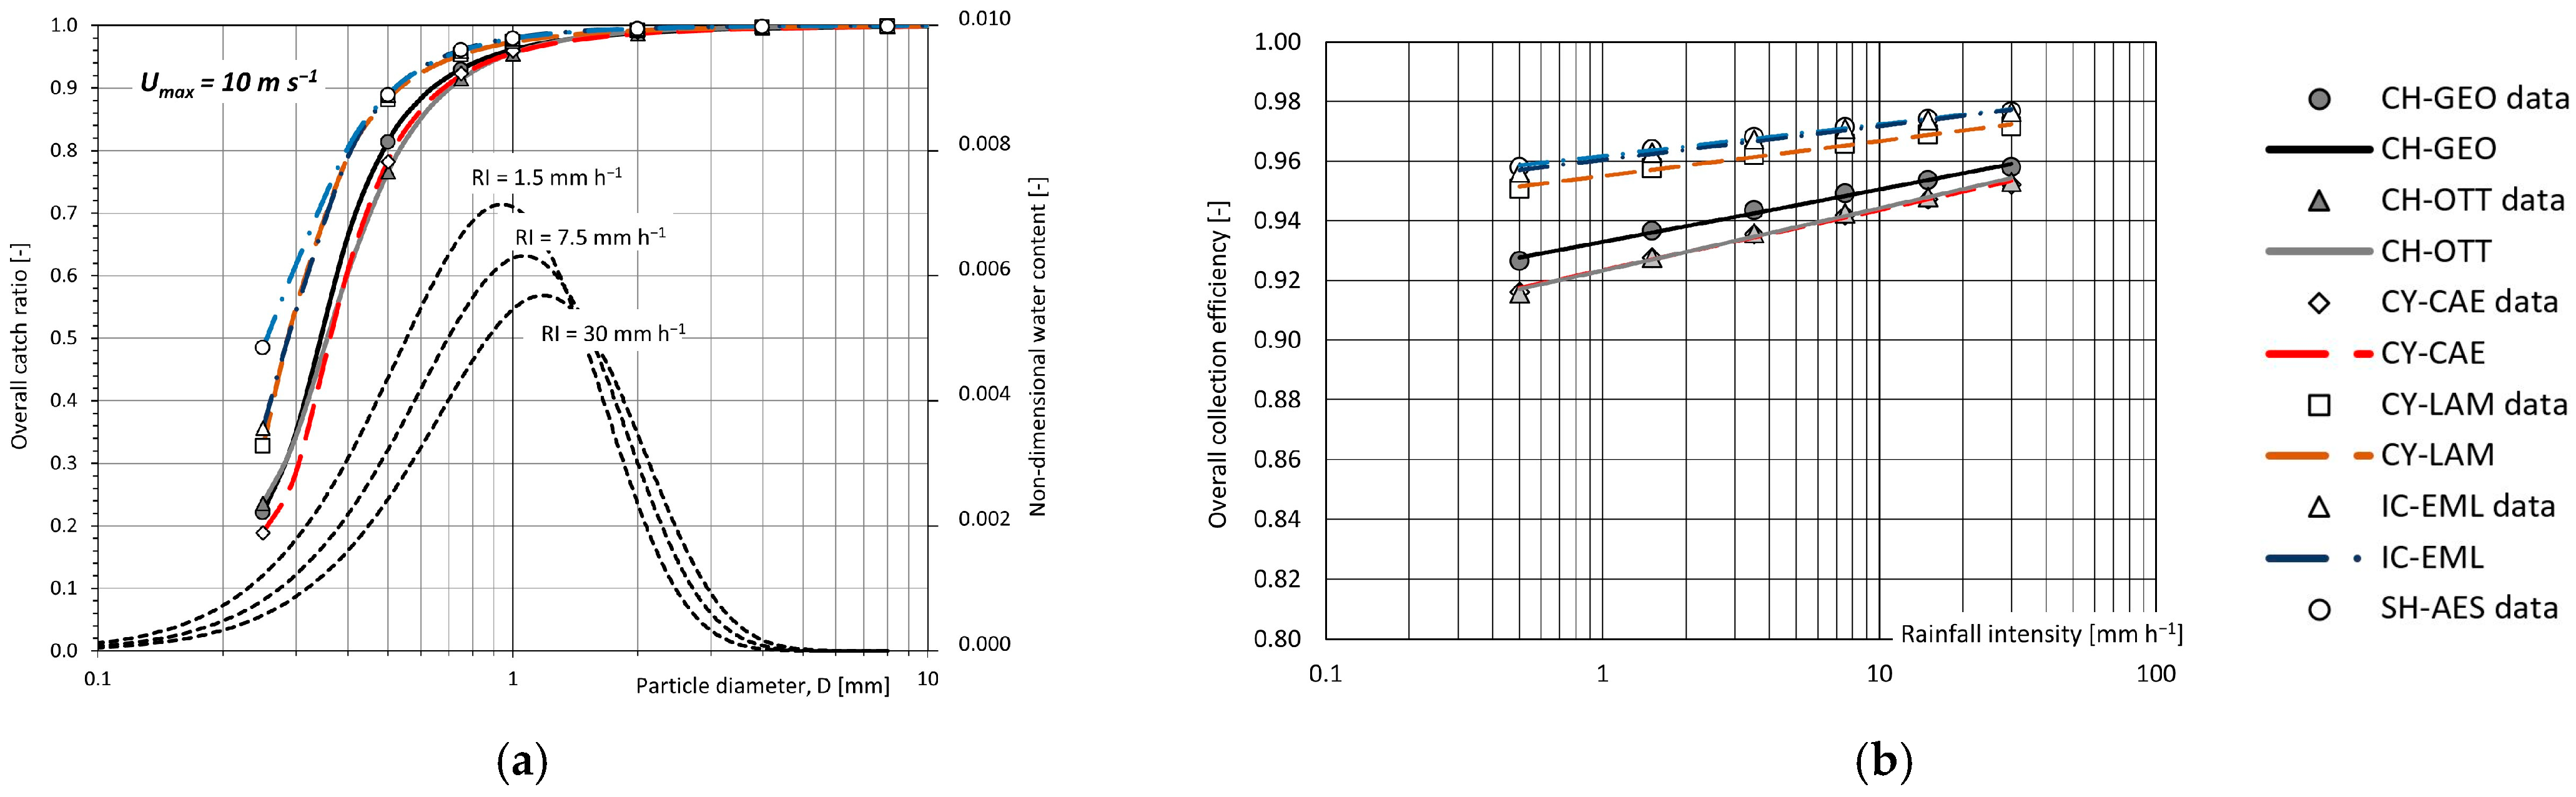
Results are graphically shown in Figure 1 as a comparison of the OCR and OCE for all the instruments investigated. Markers indicate the numerical results while lines indicate the associated best-fit curves. An example of the resulting OCR as a function of the drop size is shown and compared for all the instruments investigated in panel (a). To help interpret the impact of the instrument performance on precipitation measurements, the non-dimensional water content (NWC) of precipitation events after assuming a realistic DSD [9] having different intensity between 1.5 and 30 mm h−1 is also reported. The NWC indicates the volumetric contribution of any given drop size to the total rain volume. All instruments show a reduced OCR at diameter D < 1 mm with the CY-LAM, IC-EML, and SH-AES with better performance. The OCEs confirm this behavior by grouping the six gauges into two classes. The best performing gauges show performance very close to the shielded one (the SH-AES) while the curve associated with the quasi-cylindrical gauge (the CY-CAE) is overlapped with those of the CH-OTT meaning that the shape or the collector rim plays a non-negligible role.
Figure 1.
(a) OCR of the investigated instruments as a function of the drop diameter and (b) OCE of the investigated instruments as a function of the rainfall intensity calculated under the hypothesis of wind climatology with uniform distribution and a maximum wind speed of 10 m s−1. The non-dimensional water content is also reported in panel (a) for three different RI values. (Source [5]). Blue dash line: SH-AES.
4. Conclusions
This work demonstrates that catching-type instruments perform quite differently in windy conditions, depending on their outer geometry. The instruments having less impact on the raindrop trajectories are the shielded one (the SH-AES) and the IC-EML. The inverted conical shape used in both cases is largely the most effective in reducing the bluff-body aerodynamic behavior. Among cylindrical gauges, the CY-LAM is the best performing, though slightly less efficient than the inverted conical ones. For the remaining gauge geometries, a relevant role is ascribable to the shape of the collector’s rim.
Results can be exploited by operational users to select the most suitable outer geometry for instruments to be installed at sites with frequent wind. This would help managers of hydro-meteorological monitoring networks to minimize the impact of wind-induced bias on the measurement accuracy and therefore improve the overall quality of the collected precipitation data sets. This work provides the basic information needed to apply adjustments to the measured data. Finally, results can help manufacturers of precipitation measuring instruments design aerodynamically efficient solutions.
Author Contributions
Conceptualization, A.C., E.C. and L.G.L.; methodology, A.C., EC. and L.G.L.; software, E.C.; formal analysis, A.C.; investigation, A.C., E.C. and L.G.L.; data curation, E.C.; writing—original draft preparation, A.C.; writing—review and editing, A.C., E.C. and L.G.L.; visualization, A.C., E.C. and L.G.L.; supervision, L.G.L. All authors have read and agreed to the published version of the manuscript.
Funding
This research received no external funding.
Data Availability Statement
Relevant data are available at https://doi.org/10.5281/zenodo.10033616.
Conflicts of Interest
The authors declare no conflicts of interest.
References
- Jevons, W.S. On the deficiency of rain in an elevated rain-gauge, as caused by wind. Lond. Edinb. Dublin Philos. Mag. J. Sci. 1861, 21, 421–433. [Google Scholar] [CrossRef] [Scilit]
- Sevruk, B. Methods of Correction for Systematic Error in Point Precipitation Measurement for Operational Use; Operational Hydrology Report No. 21; World Meteorological Organization: Geneva, Switzerland, 1982; p. 106. Available online: https://library.wmo.int/idurl/4/33639 (accessed on 24 April 2026).
- Wolff, M.A.; Isaksen, K.; Petersen-Øverleir, A.; Ødemark, K.; Reitan, T.; Brækkan, R. Derivation of a new continuous adjustment function for correcting wind-induced loss of solid precipitation: Results of a Norwegian field study. Hydrol. Earth Syst. Sci. 2015, 19, 951–967. [Google Scholar] [CrossRef] [Scilit]
- Kochendorfer, J.; Rasmussen, R.; Wolff, M.; Baker, B.; Hall, M.E.; Meyers, T.; Landolt, S.; Jachcik, A.; Isaksen, K.; Brækkan, R.; et al. The quantification and correction of wind-induced precipitation measurement errors. Hydrol. Earth Syst. Sci. 2017, 21, 1973–1989. [Google Scholar] [CrossRef] [Scilit]
- Cauteruccio, A.; Chinchella, E.; Lanza, L.G. The overall collection efficiency of catching type precipitation gauges in windy conditions. Water Resour. Res. 2024, 60, e2023WR035098. [Google Scholar] [CrossRef] [Scilit]
- Cauteruccio, A.; Brambilla, E.; Stagnaro, M.; Lanza, L.G.; Rocchi, D. Wind tunnel validation of a particle tracking model to evaluate the wind-induced bias of precipitation measurements. Water Resour. Res. 2021, 57, e2020WR028766. [Google Scholar] [CrossRef] [Scilit]
- Jasak, H. OpenFOAM: Open source CFD in research and industry. Int. J. Nav. Archit. Ocean Eng. 2009, 1, 89–94. [Google Scholar] [CrossRef] [Scilit]
- OpenFoam. OpenCFD Release OpenFOAM® v2012 (20 12). 2020. Available online: https://www.openfoam.com/news/main-news/openfoam-v20-12 (accessed on 24 April 2026).
- Marshall, J.S.; Palmer, W.M. The distribution of raindrops with size. J. Meteorol. 1948, 5, 165–166. [Google Scholar] [CrossRef] [Scilit]
Disclaimer/Publisher’s Note: The statements, opinions and data contained in all publications are solely those of the individual author(s) and contributor(s) and not of MDPI and/or the editor(s). MDPI and/or the editor(s) disclaim responsibility for any injury to people or property resulting from any ideas, methods, instructions or products referred to in the content. |
© 2026 by the authors. Licensee MDPI, Basel, Switzerland. This article is an open access article distributed under the terms and conditions of the Creative Commons Attribution (CC BY) license.