


Abstract
Reliable climate data are essential for sustainable water management systems, especially under the challenges posed by climate change. In data-scarce regions, reanalysis products such as ERA5 can support flood and drought risk assessment and water security analysis. However, raw reanalysis precipitation is systematically biased relative to local observations and can distort hydrological indicators; bias correction is therefore needed. This study tests five bias correction techniques (Linear Scaling, Empirical Quantile Mapping, Quantile Mapping Spline Bias Correction, Mean Bias Subtraction, and Simple Linear Regression) on ERA5 precipitation data for Georgia, using classical and sliding window approaches at daily and monthly scales. Results show the importance of selecting the most appropriate method according to data availability and study objectives. The sliding window approach improved performance, especially at the daily scale, and distribution-based methods proved most effective in data-scarce regions.
1. Introduction
Access to reliable climate data is essential for evaluating how cities may be exposed to flood risks, assessing water security, and supporting the definition of adaptation strategies to climate change impacts. However, observational datasets are often incomplete, fragmented, or unavailable, especially in developing countries. In such contexts, climate reanalysis products provide a consistent and homogeneous source of information, combining model outputs with observational data to reconstruct past climates, identify changing precipitation patterns, and assess the risks of extreme events such as floods and droughts. Recent studies have demonstrated the utility of ERA5-Land data, a product developed by ECMWF, in evaluating water security in cities through metrics such as the Standardized Precipitation Index (SPI) to capture trends in annual peak precipitation, estimate flood vulnerability, and assess water security [1].
ERA5 by ECMWF [2] is one of the most widely used reanalysis datasets, with a global coverage and spatial resolution of approximately 31 km and a temporal resolution at an hourly scale from 1950 to the present day. Despite the relevance of the ERA5 dataset for a wide range applications, its spatial resolution, at the moment, is too coarse to capture the small-scale features and characteristics of urban areas: downscaling techniques will be applied for a reliable adoption of ERA5 data in urban contexts and for characterizing localized events [3]. Moreover, notwithstanding their potential, reanalysis data are affected by systematic errors (biases); therefore, bias correction is essential to improve their reliability, especially in urban environments where the consequences of water-related disasters are amplified. Several studies, such as [4,5,6,7], have shown that bias correction improves the accuracy of reanalysis data for hydrological application.
This paper explores the application of ERA5 precipitation data in a catchment located in Georgia, evaluating five bias correction techniques and their performance at daily and monthly scales to identify the most suitable approach for hydrological modeling. The Georgian basin was chosen as a case study because of the limited availability of long-term and reliable observational climate data. Unlike many regions where a dense and continuous monitoring network has been established for decades, Georgia lacks an extensive and homogeneous set of meteorological records. In this context, reanalysis products provide a consistent data source that can be corrected and adapted for regional applications, making Georgia a relevant case study for assessing bias correction techniques on reanalysis datasets. Given the limitations of reanalysis datasets which prevent their application in small-scale projects, the application of bias correction approaches to improve ERA5 datasets described in the present paper should be regarded as a preliminary step towards the expected future application of ERA5 datasets in urban contexts.
2. Materials and Methods
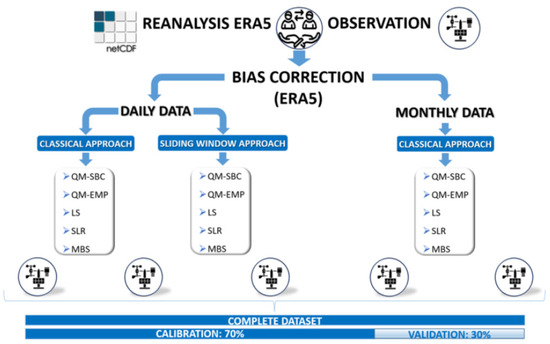
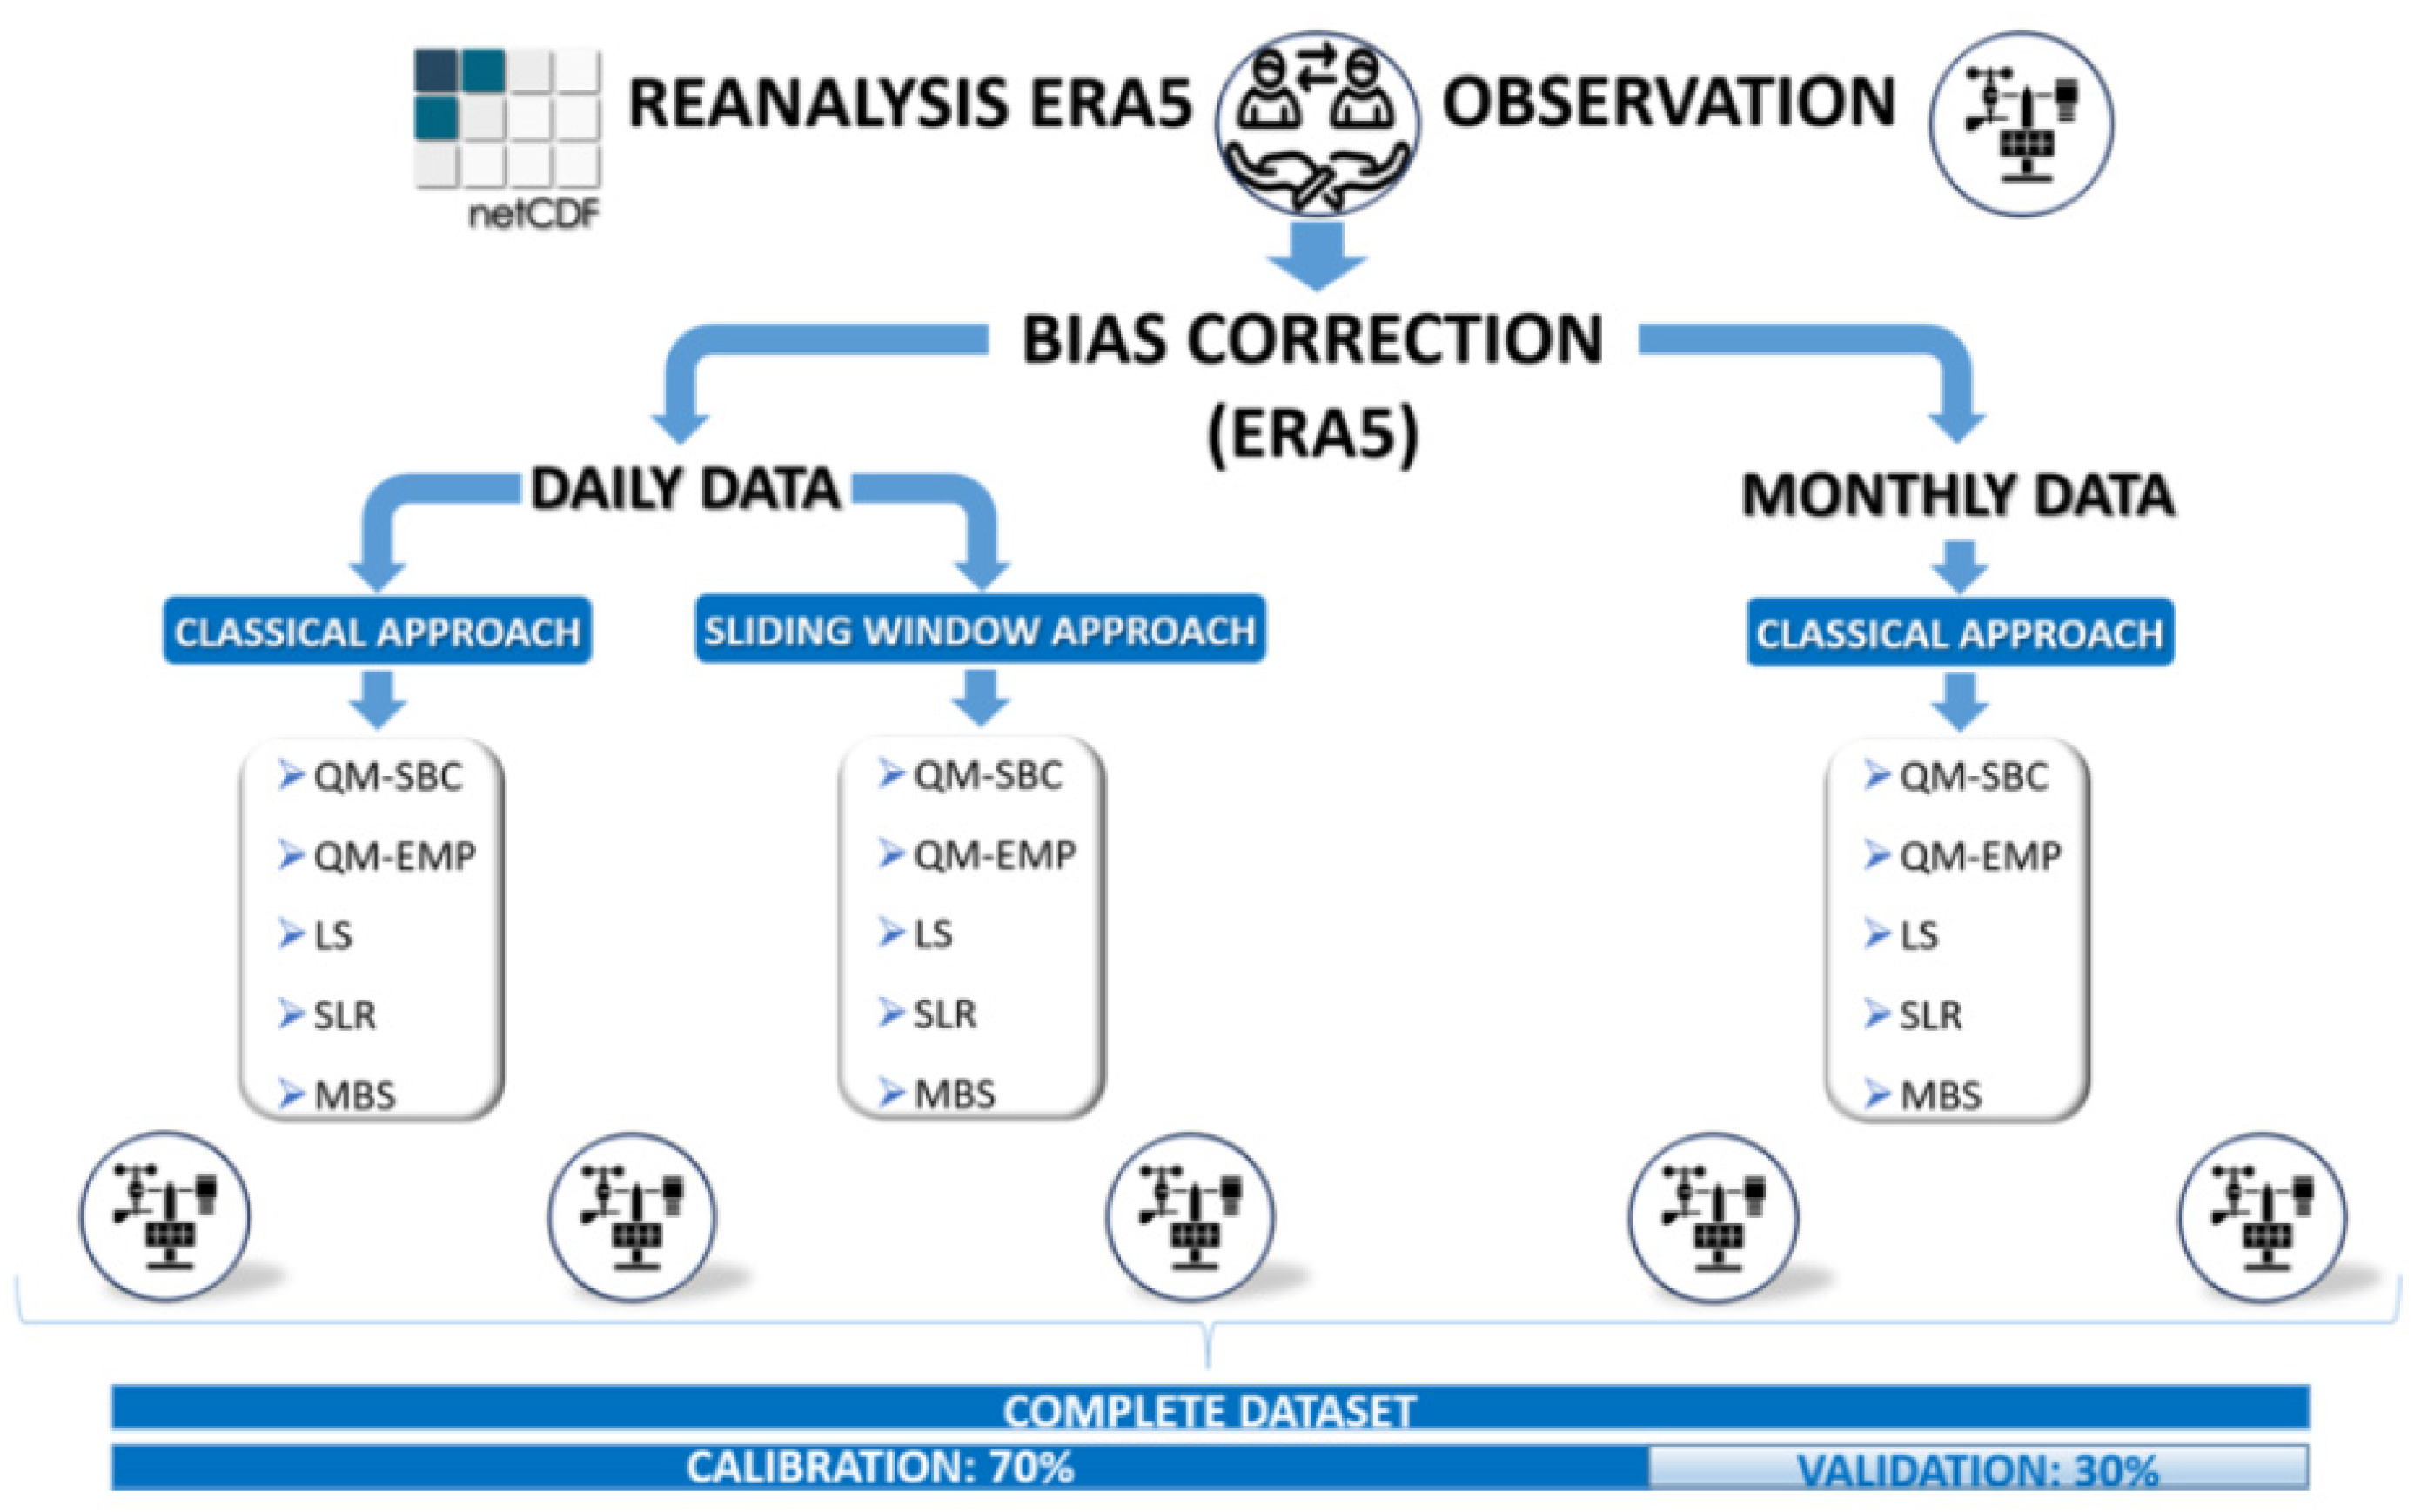
The ERA5 dataset was extracted for the entire territory of Georgia using an in-house developed Python (version 3.12) algorithm. Observed precipitation data at a daily scale from five meteorological stations located across diverse Georgian climatic zones were used for calibration and validation. Five bias correction methods were applied: Linear Scaling (LS), Empirical Quantile Mapping (QM-EMP), Quantile Mapping Spline Bias Correction (QM-SBC), Mean Bias Subtraction (MBS), and Simple Linear Regression (SLR). As can be seen from the flowchart represented in Figure 1, two approaches were considered: (i) the classical method, which computes correction factors using monthly statistics, and (ii) the sliding window [6], which employs a moving window to derive daily correction factors.
Figure 1.
Diagram of the applied methodology that performs: five bias correction methods, two approaches (classical and sliding window), two temporal scales, and five datasets, for a total of 75 analyses.
Bias correction methods were tuned against observation time series, with calibration on 70% of the dataset and validation on the remaining 30%. Performance was assessed using the Root Mean Square Error (RMSE) and the Nash-Sutcliffe Efficiency (NSE).
3. Results and Discussion
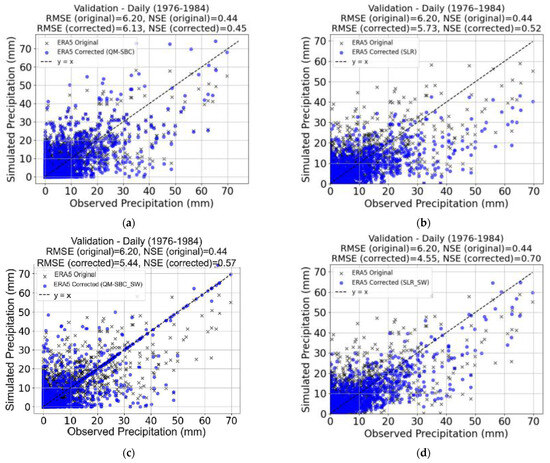
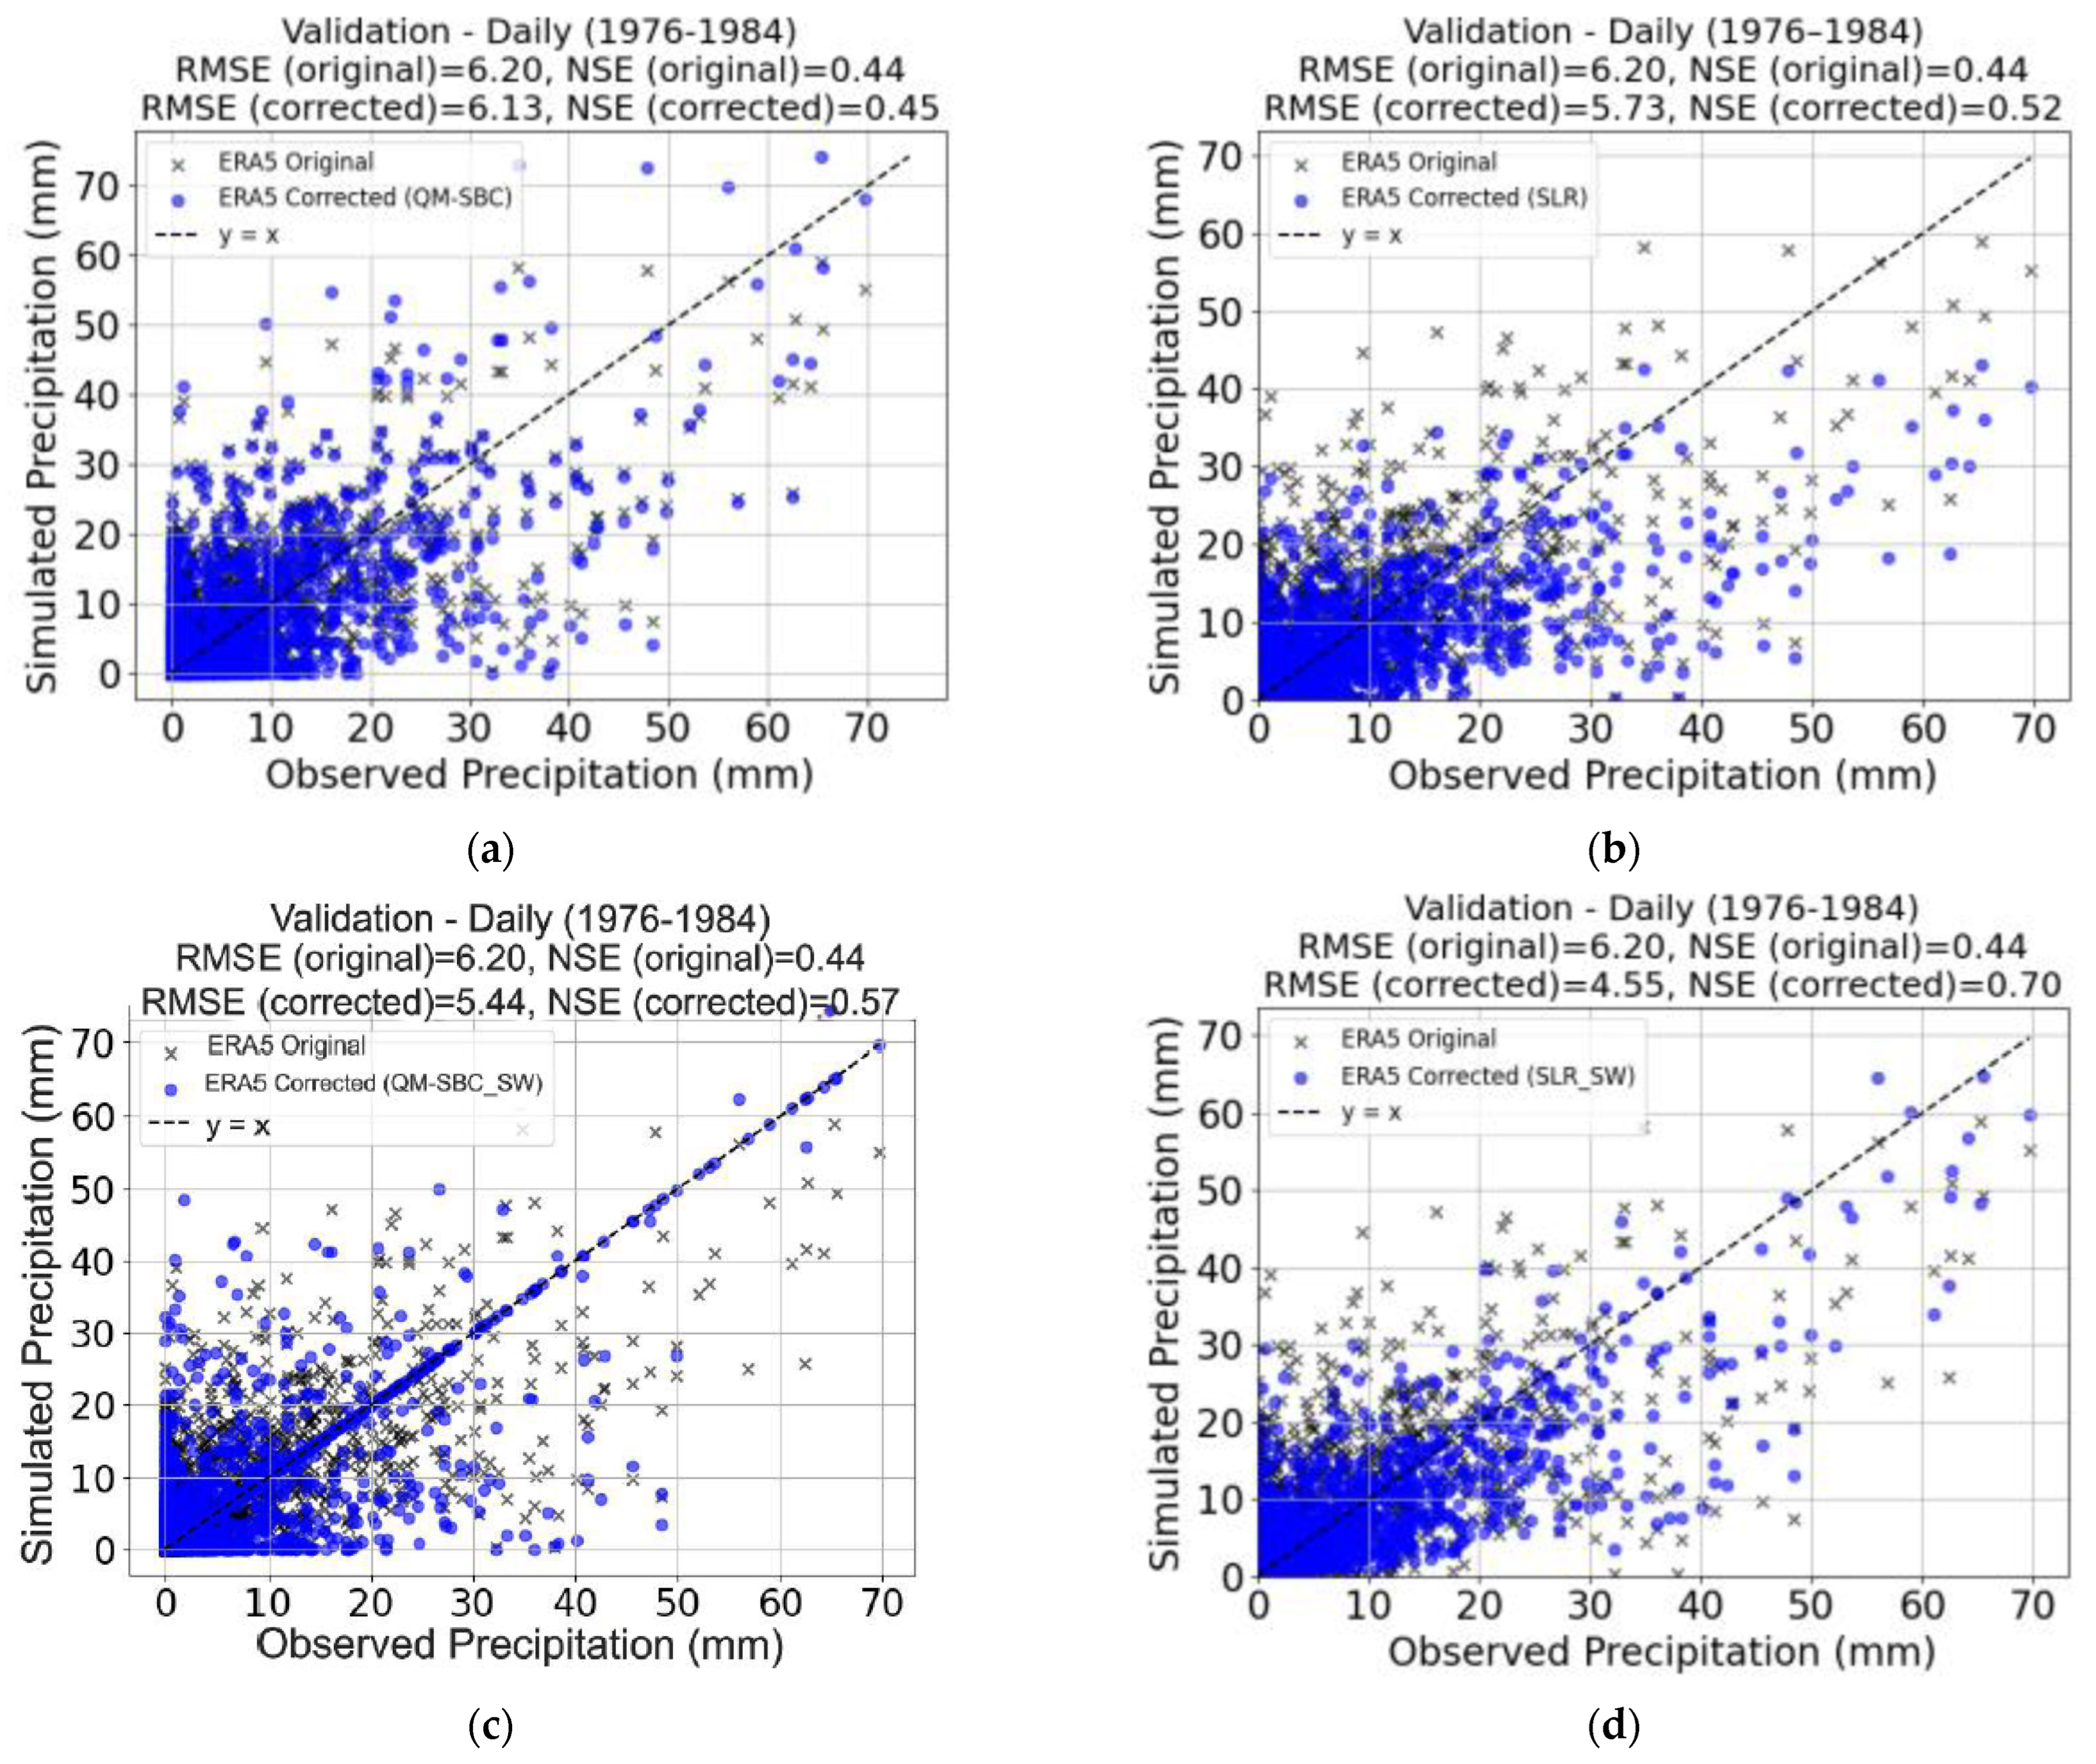
The comparison of bias correction methods at daily and monthly scales revealed clear differences between the classical and sliding window approaches. In this section, we focus on two correction techniques, namely Spline Quantile Mapping (QM-SBC) and Simple Linear Regression (SLR). On the daily scale (Figure 2), classical corrections provided only moderate improvements. For example, SLR reduced RMSE from 6.20 to 5.73 and increased NSE from 0.44 to 0.52 (Figure 2b), while QM-SBC achieved smaller gains with RMSE = 6.13 and NSE = 0.45 (Figure 2a). In contrast, the sliding window approach produced much stronger results: QM-SBC lowered RMSE to 5.44 with NSE = 0.57 (Figure 2c), and SLR reached RMSE = 4.55 with NSE = 0.70 (Figure 2d), highlighting its ability to better capture temporal variability.
Figure 2.
Comparison of bias correction methods at the daily scale (1976–1984). Panels show (a) QM-SBC with the classical approach, (b) SLR with the classical approach, (c) QM-SBC with the sliding window approach, and (d) SLR with the sliding window approach.
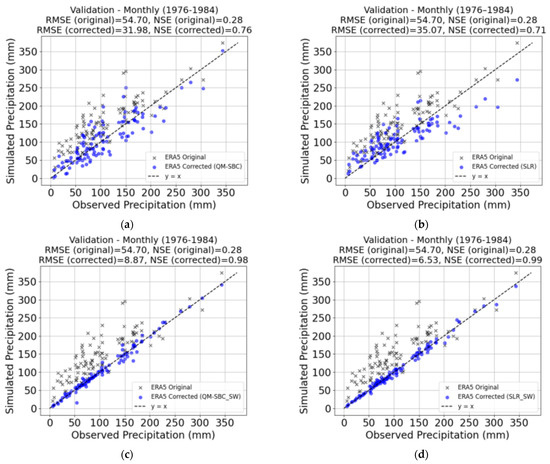
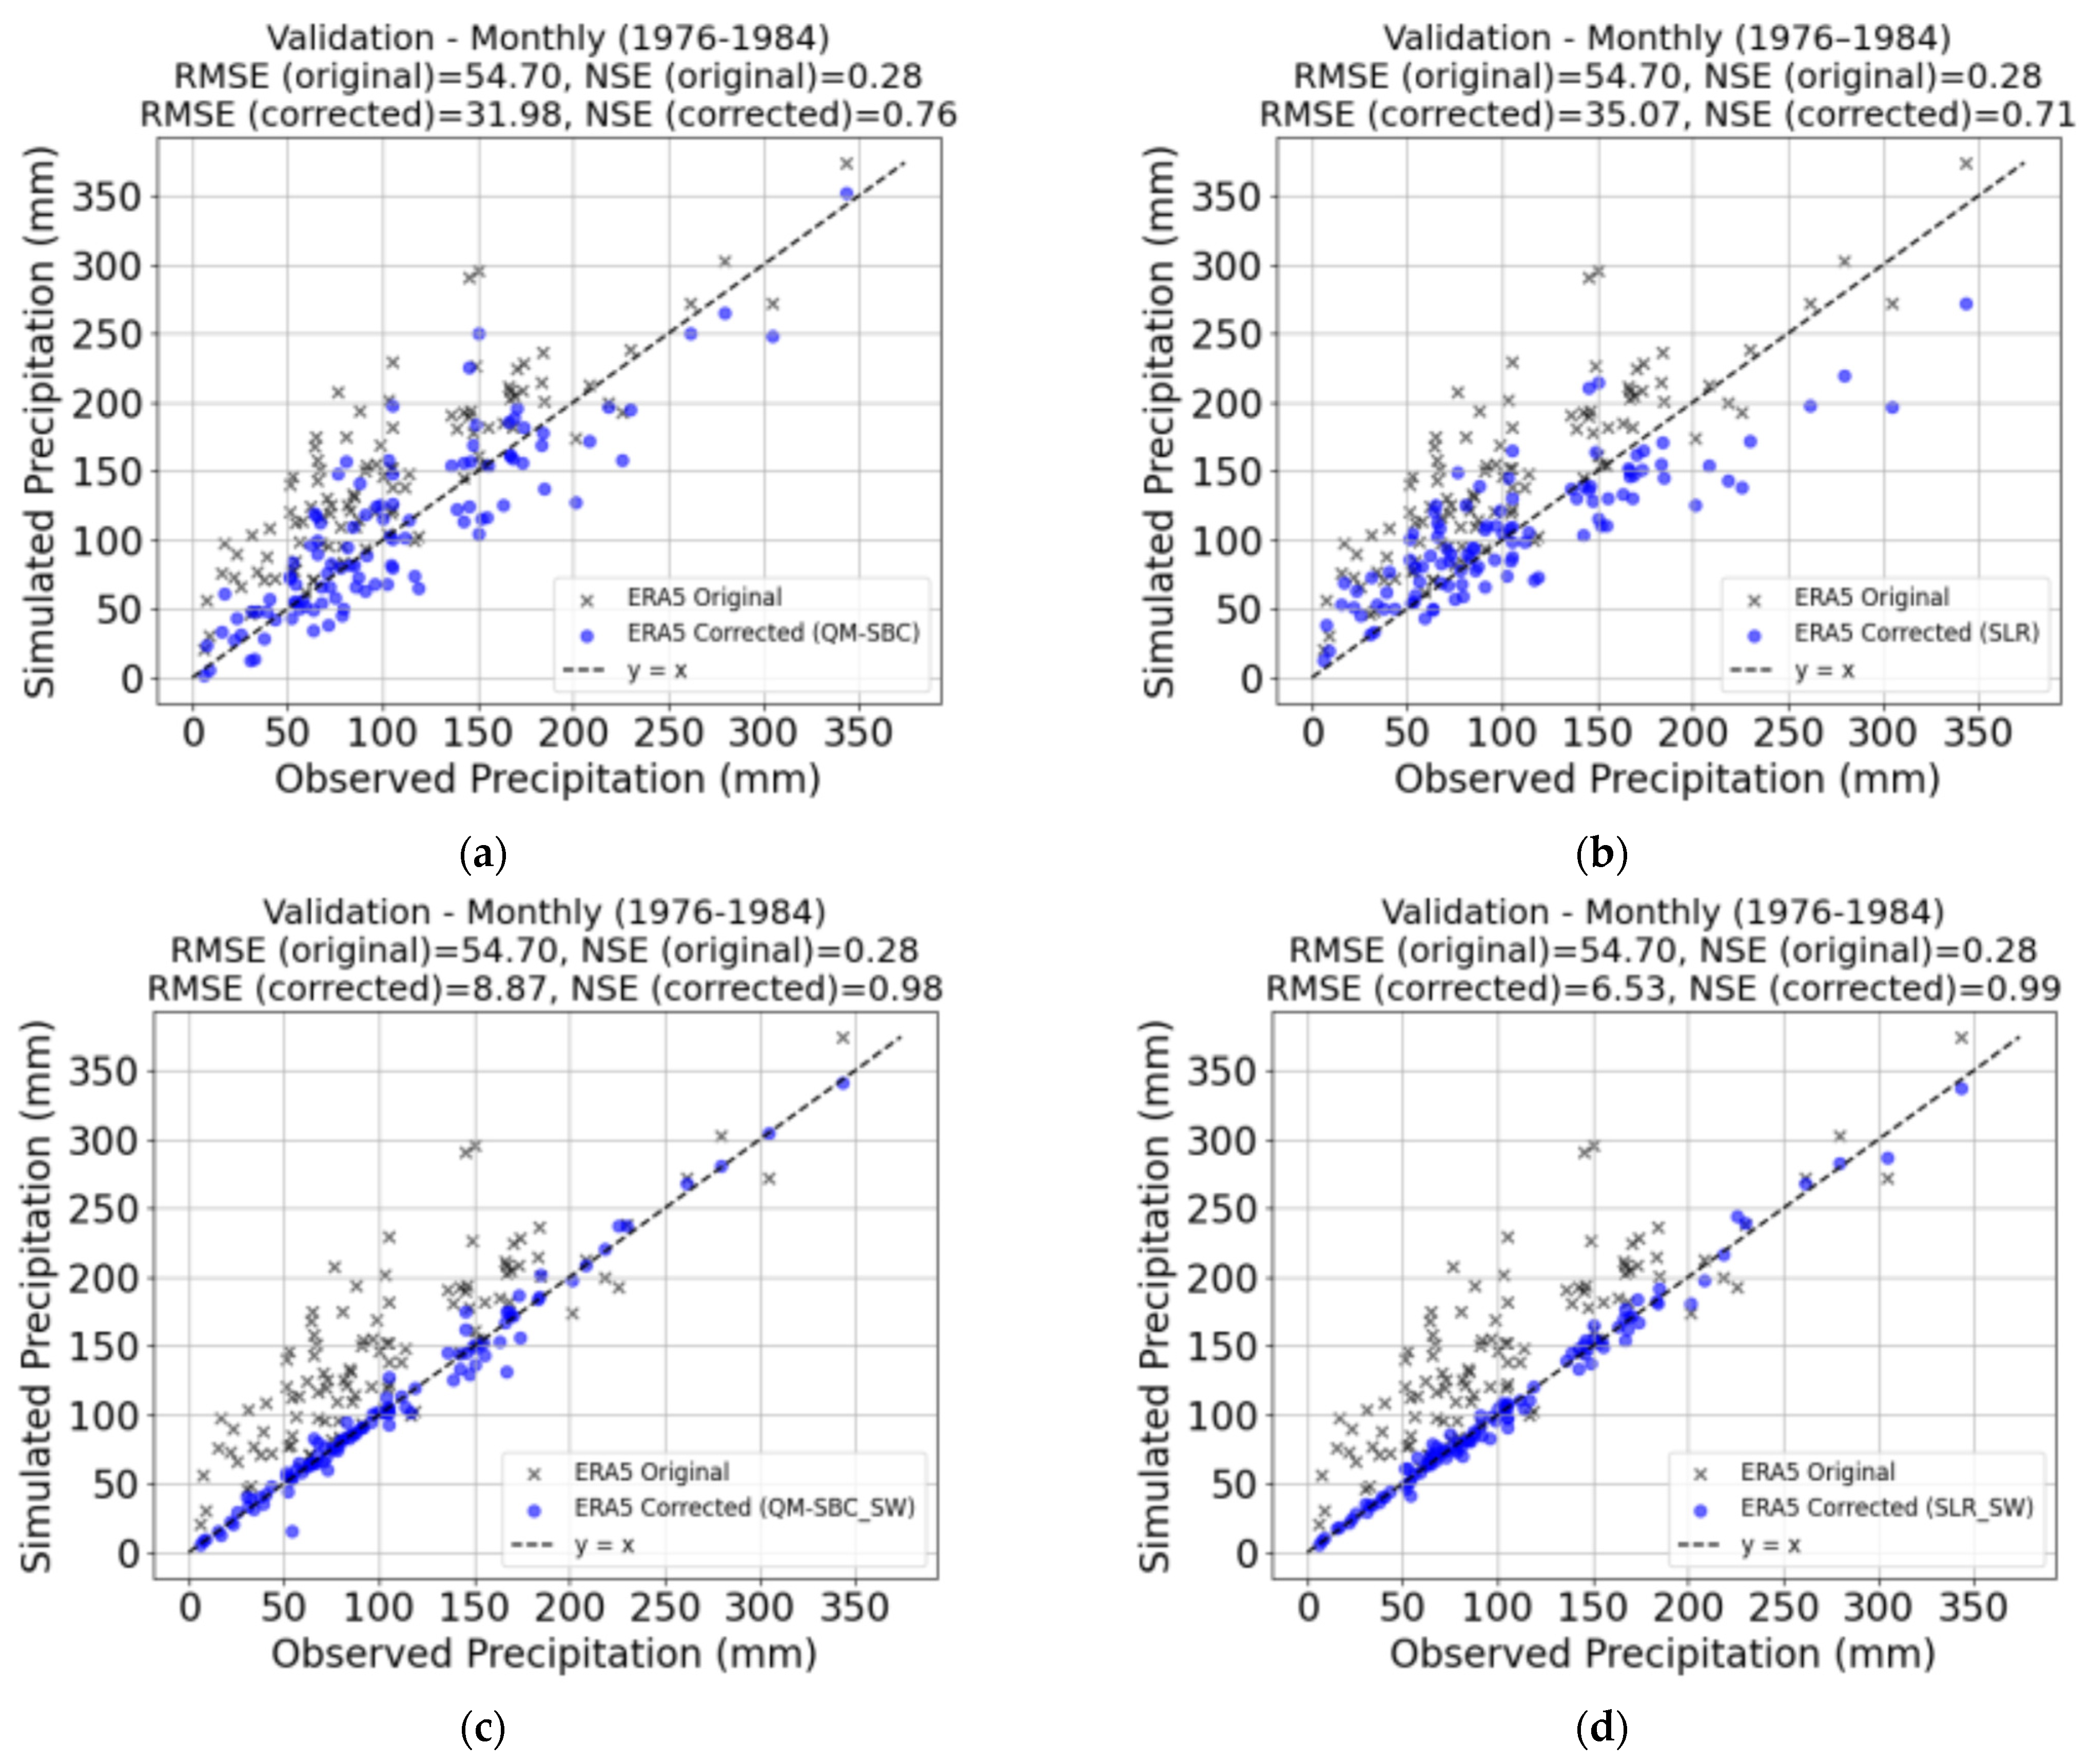
On the monthly scale (Figure 3), improvements were even more striking. Under the classical approach, QM-SBC reduced RMSE from 54.70 to 31.98 and increased NSE to 0.76 (Figure 3a), while SLR achieved RMSE = 35.07 with NSE = 0.71 (Figure 3b). With the sliding window approach, both methods reached near-optimal performance: QM-SBC achieved RMSE = 8.87 and NSE = 0.98 (Figure 3c), while SLR outperformed all others with RMSE = 6.53 and NSE = 0.99 (Figure 3d).
Figure 3.
Comparison of bias correction techniques at the monthly scale (1976–1984). Panels show (a) QM-SBC with the classical approach, (b) SLR with the classical approach, (c) QM-SBC with the sliding window approach, and (d) SLR with the sliding window approach.
The overall results highlight that distribution-based techniques (QM-EMP, QM-SBC, SLR) consistently outperformed the simpler ones. LS showed weaker results, particularly on the daily scale, while MBS produced intermediate outcomes. The sliding window approach systematically enhanced performance across methods and time scales. Corrected ERA5 datasets, especially when adjusted with regression-based or distribution-based techniques, represent a reliable input for hydrological modeling in data-scarce regions. Remaining limitations concern the restricted number of observational stations and the spatial coverage, which should be addressed in future studies.
4. Conclusions
This study confirms the importance of applying bias correction to reanalysis data before using them in hydrological applications. Results indicate distribution-based methods are more reliable in validation contexts. The sliding window approach proved to be an effective enhancement, increasing the adaptability of corrections to local climate variability. Although spatial resolution remains a critical issue for their application, especially at an urban scale, corrected ERA5 data represent a valuable resource for hydrological modeling and climate impact studies in data-scarce regions. Future research should focus on enhancing the reliability of reanalysis data in urban contexts—particularly in large metropolitan systems—by employing and exploring downscaling techniques to strengthen global water security monitoring and improve assessments of both flood risk and water availability through the development of long-term standardized indices.
Author Contributions
Conceptualization, F.Z., M.N. and E.A.; methodology, A.N. and E.A.; software, A.N.; validation, A.N.; formal analysis, A.N.; investigation, A.N., F.Z., F.L., M.N. and E.A.; resources, F.Z. and E.A.; data curation, A.N. and F.L.; writing—original draft preparation, A.N.; writing—review and editing, F.Z., M.N. and E.A.; visualization, A.N. and F.L.; supervision, E.A. All authors have read and agreed to the published version of the manuscript.
Funding
This research received no external funding.
Institutional Review Board Statement
Not applicable.
Informed Consent Statement
Not applicable.
Data Availability Statement
(1) ERA5 reanalysis data are publicly available through the Coper-nicus Climate Data Store (CDS) at https://doi.org/10.24381/cds.adbb2d47. Generated using or contains modified Copernicus Climate Change Service information. Neither the European Com-mission nor ECMWF is responsible for any use that may be made of the Copernicus information or data it contains. (2) Observed precipitation data from Georgian meteorological stations are not publicly available due to third-party data restrictions.
Conflicts of Interest
Authors Andrea Nobile, Francesca Zanello, Francesco Lubrano were employed by the company Idrostudi S.r.l. The remaining authors declare that the research was conducted in the absence of any commercial or financial relationships that could be construed as a potential conflict of interest.
References
- Aboelnour, M.A.; Hamlet, A.F.; Wood, D.; Hung, F.W. Leveraging ERA5-Land reanalysis precipitation data for urban flood vulnerability and water security assessments: A global perspective. Earth Syst. Environ. 2025, 9, 2335–2353. [Google Scholar] [CrossRef] [Scilit]
- Hersbach, H.; Bell, B.; Berrisford, P.; Biavati, G.; Horányi, A.; Muñoz Sabater, J.; Nicolas, J.; Peubey, C.; Radu, R.; Rozum, I.; et al. ERA5 Hourly Data on Single Levels from 1940 to Present. Available online: https://cds.climate.copernicus.eu/datasets/reanalysis-era5-single-levels?tab=overview (accessed on 1 May 2026).
- Reder, A.; Raffa, M.; Padulano, R.; Rianna, G.; Mercogliano, P. Characterizing extreme values of precipitation at very high resolution: An experiment over twenty European cities. Weather Clim. Extrem. 2022, 35, 100407. [Google Scholar] [CrossRef] [Scilit]
- Arnone, E.; Cucchi, M.; Dal Gesso, S.; Petitta, M. A multi-hazard Extreme Climate Index across Europe. Epic. Ser. Eng. 2018, 3, 95–102. [Google Scholar]
- Tarek, M.; Martel, J.L.; Boucher, M.A.; Brissette, F. ERA5 Reanalysis as a Potential Reference Dataset for Hydrological Modeling Over North America. J. Hydrometeorol. 2020, 21, 645–666. [Google Scholar] [CrossRef] [Scilit]
- Smitha, P.S.; Narasimhan, B.; Sudheer, K.P.; Annamalai, H. An improved bias correction method of daily rainfall data using a sliding window technique for climate change impact assessment. J. Hydrol. 2018, 556, 100–118. [Google Scholar] [CrossRef] [Scilit]
- Francipane, A.; Arnone, E.; Noto, L.V. Combining a data-driven approach with seasonal forecast data to predict reservoir water volume in the Mediterranean area. Hydrol. Sci. J. 2023, 68, 764–781. [Google Scholar] [CrossRef] [Scilit]
Disclaimer/Publisher’s Note: The statements, opinions and data contained in all publications are solely those of the individual author(s) and contributor(s) and not of MDPI and/or the editor(s). MDPI and/or the editor(s) disclaim responsibility for any injury to people or property resulting from any ideas, methods, instructions or products referred to in the content. |
© 2026 by the authors. Licensee MDPI, Basel, Switzerland. This article is an open access article distributed under the terms and conditions of the Creative Commons Attribution (CC BY) license.