


Abstract
This work focuses on the wind-induced bias in measurements from three commonly avail-able non-catching precipitation instruments. The bias was evaluated using a numerical approach to compute the velocity field around the instrument body in windy conditions and the effect that such aerodynamic disturbance has on raindrop trajectories. The instrument performances are shown in terms of Catch Ratios and Collection Efficiency for drop size distribution and rainfall intensity measurements, respectively. Both overestimation and underestimation were observed, depending on wind speed and direction. The correction of raw measurements can be performed based on collocated anemometer measurements.
1. Introduction
The ability to measure precipitation’s microphysical properties makes non-catching-type gauges (NCGs)—including disdrometers—a valuable tool for researchers. NCGs use optical, acoustic (vibration) or microwave (radar) measurement principles to obtain the Particle Size and Velocity Distribution (PSVD) of precipitation [1]. This work analyses two of the most widely used types of NCGs. Optical disdrometers provide non-contact measurements by means of a transmitter that emits visible or infrared light and an optical sensor that receives the signal. From the changes in the electrical signal detected at the receiver, the hydrometeor geometric (size) and dynamic (velocity) characteristics can be computed. Impact disdrometers, on the other hand, measure the kinetic energy of hydrometeors that hit their sensing area. The vibrations or deformation generated by the impacts are converted into an electrical signal and from its frequency spectrum the number and size of the drops are obtained. Their major drawback is that they need to assume a relationship between drop size and fall velocity.
Despite their widespread use, it is rare for the accuracy and reliability of disdrometer measurements to be questioned or quantified. They are often considered the ‘ground truth’, based on factory calibration and neglecting environmental biases. However, several authors report significant inconsistencies in disdrometer measurements (see, e.g., [2]). This is also evident from field intercomparison, where significant errors are shown [3]. This work focuses on the impact of wind, recognised as the primary environmental source of bias in rainfall measurements. Once immersed in a wind field, the instrument body behaves like a bluff-body obstacle. The induced aerodynamic disturbance affects raindrop trajectories, which may be diverted from or towards the instrument’s sensing area depending on their size and fall velocity. This bias is well documented in the literature for both traditional catching gauges [4] and NCGs [5], though less frequently quantified for the latter. In this paper the accuracy of the Thies Laser Precipitation Monitor (LPM) [6], the OTT Parsivel2 [7] optical disdrometer and the Vaisala WXT-520 [8] impact disdrometer are presented. These commonly used NCGs are representative of the majority of the disdrometers employed in the field by researchers and national weather services.
2. Methodology
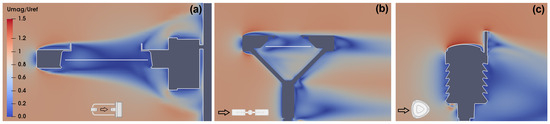
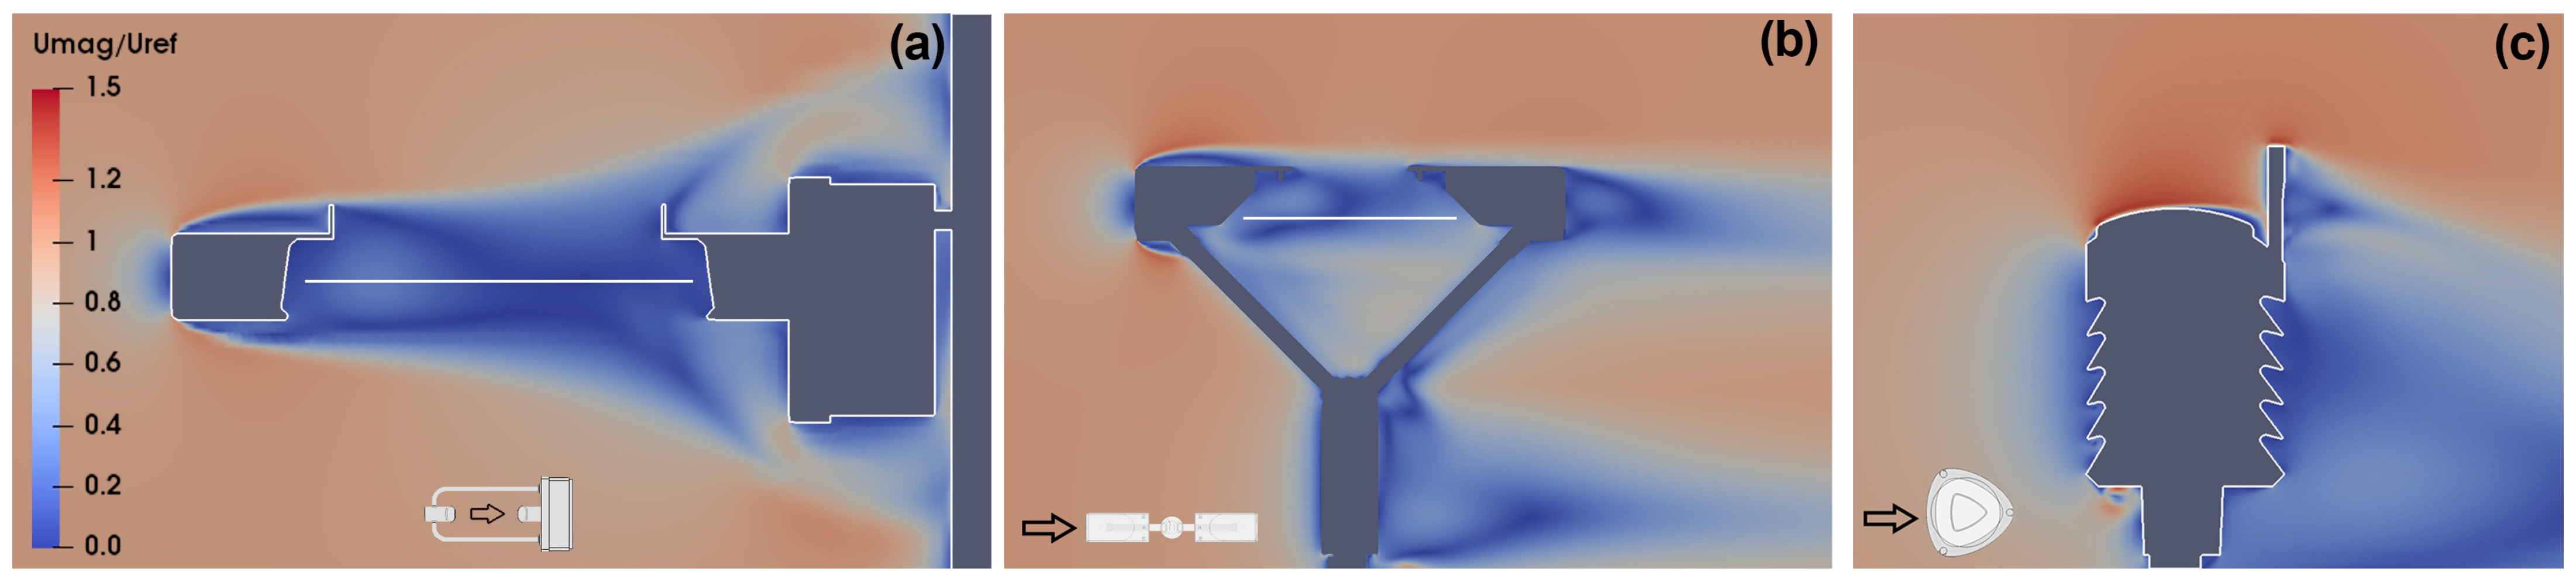
The wind-induced bias in rainfall measurements was quantified using a numerical approach. Initially, the velocity field around each gauge was obtained by means of computational fluid dynamics simulations. Wind speed values (Uref) from 1 m s−1 to 20 m s−1 were simulated for the different gauges. Furthermore, several high-resolution structured meshes were constructed, rotating the gauges inside the computational domain to account for different wind directions (α). Simulations were run using OpenFOAM [9] until the steady state was reached, and considering stationary turbulence characteristics. Further details about this numerical model employed can be found in [10]; meanwhile, an example of the calculated velocity fields for the three instruments investigated is shown in Figure 1.
Figure 1.
Cross-section of the airflow field (wind velocity magnitude) for a reference wind speed of 10 m s−1 for the Thies LPM (a), OTT Parsivel2 (b) and the Vaisala WXT-520 (c). The black arrows indicates wind direction.
The effect of the aerodynamic disturbance on raindrop trajectories was then evaluated using a Lagrangian particle tracking model, considering a stationary airflow velocity field and neglecting particle-to-particle interactions. This is acceptable since the volume fraction of raindrops in the atmosphere is generally low and interactions are also very limited close to the ground. Raindrops were inserted into the computational domain along regular grids ensuring that all trajectories that could potentially reach the instrument’s sensing area were included in the simulation. In total 11 drop diameters were simulated from 0.25 mm up to 8 mm. An in-depth analysis on the use of an LPT model for simulating drop trajectories and an extensive wind tunnel validation is presented in [10]. Finally, the instrument’s performance was evaluated from the computed raindrop trajectories and their interaction with the instrument body and its sensing area.
3. Simulation Results
As shown in Figure 1, velocity gradients near the instrument body may be quite strong for the two optical NCGs, with an aerodynamic response that strongly depends on wind direction. Meanwhile, disturbance for the Vaisala WXT-520 is limited except very close to its surface and in its wake. The dependence on wind direction is overall quite limited. Similar results are also shown for raindrop trajectories, with—as expected—small drops being significantly affected by wind while larger drops are mostly unaffected. The wind also causes all drops to fall along inclined trajectories and may impact on the instrument body even when not significantly diverted by the aerodynamic disturbance.
3.1. Catch Ratios
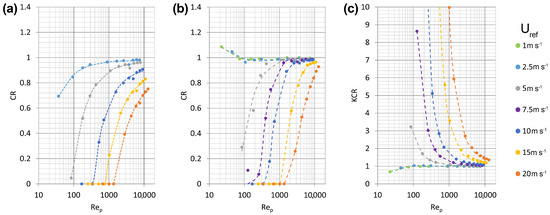
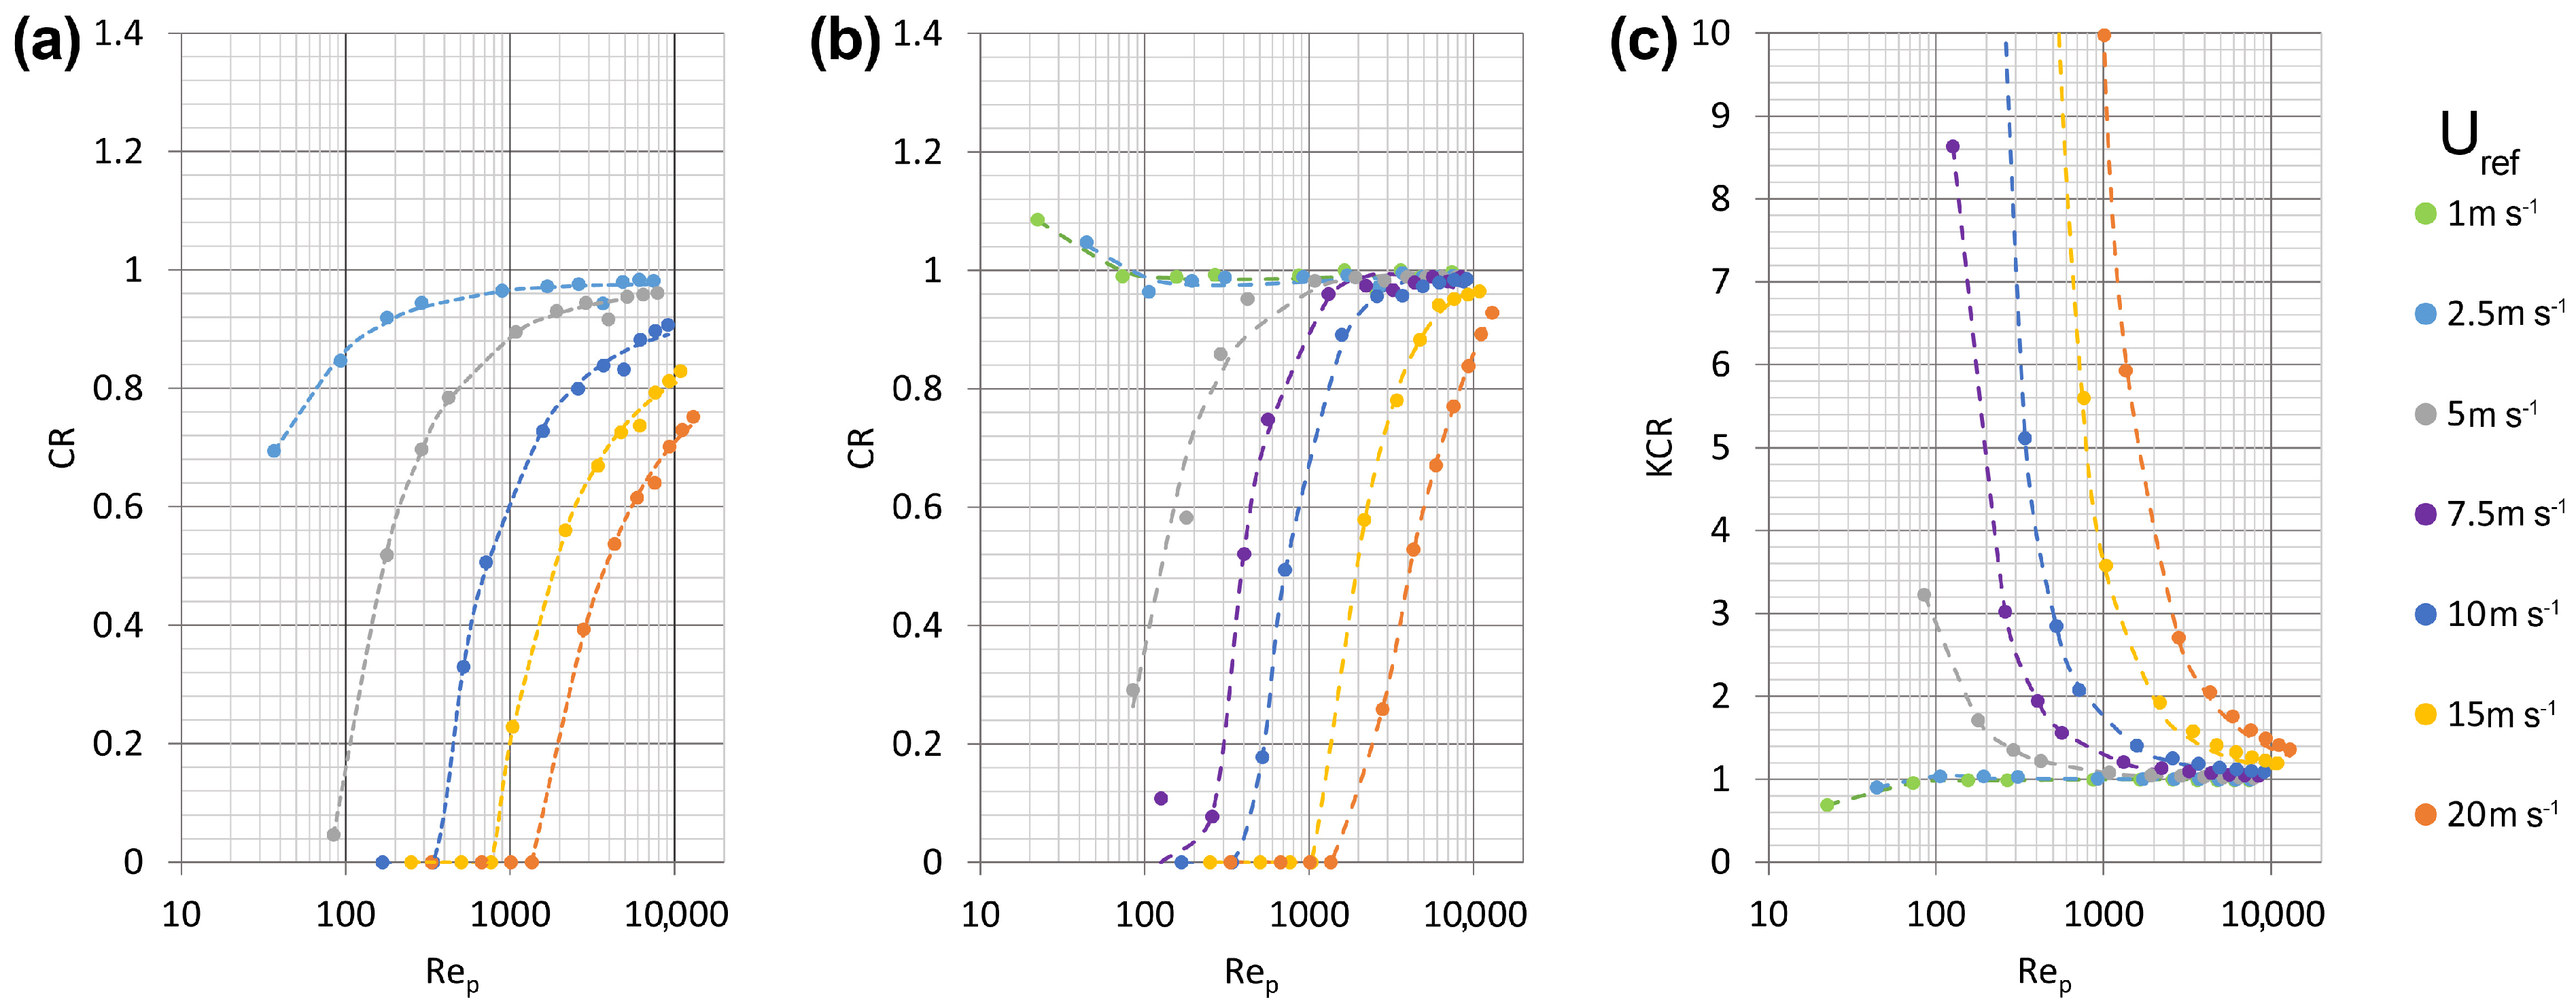
The main results of this work are the Catch Ratios (CRs), defined as Kinetic Catch Ratios (KCRs) for the Vaisala WXT-520. Both are non-dimensional indicators of the instrument’s performance in windy conditions. CRs are defined as the ratio between the number of drops that reach the instrument’s sensing area in windy conditions and the number of drops that would reach it if the instrument was transparent to wind and raindrop trajectories. The KCR is defined as the ratio between the kinetic energy flux produced by raindrops affected by the wind and the one produced by the same raindrops falling vertically at terminal velocity. CRs and KCRs are instrument-specific and site-independent. Their variation with undisturbed wind speed, raindrop size, and dynamic characteristics is presented in Figure 2 as a function of the undisturbed particle Reynolds number (Rep).
Figure 2.
CR and KCR values obtained for a wind direction α = 0°, as a function of Rep for the Thies LPM (a), OTT Parsivel2 (b) and Vaisala WXT-520 (c).
For the two optical disdrometers, the CR increases with the drop diameter (except for the Parsivel2 at low wind speed), while it decreases with the wind speed. Under certain conditions, the CR may vanish, meaning that drop trajectories do not even reach the instrument’s sensing area. For the impact disdrometer, the KCR slightly increases (at low wind speed) or dramatically decreases (at high wind speed) with the drop diameter, tending to one at a high Rep. The KCR is always greater than zero but also shows overestimation several times larger than the ones observed for the CR in the case of optical instruments.
3.2. Collection Efficiency
Integral properties of rainfall, like rainfall intensity (RI) or radar reflectivity (Z), are also commonly derived from disdrometer measurements. The wind-induced bias on such variables can be evaluated once a DSD formulation is assumed (or measured). Considering RI, the Collection Efficiency (CE) can be used as a performance indicator. It is defined as the ratio of the total volume of precipitation sensed by the gauge in windy conditions to the amount that would have been sensed in the absence of any disturbance. For impact disdrometers, however, a dedicated Kinematic Collection Efficiency (KCE) is defined, which is still a ratio between the sensed and the reference volume (obtained with no wind-induced disturbance). However, since they measure the drops’ kinetic energy, precipitation volume is a derived measure. Calculations were therefore performed as follows. First, the kinetic energy flux of the monodisperse reference precipitation is multiplied by the corresponding KCR value. From the kinetic energy flux, by inverting the diameter–terminal velocity relationship, the diameter of the equivalent monodisperse precipitation (same kinetic energy flux at terminal velocity) is computed. The volume effectively sensed by the instrument is obtained by integrating the corrected monodisperse precipitation.
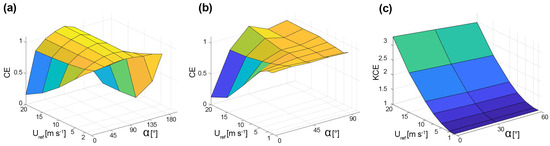
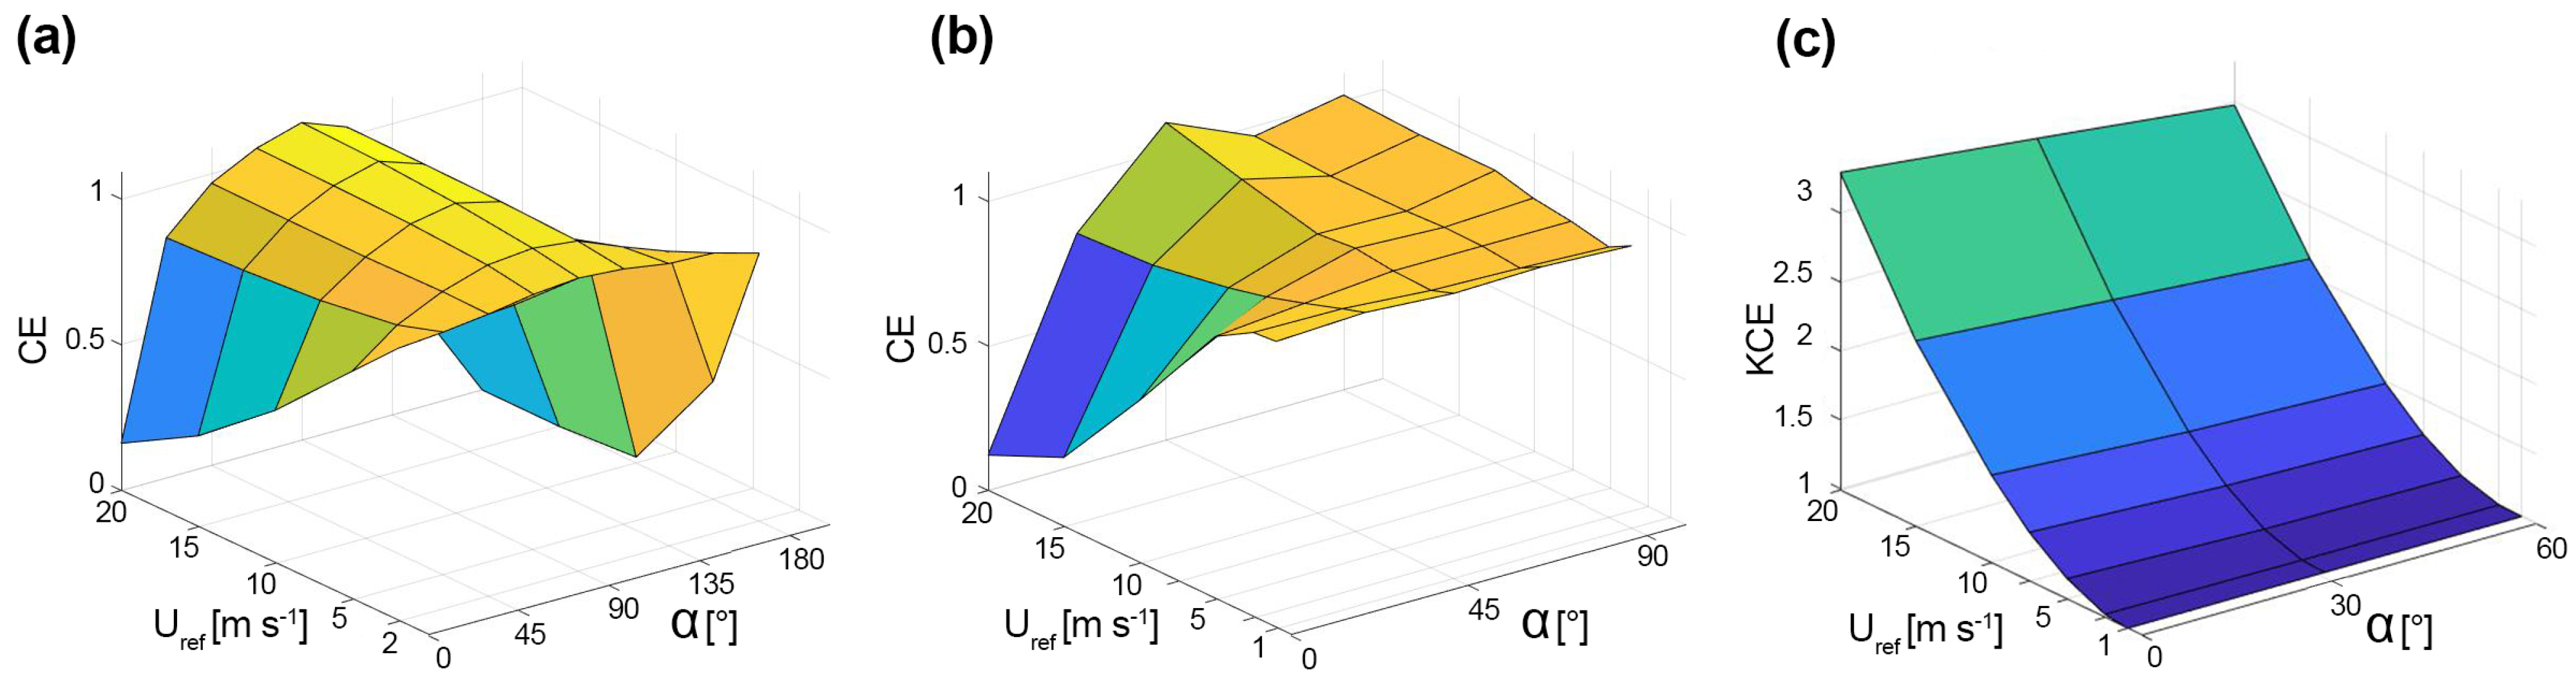
Sample results, at RI = 10 mm h−1, are presented in Figure 3 for the three instruments. The two optical disdrometers show significant underestimation depending on the wind speed and direction, with some overestimation in the case of the OTT Parsivel2. The impact disdrometer shows significant overestimation that increases with the wind speed. The analysis and parametrization for both the CR/KCR and CE/KCE are available in [10,11,12].
Figure 3.
CE and KCE values at a RI of 10 mm h−1, as a function of wind speed and direction for the Thies LPM (a), OTT Parsivel2 (b) and the Vaisala WXT-520 (c).
4. Conclusions
In this work we showed that the wind-induced bias is not negligible for NCGs. The measurement bias strongly depends on the specific instrument and its installation in the field, against the prevalent wind direction. However, if collocated measurements of wind speed and direction are available, raw NCG measurements can be adjusted using the CR/KCR and/or CE/KCE curves presented in this work. Corrections can be provided either in real time or a posteriori, after suitable post-processing. For these reasons, the installation of NCGs should be carefully planned, considering the specific wind climatology on site, and measurements should always be accompanied by ancillary wind data.
Author Contributions
Conceptualization, A.C. and L.G.L.; methodology, E.C., A.C. and L.G.L.; software, E.C.; formal analysis, E.C., A.C. and L.G.L.; investigation, E.C., A.C. and L.G.L.; resources, A.C. and L.G.L.; data curation, E.C.; writing—original draft preparation, E.C.; writing—review and editing, A.C. and L.G.L.; visualization, E.C.; supervision, L.G.L. All authors have read and agreed to the published version of the manuscript.
Funding
This research received no external funding.
Data Availability Statement
Results and additional data is available at [10,11,12].
Conflicts of Interest
The authors declare no conflict of interest.
References
- Lanza, L.G.; Merlone, A.; Cauteruccio, A.; Chinchella, E.; Stagnaro, M.; Dobre, M.; Garcia Izquierdo, M.C.; Nielsen, J.; Kjeldsen, H.; Roulet, Y.A.; et al. Calibration of non-catching precipitation measurement instruments: A review. Meteorol. Appl. 2021, 28, e2002. [Google Scholar] [CrossRef] [Scilit]
- Adirosi, E.; Roberto, N.; Montopoli, M.; Gorgucci, E.; Baldini, L. Influence of disdrometer type on weather radar algorithms from measured DSD: Application to Italian climatology. Atmosphere 2018, 9, 360. [Google Scholar] [CrossRef] [Scilit]
- Angulo-Martínez, M.; Beguería, S.; Latorre, B.; Fernández-Raga, M. Comparison of precipitation measurements by OTT Parsivel 2 and Thies LPM optical disdrometers. Hydrol. Earth Syst. Sci. 2018, 22, 2811–2837. [Google Scholar] [CrossRef] [Scilit]
- Rodda, J.C.; Dixon, H. Rainfall measurement revisited. Weather 2012, 67, 131–136. [Google Scholar] [CrossRef] [Scilit]
- Friedrich, K.; Higgins, S.; Masters, F.J.; Lopez, C.R. Articulating and stationary PARSIVEL disdrometer measurements in conditions with strong winds and heavy rainfall. J. Atmos. Ocean. Technol. 2013, 30, 2063–2080. [Google Scholar] [CrossRef] [Scilit]
- Adolf Thies GmbH and Co. Instruction for Use; Adolf Thies GmbH and Co.: Göttingen, Germany, 2011. [Google Scholar]
- OTT Hydromet GmbH. Operating Instructions Present Weather Sensor OTT Parsivel2; OTT Hydromet GmbH: Kempten, Germany, 2016. [Google Scholar]
- Vaisala. Vaisala Weather Transmitter WXT520, Users Guide; Vaisala: Vantaa, Finland, 2012. [Google Scholar]
- Jasak, H. OpenFOAM: Open source CFD in research and industry. Int. J. Nav. Archit. Ocean Eng. 2009, 1, 89–94. [Google Scholar] [CrossRef] [Scilit]
- Chinchella, E.; Cauteruccio, A.; Lanza, L.G. Quantifying the wind-induced bias of rainfall measurements for the Thies CLIMA optical disdrometer. Water Resour. Res. 2024, 60, e2024WR037366. [Google Scholar] [CrossRef] [Scilit]
- Chinchella, E.; Cauteruccio, A.; Lanza, L.G. The impact of wind on precipitation measurements from a compact piezoelectric sensor. J. Hydrometeorol. 2024, 25, 339–352. [Google Scholar] [CrossRef] [Scilit]
- Chinchella, E.; Cauteruccio, A.; Lanza, L.G. Impact of wind on rainfall measurements obtained from the OTT Parsivel2 disdrometer. Sensors 2025, 25, 6440. [Google Scholar] [CrossRef] [Scilit] [PubMed]
Disclaimer/Publisher’s Note: The statements, opinions and data contained in all publications are solely those of the individual author(s) and contributor(s) and not of MDPI and/or the editor(s). MDPI and/or the editor(s) disclaim responsibility for any injury to people or property resulting from any ideas, methods, instructions or products referred to in the content. |
© 2026 by the authors. Licensee MDPI, Basel, Switzerland. This article is an open access article distributed under the terms and conditions of the Creative Commons Attribution (CC BY) license.