


Abstract
Leakage localization in water distribution networks (WDN) is crucial for reducing water losses, conserving energy, and improving system efficiency. This work presents the application of an integrated approach for leakage localization, relying on sub-daily pressure and inflow data, water-consumption data obtained by means of smart meters, and the WDN digital twin. Observed and simulated pressure data are iteratively compared across multiple leakage scenarios to identify the spatial distribution that minimizes discrepancies, thus pinpointing likely leakage areas. The approach was tested on a real-world WDN where about one-third of users are equipped with smart meters. Results demonstrated its effectiveness in accurately localizing leakages and supporting prompt, targeted repairs.
1. Introduction
Leakage reduction in water distribution networks (WDNs) is strategic for improving the operational efficiency of urban water systems. Beyond conserving water resources, it reduces energy use and operational costs, aligning with broader environmental goals and supporting the green and digital transition of the water sector [1].
For water utilities, accurately quantifying and localizing leakages is crucial to enable timely and cost-effective repair actions. While the total volume of water loss can be estimated through water balance, localization requires more advanced approaches [2]. Among these, methods leveraging calibrated hydraulic models and observed data to locate leakages [3] have emerged as a powerful tool. Specifically, these approaches are based on the comparison of simulated pressure values with measurements collected from strategically placed pressure sensors [4,5]. Leakage detection is then framed as an inverse problem, searching for the spatial distribution of leakages that minimizes the discrepancy between observed and simulated pressure data.
Effective digital-twin-based leakage localization relies not only on accurately distinguishing water demand from leakages but also on the availability of detailed water-consumption profiles. Raw demand estimates, such as those based on yearly billing data, can distort the water balance, leading to errors in leakage volume quantification, especially if sub-yearly periods are considered. While billing data can still be used to roughly model demand, high-resolution smart meter data provide detailed consumption values at daily or sub-daily intervals. Moreover, individual users exhibit high variability in water-consumption profiles that can only be properly captured through individual monitoring with smart meters [6].
This work presents an integrated model-based framework for leakage localization that combines hourly pressure and inflow monitoring, user water-consumption data obtained through smart meters, and the WDN digital twin. The methodology was tested on a real WDN in Northern Italy, demonstrating its effectiveness in identifying network areas affected by leakages and supporting prompt operational responses.
2. Methods and Materials
2.1. The Integrated Digital-Twin-Based Method for Leakage Localization
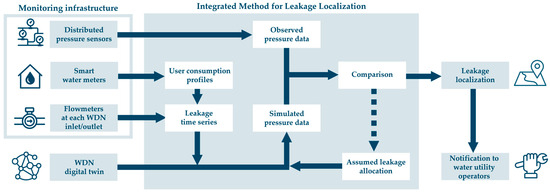
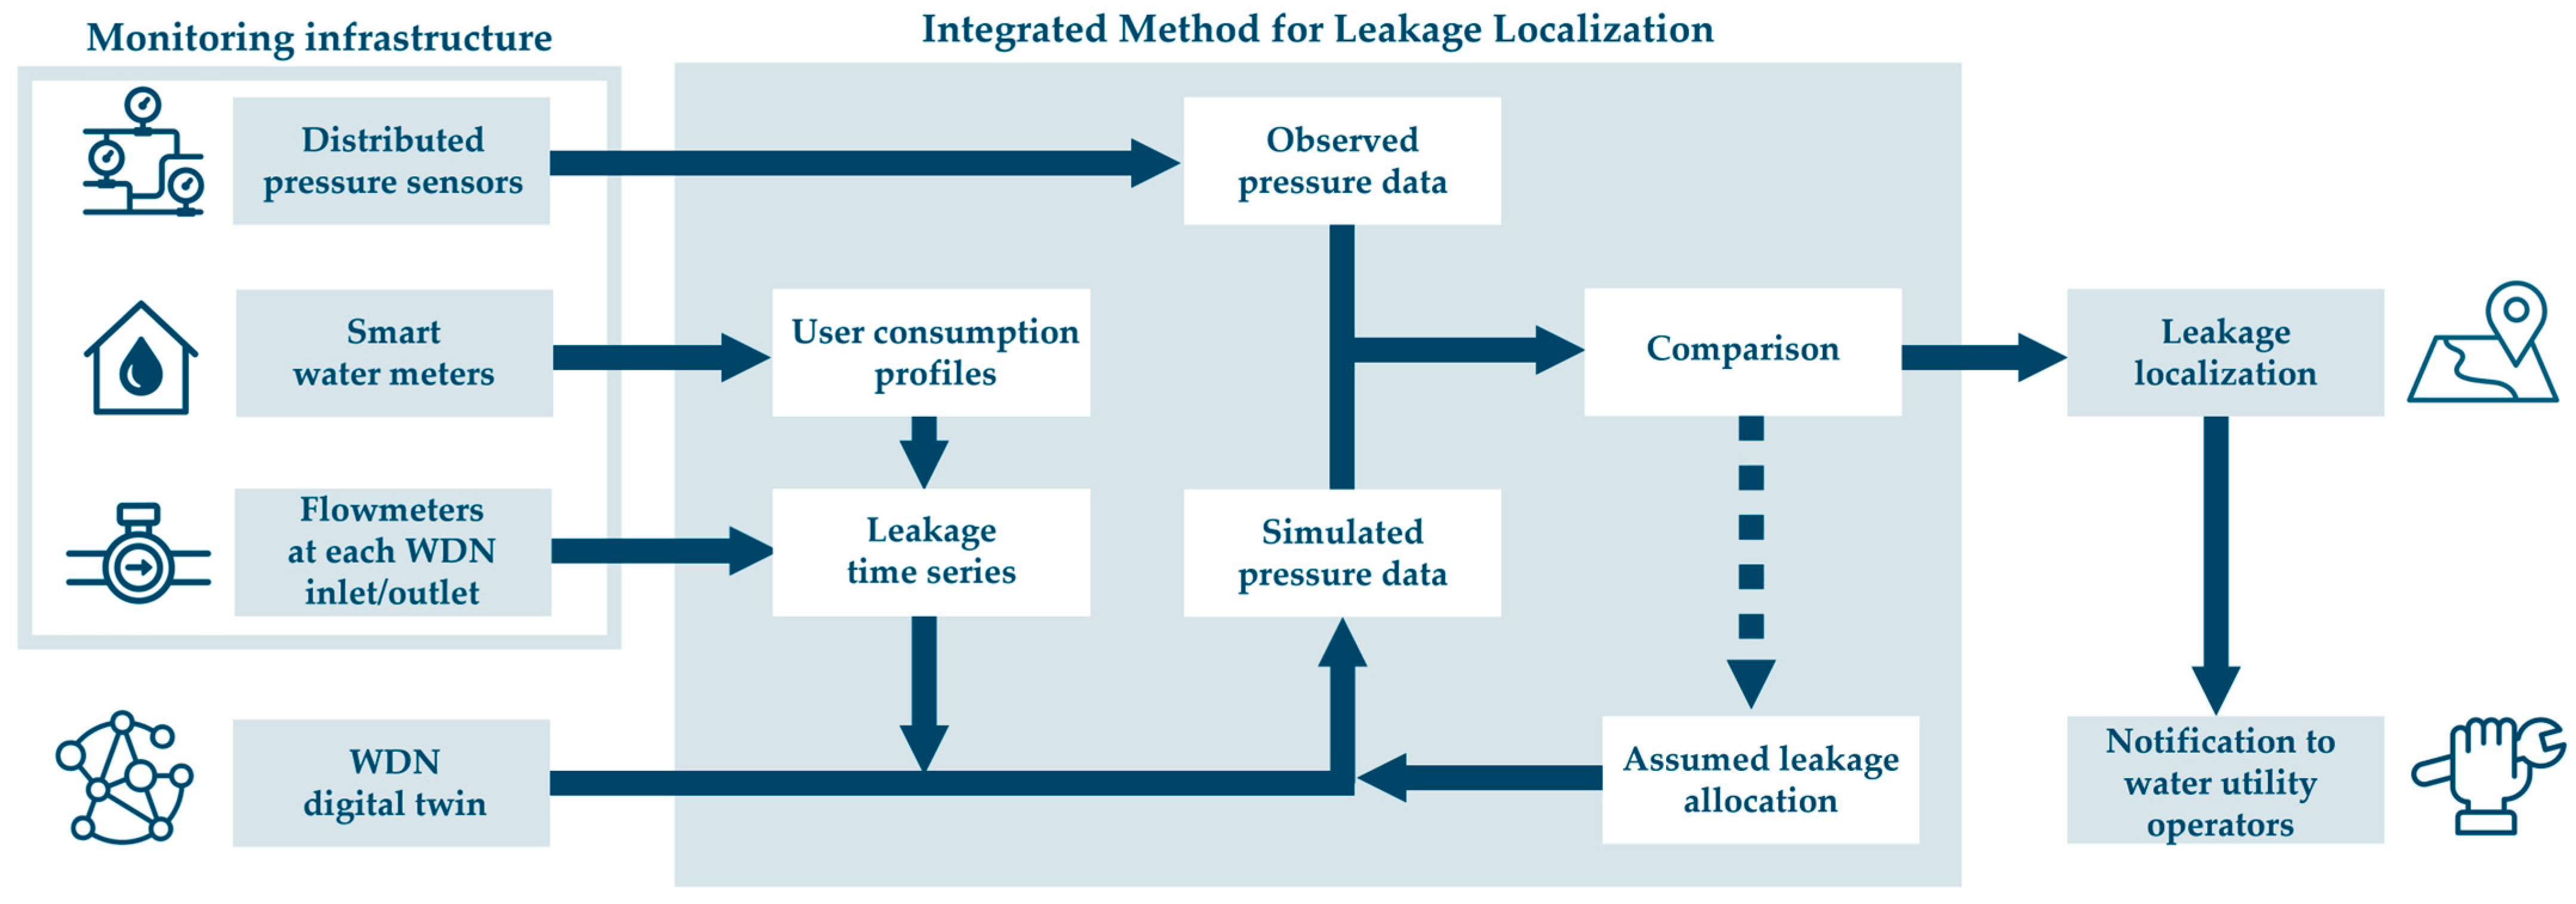
The integrated method proposed combines monitoring data with the digital twin of the WDN to pinpoint the location of leakages in the system and a scheme summarizing its main steps is represented in Figure 1.
Figure 1.
Schematic layout of the integrated digital-twin-based method for leakage localization.
The process starts with the collection of field data from various monitoring sources with a sub-daily resolution: pressure measured at multiple points in the WDN, the system inflow (obtained through flow rate data from meters placed at each WDN inlet and outlet), and users’ water consumption recorded through smart meters. In addition to real data, the hydraulic model of the WDN is required as a tool for the accurate reproduction of network behavior in terms of flow rates and pressure regime in the face of a given demand scenario.
It is worth noting that the accurate reconstruction of water-consumption profiles based on smart meter data allows, on the one hand, enhancing the accuracy of the simulated results provided by the WDN digital twin due to a more detailed demand characterization; on the other hand, it allows accurately determining the leakage time series.
From an operational standpoint, although ideally every user would be equipped with a smart meter to enable detailed reconstruction of water consumption profiles, this is often impractical due to technical and economic limitations. Nevertheless, a sufficiently accurate characterization of total water consumption can still be achieved either through a representative user sample or by prioritizing the monitoring of high-consumption users and those with atypical consumption profiles [7].
The core component of the method consists of the identification of the spatial distribution of leakages in the WDN that minimizes the discrepancy between observed data and model outputs. Specifically, the iterative process begins with an initial scenario in which leakages are uniformly distributed across all network nodes. This scenario is then progressively refined by adjusting the leakage magnitude at each node until the simulated pressure data closely aligns with the observed pressure data. Specifically, the mean absolute error (MAE) between observed and simulated pressure at each sensor-equipped node can be adopted to assess how well each scenario reproduces the actual pressure conditions observed in the field.
The scenario characterized by the lowest MAE (final scenario) provides an indication of the WDN areas where the main leakages are most likely to occur and serves as the final output of the proposed integrated method. This information enables the water utility to promptly conduct on-site inspections and carry out necessary leakage repairs.
2.2. Case Study
The integrated digital-twin-based method for leakage localization was applied to a real-world WDN located in a flat region of Northern Italy, serving a group of small villages. The network extends over approximately 50 km and supplies about 1400 users, predominantly residential and small commercial or industrial. Daily average pressure head in the system is maintained around 30 m of water column, and, due to the flat topography and operating conditions, pressure-head variations across the network are limited, typically under a few meters of water column.
A preliminary assessment revealed a significant discrepancy between the average annual inflow (~12 L/s) and the billed users’ consumption (~4.5 L/s), indicating the potential presence of substantial leakages. To enable the application of the proposed methodology, traditional water meters of approximately 30% of users were replaced with smart meters capable of recording hourly water consumption. Priority for replacement was given to (i) users with older water meters (more prone to measurement errors) and (ii) highly demanding users. In parallel, 12 pressure sensors were strategically installed along the main lines and at specific branches of the WDN to ensure comprehensive spatial coverage and facilitate method application.
3. Results and Discussion
The method was applied to data collected over approximately ten days in March 2024. During this period, the average inflow to the system was 11.5 L/s. Users equipped with smart meters (~30% of the total) recorded an average water consumption of 1.5 L/s, notably lower than the related average yearly billed consumption (2.2 L/s), likely due to seasonal variation. Based on this, a seasonal correction factor was derived and applied to scale the yearly billed consumption of the remaining 70% of users without smart meters. This allowed for an estimated total consumption of approximately 4.7 L/s, resulting in an estimated leakage of 6.8 L/s. In addition, for users equipped with smart meters, the availability of hourly smart meter data enabled the accurate reconstruction of water-consumption profiles, which were subsequently normalized and transferred to the other users to model their daily consumption trends.
The WDN digital twin—incorporating both observed and estimated user water-consumption profiles—was then used to localize the leakages in the network. The initial scenario (with leakages uniformly distributed across the network nodes) resulted in substantial mismatches between simulated and observed pressure values for all pressure sensors. Through iterative refinement of leakage magnitude at each node, the final scenario yielded an average MAE of about 0.35 m—comparable to the uncertainty in pressure measurements and sensor elevation—and indicated a major leakage (3–4 L/s) in the northern area of the WDN, along with minor leakages (<1 L/s) elsewhere. This information was provided to the utility, which conducted on-site inspections and located a non-visible leakage of significant magnitude (i.e., approximately 3 L/s). Following prompt repair, the system inflow dropped from 11.5 to about 8.5 L/s and the leakage rate was nearly halved. This confirmed the effectiveness of the proposed method for leakage detection and localization.
4. Conclusions
This study presented the application to a real network of an integrated methodology for leakage localization in WDNs, combining hourly pressure and inflow measurements, user-level water consumption data and the network digital twin. Notably, the availability of hourly smart meter data enables the accurate reconstruction of user water-consumption profiles, which can be transferred to users not equipped with smart meters. Additionally, the deployment of many strategically placed pressure sensors makes it possible to spatially localize leakages within the WDN based on data comparison with simulated data provided by the digital twin. Overall, it is believed that the proposed approach can offer a robust and pragmatic framework for water utilities seeking to improve leakage mitigation through the integration of data and modeling tools.
Author Contributions
Conceptualization, S.A.; methodology, V.M. (Valentina Marsili), F.M., and S.A.; software, V.M. (Vittorio Micai); validation, V.M. (Valentina Marsili), F.M., and S.A.; formal analysis, V.M. (Vittorio Micai); investigation, V.M. (Vittorio Micai); resources, V.M. (Vittorio Micai); data curation, V.M. (Vittorio Micai); writing—original draft preparation, V.M. (Vittorio Micai); writing—review and editing, V.M. (Valentina Marsili), F.M., and S.A.; visualization, V.M. (Valentina Marsili) and F.M.; supervision, F.M.; project administration, S.A. All authors have read and agreed to the published version of the manuscript.
Funding
This research received no external funding.
Institutional Review Board Statement
Not applicable.
Informed Consent Statement
Not applicable.
Data Availability Statement
Dataset available on request from the authors.
Conflicts of Interest
The authors declare no conflicts of interest.
References
- Serafeim, A.V.; Perdios, A.; Fourniotis, N.T.; Kokosalakis, G.; Langousis, A. Assessing the environmental and economic foot-print of leakages in water distribution networks. Environ. Earth Sci. Proc. 2025, 32, 6. [Google Scholar] [CrossRef] [Scilit]
- Vrachimis, S.G.; Eliades, D.G.; Taormina, R.; Kapelan, Z.; Ostfeld, A.; Liu, S.; Kyriakou, M.; Pavlou, P.; Qiu, M.; Polycarpou, M.M. Battle of the leakage detection and isolation methods. J. Water Resour. Plan. Manag. 2022, 148, 04022068. [Google Scholar] [CrossRef] [Scilit]
- Marzola, I.; Mazzoni, F.; Alvisi, S.; Franchini, M. Leakage detection and localization in a water distribution network through comparison of observed and simulated pressure data. J. Water Resour. Plan. Manag. 2022, 148, 04017077. [Google Scholar] [CrossRef] [Scilit]
- Mazzoni, F.; Marsili, V.; Alvisi, S.; Franchini, M. Detection and pre-localization of anomalous consumption events in water distribution networks through automated, pressure-based methodology. Water Resour. Ind. 2024, 31, 100255. [Google Scholar] [CrossRef] [Scilit]
- Marsili, V.; Mazzoni, F.; Alvisi, S.; Franchini, M. From pressure to water consumption: Exploiting high-resolution pressure data to investigate the end uses of water. Water Resour. Manag. 2024, 38, 4969–4985. [Google Scholar] [CrossRef] [Scilit]
- Díaz, S.; González, J.; Lansey, K.; Pointl, M. Scale effects and implications of the stochastic structure of customer water demands. J. Hydroinform. 2024, 26, 1251–1272. [Google Scholar] [CrossRef] [Scilit]
- Alvisi, S.; Luciani, C.; Franchini, M. Using water consumption smart metering for water loss assessment in a DMA: A case study. Urban Water J. 2019, 16, 77–83. [Google Scholar] [CrossRef] [Scilit]
Disclaimer/Publisher’s Note: The statements, opinions and data contained in all publications are solely those of the individual author(s) and contributor(s) and not of MDPI and/or the editor(s). MDPI and/or the editor(s) disclaim responsibility for any injury to people or property resulting from any ideas, methods, instructions or products referred to in the content. |
© 2026 by the authors. Licensee MDPI, Basel, Switzerland. This article is an open access article distributed under the terms and conditions of the Creative Commons Attribution (CC BY) license.