


Abstract
In this study, we explored an electro-thermal de-icing system that minimizes ice accumulation while optimizing energy efficiency for drones operating at various altitudes. The research introduced an ideal heating schedule for a wing de-icing system by tailoring heating cycles to different flight altitudes. The heat flux is adjusted to maintain the surface temperature at 273 K, with a ±5 K margin to prevent temperature extremes. Two empirical formulas were developed to calculate the appropriate heat flux for each heating cycle, ensuring effective de-icing performance at varying altitudes. This approach eliminates the need for onboard sensors, as only the required heat flux value needs to be input to achieve effective de-icing.
1. Introduction
UAVs flying at medium to high altitudes are vulnerable to adverse weather such as high humidity, rainfall, snow, and clouds during ascent. These conditions pose a high risk of natural icing, known as strong icing conditions. Ice accumulation typically occurs at temperatures between +5 and −5 °C, which significantly impacts wing aerodynamics either during flight or before entering clouds. Therefore, effective anti-icing and de-icing systems are crucial for high-altitude UAVs.
Studies on wing icing, including Lankford’s wind tunnel tests [1], show that a 1/2 inch ice buildup reduces lift by 50% and increases drag significantly. The National Aeronautics and Space Administration conducted a series of studies on aircraft wing icing in the Icing Research Tunnel (IRT) at the Glenn Research Center and the Low Turbulence Pressure Tunnel (LTPT) at the Langley Research Center [2,3,4,5,6]. Cheng and Chen [7] used a three-dimensional simulation to investigate the fluid flow and heat transfer characteristics for hot-air jets impinging on the wing leading-edge surface to prevent ice accretion. The results encompass aspects such as the formation of ice on wing surfaces and its influence on aerodynamic characteristics, aiming for alignment with real-world scenarios of ice accumulation encountered during high-altitude flights.
Hsieh et al. [8] integrated the water droplet motion equation with ice accumulation theory to predict the shape of ice accumulation on the wing’s leading edge. They employed numerical methods to compute the pressure distribution and lift of the wing profile after icing and suggested that, as the atmospheric temperature approaches the freezing point, angular-shaped ice accumulations are more likely to form, leading to a significant decrease in lift. Conversely, below freezing, more regular frost-like ice accumulations develop, with less impact on the lift. Zhang et al. [9] used a two-dimensional numerical method to predict the shape of ice accumulation on the leading edge of airfoils. They used the Reynolds-averaged Navier–Stokes equation with the Renormalization Group k-ε turbulence model to determine the lift and drag characteristics of the aircraft under ice accumulation and found that it seriously affects the flight performance of the aircraft. Cebeci et al. [10] integrated calculation methodologies concerning wing ice accumulation, anti-icing system efficacy, and the influence of ice accumulation on aircraft performance in recent years. They suggest that accurately predicting the complex and stochastic behaviors of water droplets on wing surfaces, variability in ice surface roughness, and density of ice accumulation remains challenging with current methods. They advocate for further breakthroughs in this field to improve predictive accuracy.
Generally, manned aircraft are often equipped with de-icing or anti-icing devices, which can be activated by the pilot based on the flight plan and experience. As for anti-icing and de-icing issues on unmanned aircraft, on the one hand, several considerations arise. On one hand, the implementation of an anti-icing device may lead to increased aircraft weight and energy consumption, potentially affecting payload capacity and flight duration. On the other hand, it is necessary to tackle technical hurdles associated with deploying a series of sensors to detect icy cloud conditions and initiate appropriate countermeasures.
The periodic electric heating de-icing system employs electric heating to prevent ice accumulation on the aircraft surface through cycles of heating and cooling. Due to its relatively simple structure and easy controllability, electric thermal de-icing systems are widely utilized in aircraft. While previous studies have extensively examined the de-icing performance of electric heating systems, they have primarily focused on analyzing the de-icing surface temperature, with less attention paid to energy-saving considerations [11,12,13].
This study aims to explore the impact of periodic electric thermal de-icing systems on the unmanned aerial vehicle (UAV) wing icing and energy-saving characteristics. Specifically, in addressing the high-altitude anti-icing challenge for UAV wings, numerical methods are employed to explore the influence of de-icing device operating modes on UAV wing de-icing performance and energy consumption. Parameters under discussion include power supply, heat flux, periodic heating mode, and heating position. By carefully planning and optimizing these variables, it is possible not only to achieve effective anti-icing but also to utilize energy most efficiently, thereby enhancing the overall utility of UAVs. The findings of this study can serve as a reference for the future design of UAV anti-icing systems.
2. Research Methods
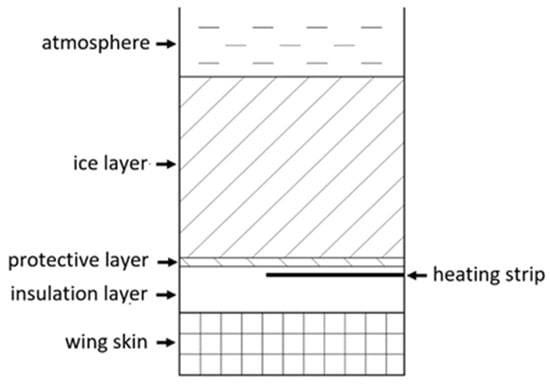
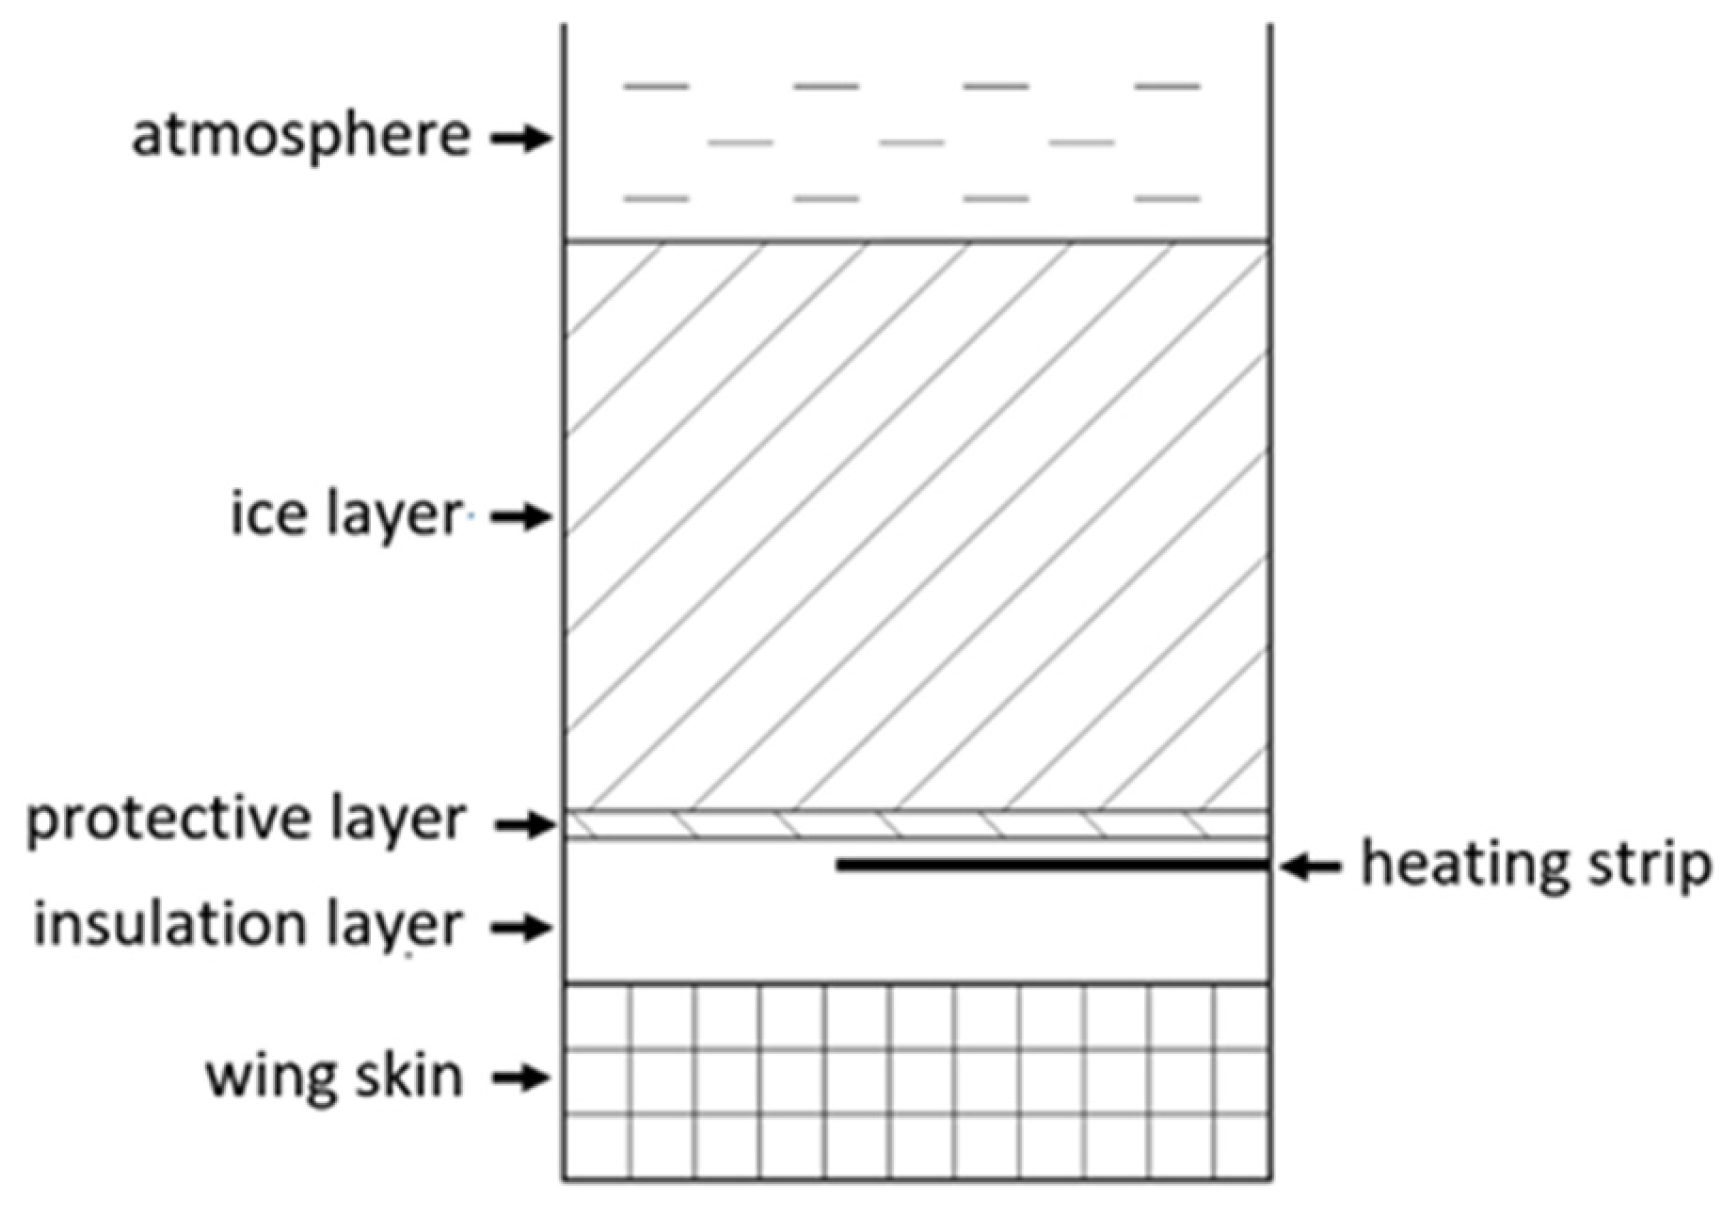
The physical system discussed in this study is illustrated in Figure 1. We focused on a typical composite structure electric de-icing device, consisting of several layers arranged from bottom to top: the wing skin, insulation layer, heating strip, protective layer, ice layer, and atmosphere. The insulation layer can be further divided into an inner insulation layer and an outer insulation layer, both made of epoxy glass material, providing electrical insulation for the heating strip embedded within. To ensure efficient heat transfer to the ice layer, the inner insulation layer must be thicker than the outer insulation layer. The protective layer serves to shield the de-icing device from erosion and corrosion caused by rainwater or other external pollutants, while also promoting uniform heat transfer. Relevant physical parameters of these layers are summarized in Table 1.
Figure 1.
Physical model of the multi-layer electro-thermal de-icing device.
Table 1.
Parameters of the composite structure electric de-icing device.
This article simulates the wing profile at an altitude of 25,000 feet, with an airspeed set to M∞ = 0.15. The density and viscosity coefficients are consistent with those of the atmosphere at the same altitude. The Reynolds number Re = 2 × 10⁶ can be deduced when the wing length is 1 m. The basic assumption of the flow field in this study is an unsteady two-dimensional viscous incompressible flow. Engineering Simulation and Innovation Computational Fluid Dynamics–Advanced Computational Environment heat flow analysis software is utilized for numerical simulation analysis. The discrete governing equation of the finite volume method is employed, and the pressure-based algorithm handles the pressure–velocity coupling operation and solves the pressure equation. Spatial discretization in the governing equation utilizes the second-order upwind method for calculating the convection term of the physical quantity system, and the central difference method for the diffusion term. In the time domain, a second-order accurate implicit method is employed for calculation.
To validate the correctness of the numerical method in this article, various scenarios are examined. Initially, with q″ = 45 kW, both the periodic heating and cooling times are set to 10 s, and the heating strip length ratio is 60%. By adjusting the number of grids in different X and Y directions from 40 × 200 to 80 × 400, it was observed that the changes in speed and temperature remained below 1%. Therefore, a grid resolution of 40 × 200 is sufficient to simulate the physical system adequately. For analyzing unsteady problems, the article assumes a zero heat flux in the steady state as the initial conditions. Subsequently, boundary conditions for periodic heating of the heating strip are introduced to conduct unsteady state calculations. To assess the accuracy of the unsteady state calculation results, computations are performed at both 2000 steps and 4000 steps per cycle. The observed difference in results falls within 1%, indicating that 2000 steps per cycle are adequate for simulating the non-steady state problem.
3. Results and Discussion
3.1. Effect of Control Parameters on De-Icing Surface Temperature Without Airflow
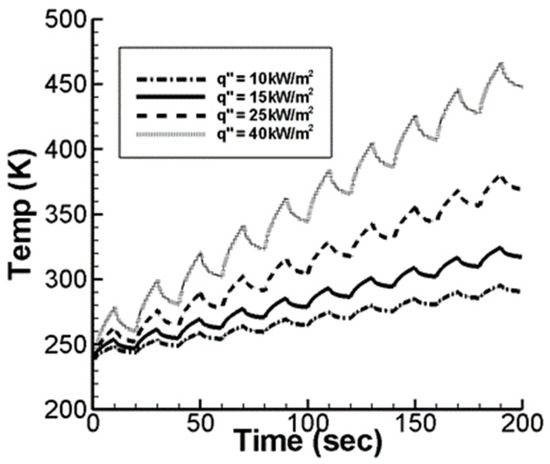
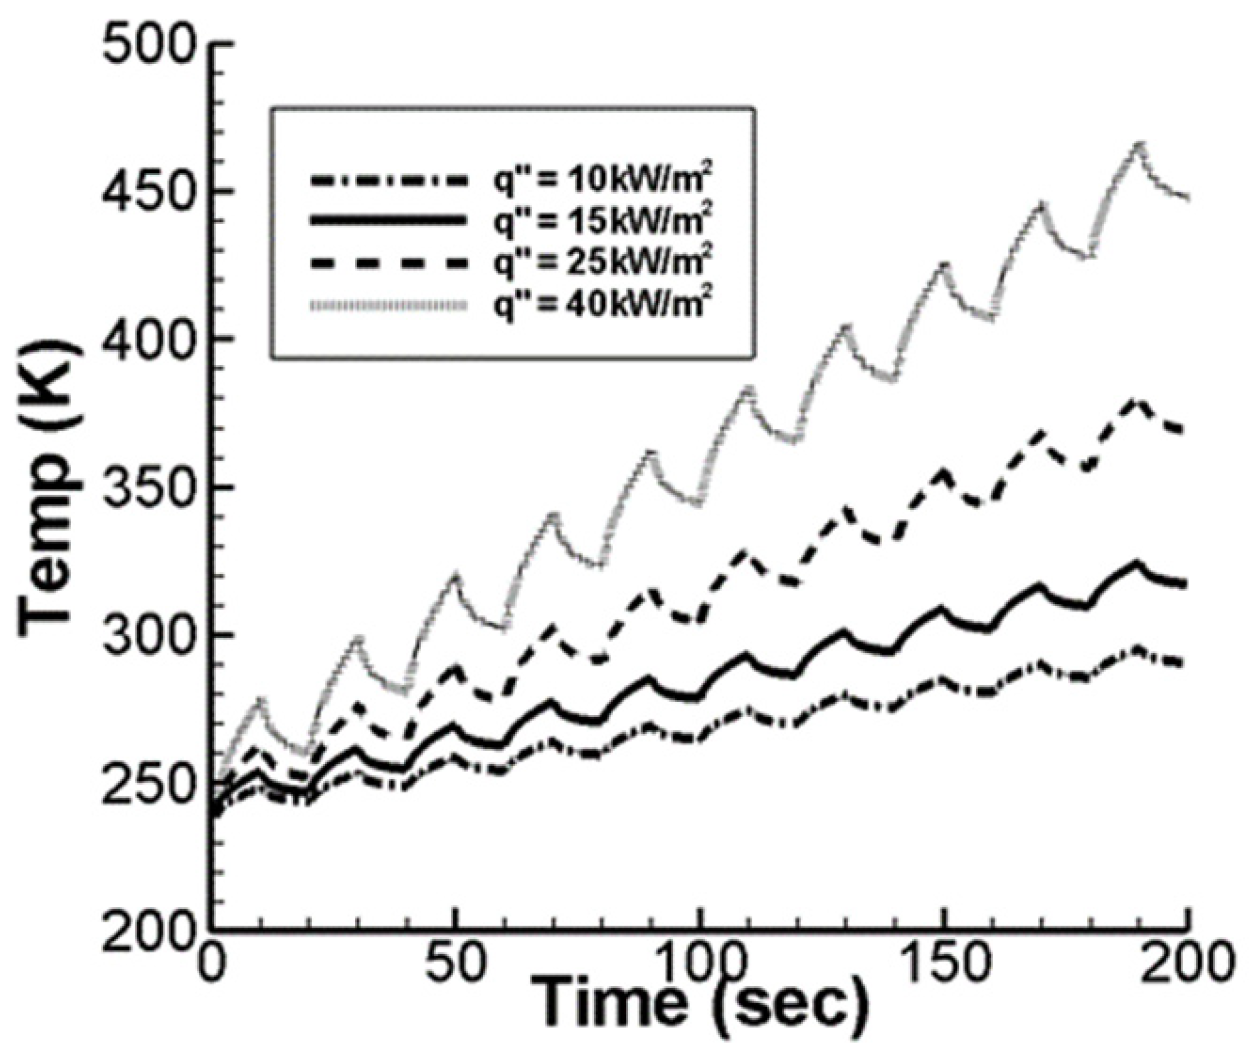
The influence of varying heat flux levels on the wing surface temperature was examined without airflow, a factor often omitted in existing studies. The de-icing system operated with 10 s heating and cooling cycles, with heat flux values of 10, 15, 25, and 40 kW/m2. Figure 2 shows that higher heat fluxes cause a faster temperature rise on the surface. This results in a higher residual temperature at the end of each cycle, which leads to further temperature increases in subsequent cycles. Higher heat fluxes reduce the time for the protective and ice layers to reach the de-icing temperature, preventing freezing on the wing surface. For heat fluxes of 10, 15, 25, and 40 kW/m2, the times to reach 273 K are approximately 107, 66, 28, and 8 s, respectively. The results show the significant effect of heat flux on de-icing. Figure 2 shows that surface temperature increases with longer heating times, and higher heat fluxes accelerate this rise. For example, with a 40 kW/m2 heat flux, the surface reaches 466.4 K in 200 s. While effective for quickly raising temperatures above 0 °C for de-icing, such high heat fluxes may cause excessive heating and are not suitable for prolonged use. A higher heat flux reduces de-icing time, improving flight safety, but consumes more power. Thus, an optimal heating strategy is needed to balance efficiency and energy consumption.
Figure 2.
De-icing surface temperature over time without airflow, with 10 s heating/cooling cycles and heat fluxes of 10, 15, 25, and 40 kW/m2.
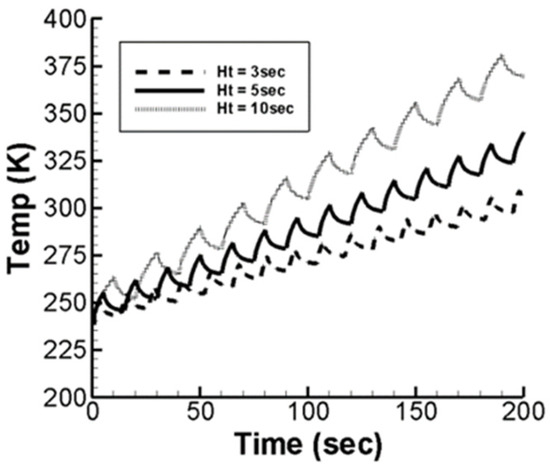
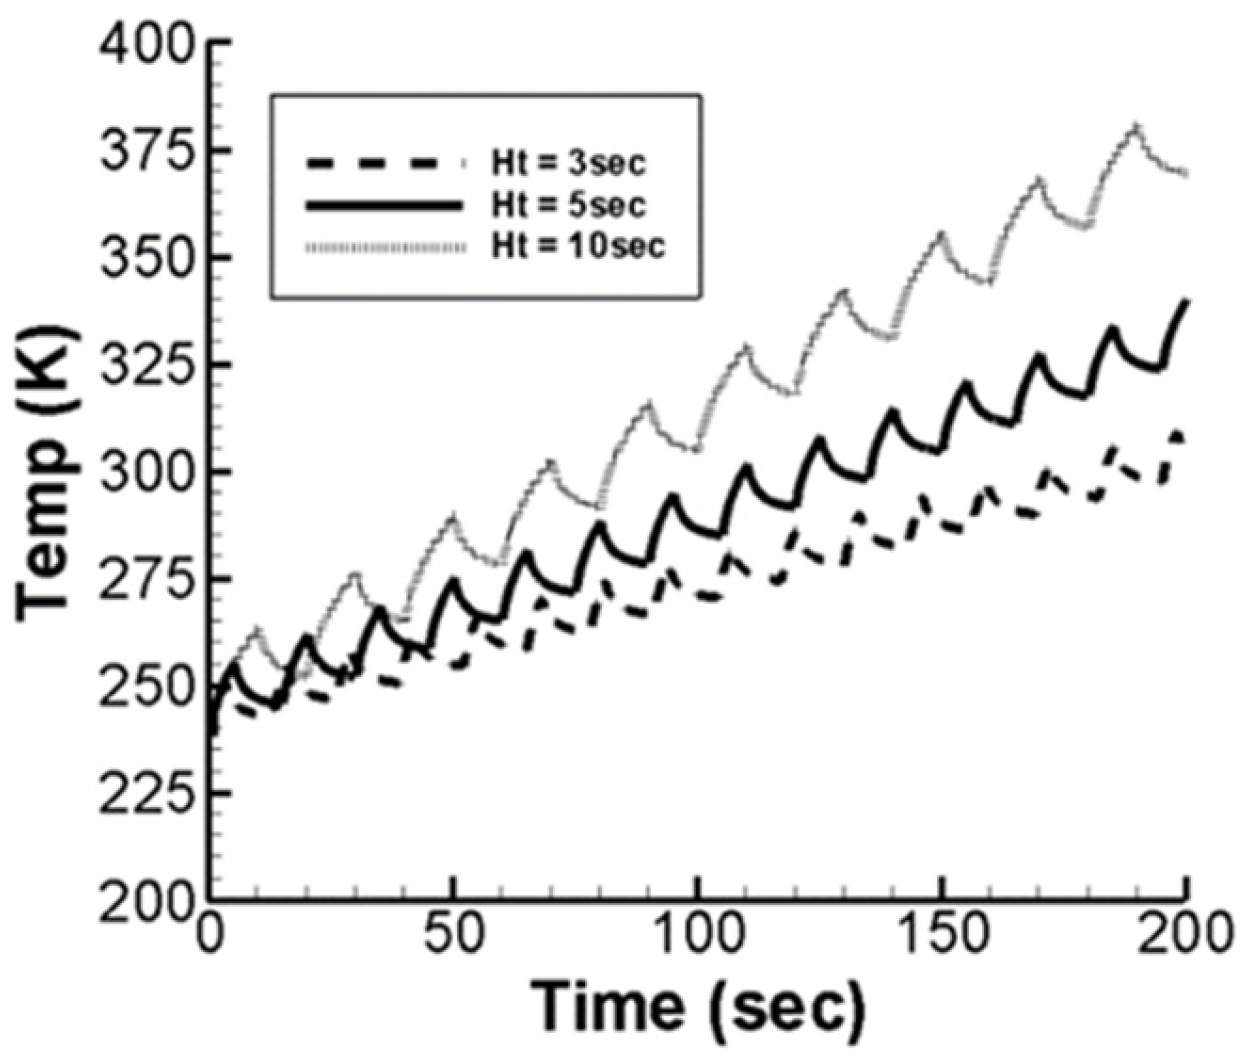
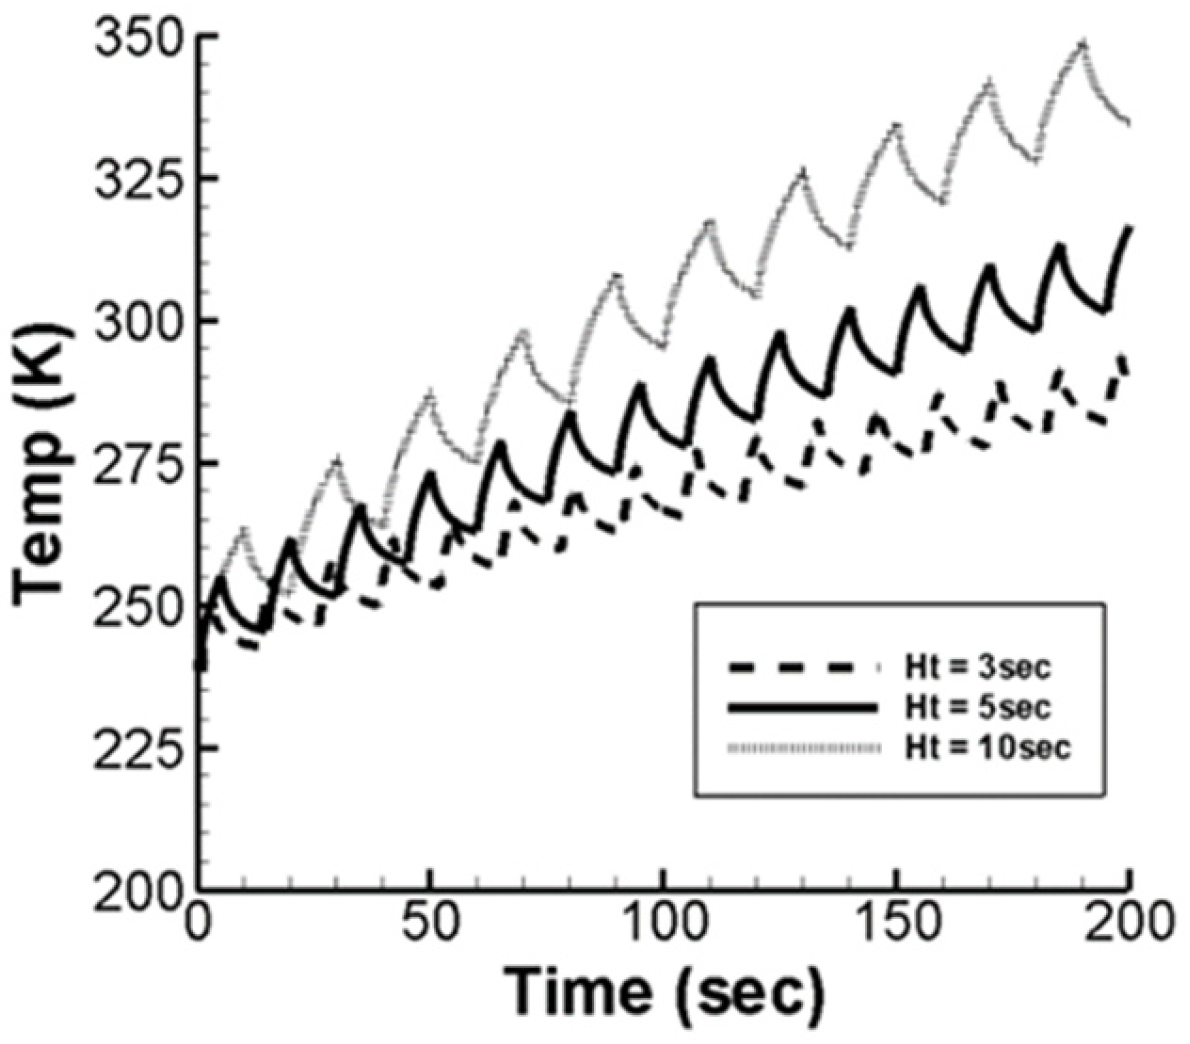
Next, we discussed the effect of heating time on the wing surface temperature without considering airflow. The heat flux provided by the heating strip remains constant at 25 kW/m2, and the periodic de-icing cooling time is fixed at 10 s. The changes in de-icing surface temperature for heating times of 3, 5, and 10 s are shown in Figure 3. Under a fixed heat flux and cooling time, varying the heating time affects the temperature fluctuation and de-icing efficiency. Longer heating times increase the amplitude of temperature fluctuations and correlate with higher temperature rises. For heating times of 3, 5, and 10 s, the de-icing temperature is reached in 80.47 s (7th cycle), 49.8 s (4th cycle), and 27.7 s (2nd cycle), respectively. A 3 s heating time takes too long to achieve de-icing, making it unsuitable for anti-icing. However, it avoids excessively high temperatures after 200 s, minimizing structural impact on the wing. Conversely, a 10 s heating time shortens the de-icing duration but leads to higher temperatures after 200 s, increasing structural impact.
Figure 3.
De-icing surface temperature over time without airflow, at 25 kW/m2 heat flux, with 10 s cooling and heating times of 3, 5, and 10 s.
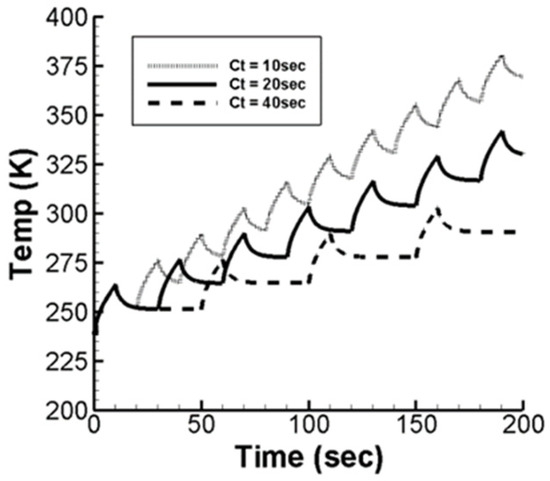
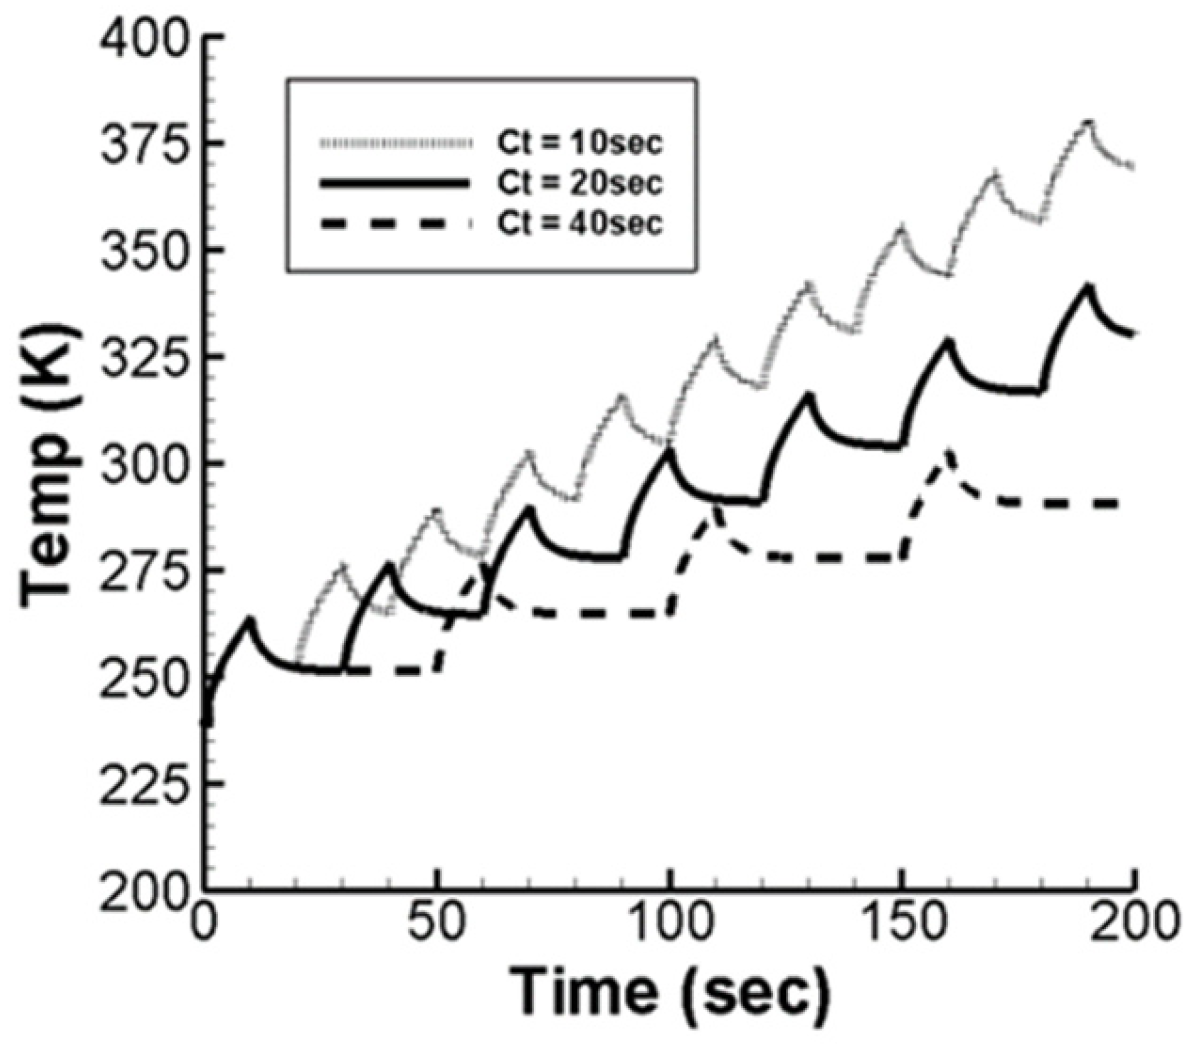
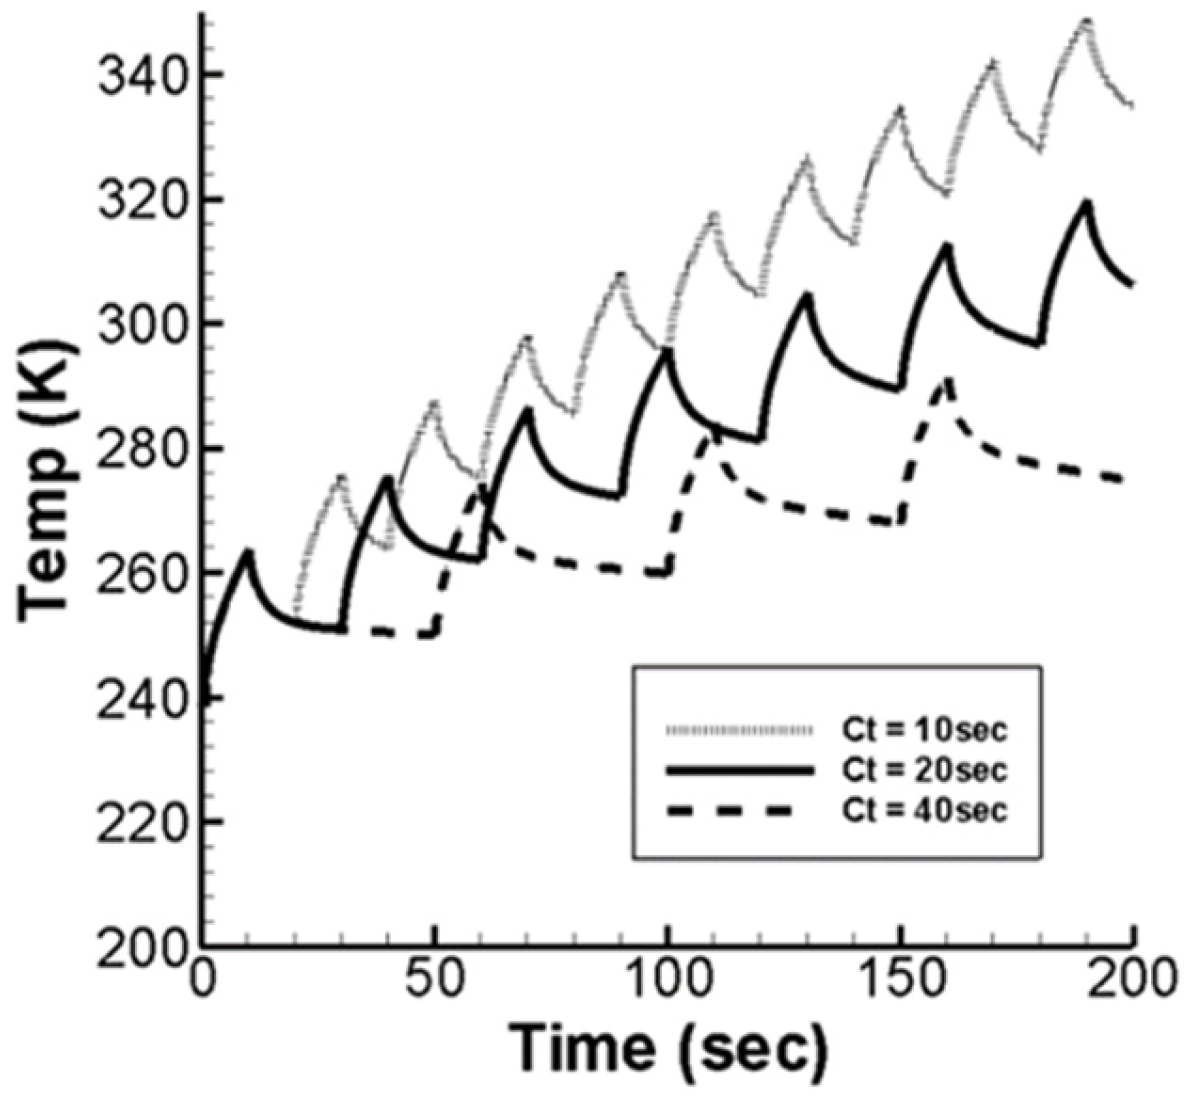
The effect of cooling times on wing surface temperature without airflow was analyzed with a fixed heat flux of 25 kW/m2 and a 10 s periodic heating time. Figure 4 illustrates the temperature changes under cooling times of 10, 20, and 40 s. Varying cooling times influence the amplitude of temperature fluctuations, with longer cooling times leading to smaller temperature rises after heating. As cooling time increases to 10, 20, and 40 s, the time required to reach the de-icing temperature rises to 27.7, 37.7, and 57.6 s, respectively. Longer cooling times also reduce the residual temperature on the de-icing surface, though the decrease is not uniform. For example, with a 40 s cooling time, the temperature drops rapidly during the first 10 s, and then slows as residual heat within the wing limits further cooling. In summary, longer cooling times result in gentler temperature rises and longer durations to achieve de-icing, while shorter cooling times produce faster rises and shorter durations. These insights can inform the planning of optimal heating modes.
Figure 4.
De-icing surface temperature over time without airflow, at 25 kW/m2 heat flux, with 10 s heating and cooling times of 10, 20, and 40 s.
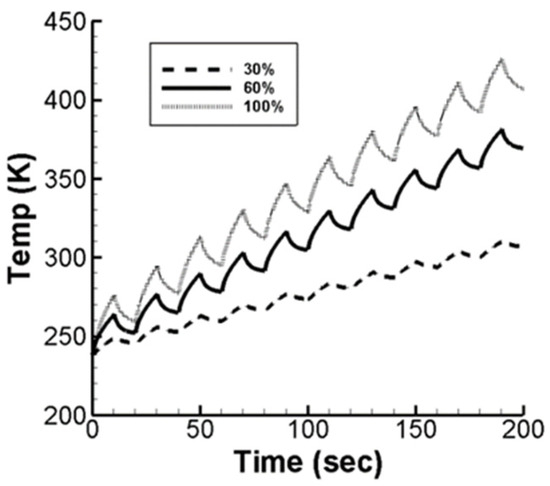
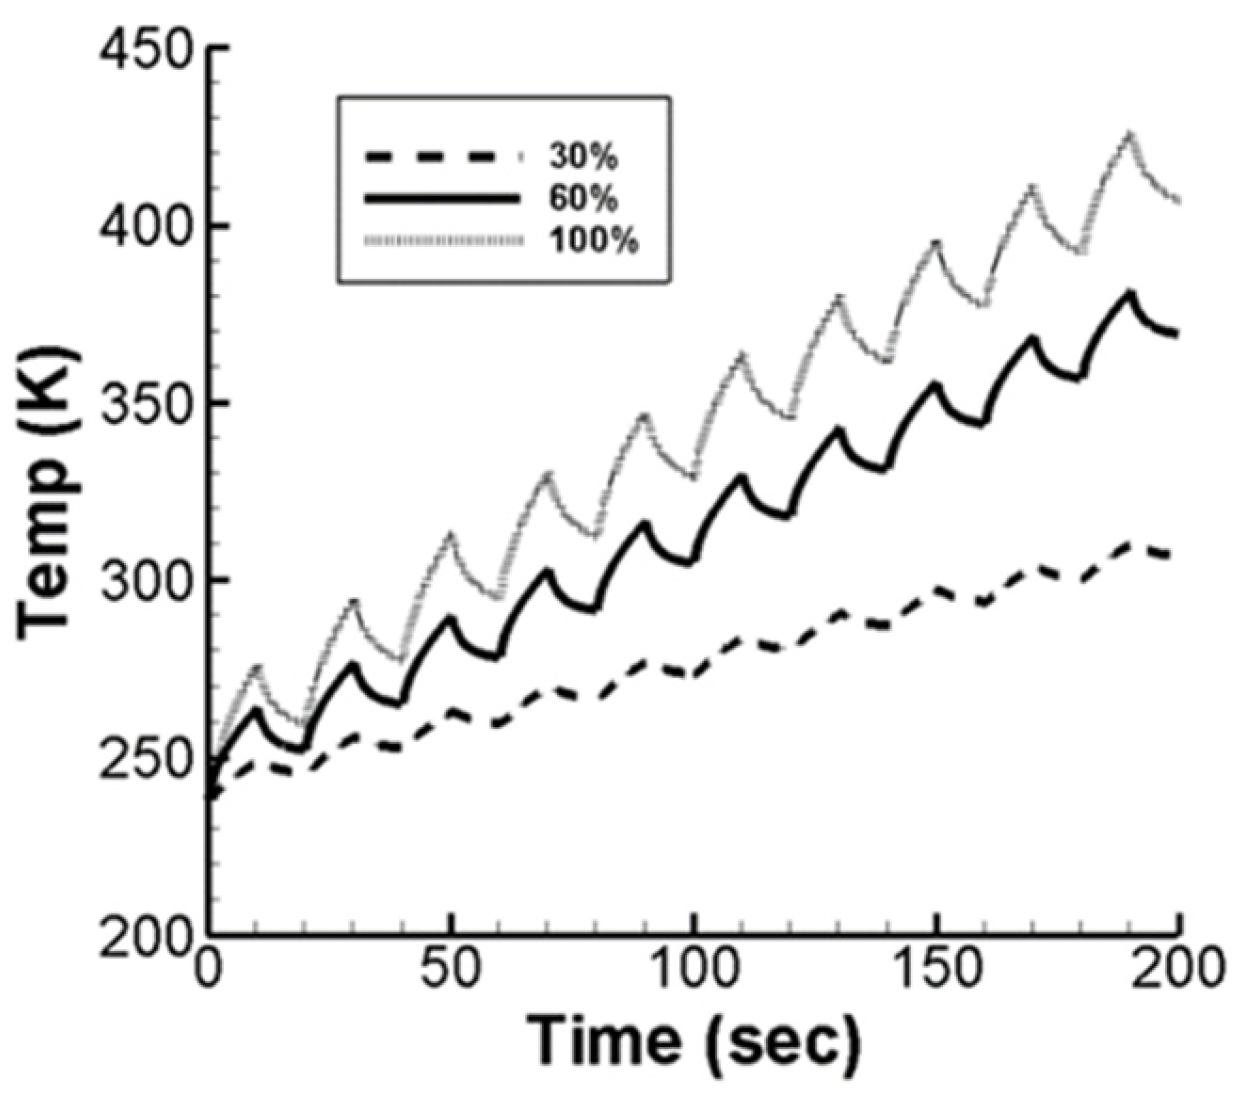
We explored the effect of heating strip lengths on wing surface temperature under a fixed heat flux of 25 kW/m2, with 10 s heating and cooling cycles. The heating strip length ratio is defined as the strip length relative to the skin length. As shown in Figure 5, increasing the heating strip length results in larger temperature fluctuations and greater temperature rise amplitudes. For heating strip length ratios of 30%, 60%, and 100%, the de-icing temperature is reached in 85.6 s (5th cycle), 27.7 s (2nd cycle), and 8.6 s (1st cycle), respectively. The corresponding maximum temperatures at 200 s are 310.25 K, 381.05 K, and 426.16 K. Longer heating strips lead to steeper temperature slopes, higher peak temperatures, and faster de-icing.
Figure 5.
De-icing surface temperature over time without airflow, at 25 kW/m2 heat flux, with 10 s heating/cooling and heating strip length ratios of 30%, 60%, and 100%.
3.2. Effects of Control Parameters on De-Icing Surface Temperature with Airflow
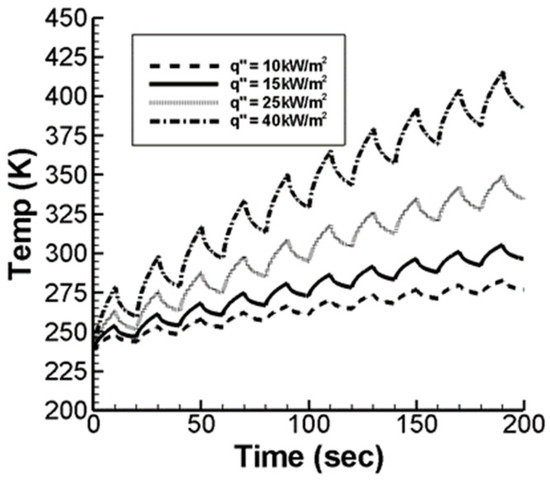
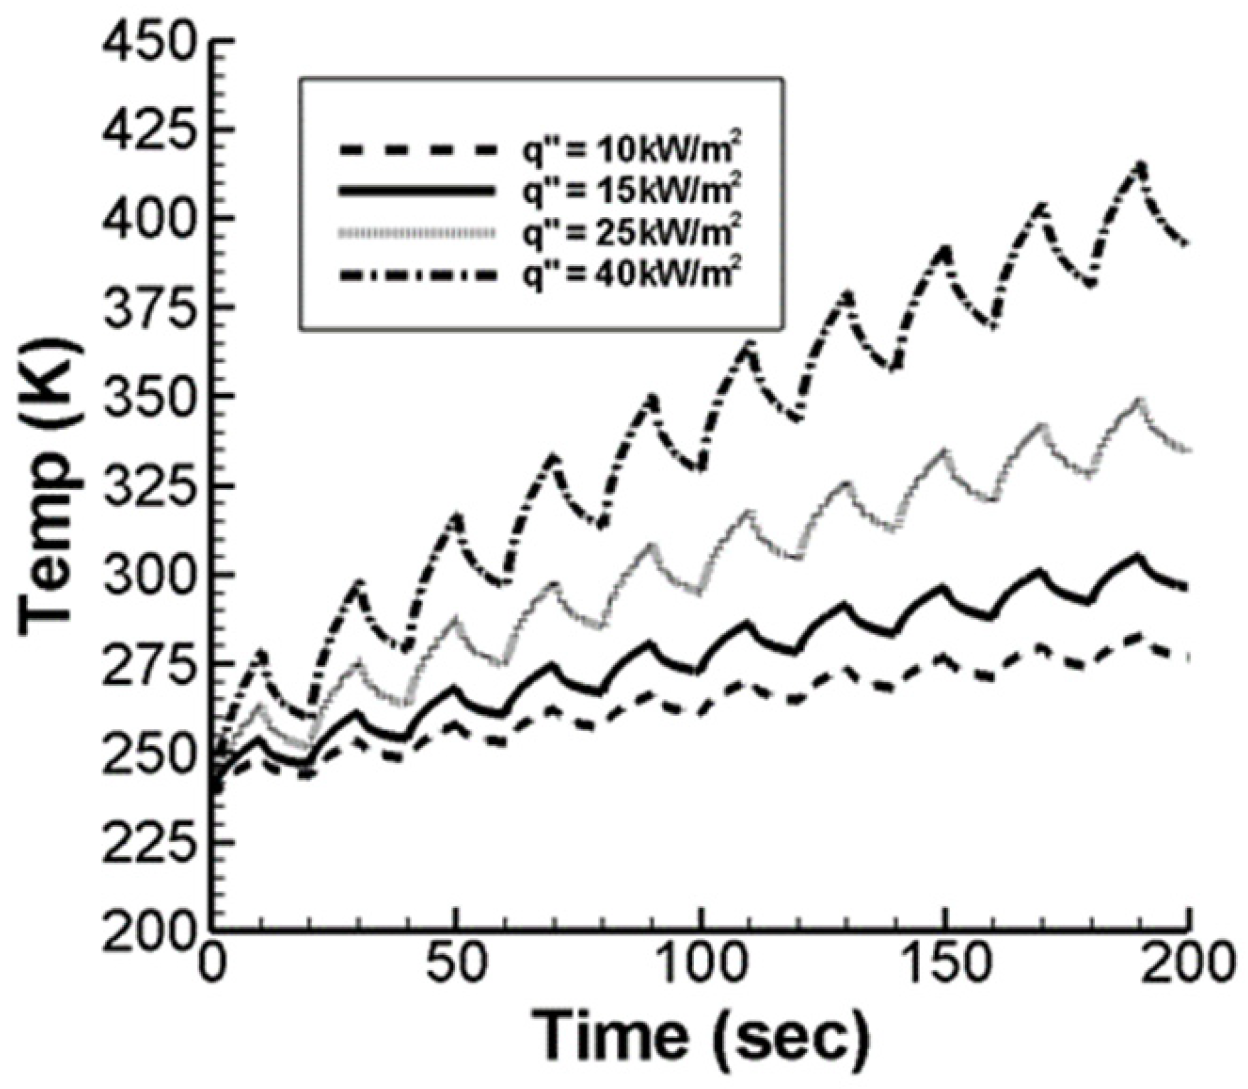
Including airflow effects provides more realistic simulation results compared to static conditions. The simulations are conducted at an altitude of 25,000 feet with an airspeed of M∞ = 0.15, maintaining consistent density and viscosity coefficients for the altitude. The wing length is standardized at 1 m, yielding a Reynolds number of Re = 2 × 10⁶. The study examines how varying heat fluxes affect wing surface temperature under airflow. The de-icing system operates with 10 s heating and cooling cycles, and heat fluxes of 10, 15, 25, and 40 kW/m2 are analyzed. As shown in Figure 6, the required de-icing times are 128.5, 68.3, 28.0, and 7.7 s, respectively. Maximum temperatures at 200 s are 282.9, 305, 349.3, and 415.7 K. Airflow over the surface significantly influences temperature dynamics, reducing de-icing times and altering maximum temperature levels. These findings demonstrate the importance of considering airflow in de-icing system simulations.
Figure 6.
De-icing surface temperature over time with airflow, with the 10 s heating/cooling cycles and heat fluxes of 10, 15, 25, and 40 kW/m2.
Comparing results with and without airflow (Figure 2) reveals a similar temperature trend, with temperatures rising over time. However, airflow slightly lowers the wing surface temperature. During the first 50 s, the temperature difference is minimal but widens in later cycles, indicating residual heat buildup beneath the wing skin after the initial heating cycle. Table 2 shows the comparison of time to reach 273 K under varying heat fluxes (10, 15, 25, and 40 kW/m2) with and without airflow. Higher heat fluxes show minimal time differences to reach the de-icing temperature, while lower fluxes significantly increase the time difference. At 200 s, higher heat fluxes also result in larger temperature differences; for instance, at 40 kW/m2, the difference is 51 K. These findings highlight the influence of airflow, particularly under low heat flux and over extended operation.
Table 2.
The time (in second) required for the de-icing surface to reach 273 K, with periodic heating and cooling times both set at 10 s.
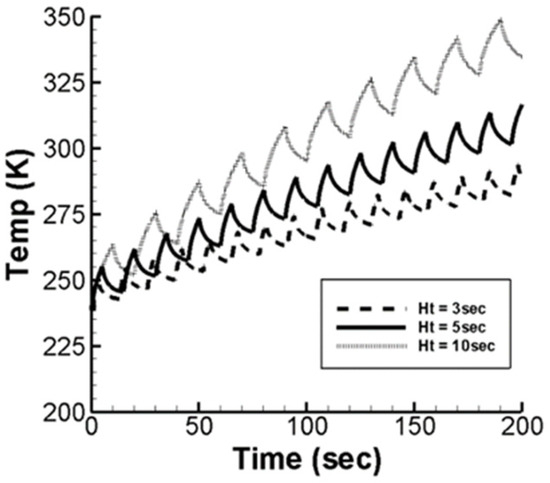
We examined the effect of heating time on wing surface temperature with airflow. The heat flux is fixed at 25 kW/m2, with a 10 s cooling cycle and heating times of 3, 5, and 10 s. Figure 7 shows that, under airflow, the de-icing times are 93.4, 49.8, and 28.0 s, respectively, while the maximum temperatures at 200 s are 293.7, 316.7, and 349.3 K. Compared with the results without airflow (Figure 3), both scenarios follow the same temperature trend, but airflow reduces the temperature rise slope.
Figure 7.
De-icing surface temperature over time with airflow, at 25 kW/m2 heat flux, with 10 s cooling and heating times of 3, 5, and 10 s.
Table 3 shows the de-icing times to reach 273 K under airflow for the given heating times. Longer heating times have minimal impact on de-icing time, but shorter heating times significantly increase it. Regarding maximum temperatures at 200 s, airflow effects are more pronounced with longer heating times. For example, with a 10 s heating time, the maximum temperature difference reaches 32 K. These findings highlight the interplay between airflow and heating time in de-icing performance.
Table 3.
Time to reach 273 K with a heat flux of 25 kW/m2 and a constant 10 s cooling time.
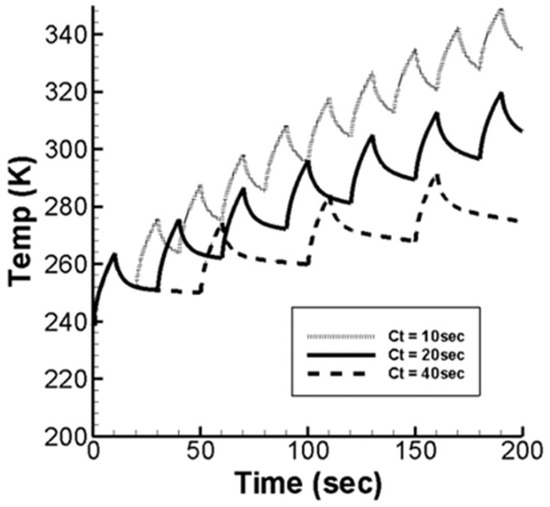
We also examined the effect of cooling time on wing surface temperature with airflow. The heat flux is fixed at 25 kW/m2, with a 10 s heating cycle and cooling times of 10, 20, and 40 s. Figure 8 shows that, with airflow, the de-icing times are 28.0, 38.2, and 58.8 s, while the maximum temperatures at 200 s are 349.2, 319.7, and 292.1 K, respectively. Compared with the results without airflow (Figure 4), both scenarios show similar temperature trends, but airflow reduces the temperature rise slope. Table 4 shows the de-icing times to reach 273 K with and without airflow for the given cooling times. Cooling time has little impact on the time needed to reach the de-icing temperature. However, airflow significantly affects the maximum temperatures at 200 s, especially with shorter cooling times. For instance, with a 10 s cooling time, the maximum temperature difference is 32 K. These findings highlight the impact of cooling time and airflow on de-icing performance.
Figure 8.
De-icing surface temperature over time with airflow, at 25 kW/m2 heat flux, with 10 s heating, and cooling times of 10, 20, and 40 s.
Table 4.
Time to reach 273 K with a heat flux of 25 kW/m2 and a constant 10 s heating time.
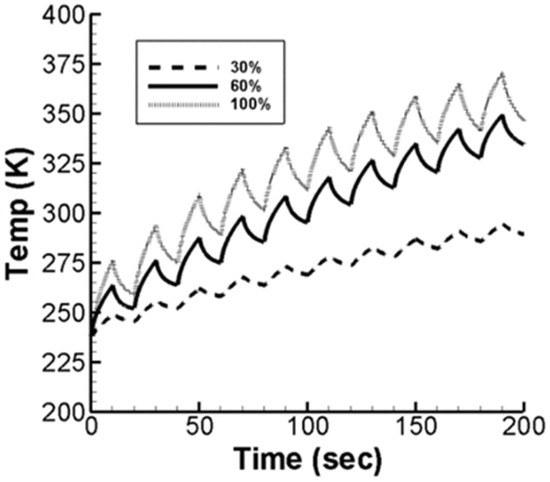
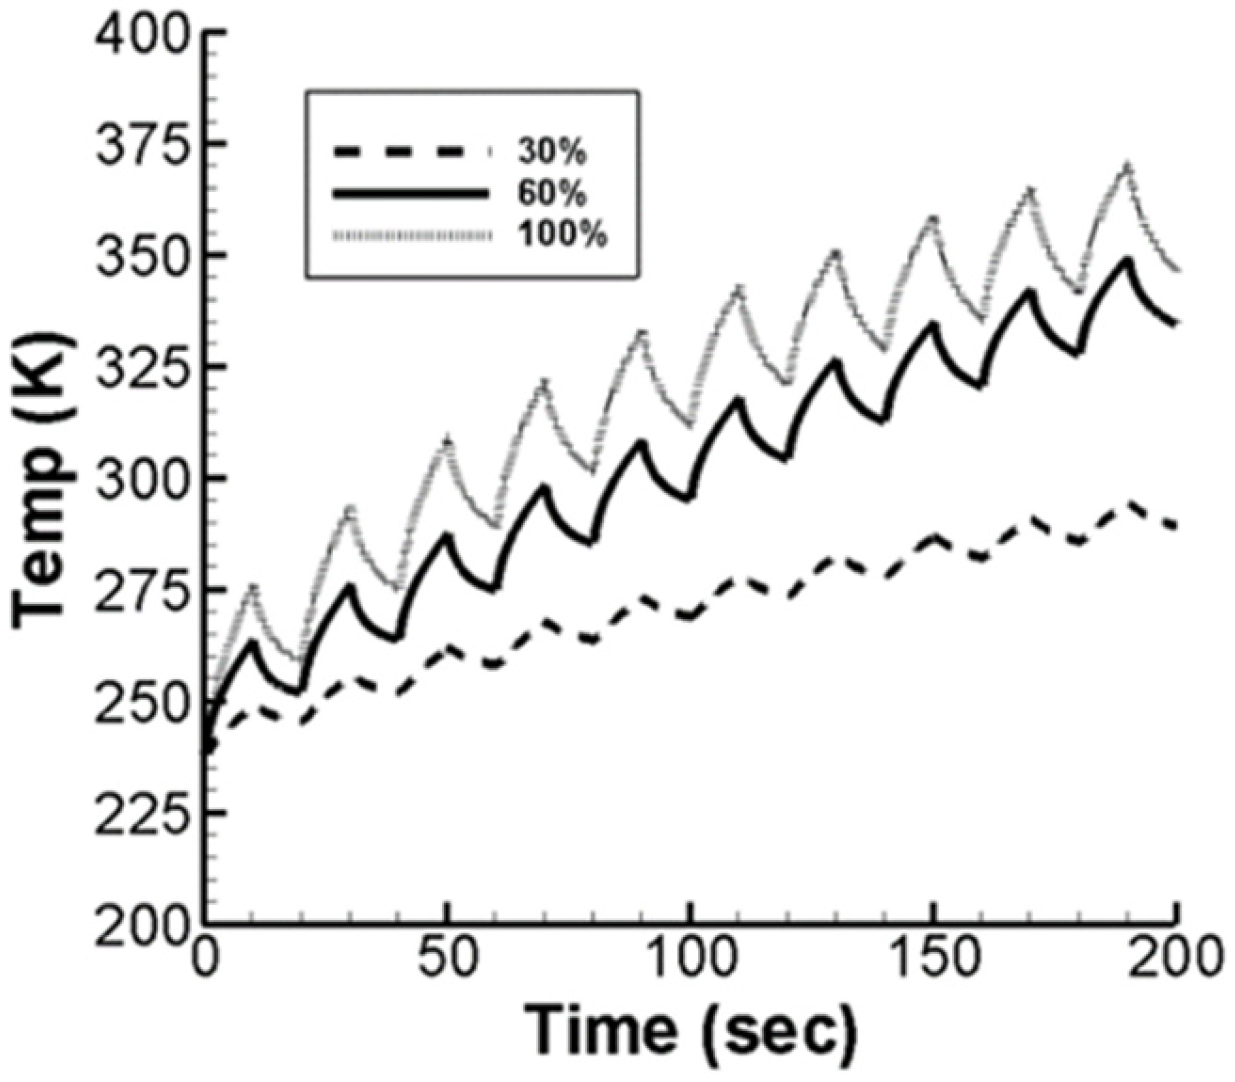
The effect of heating strip length is examined on wing surface temperature under airflow. The heat flux is fixed at 25 kW/m2, with 10 s heating and cooling cycles. De-icing surface temperatures are analyzed for heating strip length ratios of 30, 60, and 100%. Figure 9 shows that, with airflow, the de-icing times are 103.8, 28.0, and 8.6 s, and the maximum temperatures at 200 s are 294.3, 349.3, and 370.6 K, respectively. Compared with the results without airflow (Figure 5), the same temperature trend is observed, but airflow reduces the temperature rise slope.
Figure 9.
De-icing surface temperature over time with airflow, at 25 kW/m2 heat flux, with 10 s heating/cooling and heating strip length ratios of 30%, 60%, and 100%.
Table 5 shows the time to reach 273 K for the heating strip length ratios with and without airflow. Larger heating strip lengths significantly reduce de-icing time compared to smaller lengths. At 200 s, the maximum temperature differences are more pronounced for longer strips. For example, with a 100% heating strip length ratio, the temperature difference reaches 56 K.
Table 5.
Time (in seconds) to reach 273 K with a heat flux of 25 kW/m2 and 10 s heating and cooling cycles.
These results suggest that alterations in parameters such as heat flux, heating time, cooling time, and heating strip length ratio effectively illustrate the variations in the de-icing surface with and without airflow. The presence of airflow on the de-icing surface leads to greater heat dissipation.
3.3. Discussion on the Matching of Ideal Heating Cycle at Different Flying Altitudes
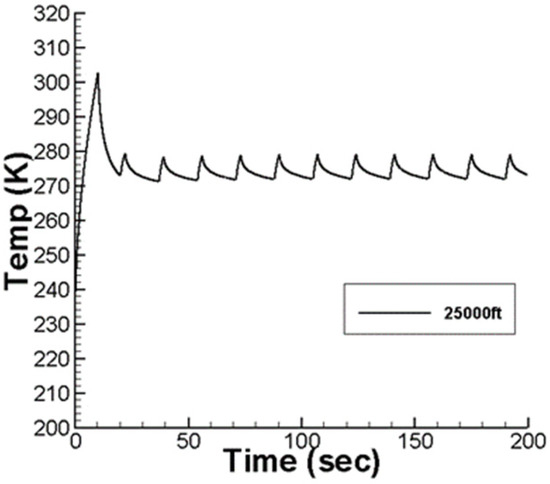
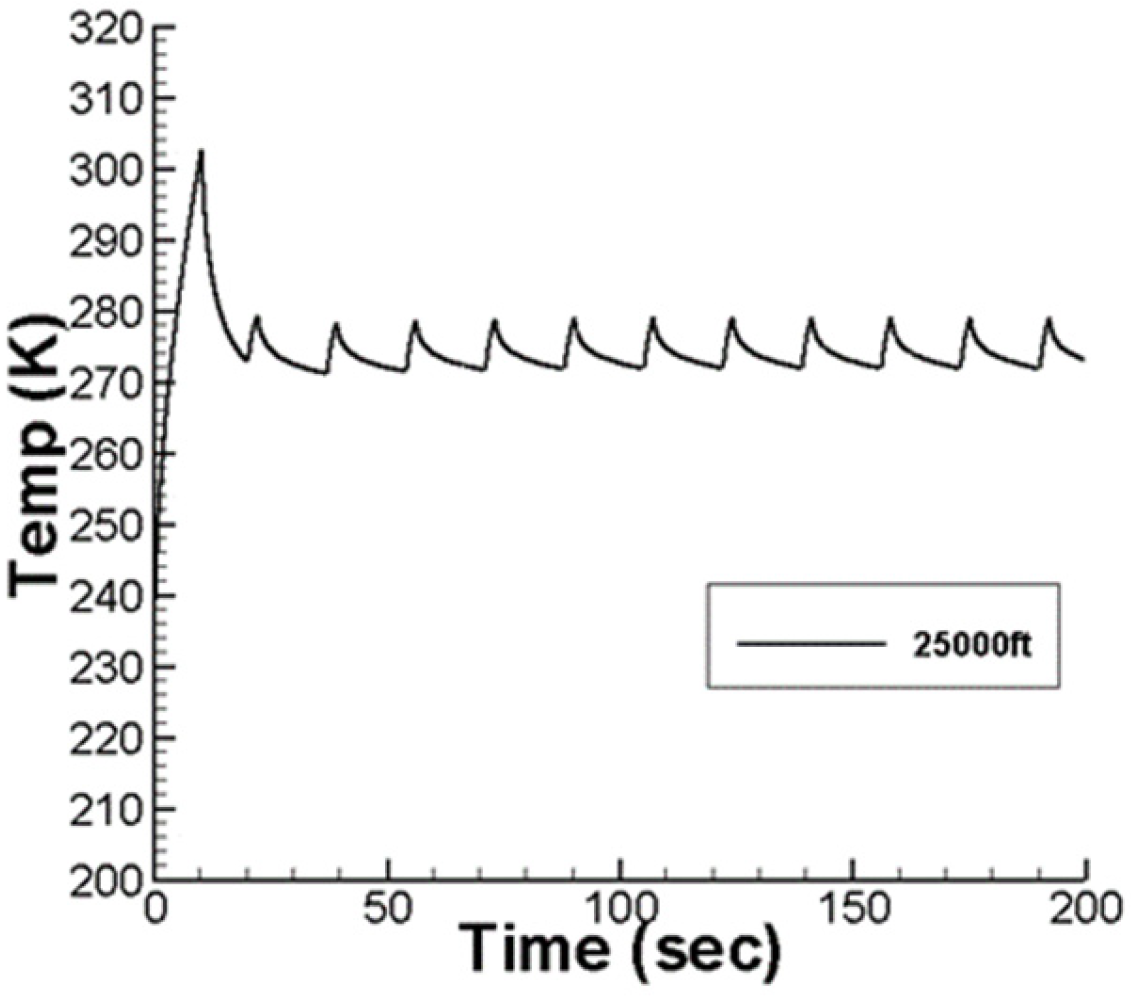
We developed a more ideal heating mode for the wing de-icing system. Here, we explored the optimal heating method based on various flying altitudes. In the initial cycle, the heat flux is set such that the de-icing surface temperature rises above 273 K within 3.6 s, and then cools down to 273 K afterward. For subsequent cycles, the heat flux is adjusted to maintain the de-icing surface temperature oscillating around ±5 K at 273 K, ensuring that it neither exceeds nor falls below this threshold. In the scenario where the heating strip’s length is set at 60%, both the heating and cooling times for the first cycle are 10 s. Following this, the heating time after the second cycle is fixed at 2 s, and the cooling time is fixed at 15 s. For flying altitudes of 10,000, 15,000, 25,000 ft, 35,000, and 40,000 ft, multiple tests were conducted to meet the above predetermined conditions. The heat fluxes applied during the first cycle were determined to be 8.71, 27.06, 63.77, 100.42, and 104.48 kW/m2, respectively, which meet the pre-specified conditions. Similarly, the heat fluxes for the second cycle were set at 2.625, 8.250, 19.5, 29.75, and 31.5 kW/m2, respectively. With these heat flux values, the heat dissipated to the environment balances with the heat generated by the de-icing system. If the heat flux exceeds these values, the temperature of the de-icing surface will gradually rise due to the excess heat generated by the de-icing system. Conversely, if the heat flux falls below these values, the temperature of the de-icing surface will gradually decrease due to the inadequate heat generated by the de-icing system. The results for the altitude of 25,000 ft are illustrated in Figure 10.
Figure 10.
The variation in the de-icing surface temperature over time using the optimal heating model with the heat flux method, following empirical equations at the altitude of 25,000 ft.
Through the aforementioned heating cycle matching method, the heating flux for both the first and second cycles at each altitude can be determined. Utilizing numerical regression, two empirical formulas can be derived. These formulas enable the anti-icing system to calculate the appropriate heat flux required for each period at every altitude, ensuring the wings maintain effective anti-icing capabilities. The empirical equations obtained from the data are as follows.
where q″ is the heat flux and h is the height. Two empirical formulas are derived through numerical regression methods. The system utilizes these formulas to calculate the heat flux after the first and second cycles, thereby matching the heating cycle mode to maintain the wing at the anti-icing temperature. Furthermore, this heating method eliminates the need for sensors on the wing; it only requires inputting heat to achieve the wing’s anti-icing effect.
4. Conclusions
The results obtained in electric heating de-icing show that, the shorter the de-icing time, the greater the heat flux, which is more beneficial for flight safety, but also results in higher energy consumption. Changing the periodic heating mode also significantly affects the surface temperature of the wing. When the heating cycle is poorly set, the surface temperature of the wing gradually increases due to residual heat, leading to unnecessary energy consumption. Under the ideal periodic heating conditions of the first and second cycles, the heat taken away by the external environment can balance the heat generated by the de-icing system. When the heat flux given exceeds these values, the temperature of the de-icing surface increases because the heat generated by the de-icing system exceeds the heat taken away by the external environment. By matching the ideal heating cycle, the heat flux obtained after the first and second cycles can be calculated through numerical regression methods, and two empirical formulas can be derived. This allows for the determination of the effective heat flux required for each cycle at various altitudes, thereby maintaining the anti-icing capability of the wing anti-icing system. By examining the influence of various parameters of the anti-icing system on the thermal transfer performance of the wing surface and allocating the parameters, the ideal electric heating de-icing mode was developed. This achieves anti-icing effects but also maximizes the efficient utilization of energy, achieving energy-saving effects, and enhancing the value of unmanned aircraft.
Author Contributions
Conceptualization, J.-C.C.; methodology, J.-C.C.; software, C.-Y.L.; validation, J.-C.C. and C.-Y.L.; formal analysis, J.-C.C. and C.-Y.L.; investigation, J.-C.C. and C.-Y.L.; resources, J.-C.C.; data curation, J.-C.C.; writing—original draft preparation, C.-Y.L.; writing—review and editing, C.-Y.L.; visualization, C.-Y.L.; supervision, J.-C.C.; project administration, J.-C.C.; funding acquisition, J.-C.C. All authors have read and agreed to the published version of the manuscript.
Funding
This research received no external funding.
Institutional Review Board Statement
Not applicable for studies not involving humans or animals.
Informed Consent Statement
Not applicable.
Data Availability Statement
Data is contained within the article.
Conflicts of Interest
The authors declare no conflicts of interest.
References
- Lankford, T.T. Aircraft Icing; McGraw-Hill Inc.: New York, NY, USA, 2000; pp. 68–71. [Google Scholar]
- Shin, J.; Wilcox, P.; Chin, V.; Sheldon, D. Icing Test Results on an Advanced Two-Dimensional High-Lift Multi-Element Airfoil. In Proceedings of the Applied Aerodynamics Conference, Colorado Springs, CO, USA, 20–22 June 1994. [Google Scholar]
- Vickerman, M.; Choo, Y.; Braun, D.; Baez, M.; Gnepp, S. SmaggIce: Surface Modeling and Grid Generation for Iced Airfoils-Phase 1 Results. In Proceedings of the 38th Aerospace Sciences Meeting and Exhibit, Reno, NV, USA, 10–13 January 2000. [Google Scholar]
- Levinson, L.; Potapczuk, M.; Mellor, P. Software Development Processes Applied to Computational Icing Simulation. In Proceedings of the 37th Aerospace Sciences Meeting and Exhibit, Reno, NV, USA, 11–14 January 1999. [Google Scholar]
- Potapczuk, M.G. A Review of NASA Lewis’ Development Plans for Computational Simulation of Aircraft Icing. In Proceedings of the 37th Aerospace Sciences Meeting and Exhibit, Reno, NV, USA, 11–14 January 1999. [Google Scholar]
- Wright, W.B. A Summary of Validation Results for LEWICE 2.0. In Proceedings of the 37th Aerospace Sciences Meeting and Exhibit, Reno, NV, USA, 11–14 January 1999. [Google Scholar]
- Cheng, J.C.; Chen, Y.M. Investigation of Fluid Flow and Heat Transfer Characteristics for a Thermal Anti-icing System of a High-Altitude and Long-Endurance UAV. J. Mech. 2021, 37, 467–483. [Google Scholar] [CrossRef] [Scilit]
- Hsieh, S.J.; Hsieh, Y.H.; Zhu, K.Y. Prediction of Ice Accumulation and Aerodynamic Performance Degradation on Two-Dimensional Wings. In Proceedings of the Academic Proceedings of the Fourth Cross-Strait Aerospace Symposium, Nanjing, China, 29 August 2004; pp. 80–89. (In Chinese) [Google Scholar]
- Zhang, Q.; Cao, Y.H.; Pan, X.; Jiang, C.W. Effect of Ice Accretion on Aircraft Flight Performance. J. Beijing Univ. Aeronaut. Astronaut. 2006, 32, 654–657. (In Chinese) [Google Scholar]
- Cebeci, T.; Kafyeke, F. Aircraft Icing. Annu. Rev. Fluid Mech. 2003, 35, 11–21. [Google Scholar] [CrossRef] [Scilit]
- Chang, S.-N.; Hou, Y.-Q.; Yuan, X.-G. The Influence of Periodic Heating Control Law on De-Icing Surface Temperature. J. Aerosp. Power 2007, 22, 1247–1251. (In Chinese) [Google Scholar]
- Masiulaniec, K.C.; Wright, W.B. User’s Manual for the NASA Lewis Ice Accretion/Heat Transfer Prediction Code with Electrothermal Deicer Input; NASA Contract Report 4530 (DOT/FAA/CT-TN92/33); NASA: Washington, DC, USA, 1994. [Google Scholar]
- Keith, T.G.; Masiulaniec, K.C.; Dewitt, K.J.; Chao, D.F. Predicted Electro-thermal De-icing of Aircraft blades. In Proceedings of the 22nd Aerospace Sciences Meeting, Reno, NV, USA, 9–12 January 1984. [Google Scholar]

Disclaimer/Publisher’s Note: The statements, opinions and data contained in all publications are solely those of the individual author(s) and contributor(s) and not of MDPI and/or the editor(s). MDPI and/or the editor(s) disclaim responsibility for any injury to people or property resulting from any ideas, methods, instructions or products referred to in the content. |
© 2026 by the authors. Licensee MDPI, Basel, Switzerland. This article is an open access article distributed under the terms and conditions of the Creative Commons Attribution (CC BY) license.